Abstract
This article focuses on the analysis and non-invasive online diagnostics of the operating condition of bearings integrated into three-phase squirrel cage induction motors, an electric machine that, due to its construction and operational characteristics, has a significant presence in the industry. The proposed signal-processing analysis tool is based on the non-invasive monitoring of stator electrical currents. To improve robustness in the diagnosis of bearing faults beyond the state-of-the-art, a hybrid approach was employed. The Short-Time Fourier Transform (STFT) and Park’s Vector Approach (PVA) were combined and applied to the stator currents. This hybridization allowed the benefits of both methods to be combined: (i) proper evaluation of time-varying phenomena and (ii) the ability to distinguish the type of fault affecting the bearing. To demonstrate the feasibility of the approach, comparisons were made between the proposed hybrid technique and both the STFT and the Extended Park’s Vector Approach (EPVA), which have been previously considered in the diagnosis of these and other induction motor faults. The validation of the proposed solution was conducted through computational simulations and laboratory tests, ultimately aiming to generate a database of results to inform future research in this area. To emulate bearing failures in an experimental context, artificial damage to bearing components was introduced.
1. Introduction
Induction motors (IMs), or asynchronous motors, are the most widely used motors in the industry due to their simplicity, robustness, low cost, and ease of maintenance [1]. Similar to any industrial or domestic machine, IMs are prone to failures throughout their lifespan. Comprising mechanical and electrical components, these motors are susceptible to a range of failures, which have been the focus of extensive research. Motor failures can result in unscheduled downtime, leading to potential safety risks and economic losses. Statistical studies indicate that bearing, stator, and rotor failures account for approximately 44%, 26%, and 8% of all possible failures in IMs, respectively [2]. Therefore, early diagnosis of IM failures is essential. To deal with such a challenge, diagnostic methods have been developed for each type of failure that these motors can experience.
The highest percentage of failures is concentrated in bearings, which are vital components in any rotating machine, and whose condition depends on their robustness and reliability. Bearings are subjected to continuous loads, stresses, challenging environmental conditions, and often improper handling, leading to different failure modes and even defects during manufacturing. The ISO-15243 standard specifically focuses on these failures, classifying them into six modes. One of the main causes of bearing failure is inadequate lubrication [3,4,5,6].
Fault diagnosis in IMs is carried out by analyzing various signals acquired from the motors, extracting their characteristics, and comparing them to normal operation. The most commonly used signals for this analysis include vibration, acoustic emission, motor currents, voltage, temperature, speed, magnetic flux, and thermal images [7,8]. Numerous studies have investigated bearing failures in electric machines, proposing various fault diagnostic techniques. Vibration signal analysis is common and effective for diagnosing mechanical faults, but its high cost of implementation and the need for direct contact with the motors limit its practical application [2,9,10]. Such limitations have generated interest in developing alternative diagnostic methods for equipment monitoring, especially in situations where conventional vibration monitoring methods are not feasible. For simplicity and economy, alternative techniques typically rely on a single parameter.
The literature in this field is extensive, with most studies focusing on analyzing one type of defect at a time. Bearing fault diagnostic methods are grouped according to their approach. Typically, these methods are grouped as conventional methods (vibration analysis, current, voltage, eddy currents, temperature, acoustic measurements, etc.), statistical methods (root mean square values, mean values, variance, skewness, kurtosis, and crest factor attributes), and methods based on new artificial intelligence technologies (machine learning algorithms, deep learning algorithms, data mining algorithms, and neural networks) [5]. There are known limitations for some of these approaches. Statistical methods imply historical knowledge about the monitored equipment, which is not always feasible from a practical standpoint. Although artificial intelligence methods are widely popular among the research community, their practical interest remains limited due to their complexity and challenging implementation.
This study focuses on the non-invasive analysis of bearing faults in IMs, emphasizing stator current analysis as an optimal method due to the valuable information it provides. Current signals are measured directly through the electrical system or inverters, enabling current-based data acquisition in most industrial environments.
2. Bearings
In electric machines, bearings ensure precise positioning of the rotor relative to the stator and are designed to handle pure radial, pure axial, or combined loads. Typically, these components consist of two concentric races or rings, one outer and one inner, with balls or rollers between them. The balls are uniformly separated by a cage that prevents direct contact [11,12].
Bearing Characteristic Frequencies
Generally, a failure only affects one component of the bearing: the inner race, the outer race, the cage, or the balls. As the failure progresses, it spreads to other components. Additionally, these failures can be described according to the failure mechanism, the location, or a combination of both. Indeed, each bearing component has a characteristic frequency. The energy associated with these frequencies will increase if any damage occurs in such bearing components. The frequencies are determined using the following equations [13,14,15]:
- Bearing outer race frequency [Hz]:
- Bearing inner race frequency [Hz]:
- Ball spin frequency [Hz]:
- Fundamental cage frequency [Hz]:
3. Materials and Methods
This section briefly describes the different equipment used in the test bench, characterizes the types of faults introduced into the bearings, and presents the theoretical basis of the methods and techniques used to analyze the stator current signal.
3.1. Equipment and Testbench
The test bench included essential components, such as a three-phase power supply, an autotransformer for a soft start of the 2.2 kW WEG squirrel-cage three-phase IM with a nominal speed of 1435 rpm and a nominal voltage of 400 V, supplied at 50 Hz, and the set of bearings with the faults to be analyzed. This motor was coupled to a hysteresis dynamometer, allowing for load variation. Additionally, the bench was equipped with the necessary instrumentation to collect data, such as current clamps, multimeters, a data acquisition board, and a computer for data acquisition and processing. Figure 1 shows the fully assembled test rig for stator current data collection and analysis.
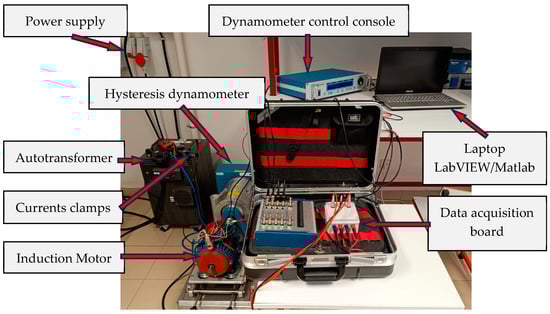
Figure 1.
Laboratory test bench.
Figure 2 presents a block diagram outlining the operation of the described system. To obtain the current signal, the currents from each phase were extracted using current clamps. These signals were then digitized through a National Instruments USB-6366 data acquisition board, which featured 8 analog inputs and 2 analog output channels. Subsequently, these signals were collected, processed, and analyzed on a computer using software, such as LabVIEW 2014 and MATLAB R2022b. The analysis techniques, applied through custom code, are further detailed in the following section.
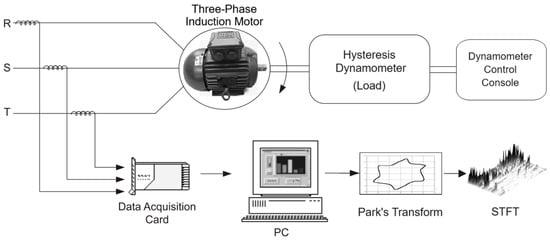
Figure 2.
Block diagram of the measurement configuration.
3.2. Characterisation of the Bearing Faults
The previously described motor uses two types of bearings: an SKF 6205-2Z on the non-drive-end and an SKF 6206-2Z on the drive-end, with the geometric characteristics detailed in Table 1.

Table 1.
Bearing dimensions.
There are various modes of bearing failure, commonly caused by fatigue, wear, inadequate lubrication, misalignment, overloads, and contamination. Induction motors supplied by inverters may also experience bearing failures due to the presence of currents induced by common-mode voltage and torque pulsations caused by low-frequency harmonics. These failures, known as Electric Discharge Machining (EDM), manifest on the bearing surfaces as pitting and fluting. Bearing currents are considered the primary cause of these damages, which eventually lead to premature bearing failure [16,17].
In this study, three different bearings were prepared. Two of them (the drive-end bearing and the non-drive-end bearing) had a Ø2 mm hole in their outer race. The third bearing had some localized damage caused by electrical discharge (ED) on both the outer and inner rings, representing the pitting of the bearings. The holes simulate localized defects, such as cracks or pits, that can form due to material fatigue or contamination. The pitting represents irregular wear or severe contact failures, such as those caused by contaminant particles trapped in the bearing or ED. Figure 3 shows two of the bearings used for this study.
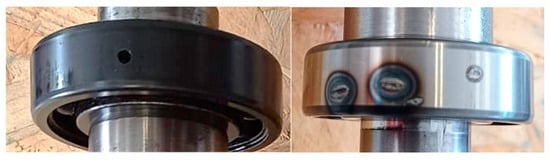
Figure 3.
Bearings with damage used in the experimental tests.
3.3. Diagnostic Techniques
For this study, the stator current signal was analyzed using EPVA, which is based on frequency analysis; STFT, which incorporates both time and frequency domains; and a hybrid approach that combines EPVA and STFT.
3.3.1. STFT Analysis of Current Signals
STFT is an extension of the Fourier transform for analyzing non-stationary signals. The signal is divided into small time windows, each analyzed using the Fourier transform of a function s(τ) over a real and symmetric window function w(τ), using (5) as follows [18,19]:
where s is the signal, w is the window function, and t and are the time and frequency parameters, respectively. The spectrogram, based on the STFT, is defined as the square of the STFT’s magnitude. It is a 3D plot showing the energy of the signal’s frequency content as it changes over time, as expressed by (6) [20]. Typically, the x-axis represents time, the y-axis represents frequency changes over time, and color variations indicate the amplitude of the frequency [21]. The temporal and frequency resolution of the spectrogram is limited by the Heisenberg–Gabor uncertainty principle, which states that infinite precision in both time and frequency is impossible [22].
Current spectra resulting from bearing damage can be detected due to the mechanical displacements caused by bearing faults, which produce radial movement between the rotor and the stator, altering the machine’s air gap [23]. As shown in [24,25], these variations generate spectral components in the stator line current, derived from (7).
where fs is the fundamental power frequency of the motor, fn represents the natural frequencies of the bearing components, which are a function of Equations (1)–(4), and k takes values of 1, 2, 3, ….
3.3.2. Extended Park’s Vector Approach (EPVA)
The EPVA method is based on the Park’s Vector Approach (PVA), which identifies a specific current pattern by transforming the three-phase stator currents (iA, iB, iC) into the equivalent currents in the d-q reference frame (iD, iQ). The Park’s vector components (iD, iQ) are calculated in relation to the phase variables (iA, iB, iC) using the following equations [26]:
Under ideal conditions, the three-phase currents produce a Park’s vector with the following components:
where denotes the maximum value of the supply phase current [A], refers to the angular supply frequency [rad/s], and denotes the time variable [s].
In abnormal operating conditions, Equations (10) and (11) are no longer valid, and the motor’s current spectrum will include frequencies other than the fundamental ones, due to frequencies and . In addition to the DC component, the Park’s vector components will also have an AC component. To identify these variations, the EPVA technique was developed, which discriminates information in the current modulus of the Park’s vector through spectral analysis of the AC level. EPVA combines simplicity with detailed insights in spectral analysis [24,27].
Considering these variations within the supply currents, the components of the Park’s vector of the supply current adopt a new structure, as indicated in the following equations:
where is the maximum value of the fundamental term of the motor supply current when there is a bearing fault [A], is the maximum value of the spectral component of the motor supply current associated with the frequency [A], is the maximum value of the spectral component of the motor supply current associated with the frequency [A], α is the initial phase of the fundamental term of the motor supply current [rad], is the initial phase of the spectral component of the motor supply current associated with the frequency [rad], is the initial phase of the spectral component of the motor supply current associated with the frequency [rad], and is the natural angular frequency [rad/s].
Thus, the modulus of the stator current Park’s vector is defined as follows:
The expression for the square of the Park’s vector magnitude has four terms: the first term is the dominant constant term, the next two terms are associated with fn (the product of the fundamental component’s amplitude and the defect’s spectral components), and the last term’s amplitude depends on the product of the fault-induced currents’ amplitudes. In the Park’s vector frequency spectral analysis, the spectrum components associated with bearing faults are visualized using the following expression:
where fn represents the natural frequencies of the bearing components, which are calculated using Equations (1)–(4), and k = 1, 2, 3, ….
4. Experimental Results
Tests were conducted at three load levels (no load, half load, and full load) for each fault condition. Two techniques (STFT and EPVA) were used, and a hybrid analysis was applied for more reliable results.
The main characteristic frequencies of the SKF 6205-2Z bearing are listed in Table 2, whereas those of the SKF 6206-2Z bearing are listed in Table 3. Figure 3 shows the STFT analysis applied to the outer ring hole condition, highlighting the frequencies and characteristics of the fault.
Table 2.
Frequency components of bearing SKF 6205-2Z, according to (1) and (7).
Table 3.
Frequency components of bearing SKF 6206-2Z, according to (1) and (7).
The results obtained for healthy state conditions are shown in Figure 4a. The results for the Ø2 mm hole condition in the SKF 6205-2Z bearing are presented in Figure 4b. The results for the Ø2 mm hole condition in the SKF 6206-2Z bearing are analyzed in Figure 4c. Since both faults were of the same type, the only difference lies in the bearing’s location and size.
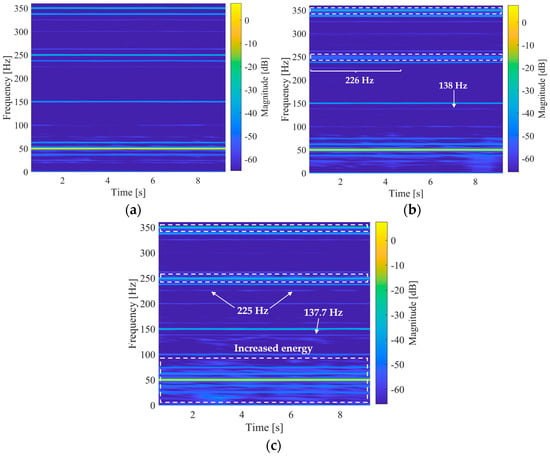
Figure 4.
The STFT spectrogram at half load: (a) healthy condition; (b) Ø2 mm hole in the outer race of bearing SKF 6205-2Z; and (c) Ø2 mm hole in the outer race of bearing SKF 6206-2Z.
The results indicate that the fault produces similar signatures in both cases, with a more noticeable increase in energy in the bearing on the IM drive end, as shown in Figure 4c. Additionally, an increase in the energy of sidebands around 250 Hz and 350 Hz was observed.
Figure 5b shows the results of the pitting fault, where a noticeable increase in energy was observed in the frequencies between 0 and 150 Hz, with reference to the healthy condition shown in Figure 5a. Because the pitting is present on both bearing rings and is unevenly distributed among the bearing rings, the frequencies related to the fault cannot be clearly identified. The other frequencies remain the same as in the healthy condition.
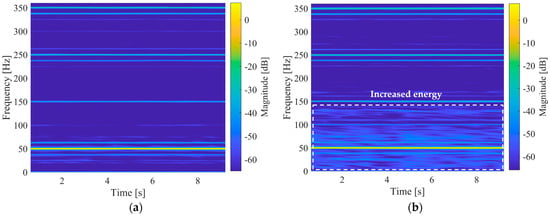
Figure 5.
The STFT spectrogram at half load: (a) healthy condition and (b) pitting on the outer and inner rings of bearing SKF 6205-2Z.
Figure 6 shows the analysis using the EPVA technique. In Figure 6a, the operation under healthy conditions is presented, whereas Figure 6b provides the results for a Ø2 mm hole fault in the bearing’s outer race. The harmonics related to the fault are indicated both in the spectrum and in Table 4.
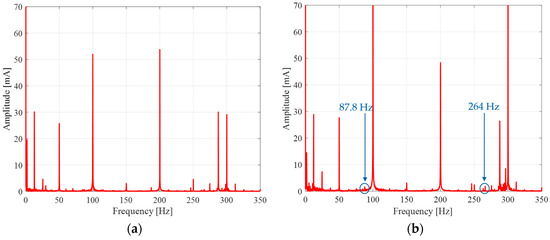
Figure 6.
EPVA analysis at half load: (a) healthy condition and (b) Ø2 mm hole in the outer race (SKF 6205-2Z).
Table 4.
Frequency components of bearing SKF 6205-2Z, according to (1) and (15).
A slight increase in energy was observed across all frequencies in the spectrum, particularly in the fault-related harmonics.
The faults associated with pitting exhibited similar characteristics in both STFT and EPVA analyses. Figure 7 shows the analysis using EPVA, where a general increase in energy was observed in the 0–150 Hz range. Within this range, it is difficult to clearly identify the frequency peaks associated with the fault, which are indicated in the spectrum.
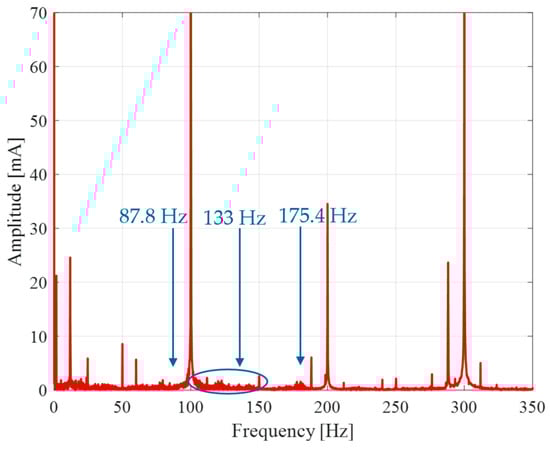
Figure 7.
EPVA analysis at half load, with pitting on the outer and inner ring (SKF 6205-2Z).
Finally, the combination of these two methods was performed, showing the spectrogram of the Park’s vector component’s magnitude. Figure 8a presents the spectrogram under healthy conditions, where the expected harmonic components are evident and time variance is limited. In the first analyzed fault condition, Figure 8b, there was an increase in energy at the 100 Hz and 300 Hz harmonics, along with a clear increase in the sidebands around 300 Hz.
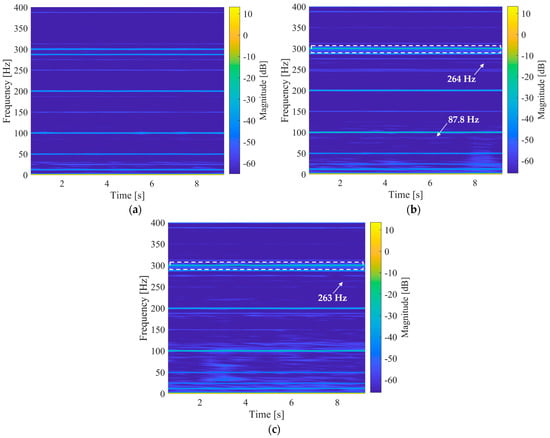
Figure 8.
Hybrid analysis spectrogram obtained at half load: (a) healthy condition; (b) Ø2 mm hole in the outer race of bearing SKF 6205-2Z; and (c) Ø2 mm hole in the outer race of bearing SKF 6206-2Z.
Similar to the EPVA, increases in the fault frequencies of 87.8 Hz and 264 Hz were observed here. Also, time variance arose for harmonics below 50 Hz. Figure 8c shows the second fault, where the energy increase characteristics follow the same pattern as the first fault. However, since the damaged bearing was located on the drive end, these energy increases and sidebands around 100 Hz and 300 Hz were more noticeable.
Figure 9b shows the spectrogram for the pitting fault, whose behavior remained consistent across all applied methods. This fault differed from the ring hole faults by exhibiting a general increase in energy in the 0–150 Hz range. Such a trend suggests that it is likely that both bearing rings were compromised. In turn, the time variance associated with the 0–150 Hz range suggests uneven distribution of the damage over the bearing rings. In this scenario, an increase in energy at the 100 Hz and 300 Hz harmonics was also observed.
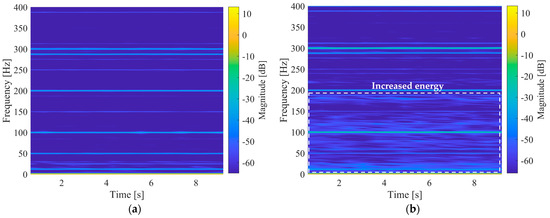
Figure 9.
Hybrid analysis spectrogram obtained at half load: (a) healthy condition and (b) pitting on the outer and inner rings of the SKF 6205-2Z bearing.
Employing the hybrid method proposed in this paper, Figure 10 compares the amplitudes of the natural frequency of the outer ring (≈88 Hz) as a function of the load level for each type of fault studied in this paper. As shown in Figure 10, the most prominent symptoms of the faults were obtained in the tests at half load.
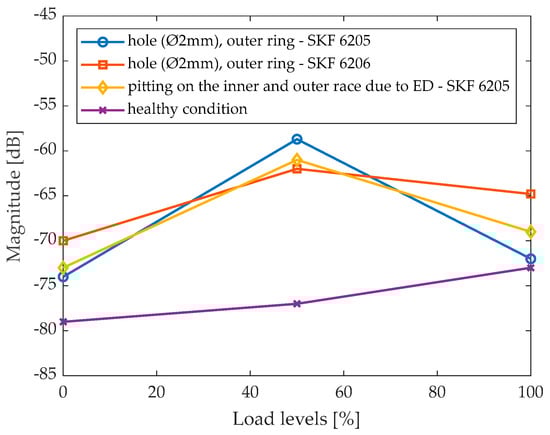
Figure 10.
Magnitude of the first-order fault harmonic as a function of the load level.
5. Discussion
In this study, three types of faults were evaluated: two localized faults and one distributed fault, using the STFT and EPVA methods. Finally, these two methods were combined, and the obtained results were analyzed and compared using different studies based on the same analytical techniques.
Regarding fault severity, a Ø2 mm hole is classified within a moderate or medium range. Many studies start the analysis with holes of Ø1.5 mm and Ø2 mm and progressively increase to Ø4 mm, Ø5 mm, Ø6 mm, and Ø8 mm. The EPVA method applied in [13] was effective in detecting characteristic components visible with a Ø2 mm hole in the outer ring of the bearing. In the present study, it was validated that EPVA was effective in identifying this type of fault in both the drive-end bearing and the non-drive-end bearing.
On the other hand, the analysis using STFT yielded similar results to those obtained in studies [28,29]. In the spectrogram analysis for an IM with a mechanical bearing fault, it was observed that the energy significantly decreased at frequencies of 25 Hz, 100 Hz, and 125 Hz, whereas frequencies of 150 Hz, 350 Hz, and 450 Hz showed a noticeable increase in energy compared to the normal state [28]. In this study, an increase in energy was primarily observed in the harmonics of 250 Hz and 350 Hz, and additionally, an increase in energy associated with sidebands around these frequencies was found.
With the hybrid method, the effect of increased energy and sidebands was particularly emphasized at a frequency of 300 Hz, which corresponds to 350 Hz in the normal stator current analysis using STFT. Finally, in [29], an analysis of an outer ring fault was conducted at three load levels (0%, 50%, and 100%), where the same pattern of energy increase was evident. Although that study focused directly on analyzing the behavior of the natural frequency of the outer ring, the highest energy increases were obtained in the analysis of a medium fault compared to a severe fault. In contrast to the present study, the most evident results in energy increases and changes were observed when the motor operated under half-load conditions.
In inverter-fed induction motors, additional spectral components are introduced, mainly depending on the switching frequency of the inverter semiconductors. Modern inverters operate at sufficiently high switching frequencies, typically between 2 and 4 kHz or even higher, as noted in [17]. Since both the EPVA and STFT methods employ spectral analysis, focusing on frequency components below 1 kHz to diagnose bearing conditions, it is unlikely that their performance would be compromised by these harmonics. Given that the proposed method is a hybrid of EPVA and STFT, it is reasonable to state that the proposed method should be able to conduct effective diagnosis in the presence of an inverter system for the generality of the operating conditions. Still, very particular operating conditions may challenge the effectiveness of the method. When the motor operates close to nominal speed, the inverter may function in the overmodulation region, leading to the reappearance of low-frequency harmonics in the inverter output voltage, of the order of 6k ± 1 (k = 1, 2, 3, …, n), which cause torque pulsations [16]. The study detailed in [30] confirms the presence of these low-frequency harmonics, which are related to the modulation strategy used to control the inverter and pose significant challenges in detecting bearing fault frequencies. Therefore, in addition to the application of STFT, a maximum localization algorithm (MLA) is introduced to enhance the clarity of the time-frequency spectrum of the stator current.
6. Conclusions
This study contributes to the detection of bearing faults in electric motors using a non-invasive approach, overcoming the limitations of traditional methods for certain applications. Fault detection using the stator current signal was conducted by applying the STFT and EPVA techniques, which are based on frequency domain analysis for EPVA and time-frequency analysis for STFT. To combine the benefits of both techniques, a hybrid approach was proposed in this study. It takes advantage of the complete information from the three supply currents provided by the EPVA and the frequency-time analysis of the STFT.
The analyzed faults, classified as moderate or medium, showed an increase in energy at the natural frequency of 88 Hz in the STFT analysis, as well as at low frequencies and bandwidth increases around the 250 Hz and 350 Hz harmonics. The EPVA showed small energy peaks at the 88 Hz frequency, although they were less perceptible. The hybrid method was effective when the EPVA provided good frequency information, making it clearer in this study to observe energy increases with the hybrid method than with the EPVA alone, along with bandwidth increases in certain harmonics, such as the 300 Hz harmonic.
This research supports previous studies based on stator current analysis, and by validating good results with these techniques, the next step will be to generate a database to incorporate new analysis and fault detection techniques using artificial intelligence.
Author Contributions
Conceptualization, J.B., F.B. and A.J.M.C.; methodology, J.B., F.B. and A.J.M.C.; software, J.B., F.B. and A.J.M.C.; validation, J.B., F.B. and A.J.M.C.; formal analysis, J.B., F.B. and A.J.M.C.; investigation, J.B., F.B. and A.J.M.C.; resources, A.J.M.C.; data curation, J.B. and F.B.; writing—original draft preparation, J.B.; writing—review and editing, F.B. and A.J.M.C.; visualization, J.B., F.B. and A.J.M.C.; supervision, A.J.M.C.; project administration, A.J.M.C.; funding acquisition, A.J.M.C. All authors have read and agreed to the published version of the manuscript.
Funding
This work was supported by the Portuguese Foundation for Science and Technology (FCT) under Projects UIDB/04131/2020 and UIDP/04131/2020.
Institutional Review Board Statement
Not applicable.
Informed Consent Statement
Not applicable.
Data Availability Statement
Data are contained within the article.
Conflicts of Interest
The authors declare no conflicts of interest.
References
- Wildi, T. Electrical Machines, Drives, and Power Systems, 6th ed.; Pearson Education: Hoboken, NJ, USA, 2006. [Google Scholar]
- Sun, M.; Wang, H.; Liu, P.; Long, Z.; Yang, J.; Huang, S. A Novel Data-Driven Mechanical Fault Diagnosis Method for Induction Motors Using Stator Current Signals. IEEE Trans. Transp. Electrif. 2023, 9, 347–358. [Google Scholar] [CrossRef]
- Das, A.; Ray, S. A Review on Diagnostic Techniques of Bearing Fault and its modeling in Induction Motor. In Proceedings of the 2020 IEEE Calcutta Conference (CALCON), Kolkata, India, 28–29 February 2020; IEEE: Piscataway, NJ, USA, 2020; pp. 502–505. [Google Scholar] [CrossRef]
- Díaz-Saldaña, G.; Cureño-Osornio, J.; Zamudio-Ramírez, I.; Osornio-Ríos, R.A.; Dunai, L.; Sava, L.; Antonino-Daviu, J.A. Methodology for the Detection of Contamination and Gradual Outer Race Faults in Bearings by Fusion of Statistical Vibration–Current Features and SVM Classifier. Appl. Sci. 2024, 14, 5310. [Google Scholar] [CrossRef]
- Khan, M.A.; Asad, B.; Kudelina, K.; Vaimann, T.; Kallaste, A. The Bearing Faults Detection Methods for Electrical Machines—The State of the Art. Energies 2022, 16, 296. [Google Scholar] [CrossRef]
- ISO 15243:2017; Rolling Bearings—Damage and Failures—Terms, Characteristics and Causes. ISO: Geneva, Switzerland, 2017. Available online: https://standards.iteh.ai/catalog/standards/sist/80beed0a-2220-48e9-b6ad-a64ac28c7266/iso-15243-2017 (accessed on 28 February 2024).
- Cardoso, A.J.M. Diagnóstico de Avarias em Motores de Indução Trifásicos; Coimbra Editora: Coimbra, Portugal, 1991. [Google Scholar]
- Toma, R.N.; Kim, C.-H.; Kim, J.-M. Bearing Fault Classification Using Ensemble Empirical Mode Decomposition and Convolutional Neural Network. Electronics 2021, 10, 1248. [Google Scholar] [CrossRef]
- Guo, L.; Lei, Y.; Xing, S.; Yan, T.; Li, N. Deep Convolutional Transfer Learning Network: A New Method for Intelligent Fault Diagnosis of Machines with Unlabeled Data. IEEE Trans. Ind. Electron. 2019, 66, 7316–7325. [Google Scholar] [CrossRef]
- Chen, X.; Xu, W.; Liu, Y.; Islam, M.R. Bearing Corrosion Failure Diagnosis of Doubly Fed Induction Generator in Wind Turbines Based on Stator Current Analysis. IEEE Trans. Ind. Electron. 2020, 67, 3419–3430. [Google Scholar] [CrossRef]
- Ibrahim, A.; Bonnardot, F.; El Badaoui, M.; Guillet, F. Detection of Bearing Damage Using Stator Current, and Voltage to Cancel Electrical Noise. EURASIP J. Adv. Signal Process. 2011, 2011, 235236. [Google Scholar] [CrossRef][Green Version]
- Budynas, R.G.; Nisbett, J.K.; Shigley, J.E. Shigley’s Mechanical Engineering Design, 10th ed.; Mcgraw-Hill Series in Mechanical Engineering; McGraw-Hill Education: New York, NY, USA, 2015. [Google Scholar]
- Silva, J.L.H.; Cardoso, A.J.M. Bearing failures diagnosis in three-phase induction motors by extended Park’s vector approach. In Proceedings of the 31st Annual Conference of IEEE Industrial Electronics Society, IECON 2005, Raleigh, NC, USA, 6–10 November 2005; IEEE: Piscataway, NJ, USA, 2005; p. 6. [Google Scholar] [CrossRef]
- Harris, T.A.; Kotzalas, M.N. Rolling Bearing Analysis: Advanced Concepts of Bearing Technology, 5th ed.; CRC: London, UK; Taylor & Francis: New York, NY, USA, 2006. [Google Scholar]
- Randall, R.B.; Antoni, J. Rolling element bearing diagnostics—A tutorial. Mech. Syst. Signal Process. 2011, 25, 485–520. [Google Scholar] [CrossRef]
- Araujo, R.D.S.; De Paula, H.; Rodrigues, R.D.A.; Baccarini, L.M.R.; Rocha, A.V. Premature Wear and Recurring Bearing Failures in an Inverter-Driven Induction Motor—Part I: Investigation of the Problem. IEEE Trans. Ind. Appl. 2015, 51, 4861–4867. [Google Scholar] [CrossRef]
- Singh, G.; Kumar, T.C.A.; Naikan, V.N.A. A non intrusive methodology for bearing current detection in PWM inverter fed induction motor drive. In Proceedings of the 2018 International Conference on Power, Instrumentation, Control and Computing (PICC), Thrissur, India, 18–20 January 2018; IEEE: Piscataway, NJ, USA, 2018; pp. 1–6. [Google Scholar] [CrossRef]
- Cohen, L. Timne-Frequency Analysis; Prentice Hall PTR: Hoboken, NJ, USA, 1995. [Google Scholar]
- Satpathi, K.; Yeap, Y.M.; Ukil, A.; Geddada, N. Short-Time Fourier Transform Based Transient Analysis of VSC Interfaced Point-to-Point DC System. IEEE Trans. Ind. Electron. 2018, 65, 4080–4091. [Google Scholar] [CrossRef]
- Pietrzak, P.; Wolkiewicz, M. Stator Phase Current STFT analysis for the PMSM Stator Winding Fault Diagnosis. In Proceedings of the 2022 International Symposium on Power Electronics, Electrical Drives, Automation and Motion (SPEEDAM), Sorrento, Italy, 22–24 June 2022; IEEE: Piscataway, NJ, USA, 2022; pp. 808–813. [Google Scholar] [CrossRef]
- Wen, L.; Gao, L.; Li, X.; Wang, L.; Zhu, J. A Jointed Signal Analysis and Convolutional Neural Network Method for Fault Diagnosis. Procedia CIRP 2018, 72, 1084–1087. [Google Scholar] [CrossRef]
- Flandrin, P. Time-Frequency/Time-Scale Analysis; Academic Press: Cambridge, MA, USA, 1998. [Google Scholar]
- Benbouzid, M.E.H.; Kliman, G.B. What stator current processing-based technique to use for induction motor rotor faults diagnosis? IEEE Trans. Energy Convers. 2003, 18, 238–244. [Google Scholar] [CrossRef]
- Silva, J.L.H. Diagnóstico e Análise de Avarias nos Rolamentos de Motores de Indução Trifásicos. Ph.D. Thesis, Universidade de Coimbra, Coimbra, Portugal, 2005. [Google Scholar]
- Boudinar, A.H.; Benouzza, N.; Bendiabdellah, A.; Khodja, M.-E.-A. Induction Motor Bearing Fault Analysis Using a Root-MUSIC Method. IEEE Trans. Ind. Appl. 2016, 52, 3851–3860. [Google Scholar] [CrossRef]
- Cruz, S.M.A.; Marques Cardoso, A.J. Rotor Cage Fault Diagnosis in Three-Phase Induction Motors by Extended Park’s Vector Approach. Electr. Mach. Power Syst. 2000, 28, 289–299. [Google Scholar] [CrossRef]
- Cruz, S.M.A.; Cardoso, A.J.M. Stator winding fault diagnosis in three-phase synchronous and asynchronous motors, by the extended Park’s vector approach. IEEE Trans. Ind. Appl. 2001, 37, 1227–1233. [Google Scholar] [CrossRef]
- Lopez-Ramirez, M.; Romero-Troncoso, R.J.; Morinigo-Sotelo, D.; Duque-Perez, O.; Ledesma-Carrillo, L.M.; Camarena-Martinez, D.; Garcia-Perez, A. Detection and diagnosis of lubrication and faults in bearing on induction motors through STFT. In Proceedings of the 2016 International Conference on Electronics, Communications and Computers (CONIELECOMP), Cholula, Mexico, 24–26 February 2016; IEEE: Piscataway, NJ, USA, 2016; pp. 13–18. [Google Scholar] [CrossRef]
- Haddad, R.Z.; Lopez, C.A.; Pons-Llinares, J.; Antonino-Daviu, J.; Strangas, E.G. Outer race bearing fault detection in induction machines using stator current signals. In Proceedings of the 2015 IEEE 13th International Conference on Industrial Informatics (INDIN), Cambridge, UK, 22–24 July 2015; IEEE: Piscataway, NJ, USA, 2015; pp. 801–808. [Google Scholar] [CrossRef]
- Khodja, M.-E.-A.; Aimer, A.F.; Boudinar, A.H.; Benouzza, N.; Bendiabdellah, A. Bearing Fault Diagnosis of a PWM Inverter Fed-Induction Motor Using an Improved Short Time Fourier Transform. J. Electr. Eng. Technol. 2019, 14, 1201–1210. [Google Scholar] [CrossRef]


Disclaimer/Publisher’s Note: The statements, opinions and data contained in all publications are solely those of the individual author(s) and contributor(s) and not of MDPI and/or the editor(s). MDPI and/or the editor(s) disclaim responsibility for any injury to people or property resulting from any ideas, methods, instructions or products referred to in the content. |
© 2024 by the authors. Licensee MDPI, Basel, Switzerland. This article is an open access article distributed under the terms and conditions of the Creative Commons Attribution (CC BY) license (https://creativecommons.org/licenses/by/4.0/).