Proceeding Paper

Comparative Analysis of Field Oriented Control and Direct Torque Control Through Simulation in MATLAB Simulink for an Automotive Drive Motor †

Department of Power Electronics and E-Drives, Széchenyi István University, Egyetem tér 1, H-9026 Győr, Hungary
*
Author to whom correspondence should be addressed.
Presented at the Sustainable Mobility and Transportation Symposium 2024, Győr, Hungary, 14–16 October 2024.
Eng. Proc. 2024, 79(1), 33; https://doi.org/10.3390/engproc2024079033
Published: 5 November 2024
(This article belongs to the Proceedings of The Sustainable Mobility and Transportation Symposium 2024)

Abstract

:
Field oriented control (FOC) and direct torque control (DTC) are two strategies used in electric motor control, both with their respective advantages and disadvantages. This paper presents a comparative analysis of these two control methodologies, focusing on their application and performance within a MATLAB Simulink (R2024b) environment for an automotive Permanent Magnet Synchronous Motor (PMSM) drive. The models are created with a focus on realistic drive and test parameters. The simulation results are analyzed to highlight the strengths and weaknesses of each strategy and identify use cases where one method may be superior to the other. In conclusion, this paper contributes to the understanding of FOC and DTC by offering a systematic comparison of their features, performance characteristics, and application scenarios for automotive use.

1. Introduction

The ever-increasing supply and demand for automotive drives is unquestionable today [1]. Additionally, the demand for more efficient and longer-range cars drives manufacturers to use PMSMs in their drivetrains to use the onboard batteries as best as possible for a longer range with the same battery capacity [2]. The efficiency of the whole vehicle can, however, be influenced by many other factors, such as car design with a better drag coefficient, better wheels, or the use of an efficient motor control strategy.
FOC and DTC are among the most broadly used and researched types of controls for PMSM applications [3,4,5]. The concept of FOC was first introduced by Felix Blaschke [6] for induction machines, but it is also applicable in the case of PMSMs. DTC was also introduced shortly after FOC by Takahashi and Noguchi [7], and first commercialized by ABB [8,9], based on the knowledge of FOC and providing an alternative to it, stating that DTC’s fast reaction time and lower complexity could be advantageous in some applications, also mentioning traction drives as an example.
The use of both of these methods can be justified for automotive traction applications because of their respective advantages. This paper presents specific applications simulating a Nissan Leaf PMSM. This car was the world’s most popular electric vehicle until 2020 [10] and serves as a good example to test the simulation.
In the Methods and Materials section, the mathematical and theoretical models for FOC and DTC will be presented in detail, highlighting the similarities and differences between the two.
In the Results section, the implementation of the two different simulations in MATLAB/Simulink will be described and compared. Basic testing of the models is presented to assure proof of concept.
In the Discussion section, the results will be reviewed and analyzed to compare the details of the two control methods. Automotive-related topics will be highlighted.
In the Conclusions section, a short summary is presented on the results and the effects of a use case in an automotive application.

2. Materials and Methods

The basic physical and control background will be described in this section for both DTC and FOC. All the governing equations and the controls that are necessary to realize these in a simulation environment will be presented.

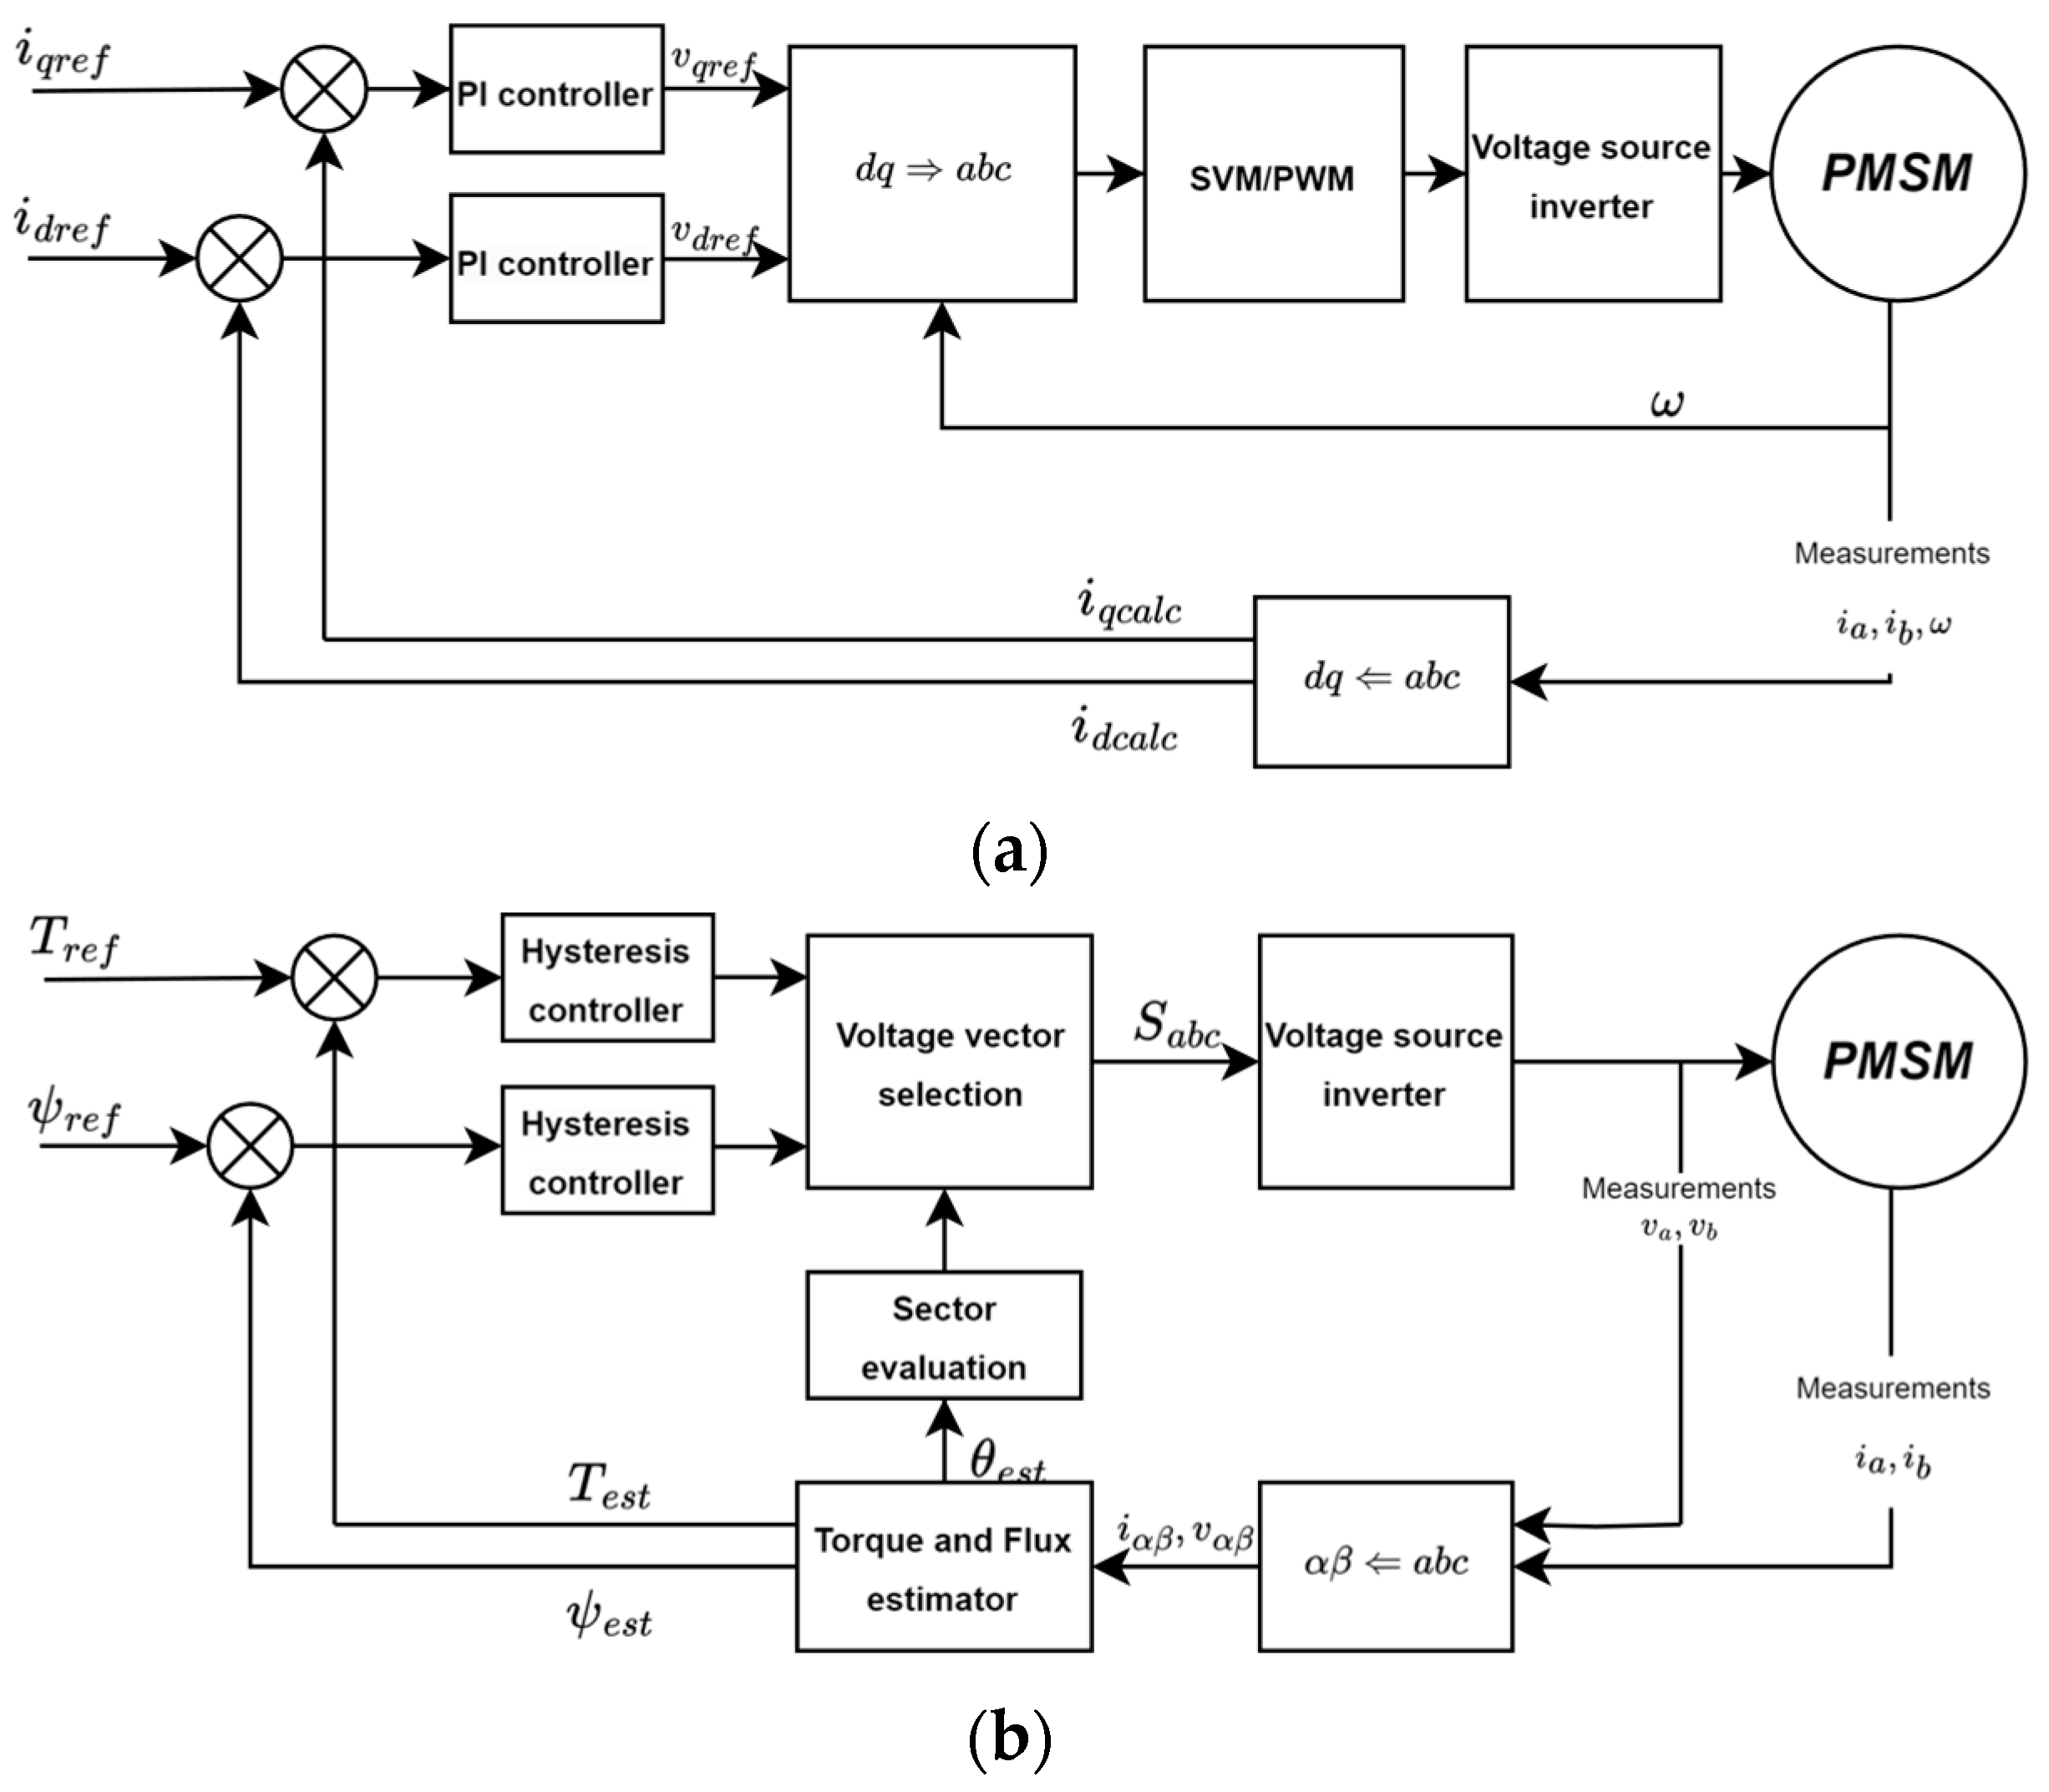
2.1. The Background Used for FOC

The model for FOC uses the logic displayed in Figure 1a. The governing equations used to simulate the motor are the following Equations (1)–(5) [11]:
d i d d t = v d R s i d + ω e L q i q L d ,
d i q d t = v q R s i q ω e L d i d ω e λ m L q ,
T e = 3 2 P λ m i q + L d L q i d i q ,
d ω m d t = T e T L J ,
ω e = P ω m ,
where Lq and Ld are the quadrature and direct inductances of the rotor, respectively, λm is the flux linkage, iq and id are the quadrature and direct currents of the stator respectively, vq and vd are the stator quadrature and direct voltages, RS is the stator resistance, ωe is the electrical angular velocity of the stator field, ωm is the mechanical angular velocity of the rotor, P is the number of pole pairs, and Te and TL are the generated torque and the load torque. Since this is a general model of the PMSM these equations also apply for the DTC.
Based on Figure 1a, the motor takes inputs from the Voltage Source inverter (VSI). The a, b currents are measured along with the position and angular velocity of the rotor. These are required for the control with FOC.
The measured values are used to estimate the required input voltage to achieve the desired torque. The equations used for the voltage calculation in the controller are the following (6) and (7):
v d = R s i d + L d d i d d t ω e L q i q ,
v q = R s i q + L q d i q d t + ω e L d i d + λ m .
As is visible from Equations (6) and (7), the model needs values in the direct-quadrature coordinate system, which is a rotating reference frame fixed to the rotor. This implies that a coordinate transformation is needed. These transformations, described in short, are the following [12]:
Transformation from abc to αβ (both stator-based systems) (8) and (9):
i α = 2 3 i a 1 2 i b 1 2 i c ,
i β = 2 3 3 2 i b 3 2 i c ,
where iα, iβ are the stator currents in the αβ system and ia, ib, ic are the stator currents in the abc system.
The transformation from αβ to dq system (from stator-based to rotor-based) (10) and (11):
i d = i α cos θ + i β sin θ ,
i q = i α sin θ + i β cos θ ,
where id, iq are the stator currents in the rotor-based reference frame, and θ is the angle between the stationary reference frame and the rotating reference frame.
Understanding these transformations makes it clear why the position of the rotor is necessary for FOC.
The controllers for both currents are simple PI controllers. After having the values of the voltages in the dq system, they need to be converted back so the Space Vector Pulse Width Modulator (SVPWM) can be fed with these inputs. The resulting control signal is then fed to the Voltage Source Inverter (VSI) that drives the PMSM.
FOC strives for a zero current in the direct orientation, while the quadrature current controls the magnitude of the torque in the normal operating region.

2.2. The Model for DTC

The model for FOC uses the logic displayed in Figure 1b. The governing equations used to simulate the motor are the same as for the case with FOC, i.e., (1)–(5).
Based on Figure 1b, the motor takes inputs from the VSI These voltages are measured for the model along with the a, b currents. These are required for the DTC control.
The equations used in the estimator to calculate the torque and the flux of the motor from the measured voltages and currents are the following (8)–(12):
d ψ α d t = v α R s i α ,
d ψ β d t = v β R s i β ,
ψ s = ψ α 2 + ψ β 2 ,
θ = tan 1 ψ β ψ α ,
T e = 3 2 P i α ψ β i β ψ α ,
where ψα and ψβ are the α and β components of the stator flux, vα and vβ are the α and β the stator voltages in the stator stationary system, iα and iβ are the stator currents in the same system, ψs is the stator flux, and θ is the angle of stator flux.
It is clear from the equations and also from the model in Figure 1 that a coordinate transformation is necessary, from the abc system to αβ. Since these are both in the stator fixed reference frame, no inputs about the rotor position are needed.
The results from Equations (8)–(12) are used to estimate the current torque and flux of the machine. These serve as an input to the hysteresis controllers, which evaluate if the torque and flux delivered at a given time are sufficient. The last input for the voltage vector selection is the sector information, which can be determined by the angle of the stator flux (θ). This evaluation is depicted in Figure 2, e.g., Sector 1 (S1) ranges from −30° to +30°. With the three inputs, the used voltage vector is determined by the logic displayed in Table 1. These voltage vectors can be used to determine the switch positions in the VSI.

2.3. Comparison of the Models

2.3.1. Similarities

  • The control method used in both cases is torque reference-based. This type of control represents the use in an automotive traction motor most accurately. Drivers control the speed of a vehicle by pressing on the accelerator pedal, thereby demanding torque from the drive. The desired end result is speed, but that is controlled by the driver as an external loop in the system.
  • Both models use the same VSI and the PMSM. Motor data can be found in Table 2.
  • Both rely on coordinate transformation.

2.3.2. Differences

  • FOC utilizes PWM to create the desired voltage vector, DTC does not have one in the original concept.
  • FOC thereby also has a constant switching frequency, whereas DTCs change depending on the state of the hysteresis controllers.
  • FOC has coordinate transformations from abc to αβ to dq, which is needed for the control of the current, whereas DTC has only an abc to αβ conversion.
  • FOC needs position information to carry out the dq transformation; this is solved by a sensor in most cases, whereas DTC does not require this.

3. Results

Implementing the described models in MATLAB Simulink, a comparison can be made. The models were made based on [14]. In this specific case, the comparison serves as a proof of concept. Both models will be tested with the same input to evaluate if they are suitable for use in an automotive drive.
Assuming the data from the Nissan Leaf (weight ca. 1686 kg, transmission ratio 4.35:1, wheel size 205/55R16) and the highest Worldwide Harmonized Light Vehicle Test (WLTP) acceleration demand of 1.666 m/s2, the maximum torque should be 200 Nm.
In the first test, the reference torque has a maximum of 200 Nm. The response from both models is displayed in Figure 3a. Both DTC and FOC follow the reference signal very accurately, so much so that they are within the linewidth of the reference. A magnified view can be seen in Figure 3b to depict the differences more accurately. This is a detail showing a corner point to showcase the accuracy and also the speed. The responses can also be seen in detail in case of a settled reference.
The second test reference with faster transitions is shown in Figure 3c. This also shows accurate reference tracking from both methods. A detail from a similar corner can be seen in Figure 3d.

4. Discussion

In this section, a detailed analysis of the results will be presented focusing on the strengths and weaknesses of FOC and DTC, and the application in an automotive drive.
The first test was chosen to show a demand in the case of standardized testing such as the WLTP. This is to underline the application. The rate of change in the reference was based on a human driver.
The generalized view from Figure 3a shows that both FOC and DTC are capable of following the reference accurately and rapidly. This result can be analyzed further with the details in Figure 3b, where it is visible that the DTC is lagging due to a built-in simulated sampling time. This is contrary to the original concept of a fast response, but FOC has no such delay. What causes DTC to be fast is the reduced amount of calculation demand, but this is not implemented in this model. The accuracy of the two controls is similar; both are within ±1 Nm of the reference signal, which is 0.5%.
The results from an automotive user’s point-of-view are not discernable.
The second test was chosen to show dynamic response. This is a response to a 100 Nm step and a slope similar to the first test. Both control methods follow the reference accurately, with overshoots for short periods from FOC. These are more prominently visible in the detail view; the magnitude is 6% (106 Nm with 100 Nm reference) and the duration is less than a millisecond. The settled signals show similar properties as with the first test, i.e., ±0.5% deviation.
From a driver’s perspective in a car, these deviations are practically unnoticeable.

5. Conclusions

According to the two tests carried out on the two control methods used for an automotive traction drive, it can be concluded that, although there are differences between them, and the characteristic properties of the methods can be observed, from a car driver’s perspective, there is practically no difference between the two.
The perspective of the driver is far from the only point of view that can be taken into account when designing a control for an electric traction drive, but it is a very important one. It can be stated that from a driver’s perspective, the two are nearly identical.

Author Contributions

Conceptualization, M.G.S.; methodology, M.G.S.; investigation, M.G.S.; writing—original draft preparation, M.G.S.; writing—review and editing, M.G.S.; supervision, D.F. All authors have read and agreed to the published version of the manuscript.

Funding

No specific funding was provided for this research.

Institutional Review Board Statement

Not applicable.

Informed Consent Statement

Not applicable.

Data Availability Statement

The data not available in this study are available from the corresponding author upon reasonable request.

Conflicts of Interest

All authors declare no conflicts of interest.

References

  1. Drive to Electrify. Nat. Clim. Chang. 2024, 14, 299. [CrossRef]
  2. Machhour, Z.; Mrabet, M.E.; Mekrini, Z.; Boulaala, M. Electric Motors and Control Strategies for Electric Vehicles: A Review. In Proceedings of the International Conference on Advanced Intelligent Systems for Sustainable Development, AI2SD 2022; Kacprzyk, J., Ezziyyani, M., Balas, V.E., Eds.; Lecture Notes in Networks and Systems; Springer: Cham, Switzerland, 2023; Volume 714, pp. 293–301. [Google Scholar]
  3. Kakodia, S.K.; Panda, A.K.; Dyanamina, G. Comparative Analysis of Speed Control Methods for PMSM Drive Fed Electrical Vehicle. In Proceedings of Flexible Electronics for Electric Vehicles; Dwivedi, S., Singh, S., Tiwari, M., Shrivastava, A., Eds.; Lecture Notes in Electrical Engineering; Springer: Singapore, 2023; Volume 863, pp. 313–321. [Google Scholar]
  4. Biyani, V.; Jinesh, R.; Tharani Esvar, T.A.; Sithartha Sourya, V.S.; Pinkymol, K.P. Vector Control Implementation in PMSM Motor Drive for Electric-Vehicle Application. In Proceedings of the 4th International Conference on Energy, Power, and Environment (ICEPE), Shillong, India, 29 April–1 May 2022; pp. 1–8. [Google Scholar] [CrossRef]
  5. Ramesh, P.; Umavathi, M.; Bharatiraja, C.; Ramanathan, G.; Athikkal, S. Development of a PMSM Motor Field-Oriented Control Algorithm for Electrical Vehicles. Mater. Today Proc. 2022, 65, 176–187. [Google Scholar] [CrossRef]
  6. Blaschke, F. Das Verfahren Der Feldorientierung Zur Regelung Der Drehfeldmaschine. Ph.D. Thesis, Eindhoven University of Technology, Eindhoven, The Netherlands, 1973. [Google Scholar]
  7. Takahashi, I.; Noguchi, T. A New Quick-Response and High-Efficiency Control Strategy of an Induction Motor. IEEE Trans. Ind. Appl. 1986, IA-22, 820–827. [Google Scholar] [CrossRef]
  8. Tiitinen, P.; Surandra, M. The next Generation Motor Control Method, DTC Direct Torque Control. In Proceedings of the International Conference on Power Electronics, Drives and Energy Systems for Industrial Growth, New Delhi, India, 8–11 January 1996; Volume 1, pp. 37–43. [Google Scholar]
  9. Tiitinen, P.; Pohjalainen, P.; Lalu, J. The Next Generation Motor Control Method: Direct Torque Control (DTC). EPE J. 1995, 5, 14–18. [Google Scholar] [CrossRef]
  10. Europe Nissan News. Available online: https://europe.nissannews.com/en-GB/releases/release-a9f393adfcdb4c875b17ca02b001a9dc-nissan-brings-excitement-from-the-road-to-the-track-with-leaf-nismo-rc-unleashed-for-the-first-time-in-europe?selectedTabId=releases (accessed on 4 July 2024).
  11. Mathworks. Available online: https://se.mathworks.com/help/sps/powersys/ref/permanentmagnetsynchronousmachine.html (accessed on 4 July 2024).
  12. Park, R.H. Two-Reaction Theory of Synchronous Machines Generalized Method of Analysis-Part I. Trans. Am. Inst. Electr. Eng. 1929, 48, 716–727. [Google Scholar] [CrossRef]
  13. Oak Ridge National Laboratory Nissan Leaf Disassembly Data. Available online: https://openinverter.org/wiki/images/5/52/Em61_motor.png (accessed on 4 July 2024).
  14. Rodríguez, J.; Kennel, R.M.; Espinoza, J.R.; Trincado, M.; Silva, C.A.; Rojas, C.A. High-Performance Control Strategies for Electrical Drives: An Experimental Assessment. IEEE Trans. Ind. Electron. 2012, 59, 812–820. [Google Scholar] [CrossRef]
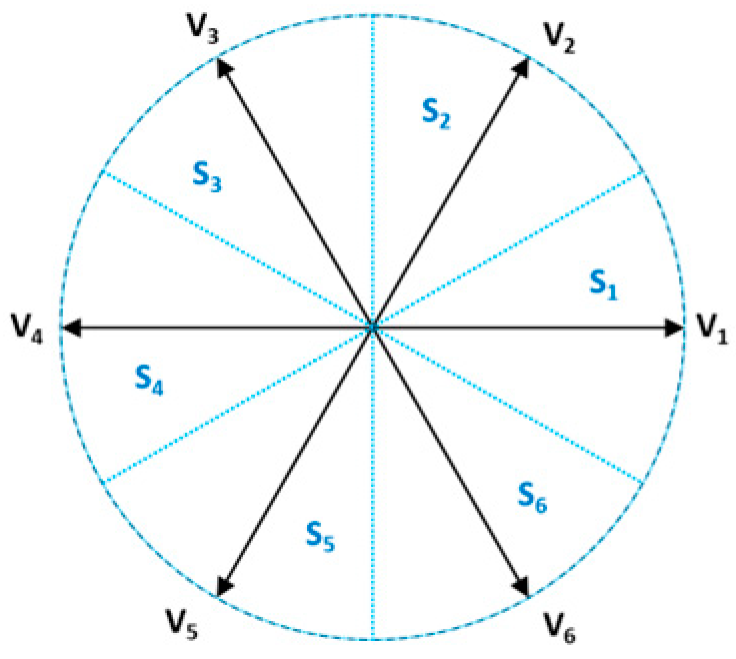
Figure 1. Control diagrams for FOC and DTC. (a) Control diagram of FOC for PMSM using currents as reference; (b) Control diagram of DTC for PMSM using torque and flux as reference.
Engproc 79 00033 g001
Figure 2. Sectors and voltage vectors.
Engproc 79 00033 g002
Figure 3. Reference and response (a) DTC and FOC; (b) DTC and FOC detail; (c) DTC and FOC 100 Nm step and slope; (d) DTC and FOC 100 Nm step and slope detail.
Engproc 79 00033 g003
Table 1. Voltage vector selection.
FluxTorqueS1S2S3S4S5S6
++V2V3V4V5V6V1
+-V6V1V2V3V4V5
-+V3V4V5V6V1V2
--V5V6V1V2V3V4
Table 2. Motor data Nissan Leaf [13].
NameMarkingDataDimension
Quadrature InductanceLq4.3mH
Direct InductanceLd1.6mH
Flux Linkageλm73mWb
Stator ResistanceRS23
Disclaimer/Publisher’s Note: The statements, opinions and data contained in all publications are solely those of the individual author(s) and contributor(s) and not of MDPI and/or the editor(s). MDPI and/or the editor(s) disclaim responsibility for any injury to people or property resulting from any ideas, methods, instructions or products referred to in the content.

