Proceeding Paper

CT-Based Defect Analysis in Aluminium Rotor End Rings †

Department of Materials Science and Technology, Széchenyi István University, 1 Egyetem sqr., 9026 Gyor, Hungary
*
Author to whom correspondence should be addressed.
Presented at the Sustainable Mobility and Transportation Symposium 2024, Győr, Hungary, 14–16 October 2024.
Eng. Proc. 2024, 79(1), 93; https://doi.org/10.3390/engproc2024079093
Published: 20 November 2024
(This article belongs to the Proceedings of The Sustainable Mobility and Transportation Symposium 2024)

Abstract

:
The advantages of using cast aluminium rotors have been proven recently. However, discontinuities and porosities created during the casting of aluminium can cause problems during motor operation, such as eccentricity, losses, unwanted sounds, and false rotor fault indications. During the casting technology, care must be taken to ensure that there are as few cracks and porosities as possible in the volume and that their distribution is homogeneous. In this article, we present in detail the application of the modern CT-based methodology that has been spreading recently for the detection and analysis of discontinuities, voids, and porosities created during the casting of rotor end rings.

1. Introduction

The Al die-cast design is an excellent choice for the rotor if the tooling cost for manufacturing allows for it. With the Al cast rotor, reliability and design flexibility can be achieved at a lower cost. However, there are concerns about defects in the structure, most often related to porosity. Porosity is created in the cage due to the shrinkage of the Al when the molten Al cools down; this is caused by the leakage of the molten Al. This can be aggravated with the leakage of molten Al between laminations or insufficient injection of Al.
Due to the technology in the cast aluminium rotor, many casting defects can occur, especially large amounts of air and shrinkage porosity, which cause eccentricity, losses, and noise during motor operation [1]. If the porosity is not evenly distributed, it introduces electrical asymmetry in the rotor, and false rotor fault indications can arise as well [2]. The presence of porosity makes it difficult for engine designers to accurately predict engine performance. To solve this, a method validated by experiments based on finite element analysis was developed, which gives a prediction to determine the engine performance, taking into account the porosity [3,4].
Recently, the CT-based analysis of porosities has come to the fore in the case of cast aluminium parts [5,6]. CT, µ-CT, and microscope methodologies were compared, and the advantages and disadvantages were explored in detail for porosity analysis in cast aluminium parts [7].
This work presents a porosity analysis based on CT reconstruction for cast aluminium rotor end rings in detail.

2. Method, Results, and Discussion

We show the analysis of defects such as discontinuities, cavities, volume lunkers, and porosities that occur during casting, the identification of defect locations, and the size analysis of defects using the examples of aluminium rotor end rings.
Aluminium motor end rings come from vehicle electric motors. The CT reconstructions were performed in a Yxlon CT scanner at the Department of Materials Science and Technology of Széchenyi István University. The machine has both micro- and macro-CT functions. In this experiment, we worked with a resolution (accuracy) of 0.1 mm.
The homogeneity test of the CT-scanned samples was performed using the VolumeGraphics StudioMax software module. The algorithm built into the software searches for contiguous voxels with a density that is different from the base material, and the porosity test was performed by analysing these data. The primary measurement result is the determination of the amount of detected volume lunkers.
Figure 1 shows CT reconstruction models of two rotor end rings. We labelled the two parts “A” and “B”. Discontinuities, volume lunkers, and porosities within the reconstructed volume are highlighted with different colours in the part volumes. The size of the given porosity (size of volume in mm3) can be identified according to the colour scale on the left. Figure 1a (end ring marked “A”) shows a successfully cast part, while Figure 1b (end ring marked “B”) shows an incorrectly cast part. The end ring marked “A” contains fewer casting defects, and the volume of the lunkers is only a few mm3. The distribution of lunkers inside the volume is homogeneous. The closing ring marked “B” contains large, contiguous, coarse casting defects. The volume of the largest discontinuity is more than 1000 mm3, the large defects are grouped in one large volume, and the distribution is not homogeneous. (Note that the disc stack part was separated from the examined parts, although a full CT examination can be performed without the separation.)
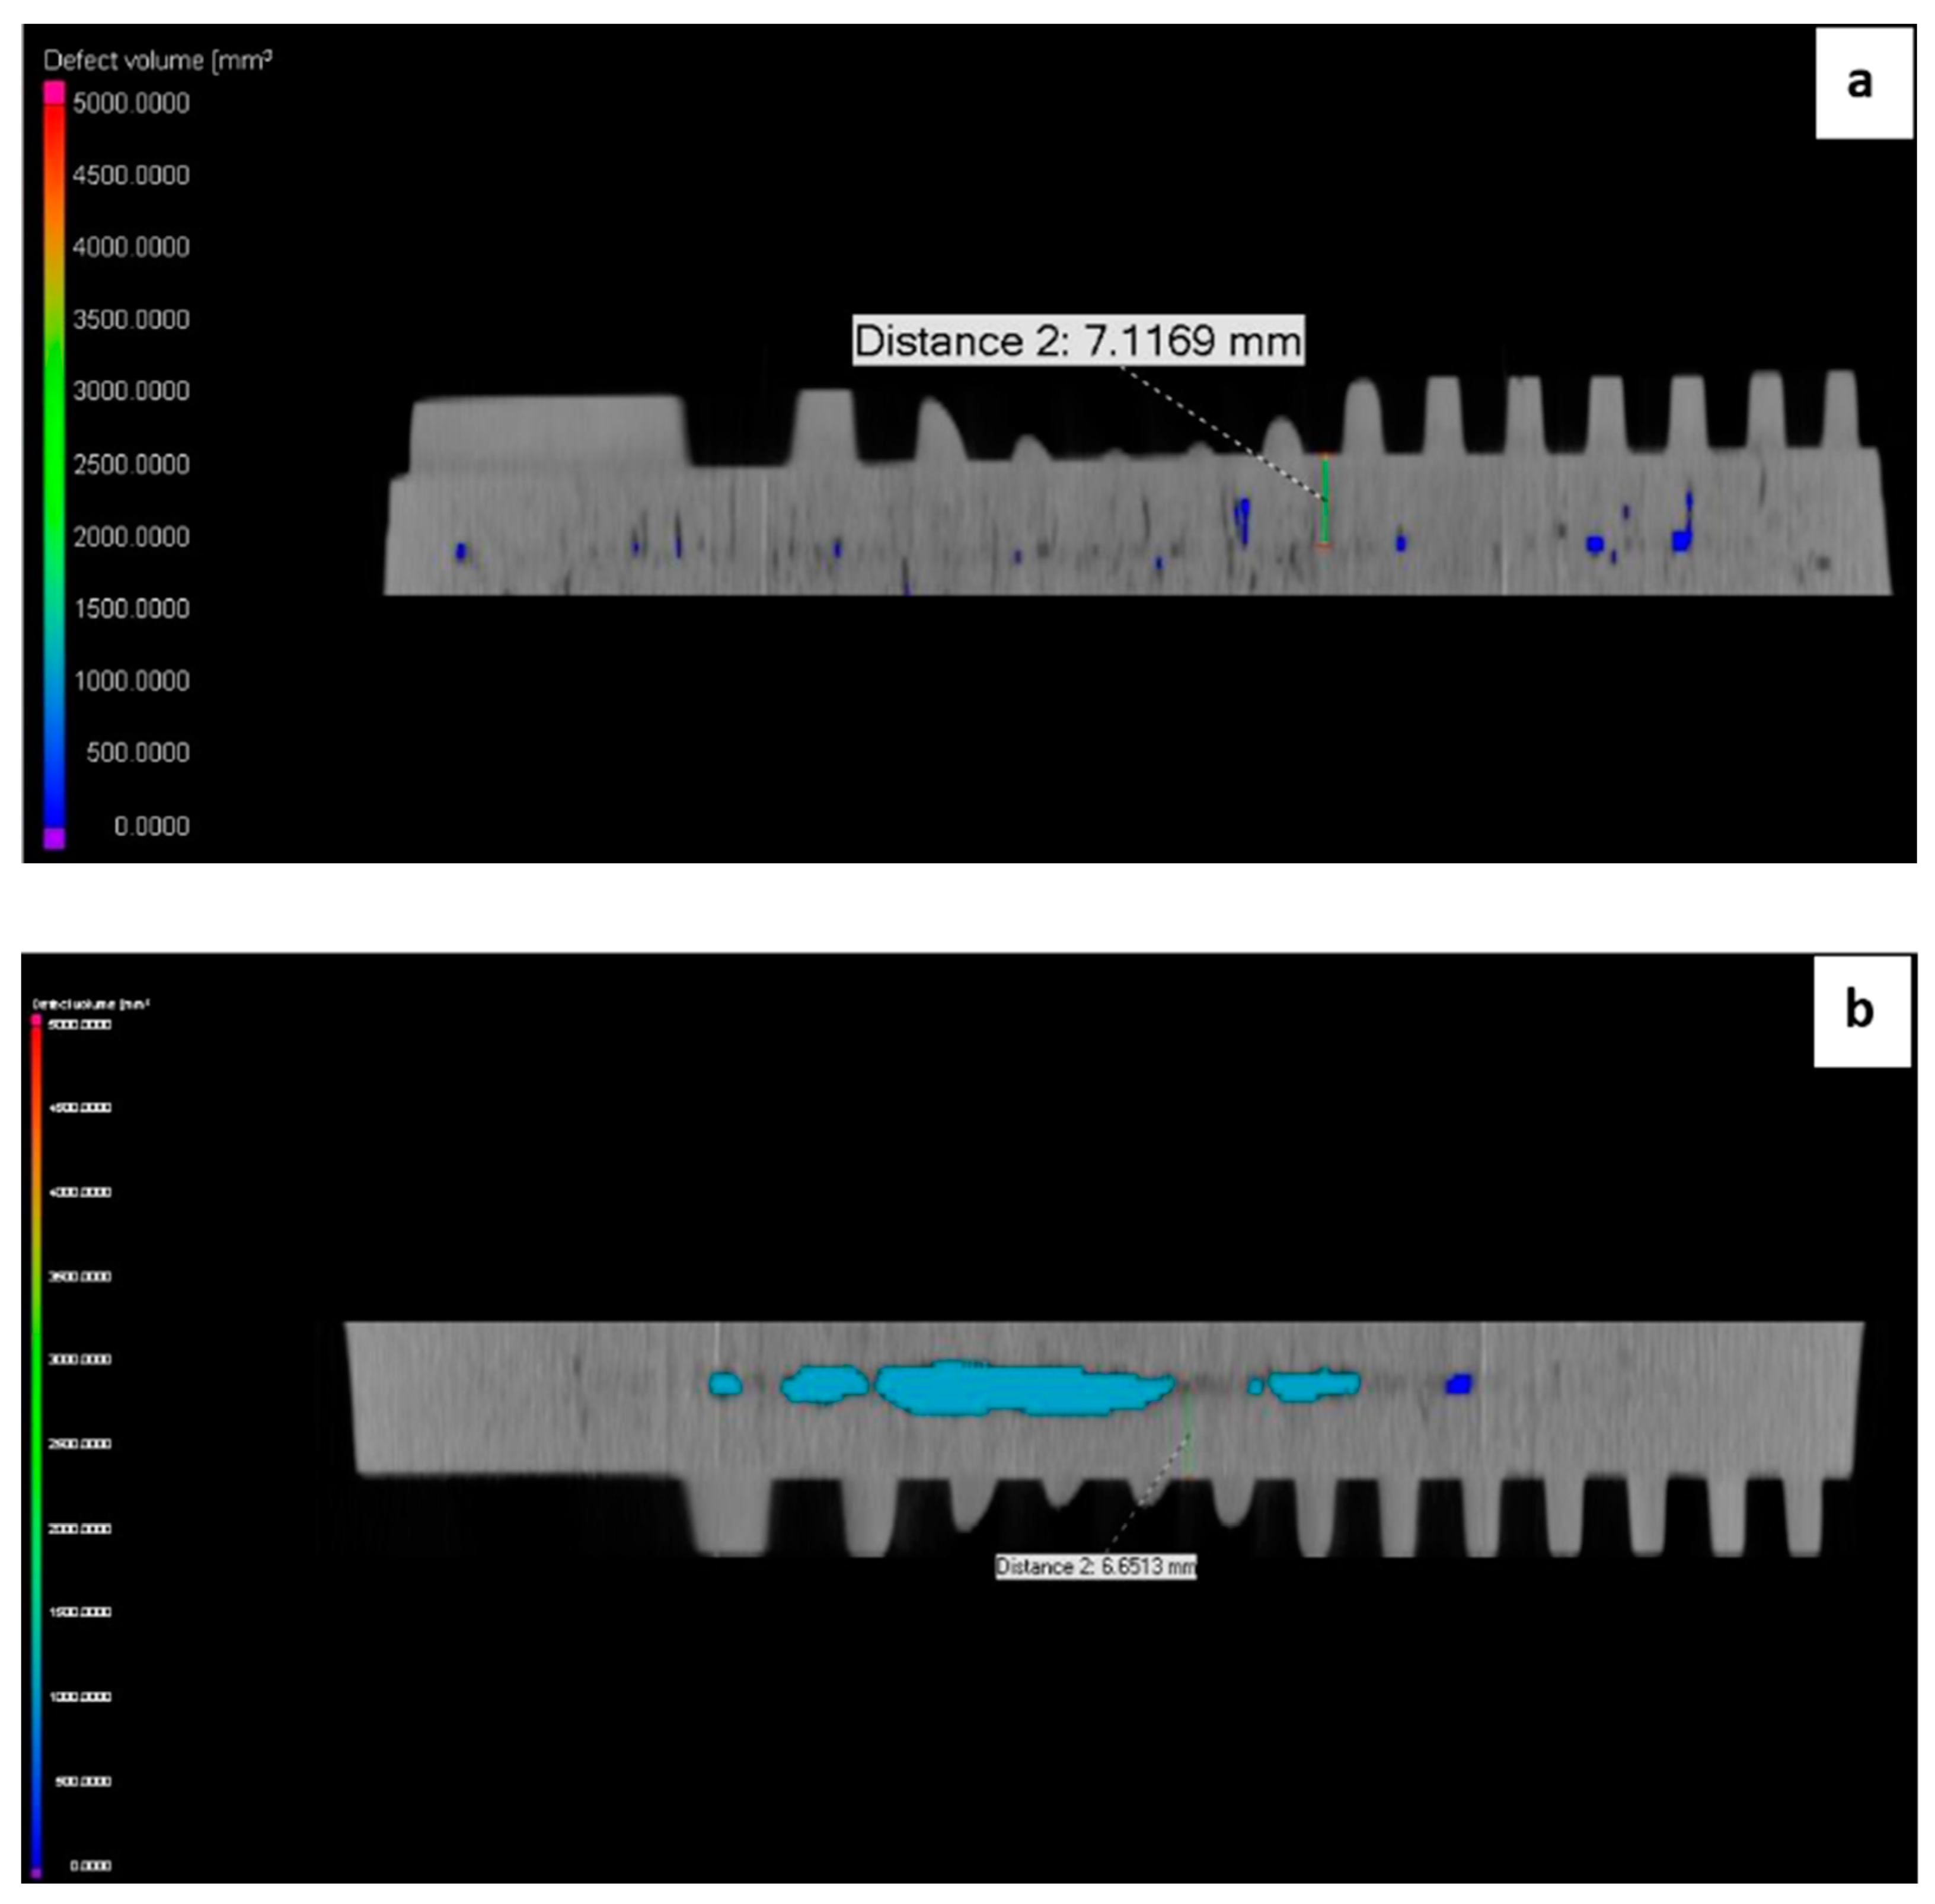
By analysing the CT cross-sectional images, we can shed light on even the smallest details. For example, in Figure 2, we show the rotor end rings in the section of the vertical plane of symmetry. The lunkers in both end rings are located inside the volume in the vicinity of the midplane. The position and size of all detected defects can be determined with high accuracy.
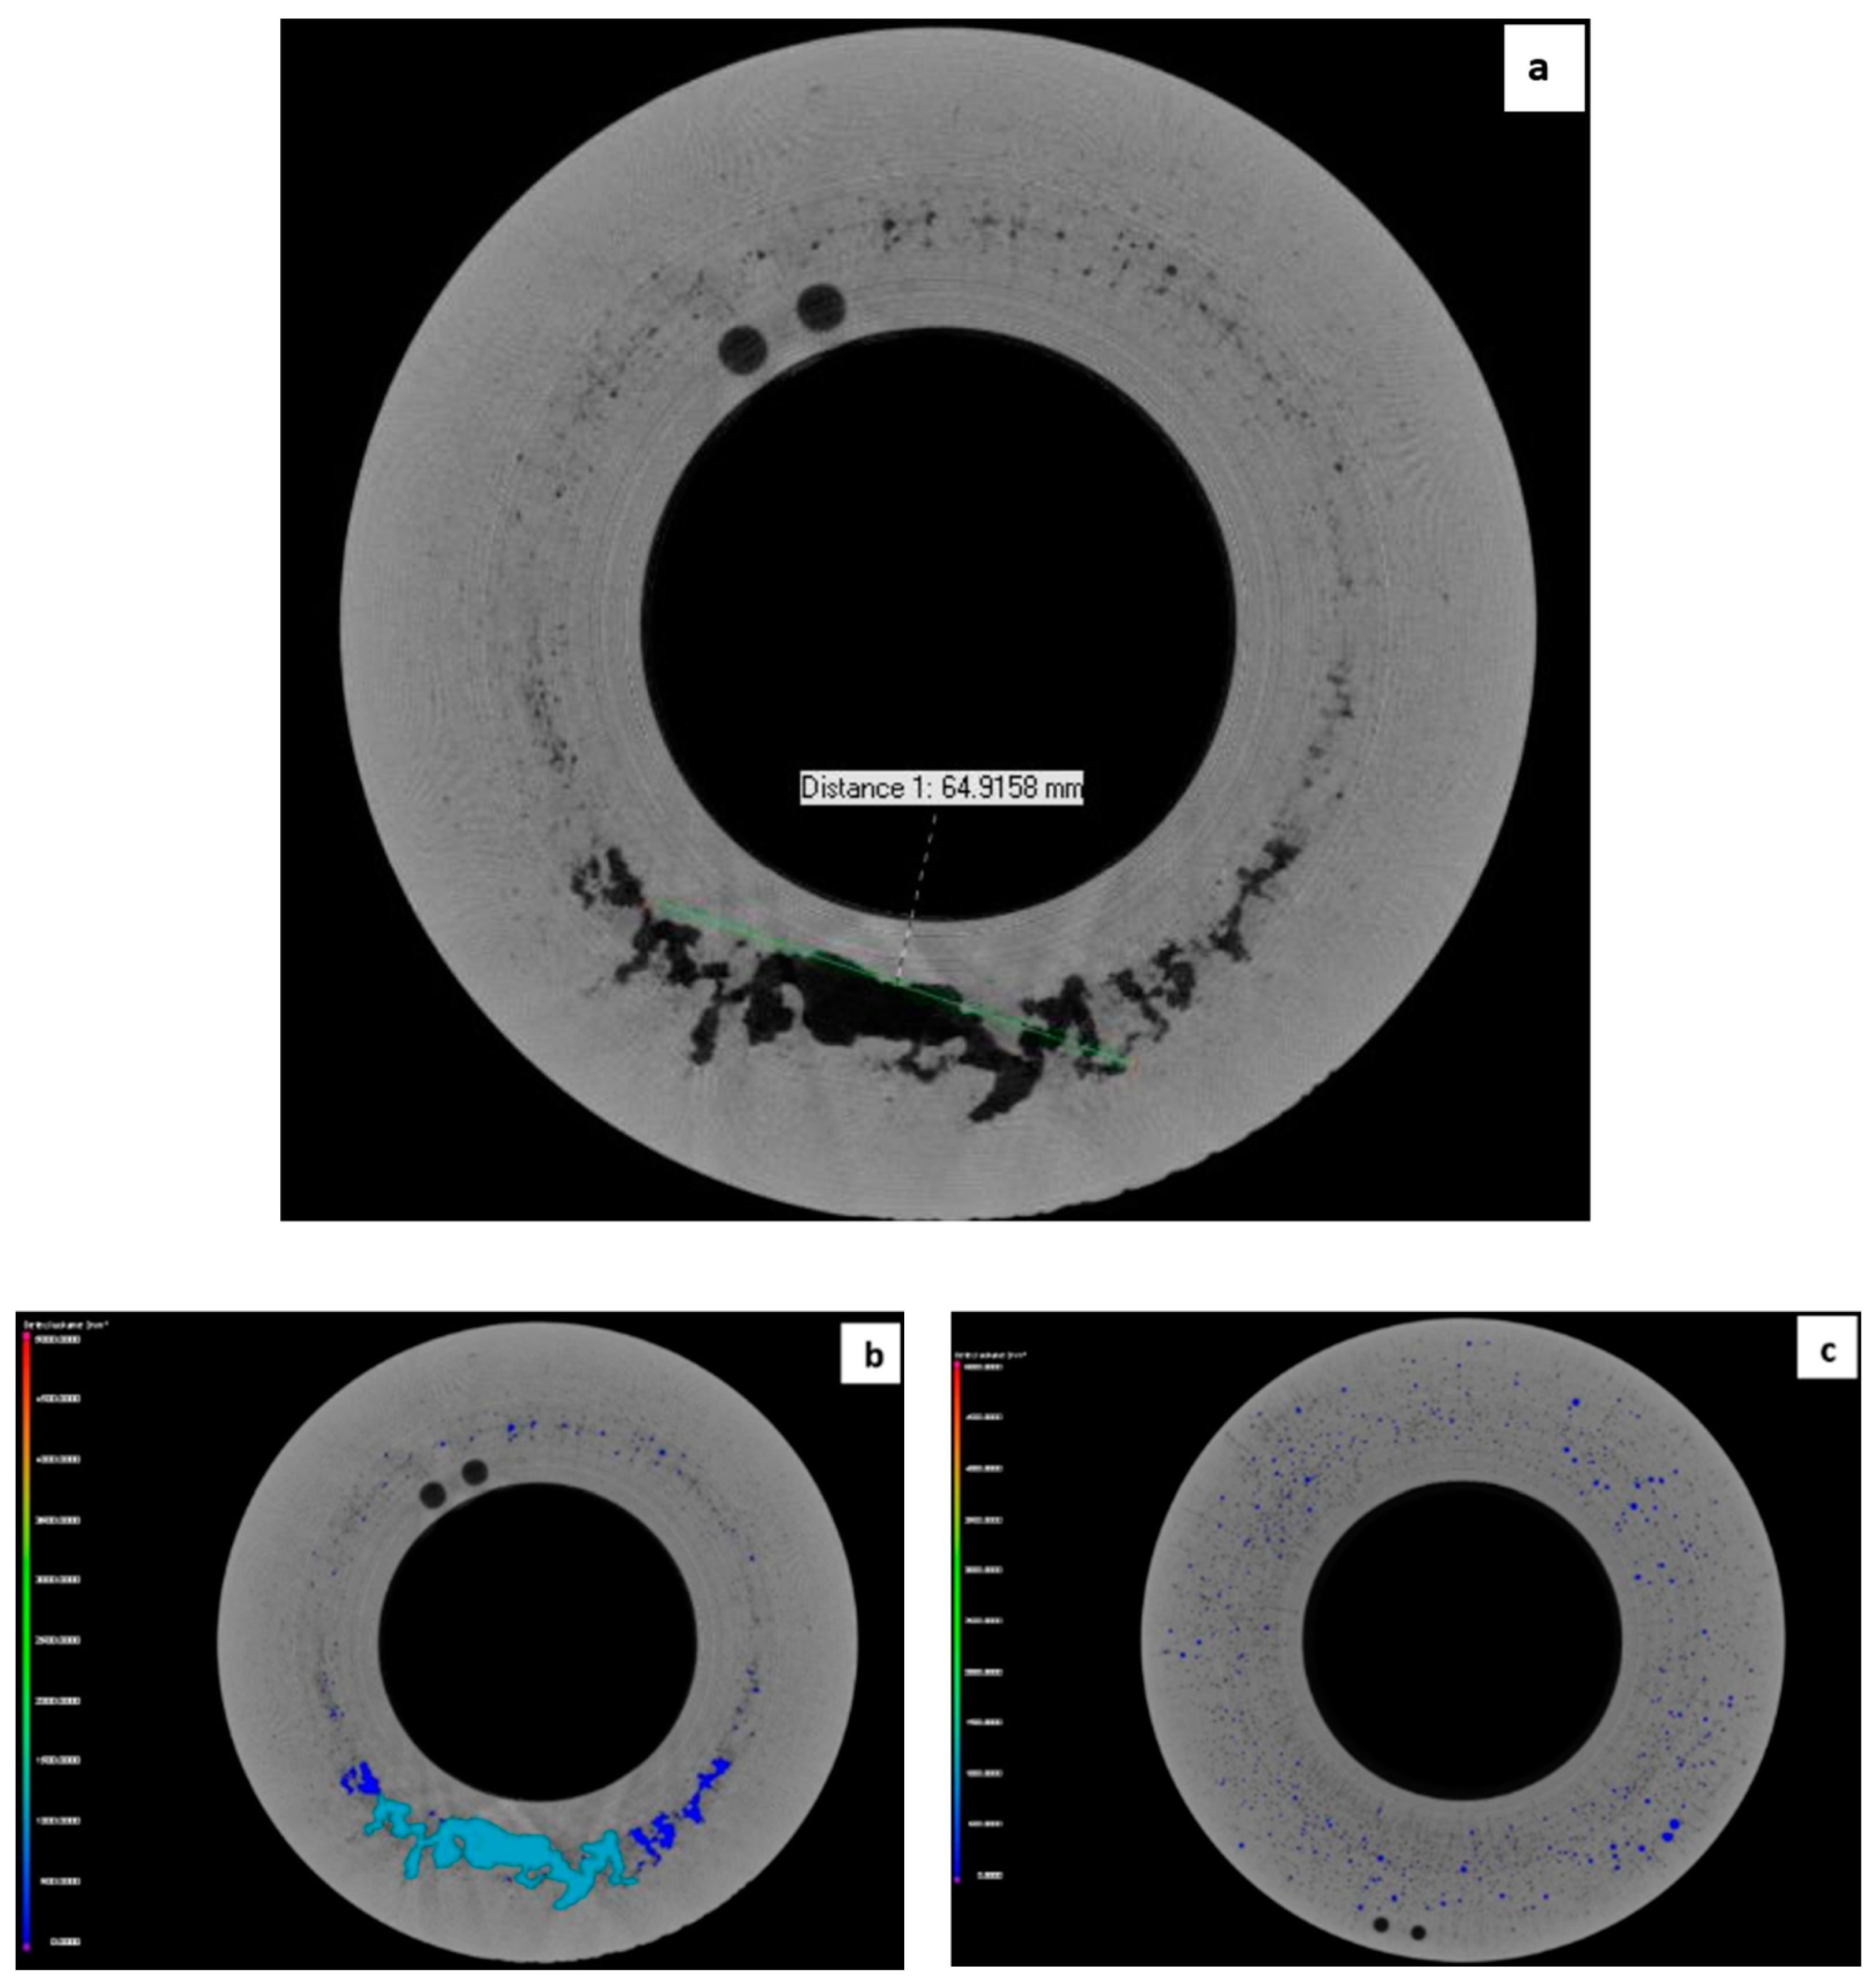
The distribution of porosities and the determination of characteristic dimensions can be performed on any section plane. The layered images of the horizontal middle plane are shown in Figure 3. Figure 3a shows the distance measurements (to determine characteristic dimensions) on the layer survey. The length of the lunker determined by the green line gives the exact size in relation to a benchmark section, similar to the usual distance measurements on microscopic images. Figure 3b,c show the distribution of porosity. In the case of both parts, porosities and smaller and larger lunkers are grouped in the middle of the volume (near the circle indicating the centre line).
Finally, the size distribution of porosities can also be conveniently analysed in histograms. In the diagrams of Figure 4, we see the histograms according to the volume of the porosities, according to the number of pieces falling into different volume intervals.
In the part marked “A”:
  • A total of 123 porosities were found;
  • The majority of the porosities was smaller than 0.5 mm3;
  • The largest porosity was also smaller than 1.5 mm3.
  • In the part marked “B”:
  • We found much more, a total of 360 porosities;
  • Only less than half of this quantity (168 pieces) was smaller than 0.5 mm3;
  • The quantity (18 pieces) of larger porosities—with a volume between 3 mm3 and 4.5 mm3—was also significant.

3. Conclusions

We examined cast aluminium rotor end rings with an analysis based on CT reconstruction. The following results were demonstrated:
  • Discontinuities, volume lunkers, and porosities appeared in the middle part of the volume and in the vicinity of the centre lines, both in the case of good- and poor-quality casting.
  • There were large differences in the number and size of porosities. With proper casting technology, only about 120 porosities were found, and the volume of all of them was less than 1.5 mm3. We experienced a rapid increase in the number of porosities and their size in the second examined part, and this indicates an inadequate technological implementation. There were 360 porosities, where the number of volumes between 3–4.5 mm3 was still significant.
  • We also found a big difference in the distribution of porosities. In the case of the first examined part, the uniform, homogeneous distribution indicates appropriate technology, while in the case of the second examined part, highly inhomogeneous porosities indicate improper technology.

Author Contributions

Conceptualisation, methodology, software, validation, formal analysis, investigation, writing—original draft preparation, writing—review and editing, visualisation, supervision, project administration: I.K. and I.Z. All authors have read and agreed to the published version of the manuscript.

Funding

The research presented in this paper was funded by the National Defence, National Security Subprogram at Széchenyi István University (TKP2021-NVA-23).

Institutional Review Board Statement

Not applicable.

Informed Consent Statement

Not applicable.

Data Availability Statement

Data for this study are available upon request from the corresponding author.

Conflicts of Interest

The authors declare no conflicts of interest.

References

  1. Kim, Y.C.; Choi, S.W.; Kim, C.W.; Cho, J.I.; Lee, S.H.; Kang, C.S. Limitation of Shrinkage Porosity in Aluminum Rotor Die Casting. In Proceedings of the 13th International Conference on Aluminum Alloys (ICAA 13), Pittsburgh, PA, USA, 3 June 2012; pp. 231–236. [Google Scholar]
  2. Lee, S.B.; Hyun, D.; Kang, T.J.; Yang, C.; Shin, S.; Kim, H.; Park, S.; Kong, T.S.; Kim, H.D. Identification of False Rotor Fault Indications Produced by Online MCSA for Medium-Voltage Induction Machines. IEEE Trans. Ind. Appl. 2016, 52, 729–739. [Google Scholar] [CrossRef]
  3. Yun, J.; Lee, S.B. Influence of Aluminum Die-Cast Rotor Porosity on the Efficiency of Induction Machines. IEEE Trans. Magn. 2018, 54, 8104905. [Google Scholar] [CrossRef]
  4. Jeong, M.; Yun, J.; Park, Y.; Lee, S.B.; Gyftakis, K. Quality Assurance Testing for Screening Defective Aluminum Die-cast Rotors of Squirrel Cage Induction Machines. In Proceedings of the 11th International Symposium on Diagnostics for Electrical Machines, Power Electronics and Drives (SDEMPED) IEEE, Tinos, Greece, 9 October 2017. [Google Scholar] [CrossRef]
  5. Bubonyi, T.; Barkóczy, P.; Gácsi, Z. Comparison of CT and metallographic method for evaluation of microporosities of dye cast aluminum parts. IOP Conf. Ser. Mater. Sci. Eng. 2019, 903, 012038. [Google Scholar] [CrossRef]
  6. Horváth, R.; Réger, M.; Oláh, F. Characterisation of defects in die cast aluminium parts. IOP Conf. Ser. Mater. Sci. Eng. 2021, 1246, 012016. [Google Scholar] [CrossRef]
  7. Réger, M.; Gáti, J.; Oláh, F.; Horváth, R.; Fábián, E.R.; Bubonyi, T. Detection of Porosity in Impregnated Die-Cast Aluminum Alloy Piece by Metallography and Computer Tomography. Crystals 2023, 13, 1014. [Google Scholar] [CrossRef]
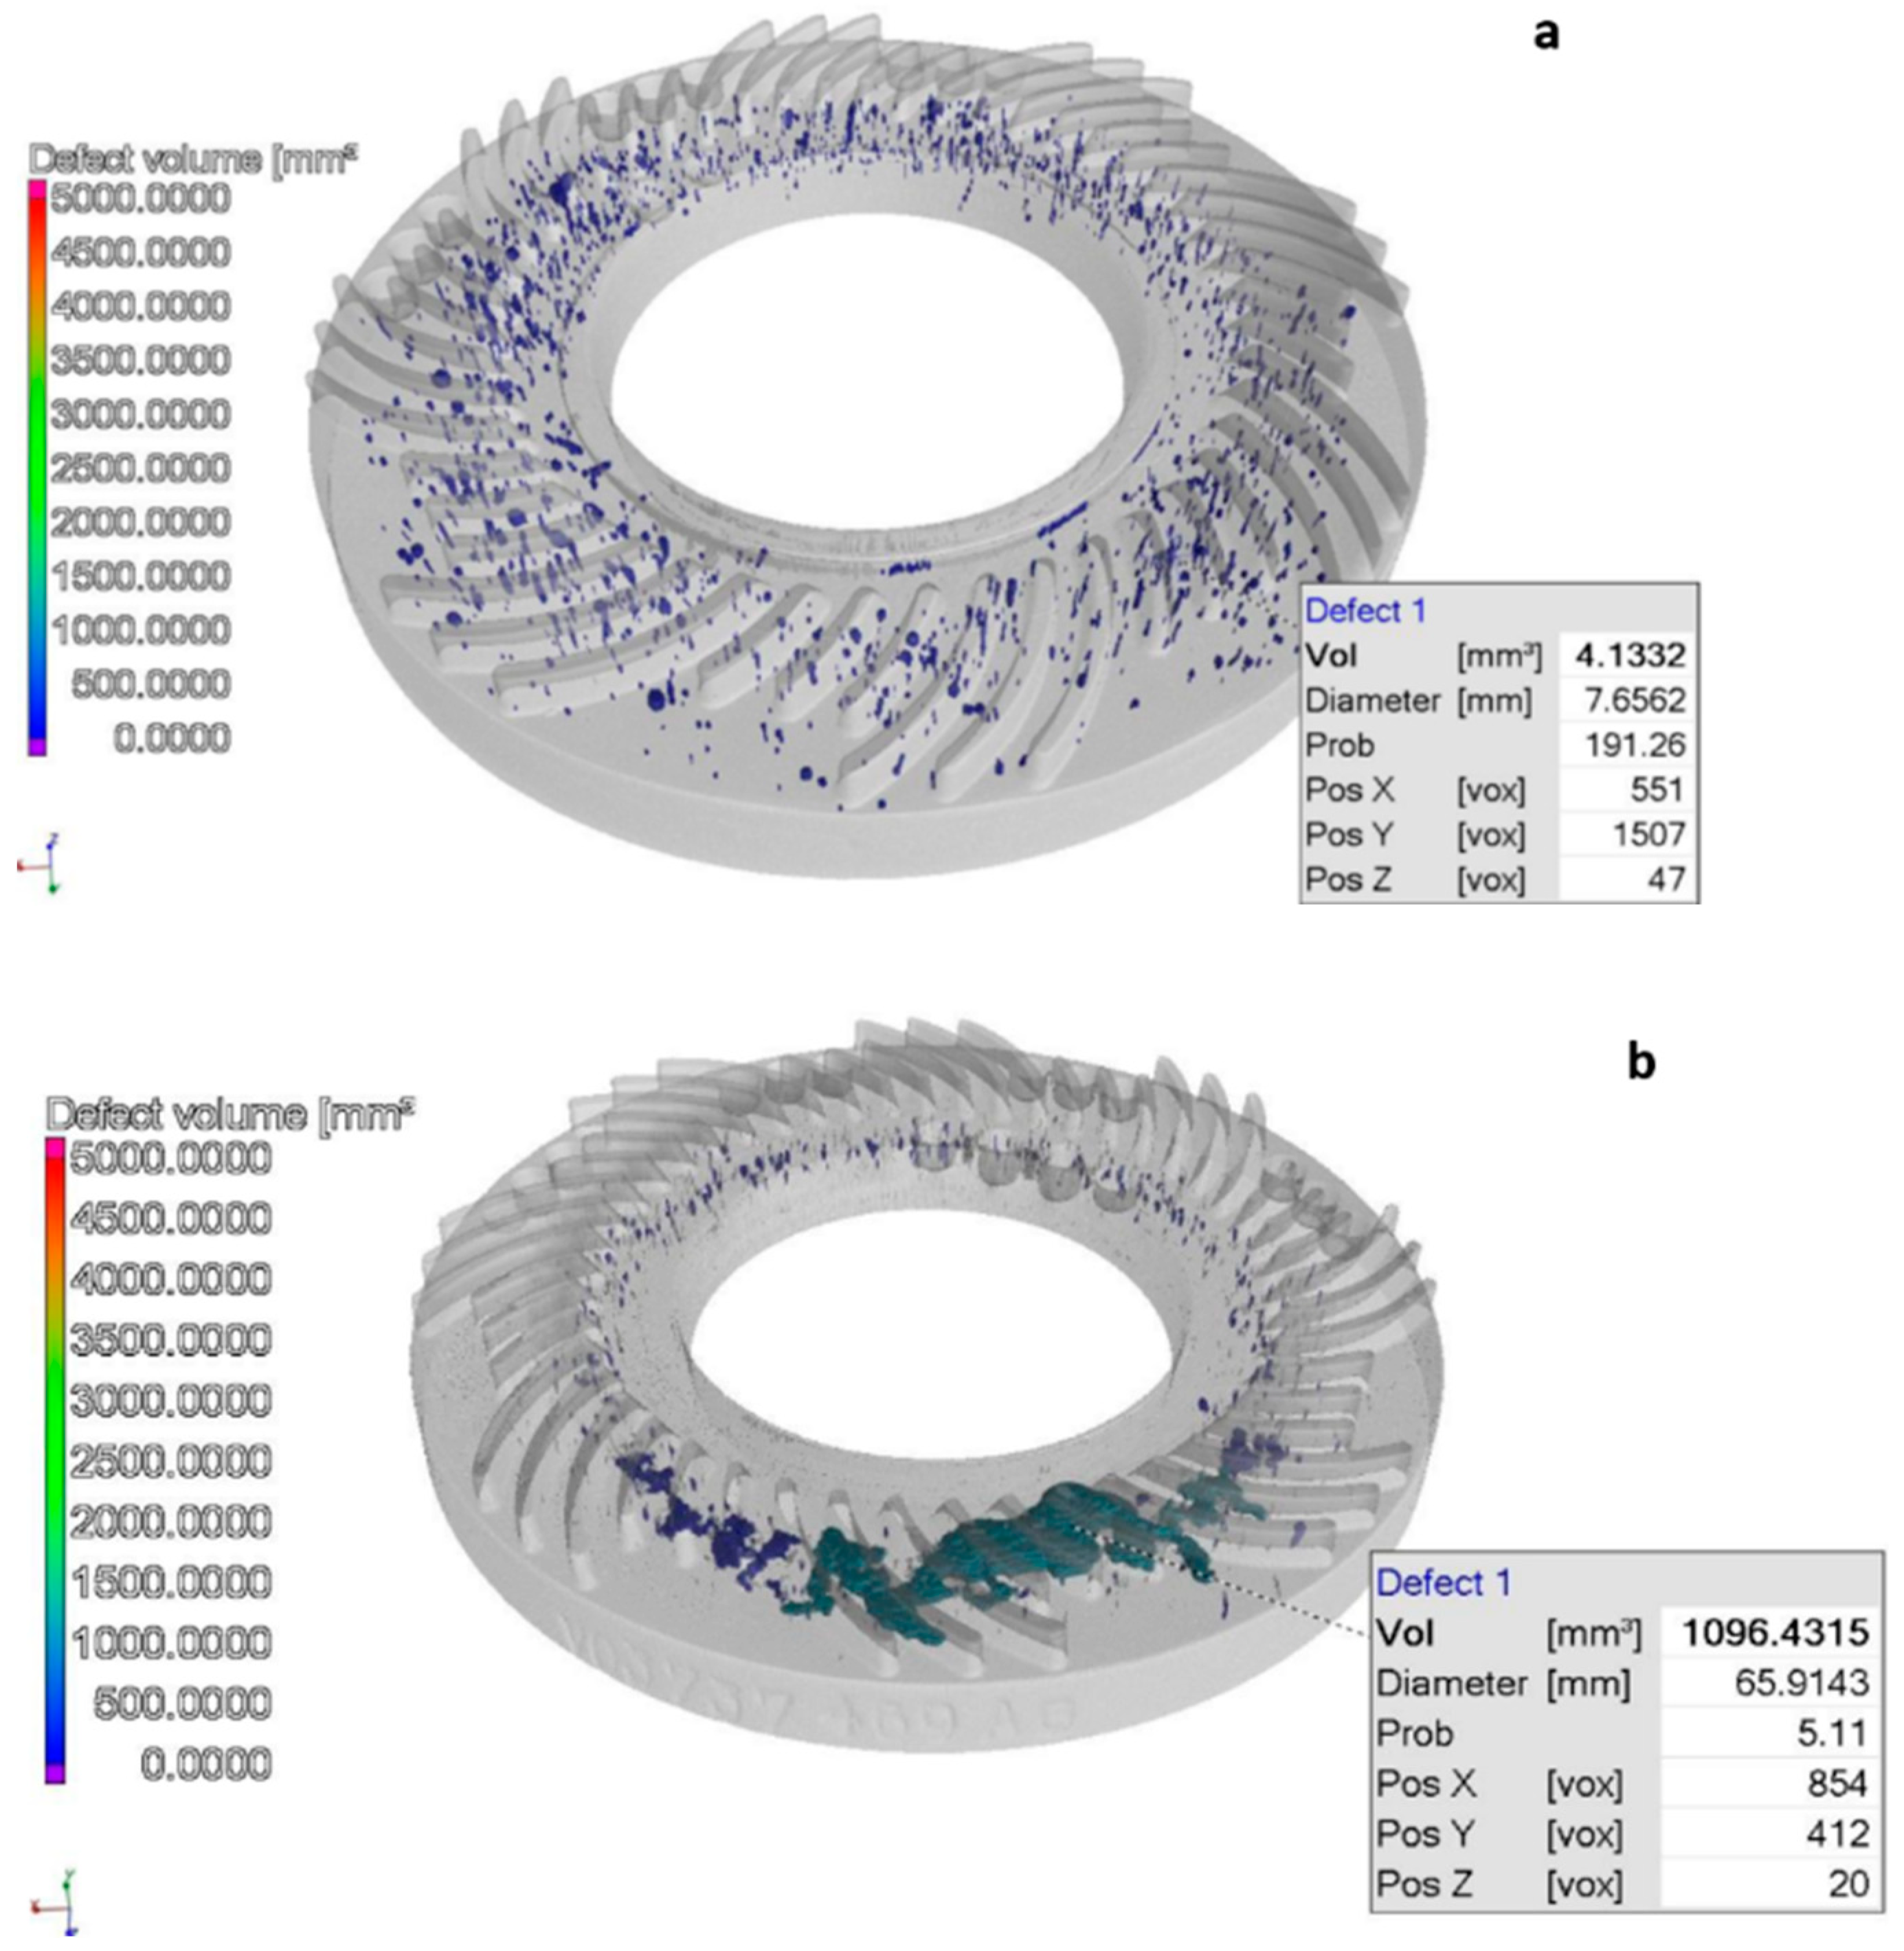
Figure 1. Dimensional analysis of discontinuities on a CT reconstruction of rotor end rings: (a) Discontinuities in the volume of “A” rotor end ring; (b) Discontinuities in the volume of the “B” rotor end ring.
Engproc 79 00093 g001
Figure 2. Discontinuities in the CT layer image taken on the middle vertical cutting plane of the end rings: (a) Vertical section of the rotor end ring marked “A”; (b) Vertical section of the rotor end ring marked “B”.
Engproc 79 00093 g002
Figure 3. Distance measurement and distribution of discontinuities in the CT layer images taken on the middle horizontal cutting plane of the rotor end rings: (a) length measurement in the horizontal section of the “B” rotor end ring; (b) porosity distribution in the horizontal section of the rotor end ring marked “B”; (c) porosity distribution in the horizontal section of the rotor end ring marked “A”.
Engproc 79 00093 g003
Figure 4. Size distributions of porosities in cast end rings: (a) Size distributions of porosities in the cast rotor end ring marked “A”; (b) Size distributions of porosities in the cast rotor end ring marked “B”.
Engproc 79 00093 g004
Disclaimer/Publisher’s Note: The statements, opinions and data contained in all publications are solely those of the individual author(s) and contributor(s) and not of MDPI and/or the editor(s). MDPI and/or the editor(s) disclaim responsibility for any injury to people or property resulting from any ideas, methods, instructions or products referred to in the content.