Abstract
Based on the analysis of the damage location, damage size, product layering structure, and internal filling structure of the composite tail rotor blade, the damage maintenance technical scheme was initially determined. Combined with the comprehensive performance test after maintenance, to determine the use of an enhanced repair method, special repair tooling was used to repair the product, which can repair the product fault, and the fatigue life of the product can be restored to the initial state of the product. The repair cost is low, the product performance after repair is excellent, and the repair pass rate for this kind of failure is 100%, enabling the green composite tail rotor blade repair to solve the bottleneck problem in composite blade maintenance.
1. Introduction
The tail rotor blade is the key dynamic component of a helicopter and the technical core of helicopter research and development, and its quality stability directly affects the flight safety of aircraft. During the routine inspection after the flight of a certain type of aircraft tail rotor blade during service, it was found that the tail rotor blade had a large area of skin unsticking and foam damage under the skin. It was confirmed that the fault location of the product was located in the rear edge area of the tail rotor blade, and the unsticking area of the single surface of the skin was less than 3000 mm. By carrying out the research work of this project, improving on the basis of traditional methods at home and abroad, and using the process plan of local repair and re-patch for repair, the solution of large-area desticking of composite rotor tip skin is summarized, which solves the bottleneck problem in tail blade repair work and provides technical support for the quality stability of the tail blade. This work aims to improve the application of composite foam sandwich structures in aircraft, reduce the operating cost of aircraft life cycles, and improve the overall level of composite blade manufacturing in the industry.
2. Introduction to the Product Manufacturing Process
Tail blade manufacturing is mainly divided into internal parts manufacturing, tail blade molding, and tail blade assembly. Internal parts manufacturing includes flexible beam manufacturing, foam core manufacturing, and balance support performing. Tail rotor blade forming includes laying the skin, preparing the flexible beam, assembling the internal parts, placing the package, and pressurizing curing. After forming, start the tail rotor blade assembly work, including boring, bonding with the iron belt, bonding with the surface gasket, etc. After assembly, the tail rotor blades need to carry out weight inspection, size inspection, airfoil maximum thickness and twist angle inspection, knock inspection, X-ray inspection, etc., after passing the inspection and delivery [1].
3. Product Failure Situation
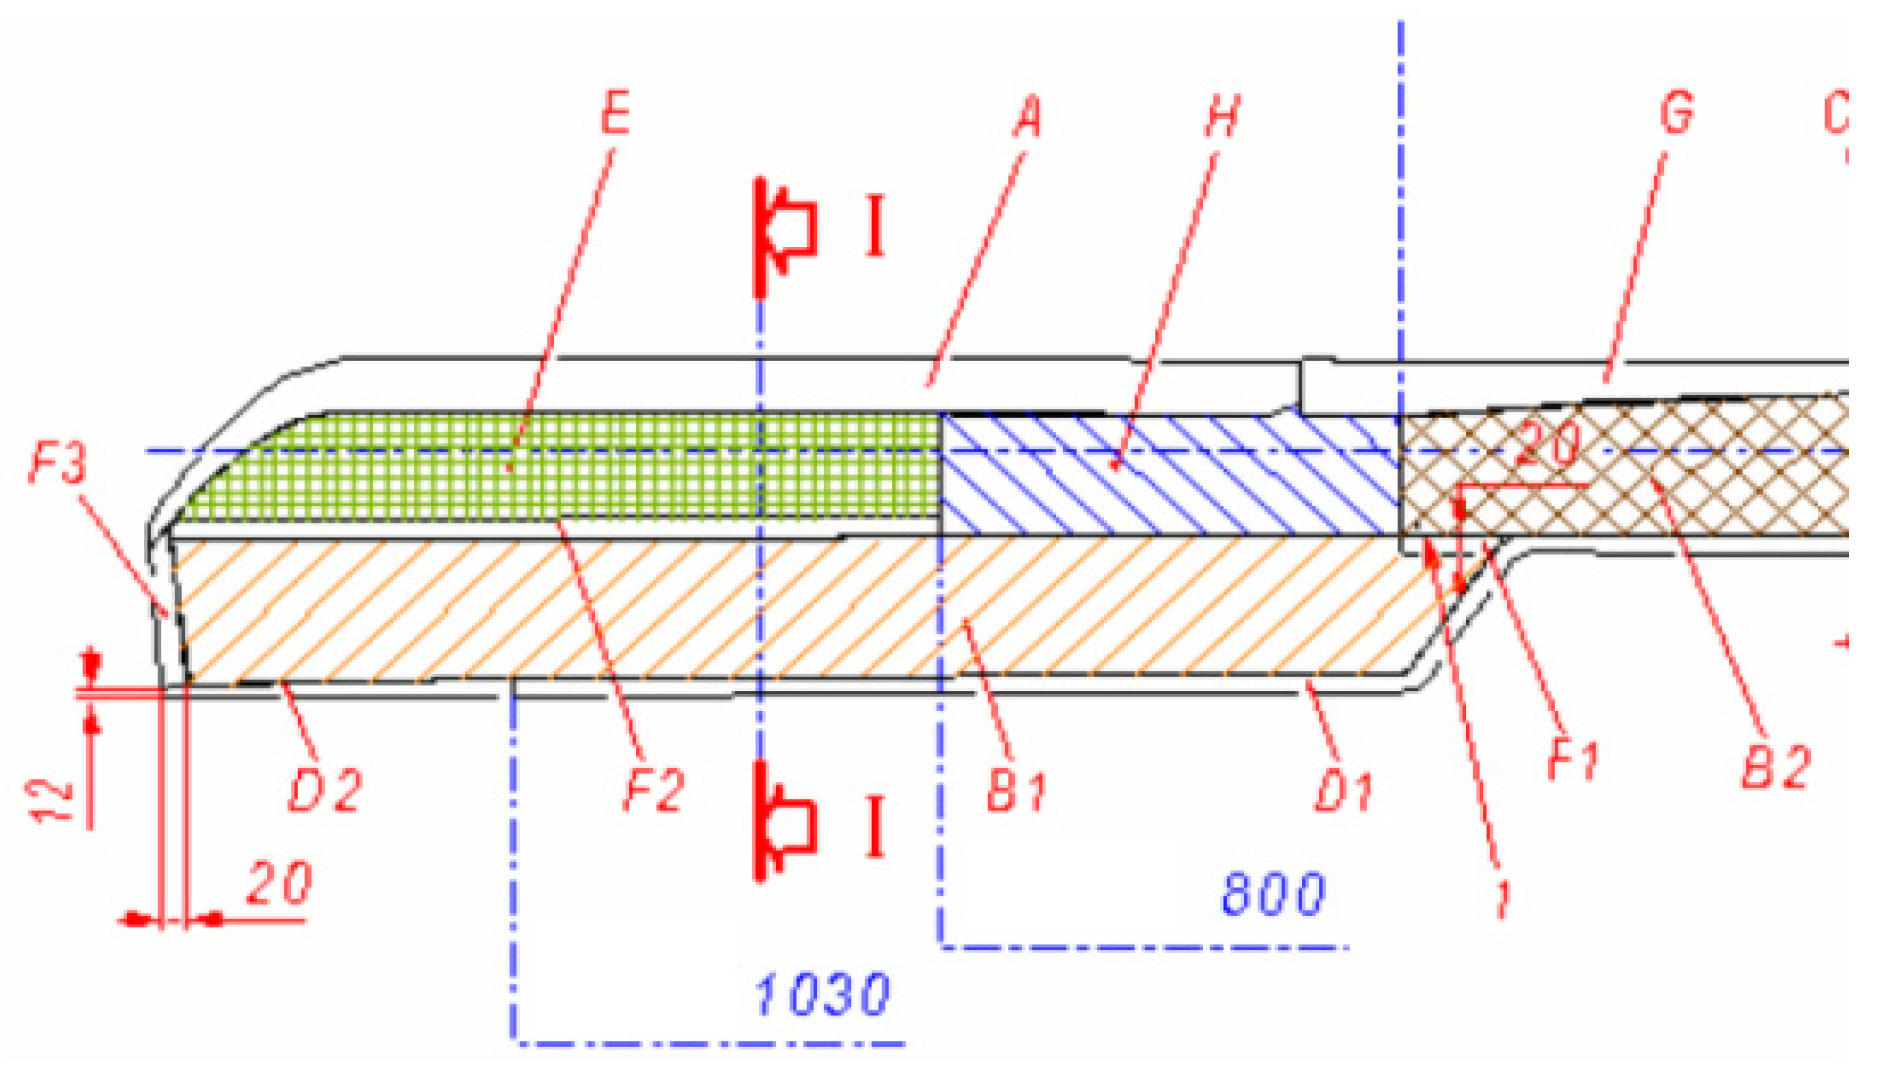
The tail rotor blade is divided into regions, and the fault location is located in the B1 area of the rear edge of the blade (Figure 1). The damaged fault location is the area compared with other positions; the foam core at this position is the thinnest and the number of coating is the fewest. The tail rotor blade is molded, and the inner is filled with polyurethane foam with low density, and the thickness of the foam is thin. The test shows that the compressive strength, shear strength, and peel strength of the polyurethane foam are low. When the amount of molding is slightly larger, the foam is easy to exceed its bearing capacity. Therefore, the polyurethane foam, after being compressed, is prone to instability/failure problems, resulting in skin stripping and foam damage after flight [2].
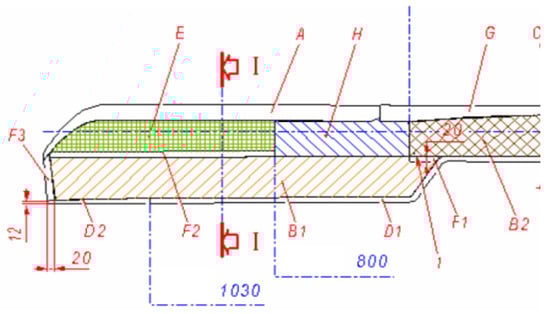
Figure 1.
The debonding area is zone B1.
4. Repair Technical Plan and Test
The repair technology adopts a two-arm single-wing face weighing repair method. The two-arm blades are repaired according to the same size and method. When the upper and lower wings of the single arm are unglued at the same time, only the lower wings are repaired (Figure 2). By dredging the skin and foam with the largest repairable area, adding the pre-cured cover seam cloth to reinforce, and using the special molding die to protect the weak area of the skin stiffness and restrict the repair of the blade iron, the single airfoil can be repaired, and the problem of double airfoil desticking can be solved [3].
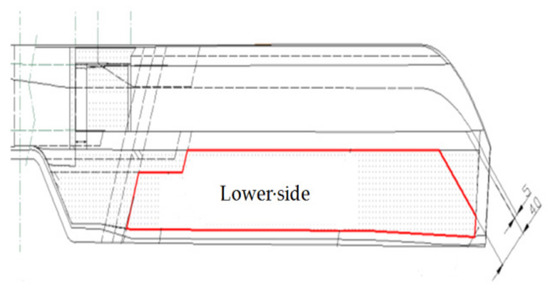
Figure 2.
Maximum repairable area of a single arm.
4.1. Prepare Before Repair
Check the tail blade before repair to determine the blade fault location and blade state. The tail rotor blades are weighed to determine the total weight before repair.
Easy to calculate weight gain during repair.
4.2. Damage Area Treatment
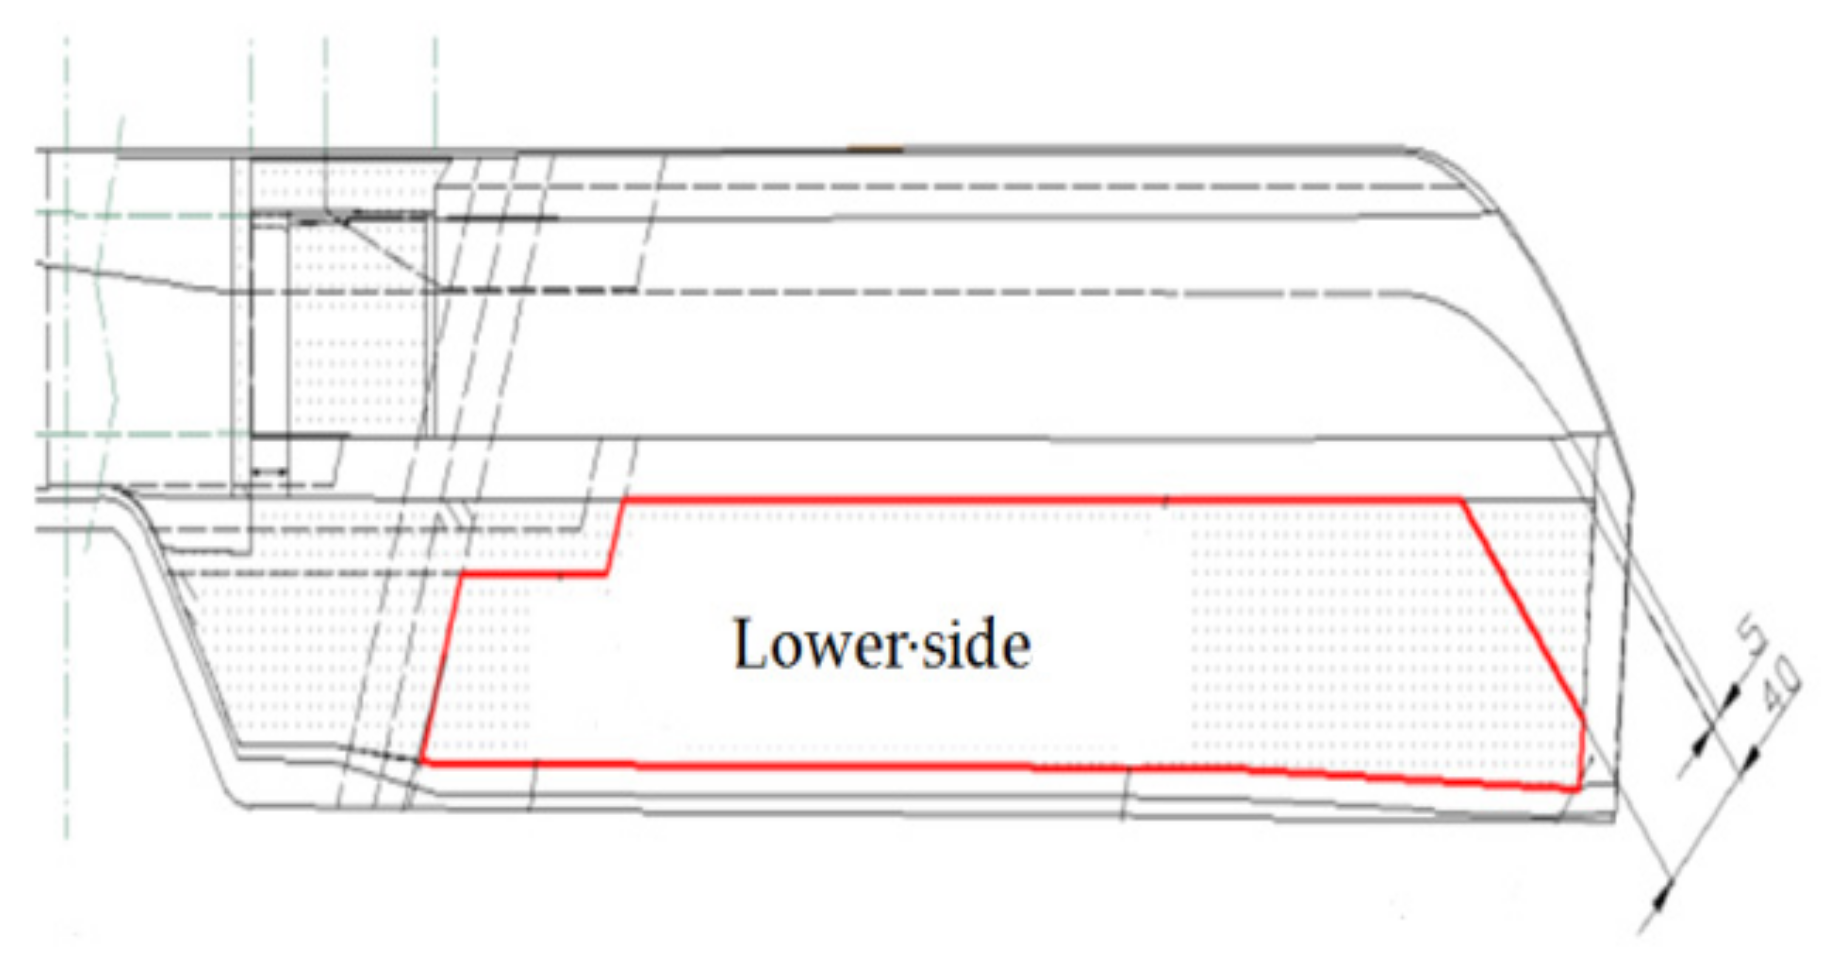
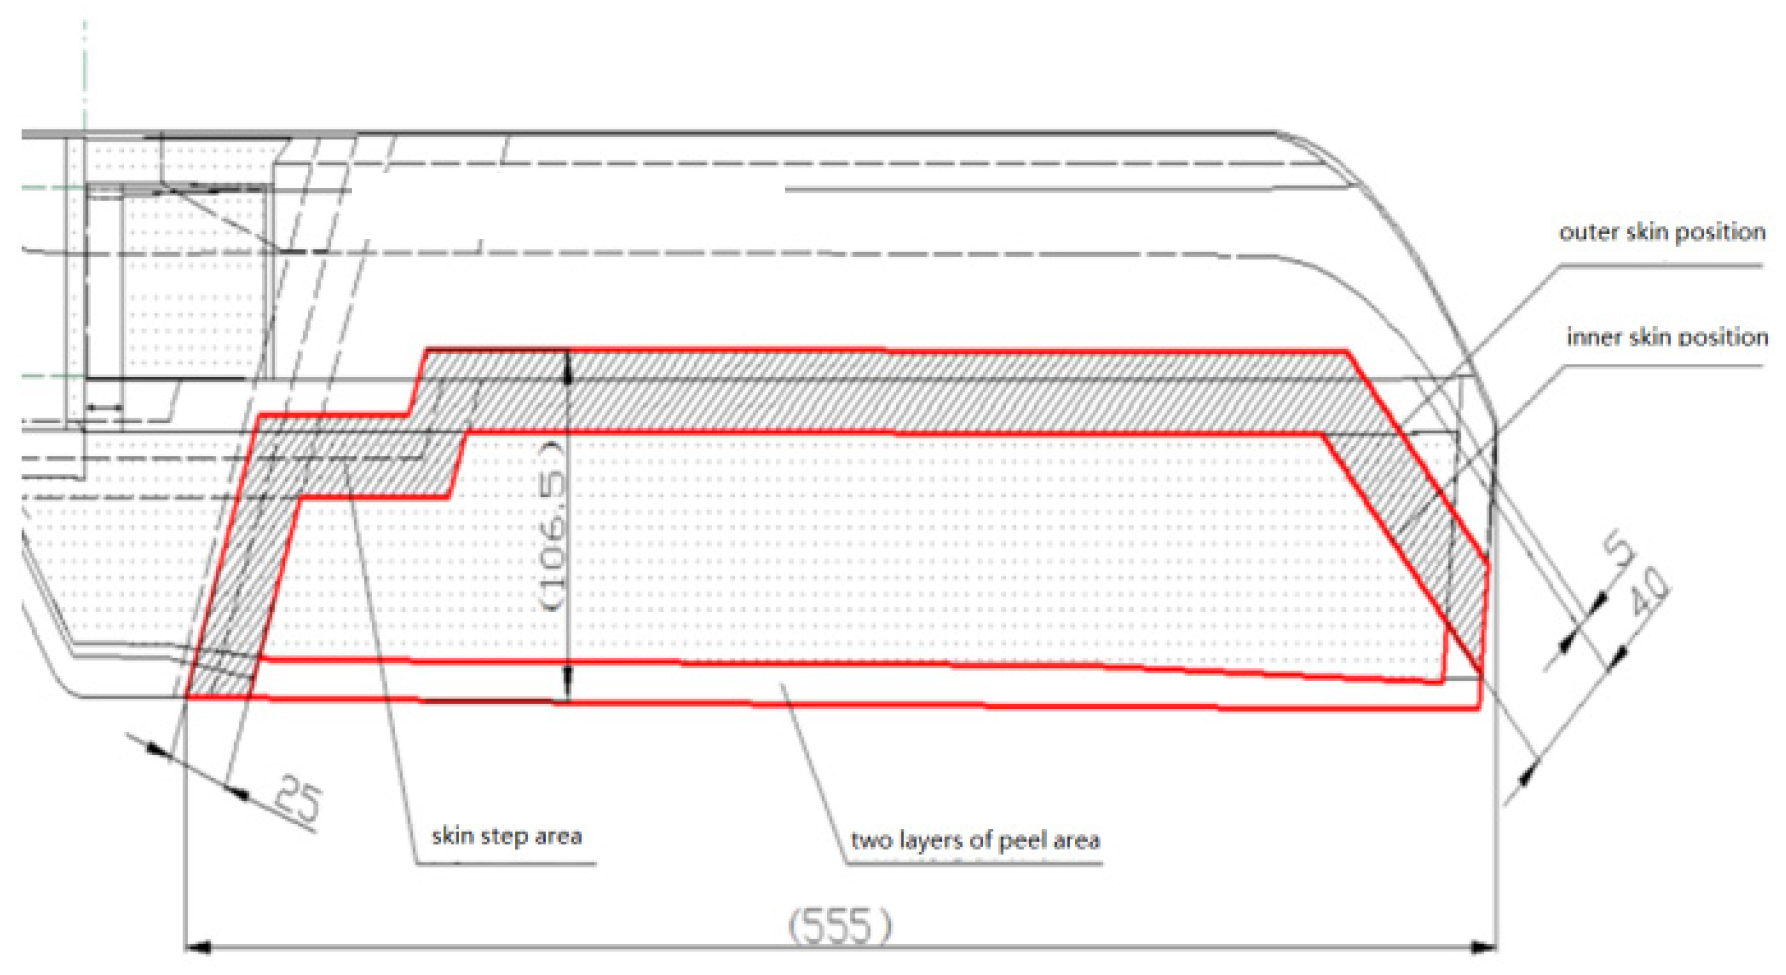
4.2.1. Peel the Skin and Foam from the Damaged Area
The specific locations of the upper and lower airfoil are determined, the maximum repairable range is taken as the size to be stripped, and the skin is stripped through the lower airfoil. The two layers of skin are peeled off layer by layer, with the area of the second layer gradually decreasing from the outside to the inside, and the area of the second layer is equivalent to the area of the debonding (Figure 3).
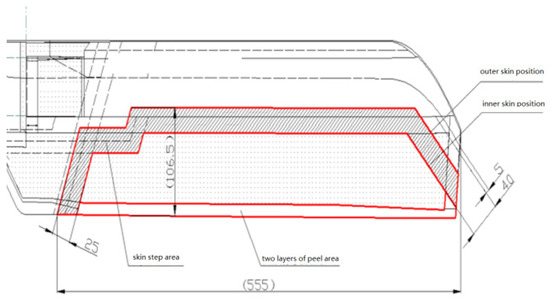
Figure 3.
Skin stripping program.
4.2.2. Remove All Foam in the Repair Area
Remove all the foam in the repair area, clean the corners of the foam neatly, and avoid damage to the facade. Remove all the materials in the damaged area, ensure the lap requirements of the post-repair skin structure, and improve the bonding strength.
4.2.3. Foam Repair in the Damaged Area
Put a layer of adhesive film material on the whole area to remove the foam core, improve the overall glue relay to fill the foam core, avoid the butt gap, and control the total amount of adhesive increase. Re-fill the foam core material in the foam core cleaning area, retain the same molding pressure as the foam core material, and ensure uniform pressure in the repair area and the aerodynamic shape of the blade [4].
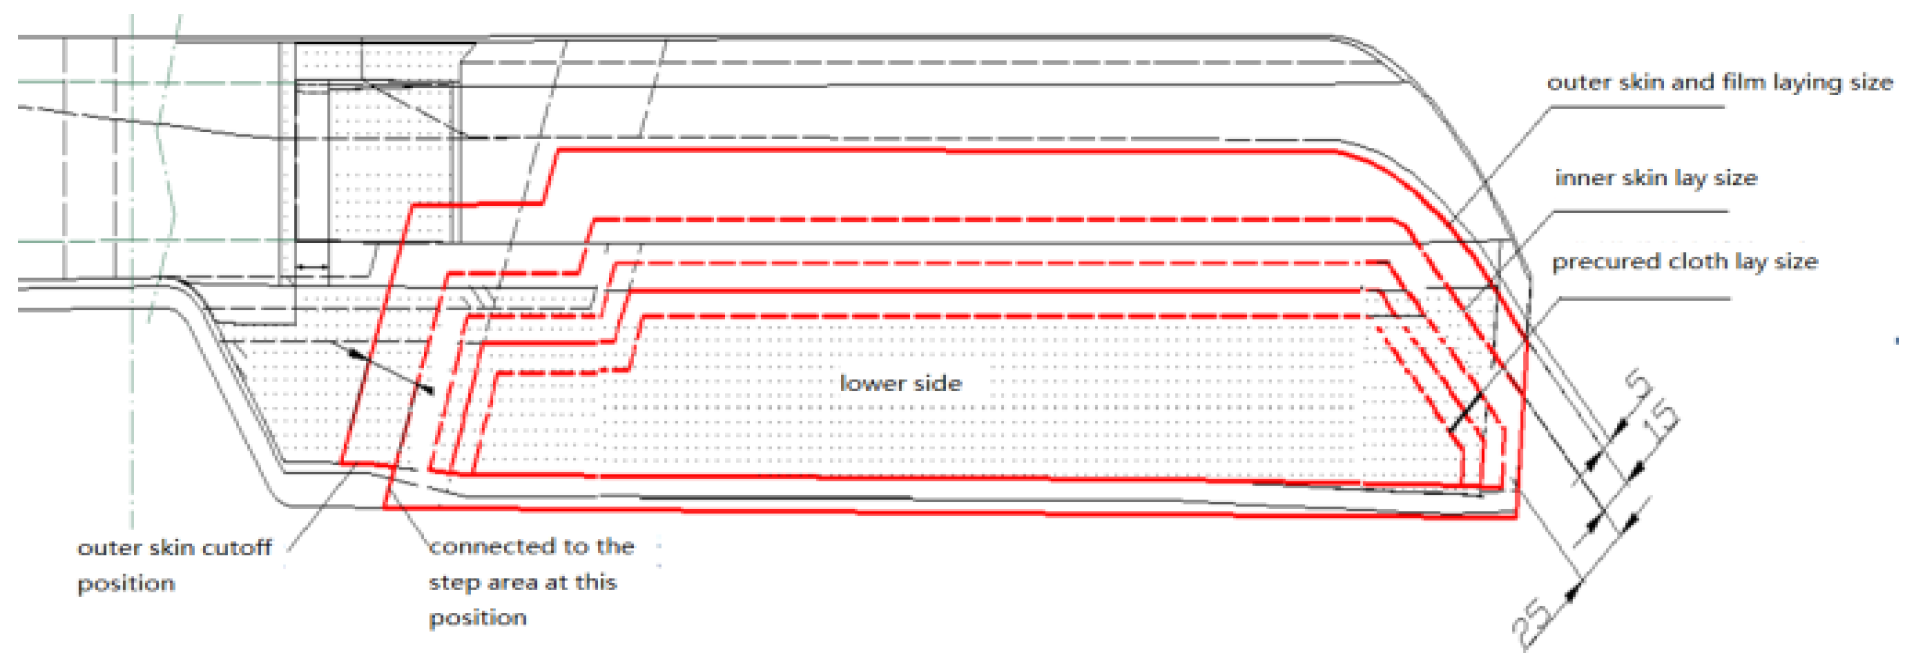
4.2.4. Skin Repair of the Damaged Area
Cut the skin prepreg according to the specified size for pre-curing treatment, used in the foam butt joint position, protect the foam butt gap, and avoid the collapse of the skin after repair. Lay a layer of adhesive film material on all the removed skin areas, and lay pre-cured glass cloth on the cover joint areas to improve the overall glue relay in the repair area. Lay twolayers of glass cloth on the whole repair area. The material and Angle of each layer of skin are the same as that of the original skin, and the raw material system is changed to a minimum degree to ensure the adhesive strength and stiffness of the blade (Figure 4) [5].
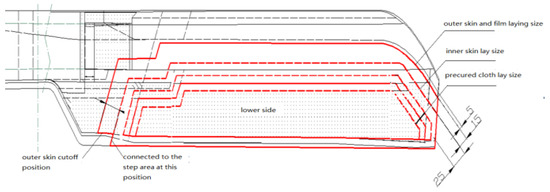
Figure 4.
Placement of adhesive film, pre-cured covering cloth, and skin.
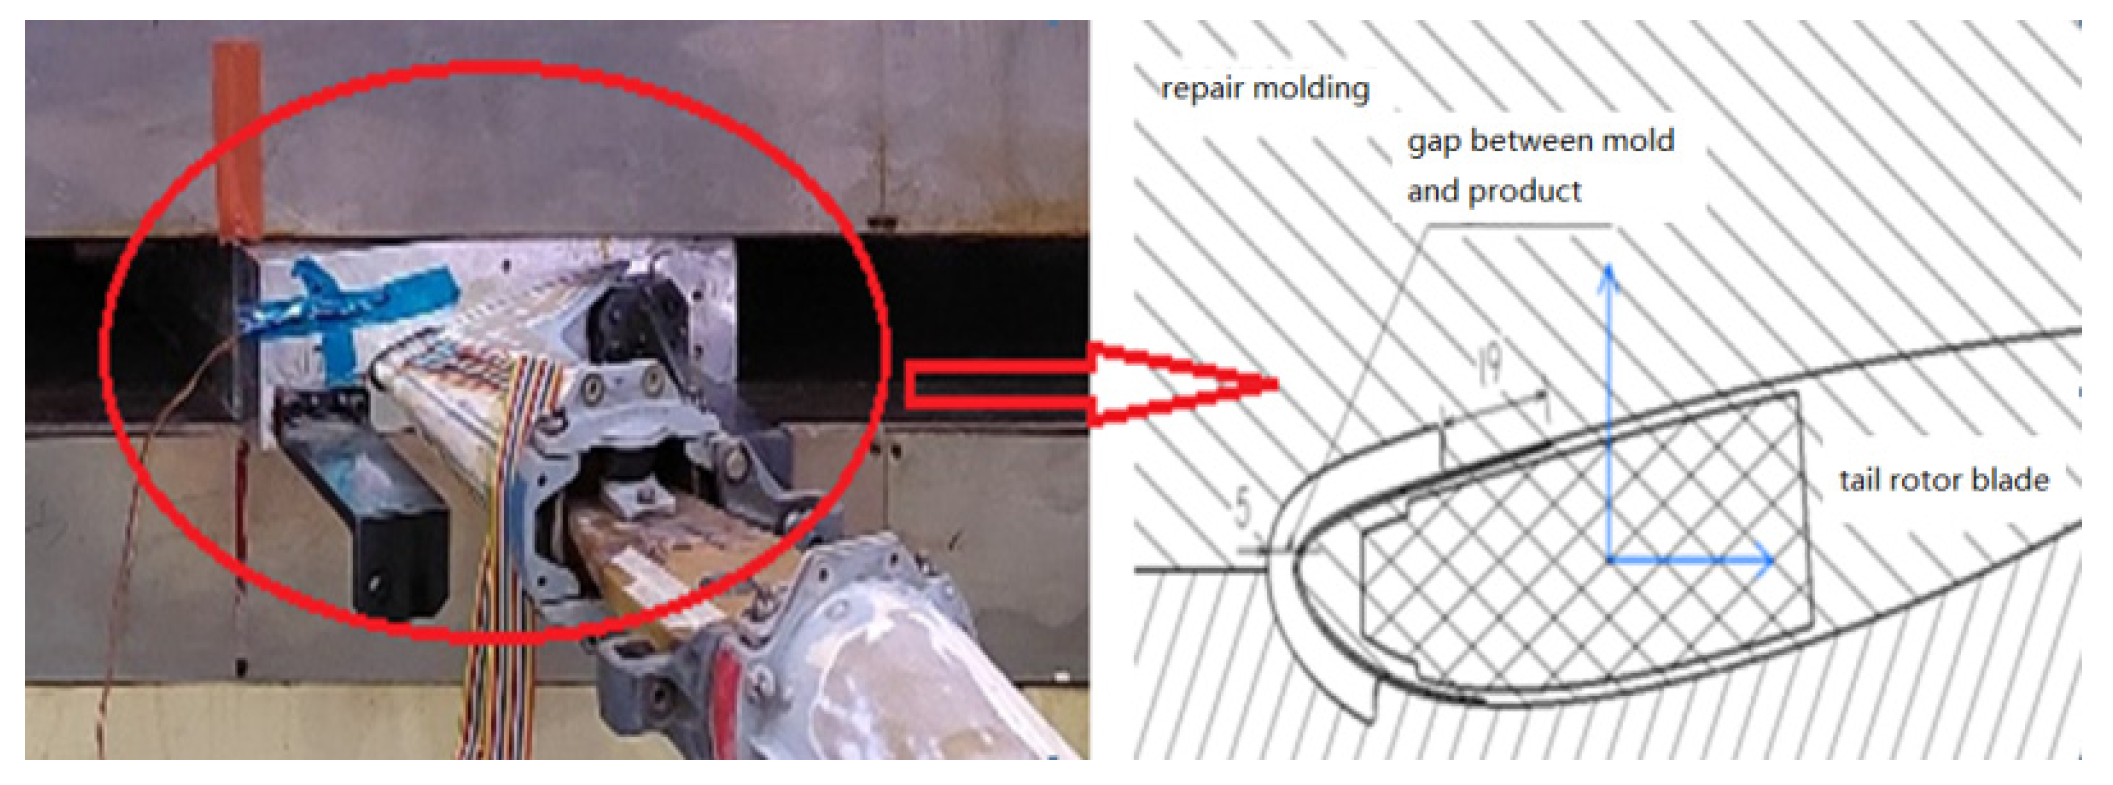
4.2.5. Damage Repair Curing Molding
Put the finished tail rotor blade into the repair special molding die to pressure (Figure 5), reduce the impact of the theoretical shape of the composite blade on the lap skin after repair, and ensure the aerodynamic shape after repair. The forming die is used to protect the area with weak skin stiffness and restrict the structure of the iron-clad area of the blade, which solves the problem of iron-clad debonding after large-area skin debonding repair and avoids secondary blade repair [6].

Figure 5.
Curing molding die for repairing large area damage of skin.
4.3. After Repair Character Test
4.3.1. Weight Test
The weight test is carried out on the repaired faulty tail rotor blade. The weight difference between the blade before and after repair is small, which meets the requirements. The weight record is shown in Table 1 [7].

Table 1.
Weight record table before and after repair.
4.3.2. Skin Vacuum Adsorption Test
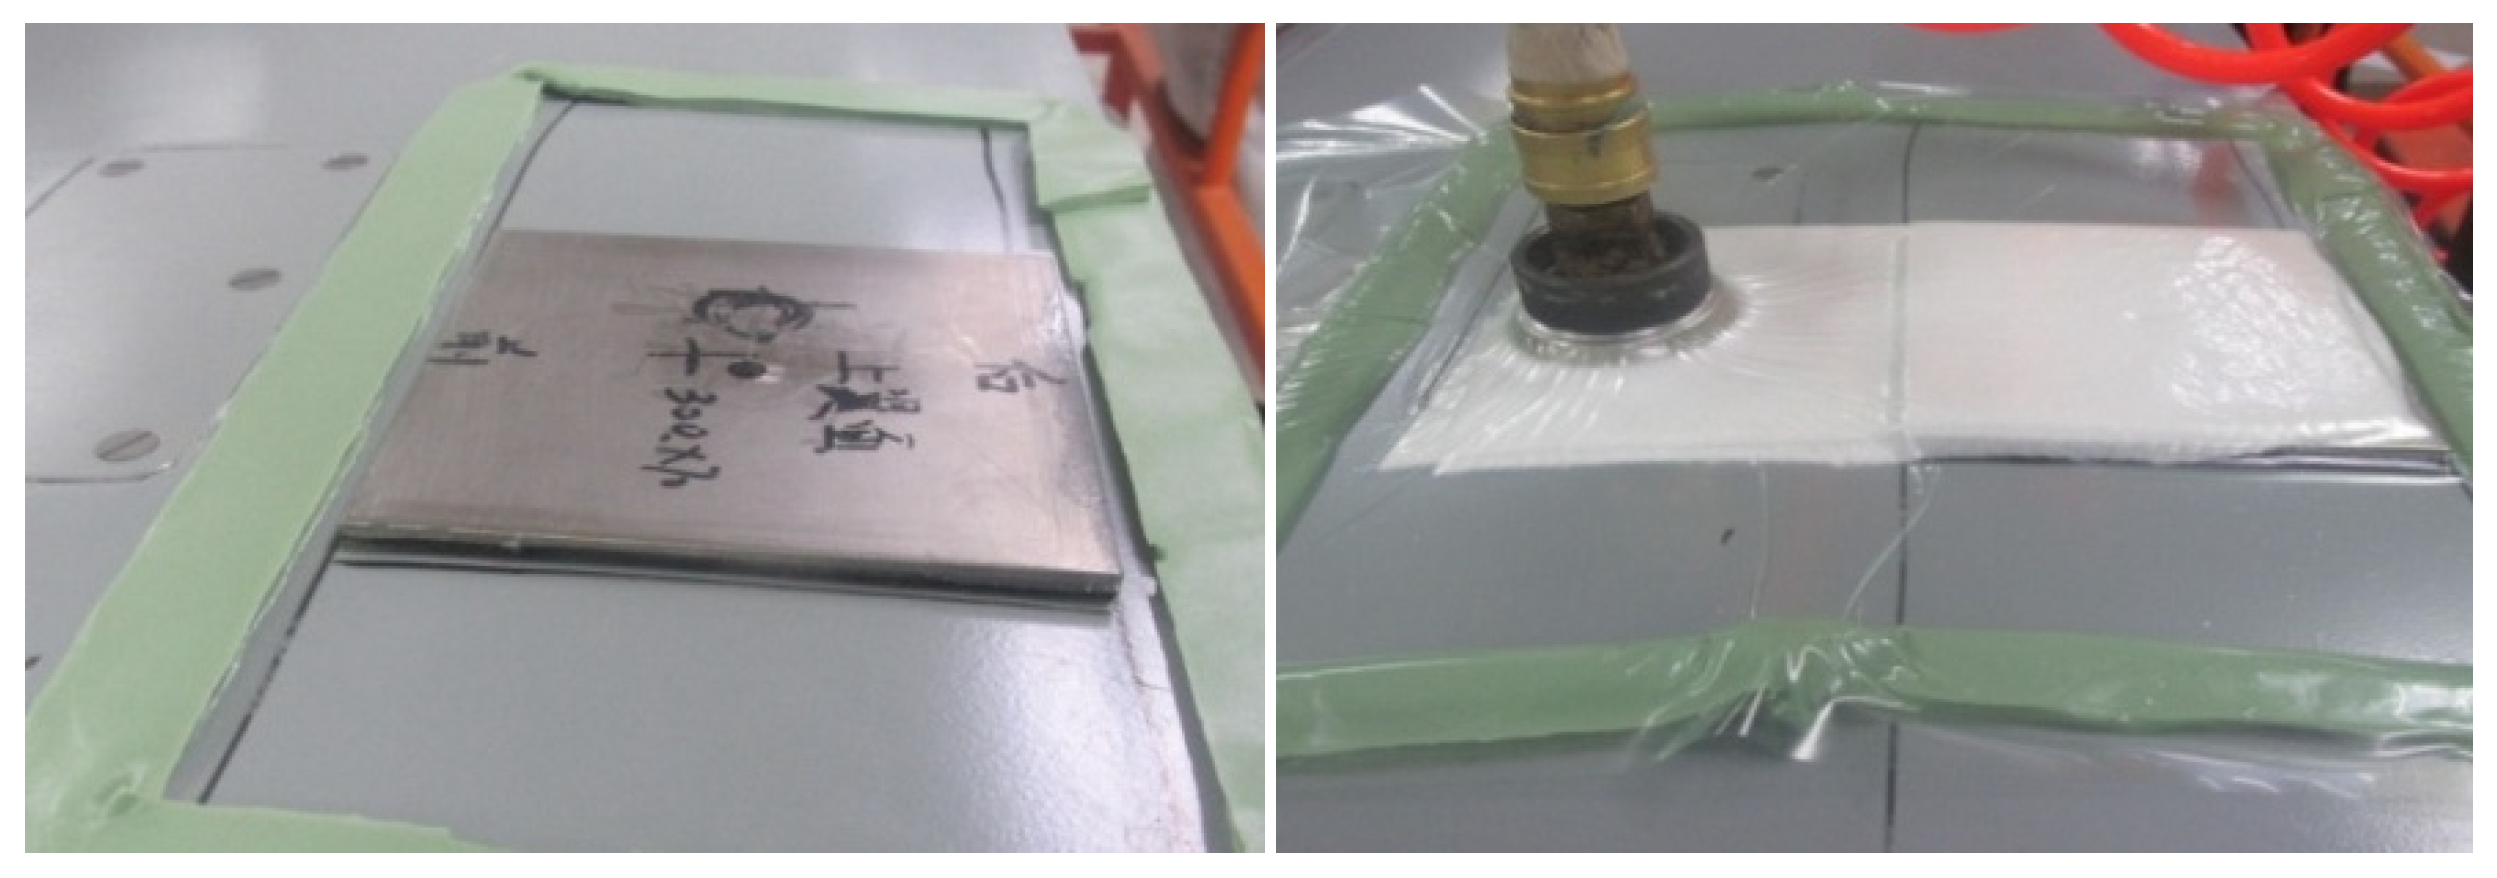
Select the local position 1 of the repaired area skin for the vacuum adsorption test, a single area of 100 × 100 mm2. The area to be tested is made of a metal plate cavity, and the repair area is made of the whole paste vacuum bag and pumped vacuum treatment. The negative pressure was controlled at 0.7–0.8 MPa, the duration was 10min. Compared with the results of skin percussion inspection and A-scan before and after adsorption, the skin in the adsorption area did not change (Figure 6).
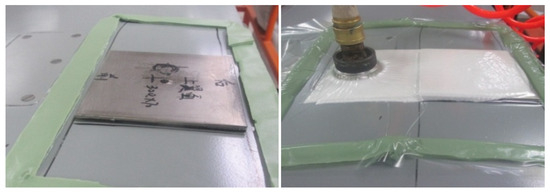
Figure 6.
Vacuum adsorption test of local area.
4.3.3. X-Ray Detection
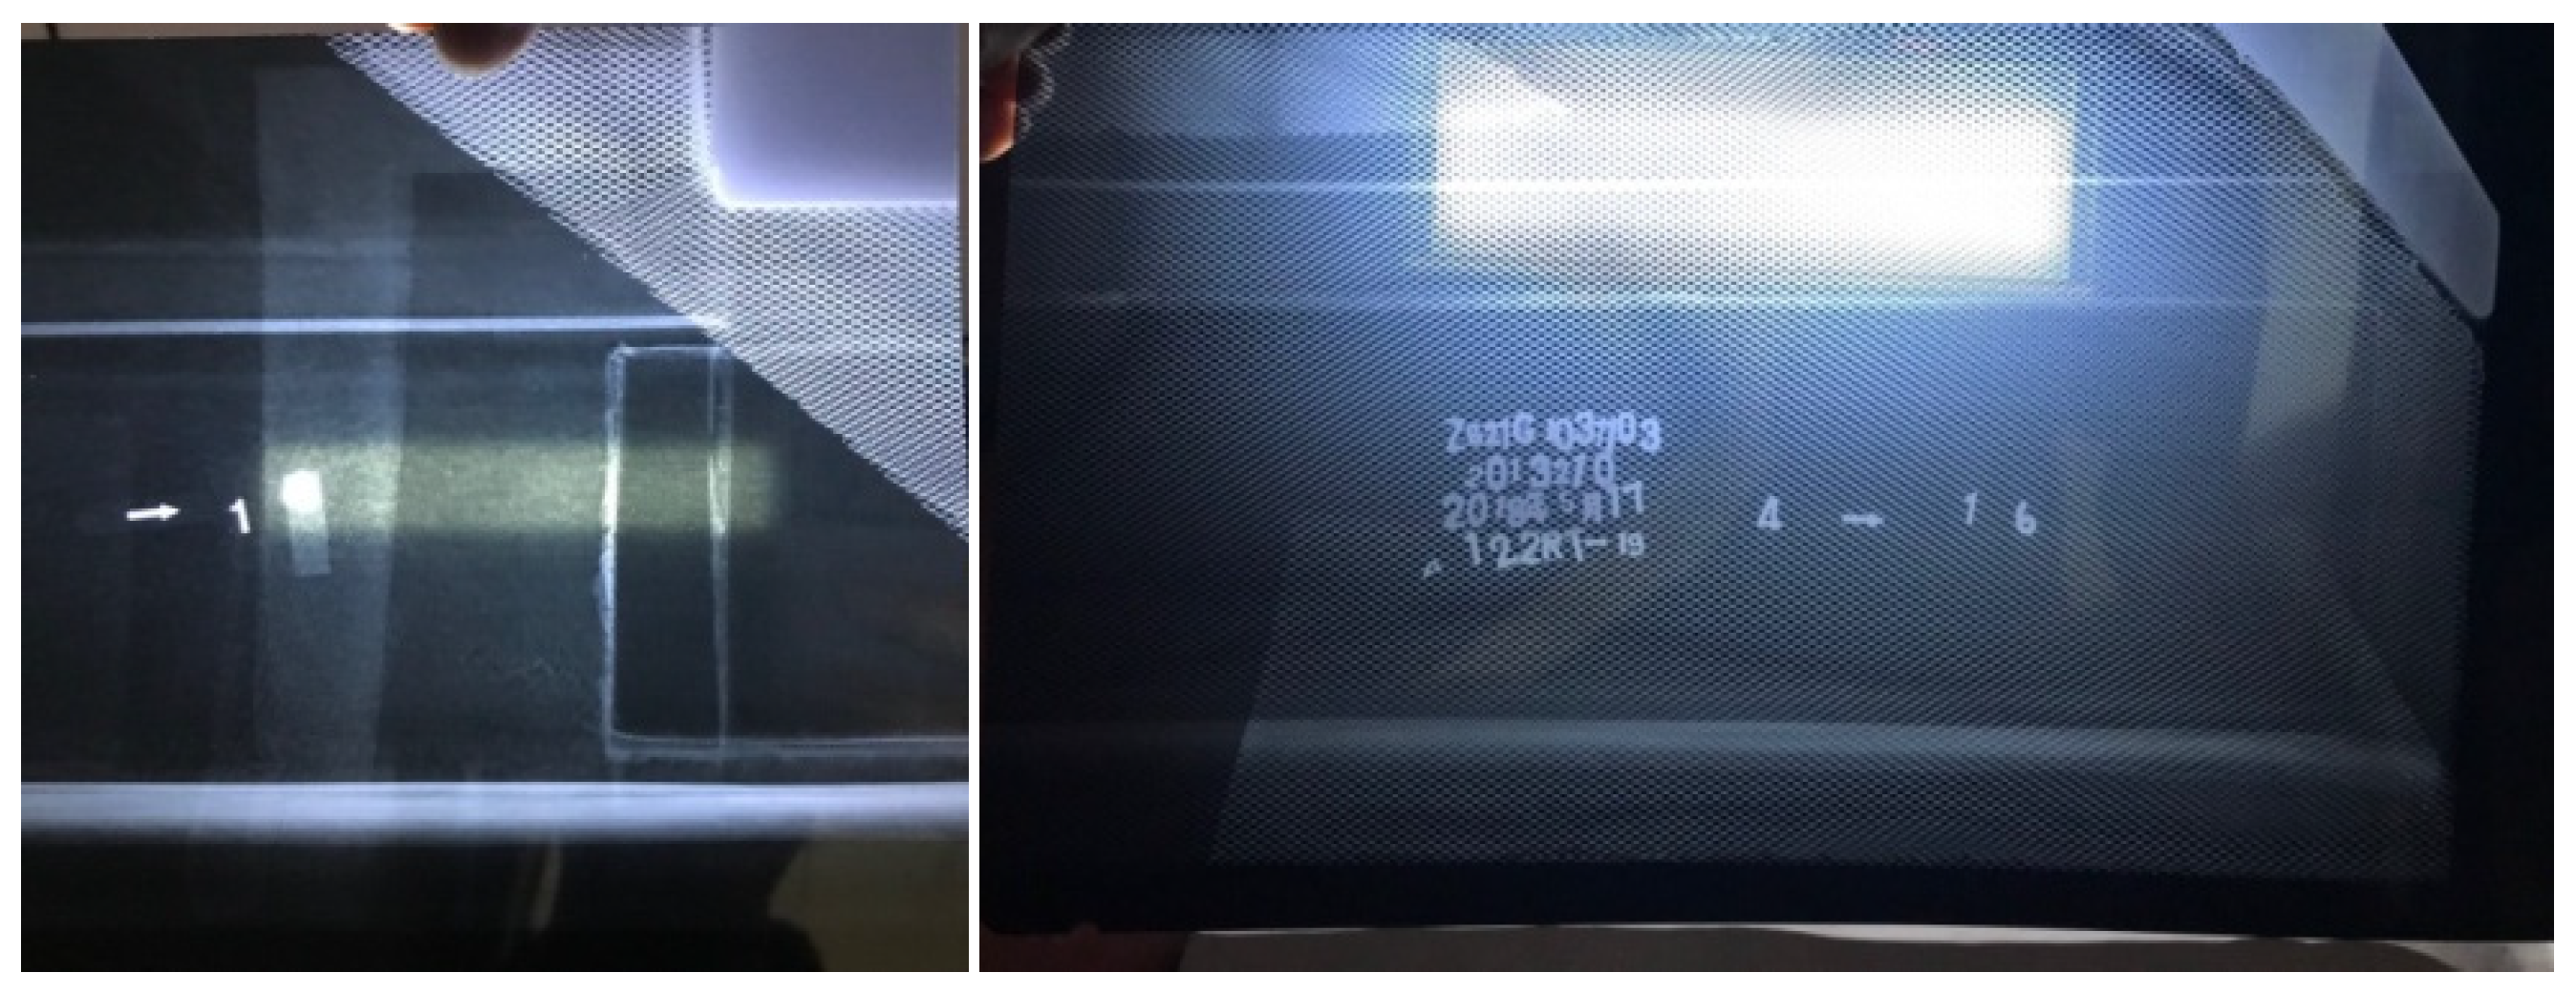
A sweep and X-ray test are carried out on the repaired faulty tail rotor blade, and there is no abnormality (Figure 7).

Figure 7.
X-ray inspection photo of fault area.
4.3.4. Blade Static and Dynamic Balance Test
The static and dynamic balance tests were carried out on the repaired faulty tail rotor blades, and the results met the requirements.
4.3.5. Pneumatic Shape Detection
The airfoil detection board was used to check the aerodynamic shape of key sections, and the results met the requirements.
4.3.6. Detection of Curing Degree, Glue Content, and Porosity
Typical repair blades were selected for the test of curing degree, glue content, and porosity, and the test results met the requirements of allowable values. The test results are shown in Table 2.
Table 2.
Test results of curing degree, glue content, and porosity.
4.4. Static Strength Test and Fatigue Test of Component Grade
4.4.1. Sampling Method of Test Parts
Sampling of Repair Area
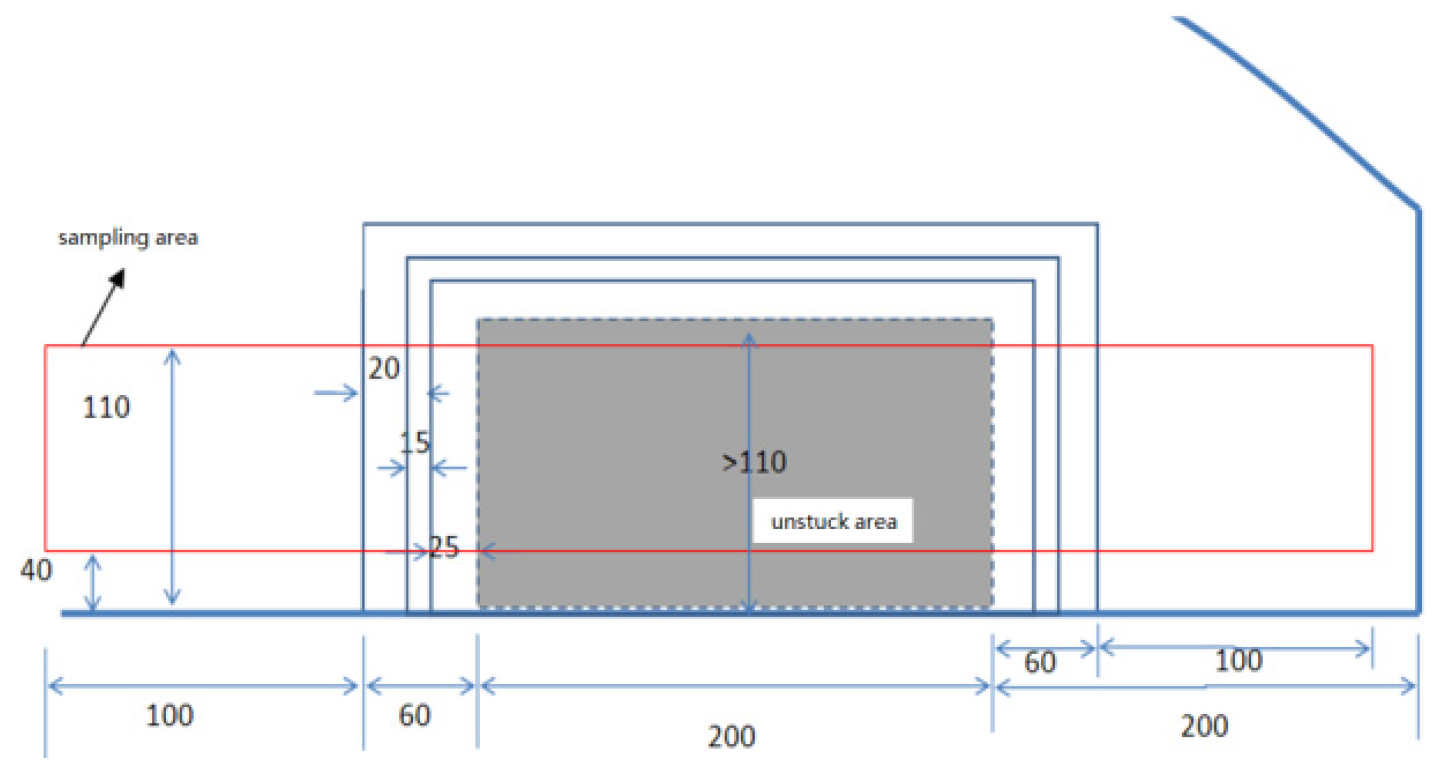
Select a typical specimen after repair, draw a line in the skin area with a marker, indicate the side close to the leading edge, cut the skin to a range of about 10mm larger than the wireframe, and use sandpaper to remove the foam. Remove the excess skin according to the red line frame trimming, and obtain the rectangular plate below (Figure 8 and Figure 9).
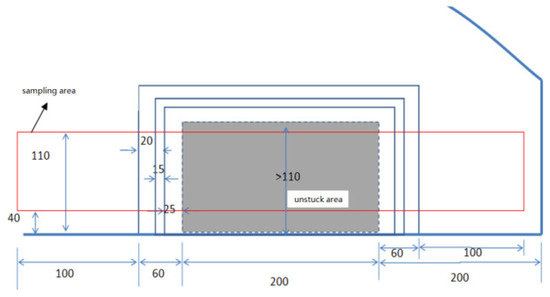
Figure 8.
Repair sample area schematic.
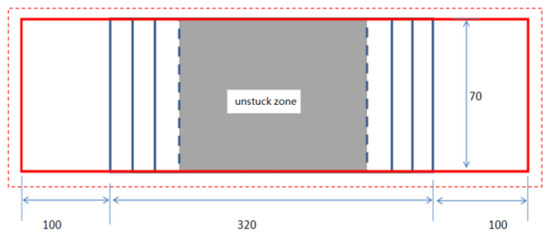
Figure 9.
Schematic diagram of cutting sampling.
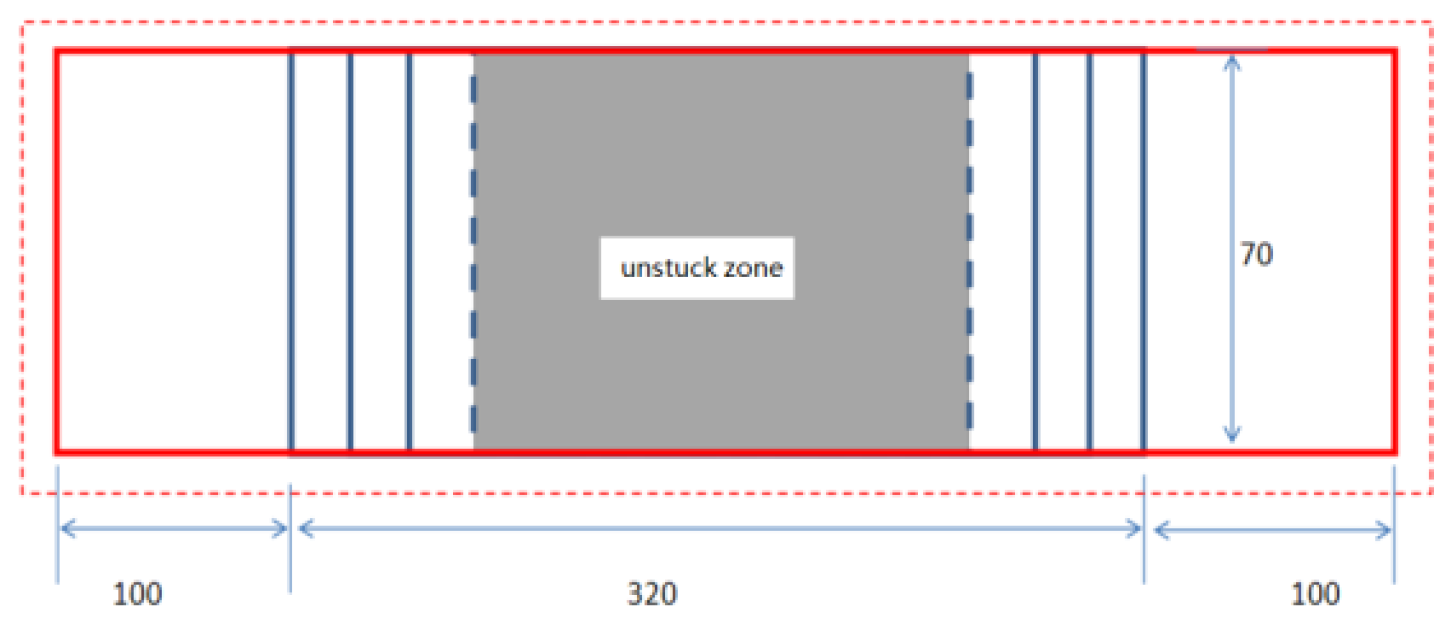
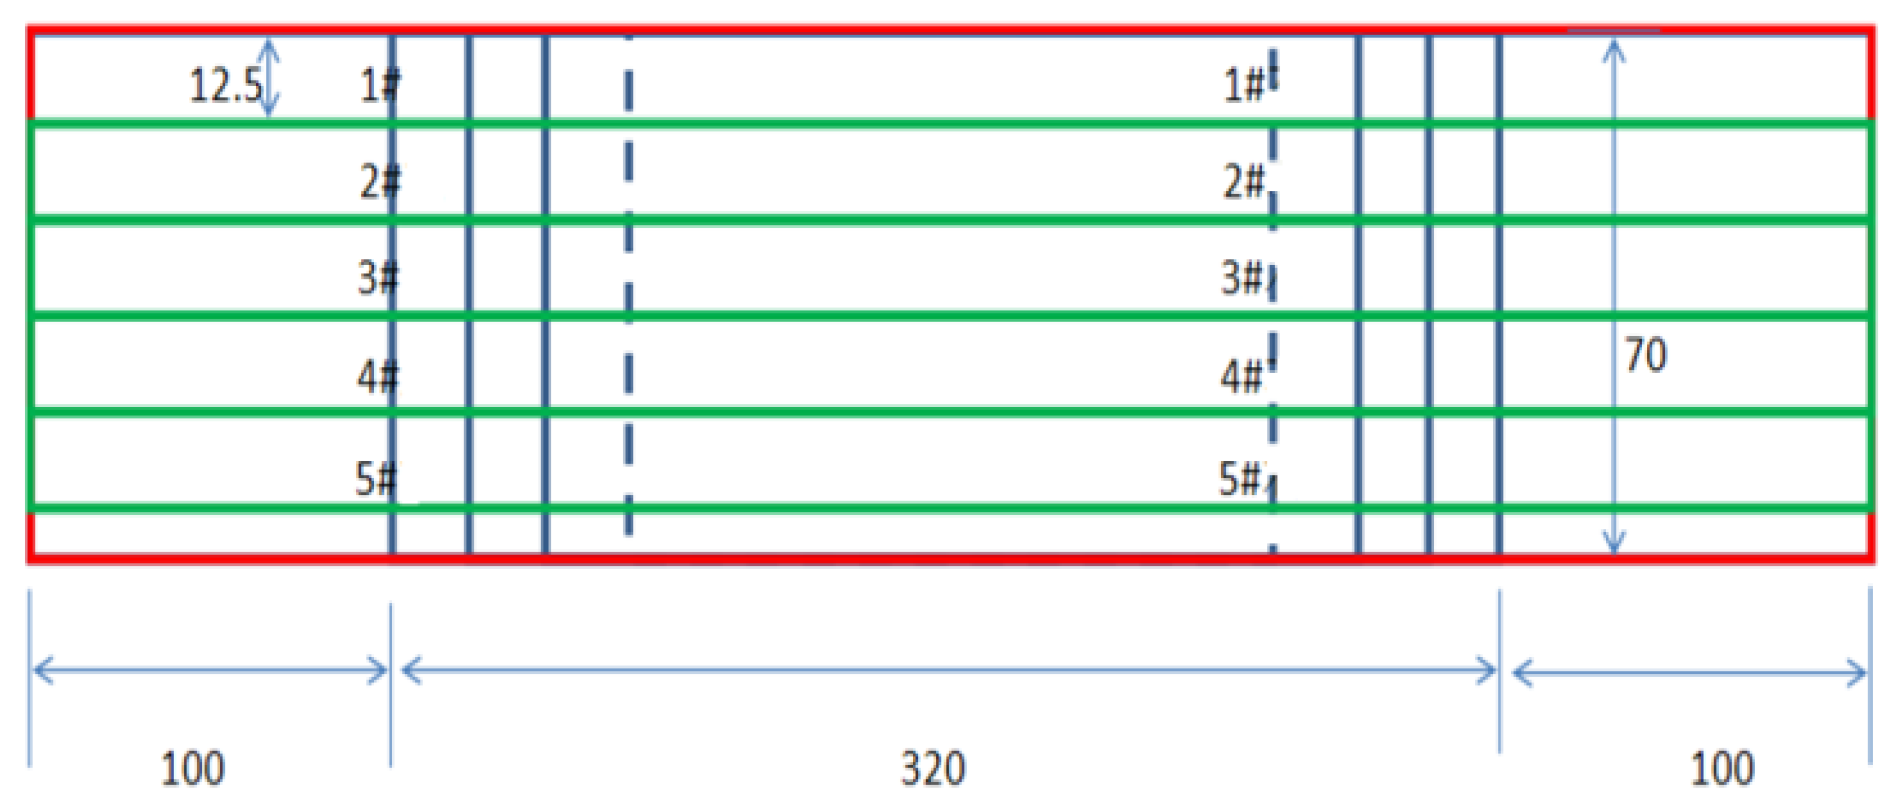
Start cutting near the leading edge and cut out five strips that are 330 mm long and 12.5 mm wide, as shown in the green line below (Figure 10). For ease of comparison, use a marker for numbering and repair the specimen number before the letter X to distinguish.
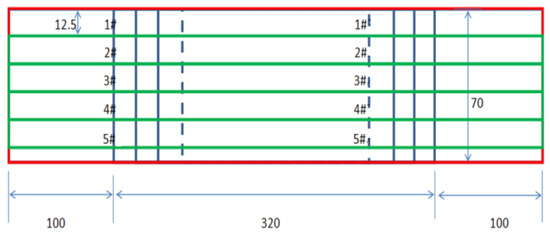
Figure 10.
Sampling diagram.
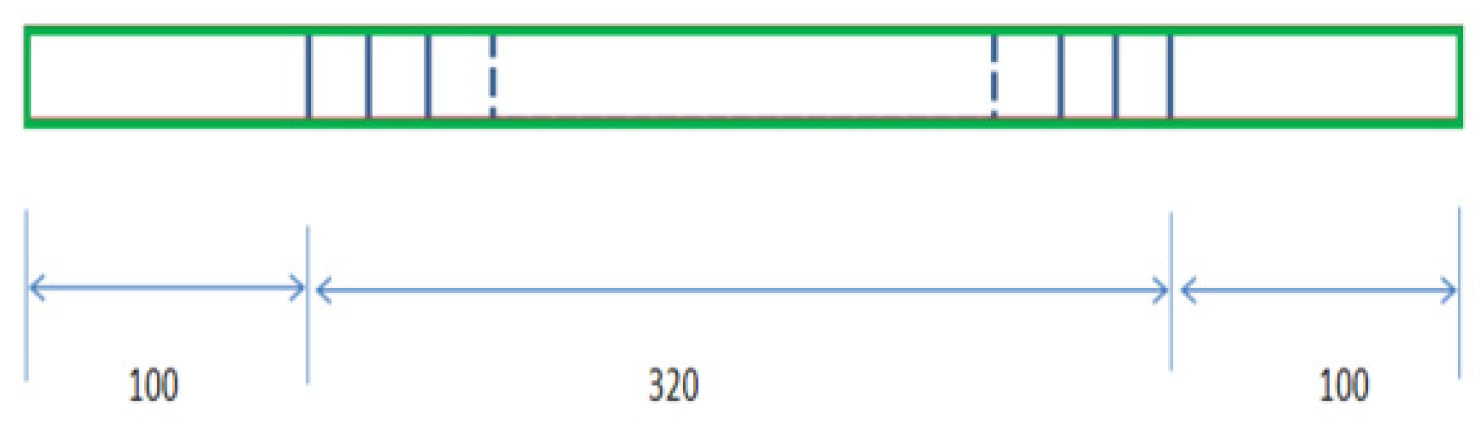
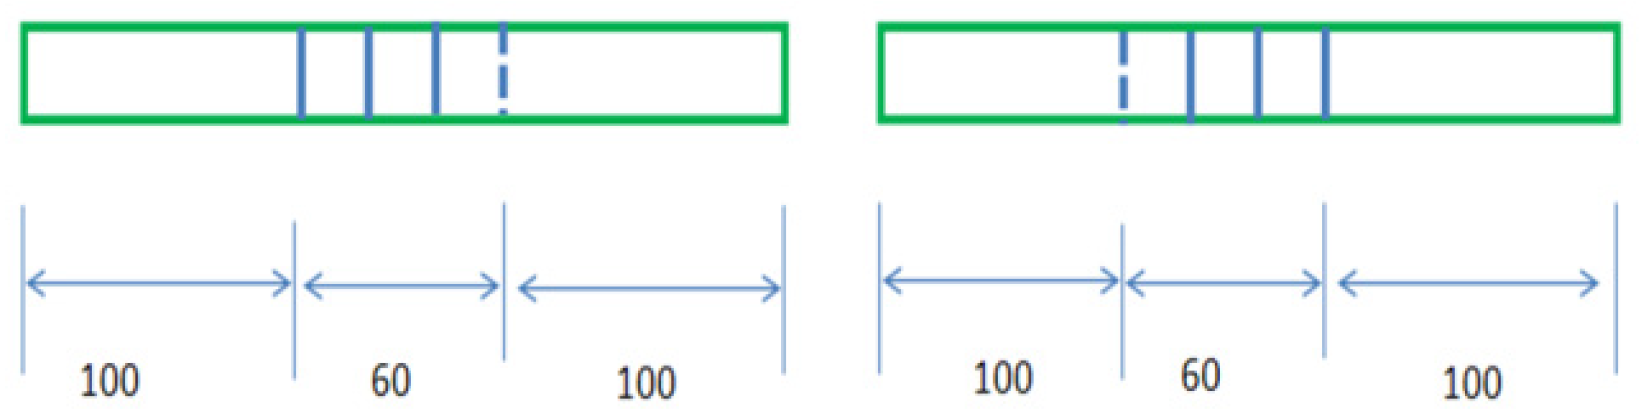
The width of 55 strips is 12.5 mm, and the test length is about 330 mm. Each strip is cut into two test pieces in the middle and cut into 5 × 2 = 10 small samples (Figure 11 and Figure 12).
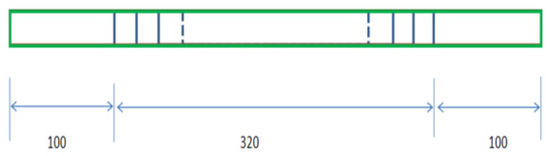
Figure 11.
Long strip specimen.
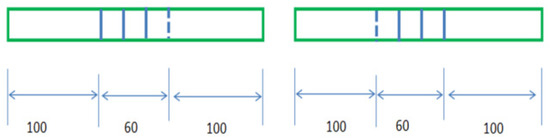
Figure 12.
Single specimen.
Unrepaired Blade Sample
Take out another piece of the remaining or scrapped blade tip of the unrepaired sampling test and prepare 5 × 2 = 10 samples according to the same position, size, and method. Note that the position and size are the same, the number is the same, and the letter w is added before the number of the unrepaired specimen.
4.4.2. Test Piece Manufacturing Method
Remove the foam, clean the skin with sandpaper, sand off the foam, clean the test piece, prepare for surface bonding, and protect the middle non-stick reinforced cloth area with Teflon tape to avoid glue running into the area (Figure 13).
(1) Cure and bond the reinforcing cloth during molding: 115 + 5 °C for 5 to 6 h; mold opening temperature: <60 °C; pressure: 0.2 ± 0.015 Mpa.
(2) Adjust to final size after cleaning, width tolerance 12.5 ± 0.5 mm, parallelism 0.02, and remove the protective Teflon tape.
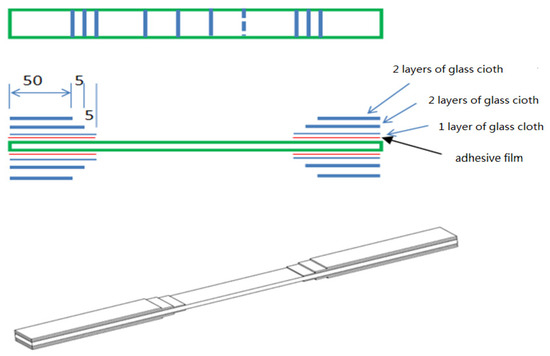
Figure 13.
Test piece manufacturing diagram.
Figure 13.
Test piece manufacturing diagram.

4.4.3. Static Strength Test Method and Results
The tensile test of the MTS machine, with a loading rate of 1–2 mm/min, and the test method are shown in Table 3.
Table 3.
Static strength test.
Strain gauge paste: stick a strain gauge in the middle of the test piece to measure the tensile strain. For the test piece to repair the bond, avoid the patch in the repair bond area. If there is glue in the patch area, it should be polished and removed (Figure 14).

Figure 14.
Position of strain gauge.
The results after the test are shown in Table 4.
Table 4.
Record sheet.
4.4.4. The Test Method and Results of the Fatigue Test
Adopt a test frequency of 5 Hz. The test method is shown in Table 5.
Table 5.
Fatigue strength test.
Table 6.
Fatigue test results of repaired parts.
Table 7.
Fatigue test results of unrepaired parts.
4.4.5. Date Analysis
According to the analysis of static test data, the comparison result of static strength limit between no repair and after repair is obtained. The static strength of the skin after repair is higher than that without repair for repairing skin; see Table 8.
Table 8.
Result of comparison of strength limits.
After sorting and analyzing the fatigue test data, the following fatigue test analysis results are obtained. It can be seen that the average logarithmic ratio between repaired and non-repaired is 82.5/81.4 = 1.01, the fatigue performance is the same, and the fatigue dispersion is lower than the material standard deviation of 0.046; the specific data are shown in Table 9.
Table 9.
Fatigue test analysis result.
4.4.6. Test Conclusion
According to the above static strength and fatigue strength test analysis results, the static strength of blade skin after repair is improved compared with that without repair, and the fatigue strength is the same.
4.5. Component and Fatigue Performance Test
After repair, according to the enhanced skin repair program, a total of four fatigue assessment and verification works were carried out. The specific test conditions and results are shown in Table 10.
Table 10.
Summary table of fatigue assessment tests.
According to the analysis, the repair plan has no effect on the fatigue life of the table [8].
5. Conclusions
(1) The repair technology has developed a large-area tail blade damage maintenance technical scheme through the verification work of component-level performance tests, dredging repair tests, fatigue tests, etc. The scheme has been applied in the repair work of large-area debonded damage of composite tail blades of a certain type of machine, breaking through the repairable area limitation of the repair technology of small-area debonded damage. It solves the bottleneck problem of the composite tail rotor blade returning to the factory for repair after the large-area debonded damage and avoids the scrap situation of the tail rotor blade due to the large-area debonded failure of the skin.
(2) This maintenance technology provides technical support for the overall quality stability of composite tail blades, provides a process method that can be used or used for reference for similar faults of other types of blade, and has great promotion value for the repair of composite single closed cavity structure blade. The results can also be applied to the development and production of composite materials in aerospace, ships, weapons, and other fields and have very important strategic significance for improving the comprehensive national strength.
Author Contributions
Conceptualization, M.R. and Q.L.; methodology, L.L.; software, N.L.; validation, M.R. and Q.L.; formal analysis, M.R.; investigation, M.R.; resources, Q.L.; data curation, M.R.; writing—original draft preparation, M.R.; writing—review and editing, M.R.; All authors have read and agreed to the published version of the manuscript.
Funding
This research received no external funding.
Institutional Review Board Statement
Not applicable.
Informed Consent Statement
Not applicable.
Data Availability Statement
The date is unavailable due to privacy.
Conflicts of Interest
Author Miao Ren, Qidi Liu, Nan Lv, Lili Li was employed by the company Avic Industry Harbin Aircraft Industry Group Co., Ltd. Authors declare the research was conducted in the absence of any commercial or financial relationships. Authors declare no conflict of interest.
References
- Yang, N.B.; Ni, X.P. Composite Structure Design of Helicopter; National Defense Industry Press: Beijing, China, 2008. [Google Scholar]
- Meng, L.; Cheng, X.Q.; Hu, R.W.; Xu, Y.Y. Material selection in helicopter composite rotor blade structure design. Hi-Tech Fiber Appl. 2014, 39. [Google Scholar]
- Guo, J.X.; Hu, H.P.; Fan, G.H.; Li, M. Structural design and research of a pair of domestic composite rotor blades. In Proceedings of the 16th Annual National Helicopter Conference, San Diego, CA, USA, 9–12 April 2001. [Google Scholar]
- Wang, Z.G.; Xu, F.Q.; Liu, Q.D. Research on automatic manufacturing. Aeronaut. Manuf. Technol. 2018. [Google Scholar]
- Guo, J.X.; Fan, G.H. Application of domestic composite materials in the development of helicopter rotor blade. Helicopter Technol. 1988. [Google Scholar]
- Xie, F.Y. Advanced Composite Manufacturing Technologu; Aviation Industry Press: Beijing, China, 2017. [Google Scholar]
- Li, Z.F.; Fan, G.H.; Fang, Y.H.; Deng, J.H. Weight control in the development of composite rotor blades and analysis. In Proceedings of the 23rd National Helicopter Annual Conference, Chengdu, China, 7–9 August 2007. [Google Scholar]
- Liu, D.J. Analysis of several problems in the development of composite rotor blades. Helicopter Technol. 2002. [Google Scholar]

Disclaimer/Publisher’s Note: The statements, opinions and data contained in all publications are solely those of the individual author(s) and contributor(s) and not of MDPI and/or the editor(s). MDPI and/or the editor(s) disclaim responsibility for any injury to people or property resulting from any ideas, methods, instructions or products referred to in the content. |
© 2025 by the authors. Licensee MDPI, Basel, Switzerland. This article is an open access article distributed under the terms and conditions of the Creative Commons Attribution (CC BY) license (https://creativecommons.org/licenses/by/4.0/).