Proceeding Paper

Agrivoltaics: A Digital Twin to Learn the Effect of Solar Panel Coverage on Crop Growth †

Department of Civil and Environmental Engineering, Politecnico di Milano, 20133 Milano, Italy
*
Author to whom correspondence should be addressed.
Presented at the 11th International Electronic Conference on Sensors and Applications (ECSA-11), 26–28 November 2024; Available online: https://sciforum.net/event/ecsa-11.
Eng. Proc. 2024, 82(1), 5; https://doi.org/10.3390/ecsa-11-20486
Published: 26 November 2024

Abstract

:
Agrivoltaics is defined as “the dual use of land for solar energy production and agriculture”. On this topic, a number of issues are still to be properly addressed, e.g., how the shading effect of the solar panels affects crop growth. In this work, the development of a large-scale digital twin model to predict crop yield under varying solar panel coverage is discussed. A framework is proposed to exploit Internet of Things (IoT) concepts, with a sensor network to collect data on the field merged with sensor fusion to possibly handle information gathered by satellite images. The aim of the entire work is related to the synergic optimization of energy production and crop yield, and data analytics based on artificial intelligence tools are to be extensively developed. Herein, the results are reported of an experimental activity, currently under way at the Fantoli laboratory of Politecnico di Milano. Wooden panels, placed above the crops with a varying pattern, are used to study the shading effect with a specific target on the conditions typical of Northern Italy. The laboratory facility is equipped with a comprehensive sensor network to acquire the data necessary to build the targeted large-scale digital twin of the agrivoltaic system.

1. Introduction

The global demand for both food and renewable energy continues to rise, putting increasing pressure on land resources [1]. Agrivoltaics, defined as “the dual use of land for solar energy production and agriculture”, has emerged as a promising solution to address this challenge [2]. This innovative approach aims to optimize land use by combining photovoltaic (PV) panels with crop cultivation, potentially increasing overall land productivity and contributing to sustainable development goals [3].
However, the implementation of agrivoltaic systems presents complex challenges that require careful consideration and further research. One of the primary concerns is understanding how the shading effect of solar panels impacts crop growth and yield [4]. The altered microclimate beneath PV panels, including changes in temperature, light intensity, and soil moisture, can significantly influence plant physiology and productivity [5].
To address these challenges and optimize agrivoltaic systems, there is a growing need for comprehensive studies that integrate advanced monitoring technologies and predictive modeling. The development of large-scale digital twin models, leveraging Internet of Things (IoT) concepts and artificial intelligence tools, offers a promising approach to predict crop yield under varying solar panel coverage scenarios [6].
This study aims to contribute to the growing body of knowledge on agrivoltaics by investigating the effects of partial shading on grass growth in a controlled laboratory environment. By utilizing an advanced lysimeter system equipped with a comprehensive sensor network, we seek to simulate and analyze the complex interactions between solar panels and crop growth. The findings from this research will provide valuable insights for the design and optimization of agrivoltaic systems, particularly in conditions typical of Northern Italy.
The present work discusses the development of an experimental framework to study these interactions, focusing on grass as a baseline crop. Through a series of experiments comparing unshaded and partially shaded conditions, we aim to elucidate the impacts of shading on various environmental parameters and crop yield. Additionally, this study lays the groundwork for future research involving more complex crop systems and the integration of machine learning tools for yield prediction.

2. Methods

2.1. Experimental Equipment

This study utilized an advanced laboratory lysimeter system located in the Gaudenzio Fantoli laboratory at Politecnico di Milano. The lysimeter, measuring 1.5 m × 1.5 m × 1 m, was filled with carefully prepared silty-clay soil. This setup provided an ideal controlled environment for crop growth studies, particularly for investigating agrivoltaic systems.
The lysimeter system was equipped with a comprehensive array of instruments to monitor and measure various environmental parameters:
  • Soil temperature and moisture sensors: multiple probes (5TM Meter) were installed to measure soil temperatures and moisture at various locations at 10 cm within the lysimeter;
  • Light sensors: an Arduino-based light sensors were placed at various positions across the lysimeter to measure light intensity and distribution;
  • Radiation Sensor: a radiometer (CNR 1 by Kipp and Zonen) was mounted to measure incoming and outgoing shortwave and longwave radiation, providing data on the energy balance within the system;
  • Air temperature and air humidity sensor: a thermohydrometer from Vaisala was installed to monitor the relative air humidity and air temperature above the crop canopy.
To reproduce the real-world environment, the lysimeter was equipped with the following facilities:
  • Lighting System: Four 400 W halogen lamps provided the primary light source, simulating sunlight and one 300 W infrared/ultraviolet lamp supplied supplementary radiation, ensuring spectral comprehensiveness. Light is provided only at nadir;
  • Drip Irrigation System: This allowed precise control of water input, enabling the simulation of precipitation scenarios;
  • Data Acquisition System: A central data logger continuously recorded measurements from all sensors at programmable intervals;
  • Weighing System: The entire lysimeter was placed on a large scale to monitor overall mass changes, providing data on evapotranspiration and water balance.

2.2. Crop Selection

Grass was selected as the primary experimental crop for this study, due to its significant coverage in the Lombardy region and its suitability for a baseline analysis with simple growth characteristics. This choice allowed a clear understanding of partial shading effects in the agrivoltaic systems.
While focusing on grass in this initial stage of the research activity, the study is designed to be expandable in the future to other common regional crops, like fresh vegetables and wheat, by establishing a robust methodology that can be applied to more complex agricultural systems.

2.3. Experimental Setup

The present study consisted of three primary experimental setups, that are detailed in the following:
Experiment 1: Baseline (No Shading)
This experiment was conducted from 7 March 2024 to 16 April 2024. Grass was grown in the lysimeter under full exposure to the artificial lighting system, without any shading structures. As the lysimeter features a 15 cm border on all sides where the irrigation system could not reach, the resulting effective planting area was 1.2 m × 1.2 m. This first experiment served as a control baseline, representing standard growing conditions without the influence of PV panels.
Experiment 2: Continuous Partial Shading (Figure 1)
This experiment ran from 7 June 2024 to 4 July 2024, simulating an agrivoltaic system using wooden panels to mimic real conditions. The specific setup was as follows:
  • Effective planting area: 1.2 m × 1.2 m;
  • Panel arrangement: The effective area was divided into three equal rows of 0.4 m in width and 1.2 m in length each;
  • Shading structure: Panels were installed over the two lateral rows, leaving one row in the middle unshaded;
  • Panel composition: Each row consisted of 6 individual panels, each measuring 20 cm × 40 cm;
  • Panel height: The panels were elevated 30 cm above the crop surface;
  • Unshaded area: One row (0.4 m × 1.2 m) remained completely unshaded, creating a mixed light environment within the lysimeter.
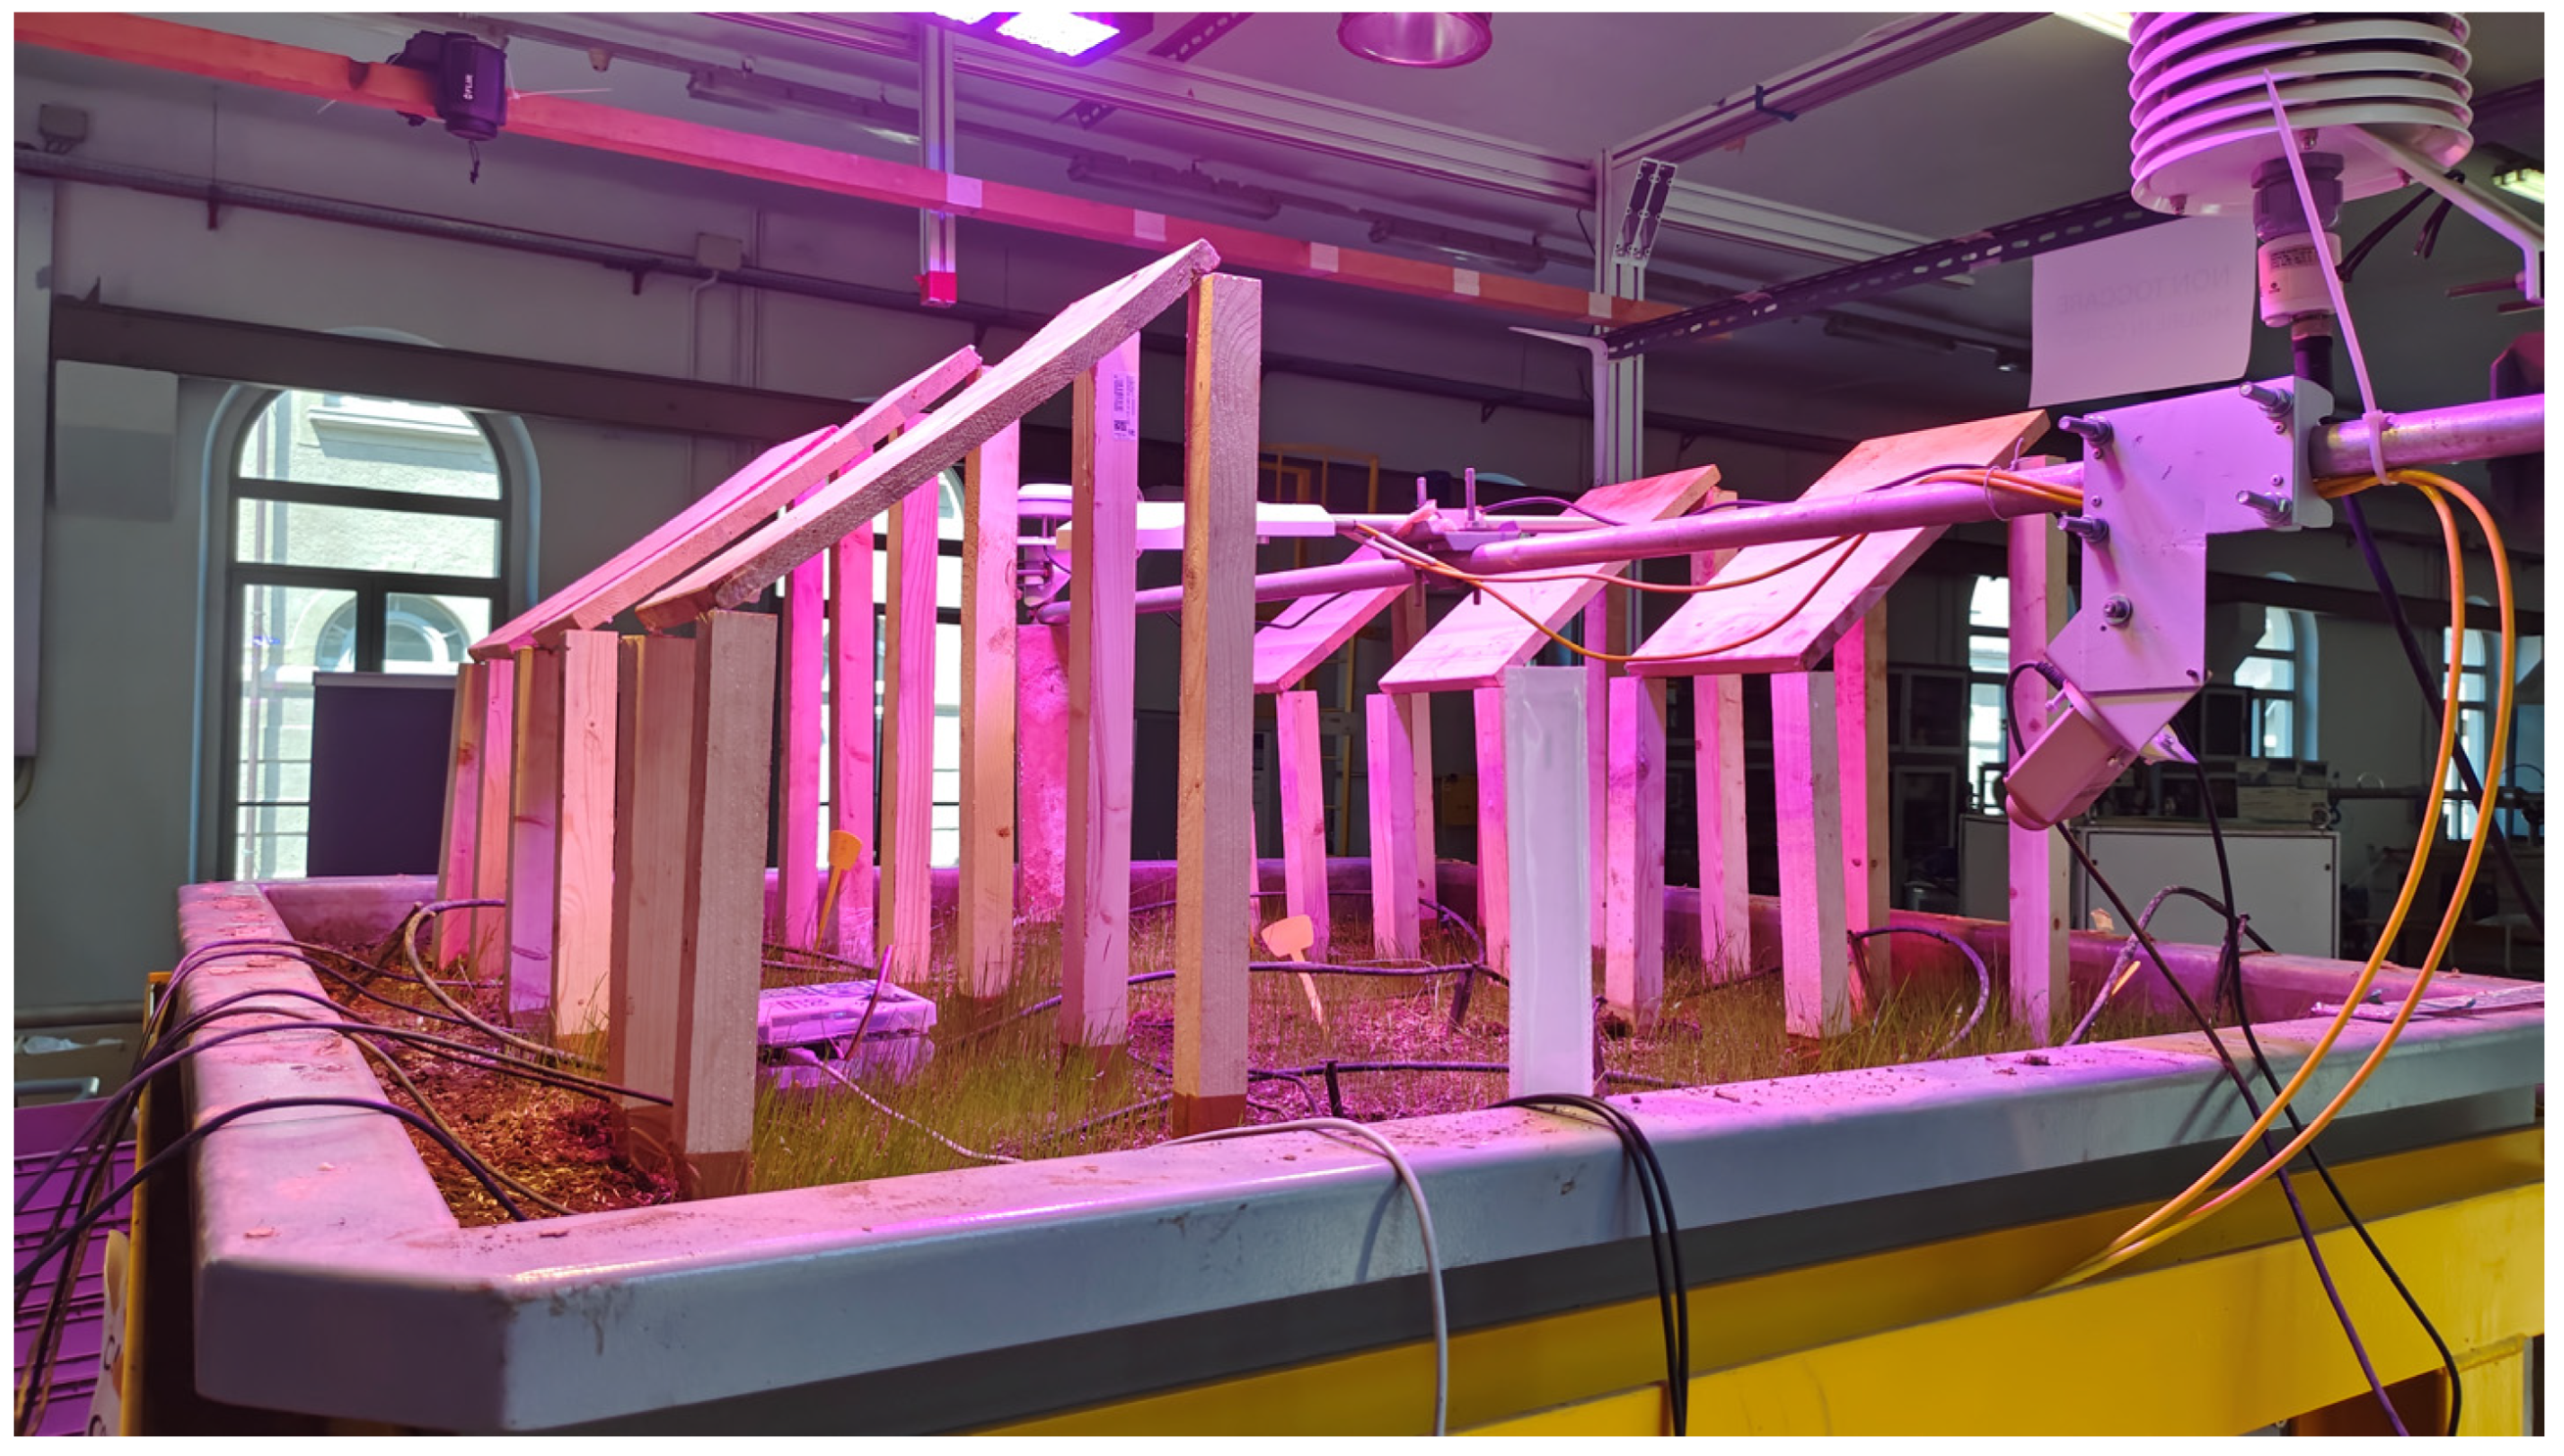
Experiment 3: Intermittent Partial Shading (Figure 2)
This experiment was conducted from 4 July 2024 to 26 July 2024, simulating an agrivoltaic system with intermittent shading to more closely mimic real-world conditions. The setup was as follows:
  • Effective planting area: 1.2 m × 1.2 m;
  • Panel arrangement: The effective area was divided into three equal rows of 0.4 m in width and 1.2 m in length each;
  • Shading structure: Panels were installed over the two lateral rows, but with gaps between panels, leaving one row in the middle completely unshaded;
  • Panel composition: Each row consisted of 3 individual panels, each measuring 20 cm × 40 cm, with 20 cm gaps between panels;
  • Panel height: The panels were elevated 30 cm above the crop surface;
  • Unshaded area: One row (0.4 m × 1.2 m) remained completely unshaded, creating a mixed light environment within the lysimeter.
This third experiment aimed to investigate how intermittent shading, which more closely resembles the dynamic light conditions in real agrivoltaic systems, affects crop growth and yield compared to continuous shading and no shading conditions.
It is important to note that the three experiments had different durations due to seasonal timing and logistical constraints, as well as different environmental conditions. Despite this difference in growth periods, the study’s design allows for meaningful comparisons. In future analyses, advanced machine learning models will be employed to normalize the data and infer the impact of various crop indicators on yield across different growth durations.

3. Results and Discussion

3.1. Experiment Results

3.1.1. Air Temperature

Table 1 shows significant temperature differences among the three experiments. Experiment 3 had the highest mean temperature (28.16 °C), followed by Experiment 2 (24.57 °C) and Experiment 1 (20.39 °C).
These temperature variations likely impact grass growth differently. While all temperatures fall within or near the optimal range for most grass species (20–30 °C), the higher temperatures in Experiments 2 and 3 might enhance photosynthesis and growth rates, but they also increase evapotranspiration and water demand. Experiment 3’s temperature, approaching the upper optimal limit, may introduce heat stress factors.

3.1.2. Light Levels

Figure 3 compares light levels between Experiment 2 and Experiment 3 over time, as measured by a movable light sensor.
In Experiment 2, the light patterns show two distinct levels, corresponding to areas under the panels and outside the panels. The consistent alternation between high and low light levels reflects the sensor’s movement between these two areas.
Experiment 3 exhibits more varied light patterns due to its intermittent panel arrangement. The fluctuations in light levels represent three distinct scenarios: areas under panels, areas between panels, and fully exposed areas. This results in a more dynamic light environment, with the sensor capturing low, medium, and high light intensities as it moves across these different zones.
These differences in light distribution between the two experiments simulate varying conditions in agrivoltaic systems, potentially leading to diverse impacts on plant growth and development across the experimental area.

3.1.3. Radiation

The radiation data revealed significant differences among Experiments 1, 2, and 3, as shown in Table 2. Notably, both Experiments 2 and 3 exhibited substantially higher incoming shortwave radiation compared to Experiment 1. These conditions could potentially enhance photosynthesis and overall plant productivity in Experiment 2.
Experiment 3 showed the highest average incoming shortwave radiation (119.20 ± 154.03), followed closely by Experiment 2 (112.32 ± 163.62), both significantly higher than Experiment 1 (30.37 ± 85.55). This substantial increase in radiation levels in Experiments 2 and 3 was due to external conditions, with natural sunlight entering from the windows for longer periods during these experiments compared to Experiment 1.
The higher radiation levels in Experiments 2 and 3 could potentially enhance photosynthesis and overall plant productivity.

3.1.4. Soil Moisture

Figure 4 illustrates the soil moisture dynamics across the three experiments, with two probes used in each experiment to measure soil moisture at different locations.
In Experiment 1, both Probe 1 and Probe 2 were directly exposed to light. The soil moisture levels for both probes show similar patterns, with values ranging approximately between 0.175 and 0.275.
For Experiments 2 and 3, Probe 1 was placed under the panels, while Probe 2 was directly exposed to light.
This setup reveals distinct differences in soil moisture patterns:
  • In Experiment 2, Probe 1 (under panel) consistently shows higher soil moisture levels (ranging from about 0.25 to 0.31) compared to Probe 2 (exposed, ranging from about 0.15 to 0.25). This suggests that the panels effectively reduce evaporation, leading to higher soil moisture retention underneath;
  • Experiment 3 displays a similar trend, with Probe 1 (under panel) maintaining higher soil moisture levels compared to Probe 2 (exposed). However, the difference between the two probes appears less pronounced than in Experiment 2, possibly due to the intermittent panel arrangement allowing lighter and air circulation.
These observations indicate that the presence of panels significantly influences soil moisture distribution, with shaded areas retaining more moisture. This effect is most pronounced in the continuous panel setup (Experiment 2) and is slightly moderated in the intermittent panel arrangement (Experiment 3).

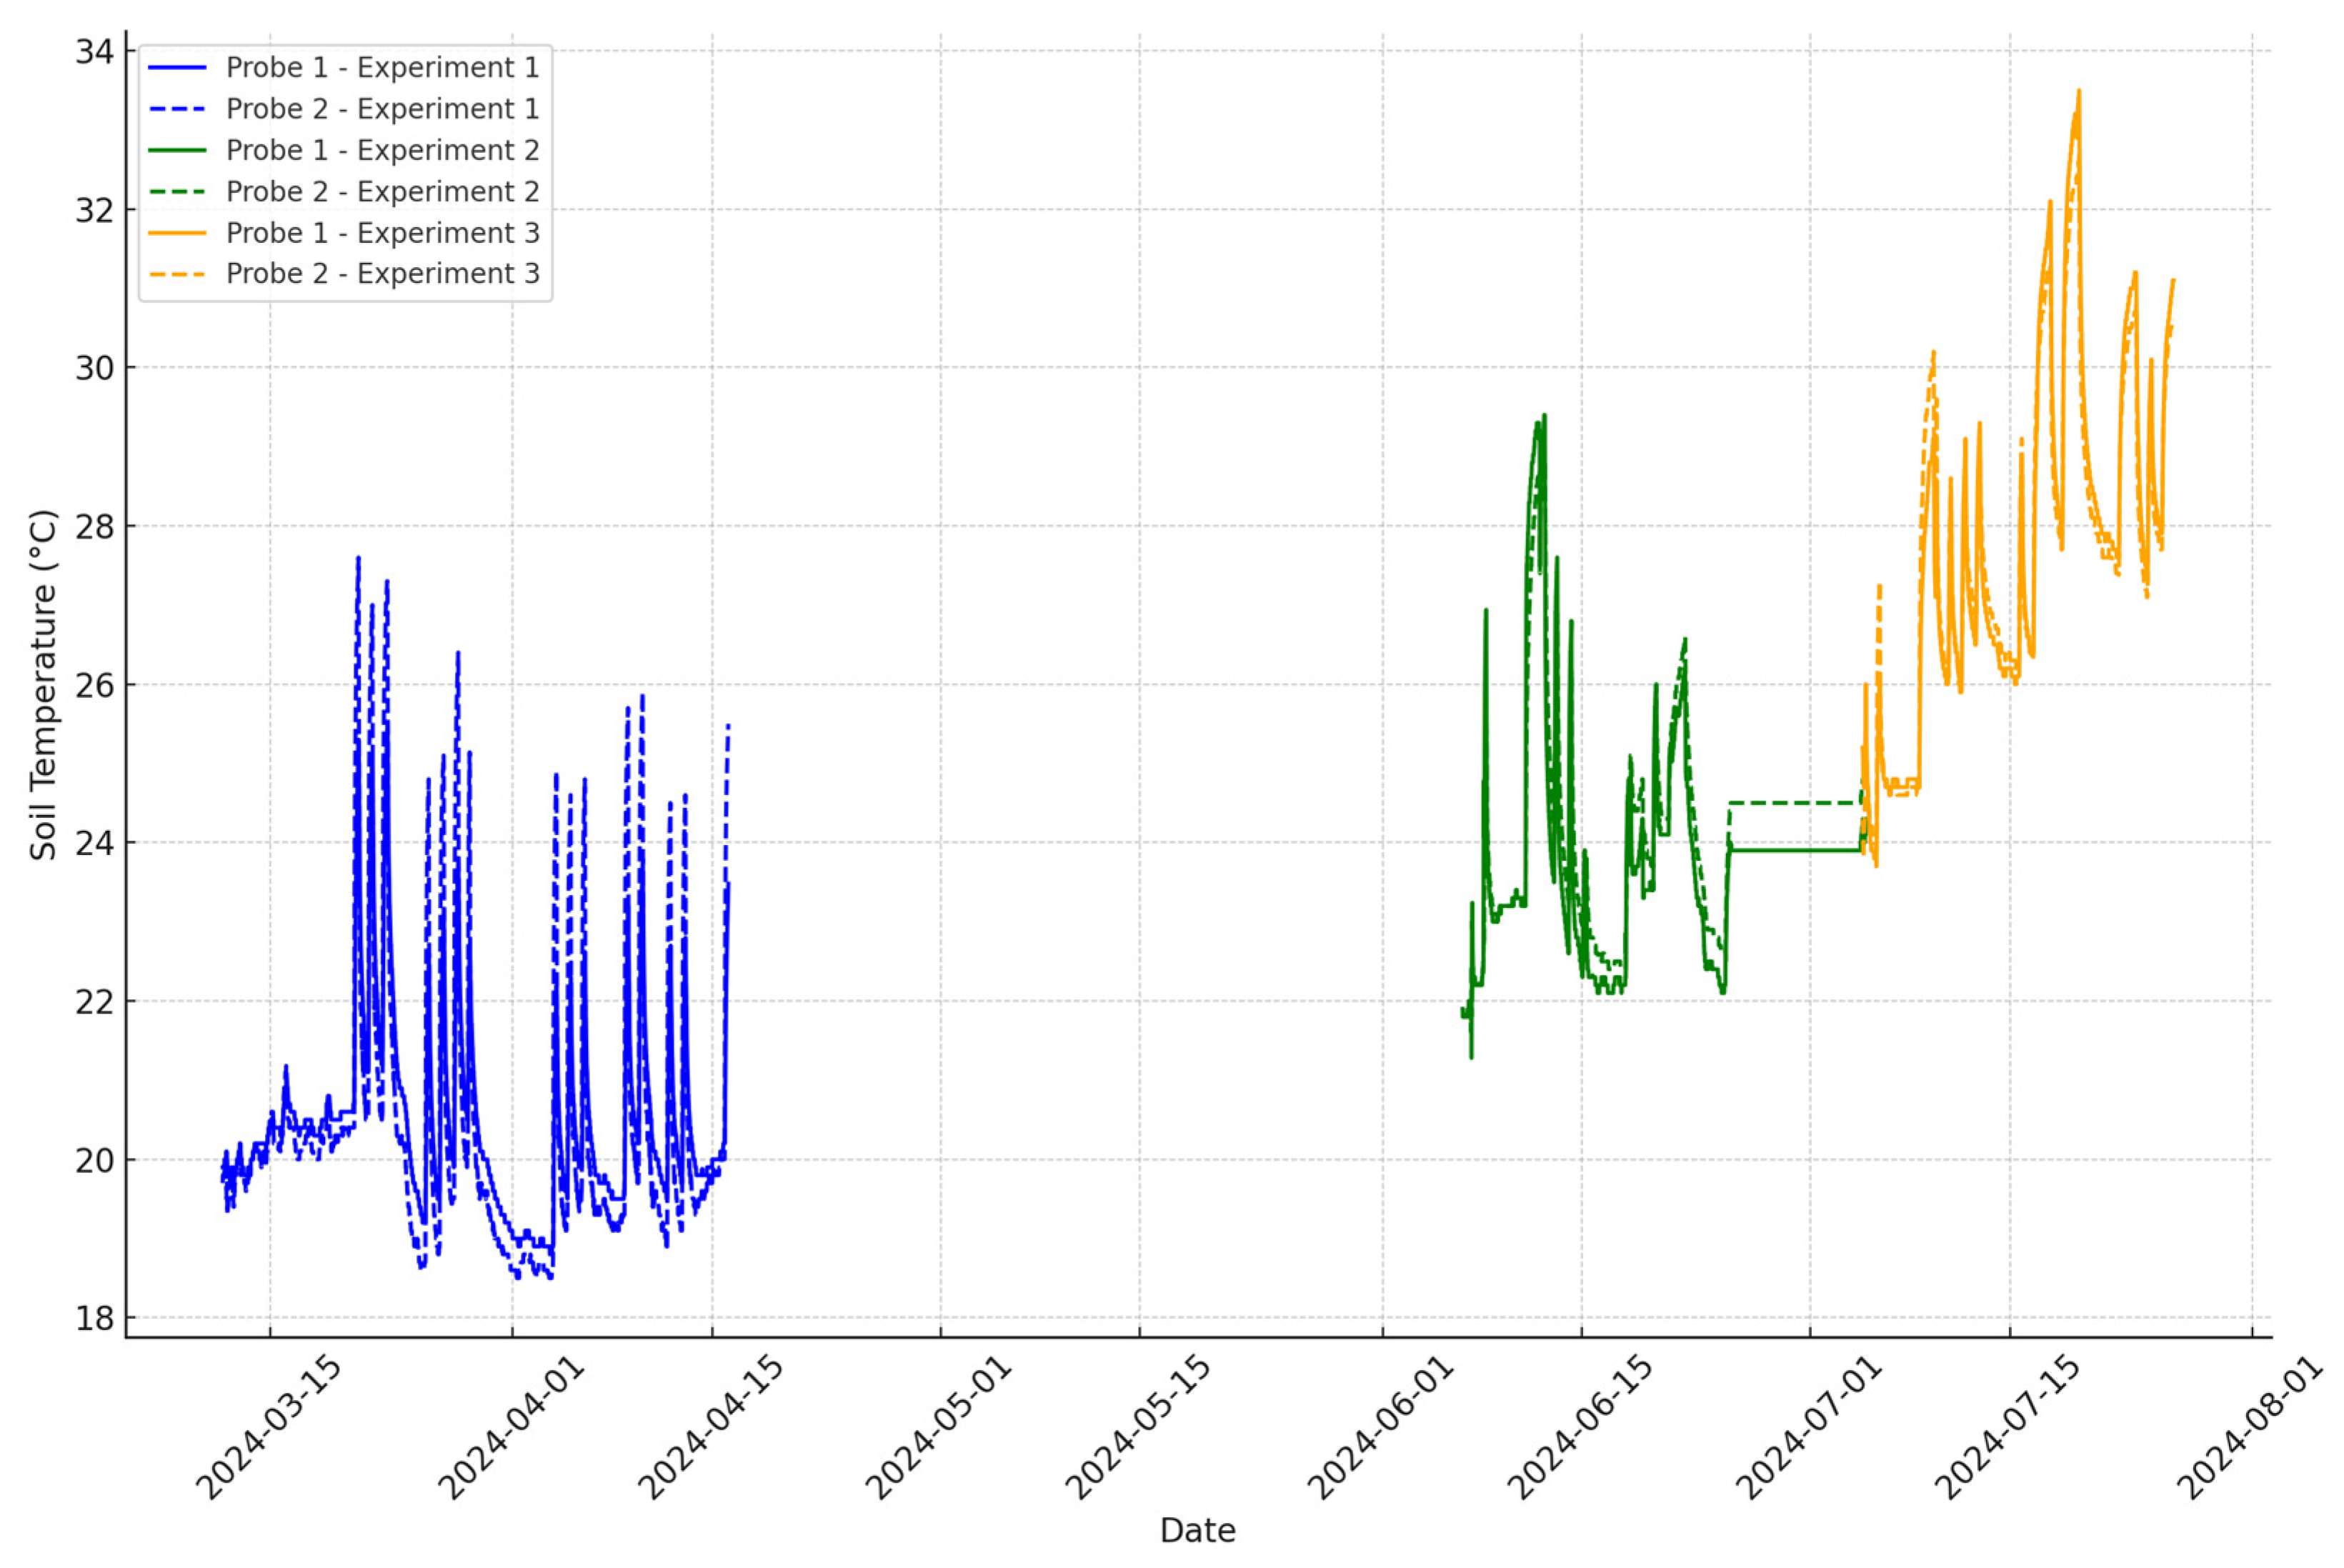
3.1.5. Soil Temperature

Figure 5 illustrates soil temperature patterns across the three experiments. Experiment 1 showed the lowest temperatures (18–22 °C), with uniform conditions across both probes.
Experiment 2 demonstrated higher temperatures (22–29 °C), averaging 4–5 °C above Experiment 1. Little difference was observed between the probes, suggesting minimal impact of panel shading on soil temperature.
Experiment 3 exhibited the highest and most variable temperatures (24–33 °C), with noticeable differences between probes. The intermittent panel arrangement created a more dynamic thermal environment.
These significant temperature variations, particularly the 4–5 °C increase in Experiments 2 and 3, are highly relevant for crop growth. Higher temperatures could accelerate biological processes but may increase water demand. The observed differences highlight the impact of panel configurations on soil thermal conditions, creating distinct microclimates within agrivoltaic systems.

3.1.6. Yield

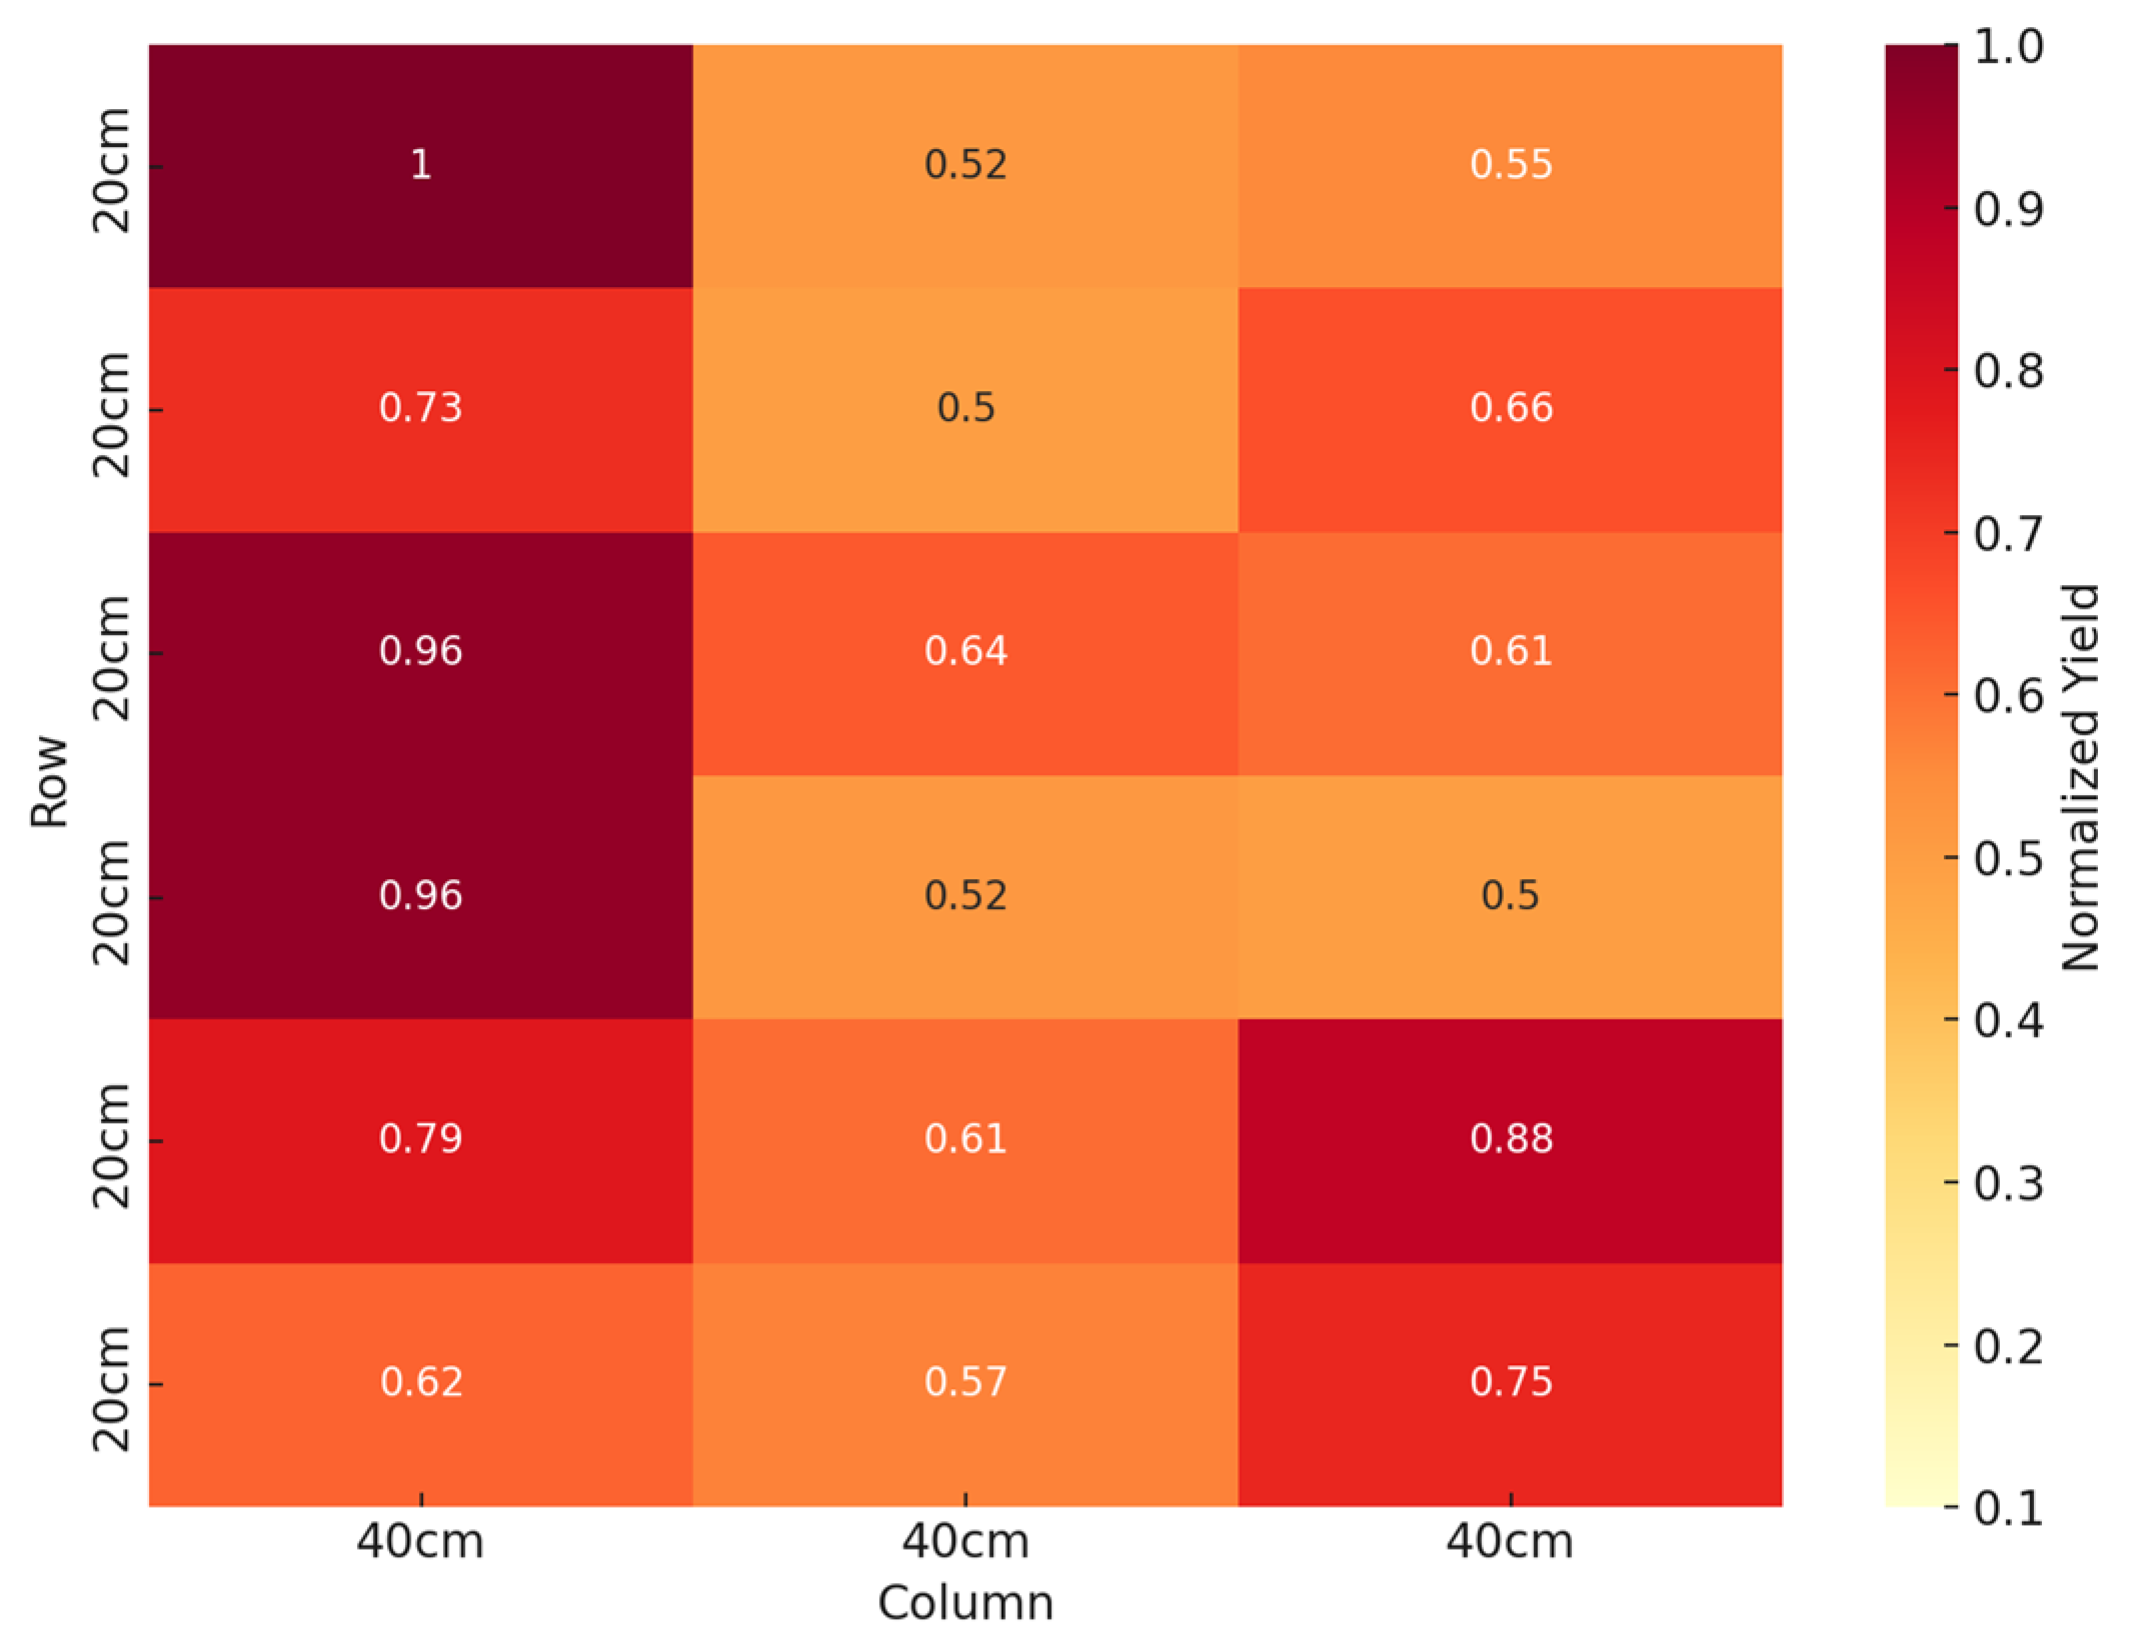
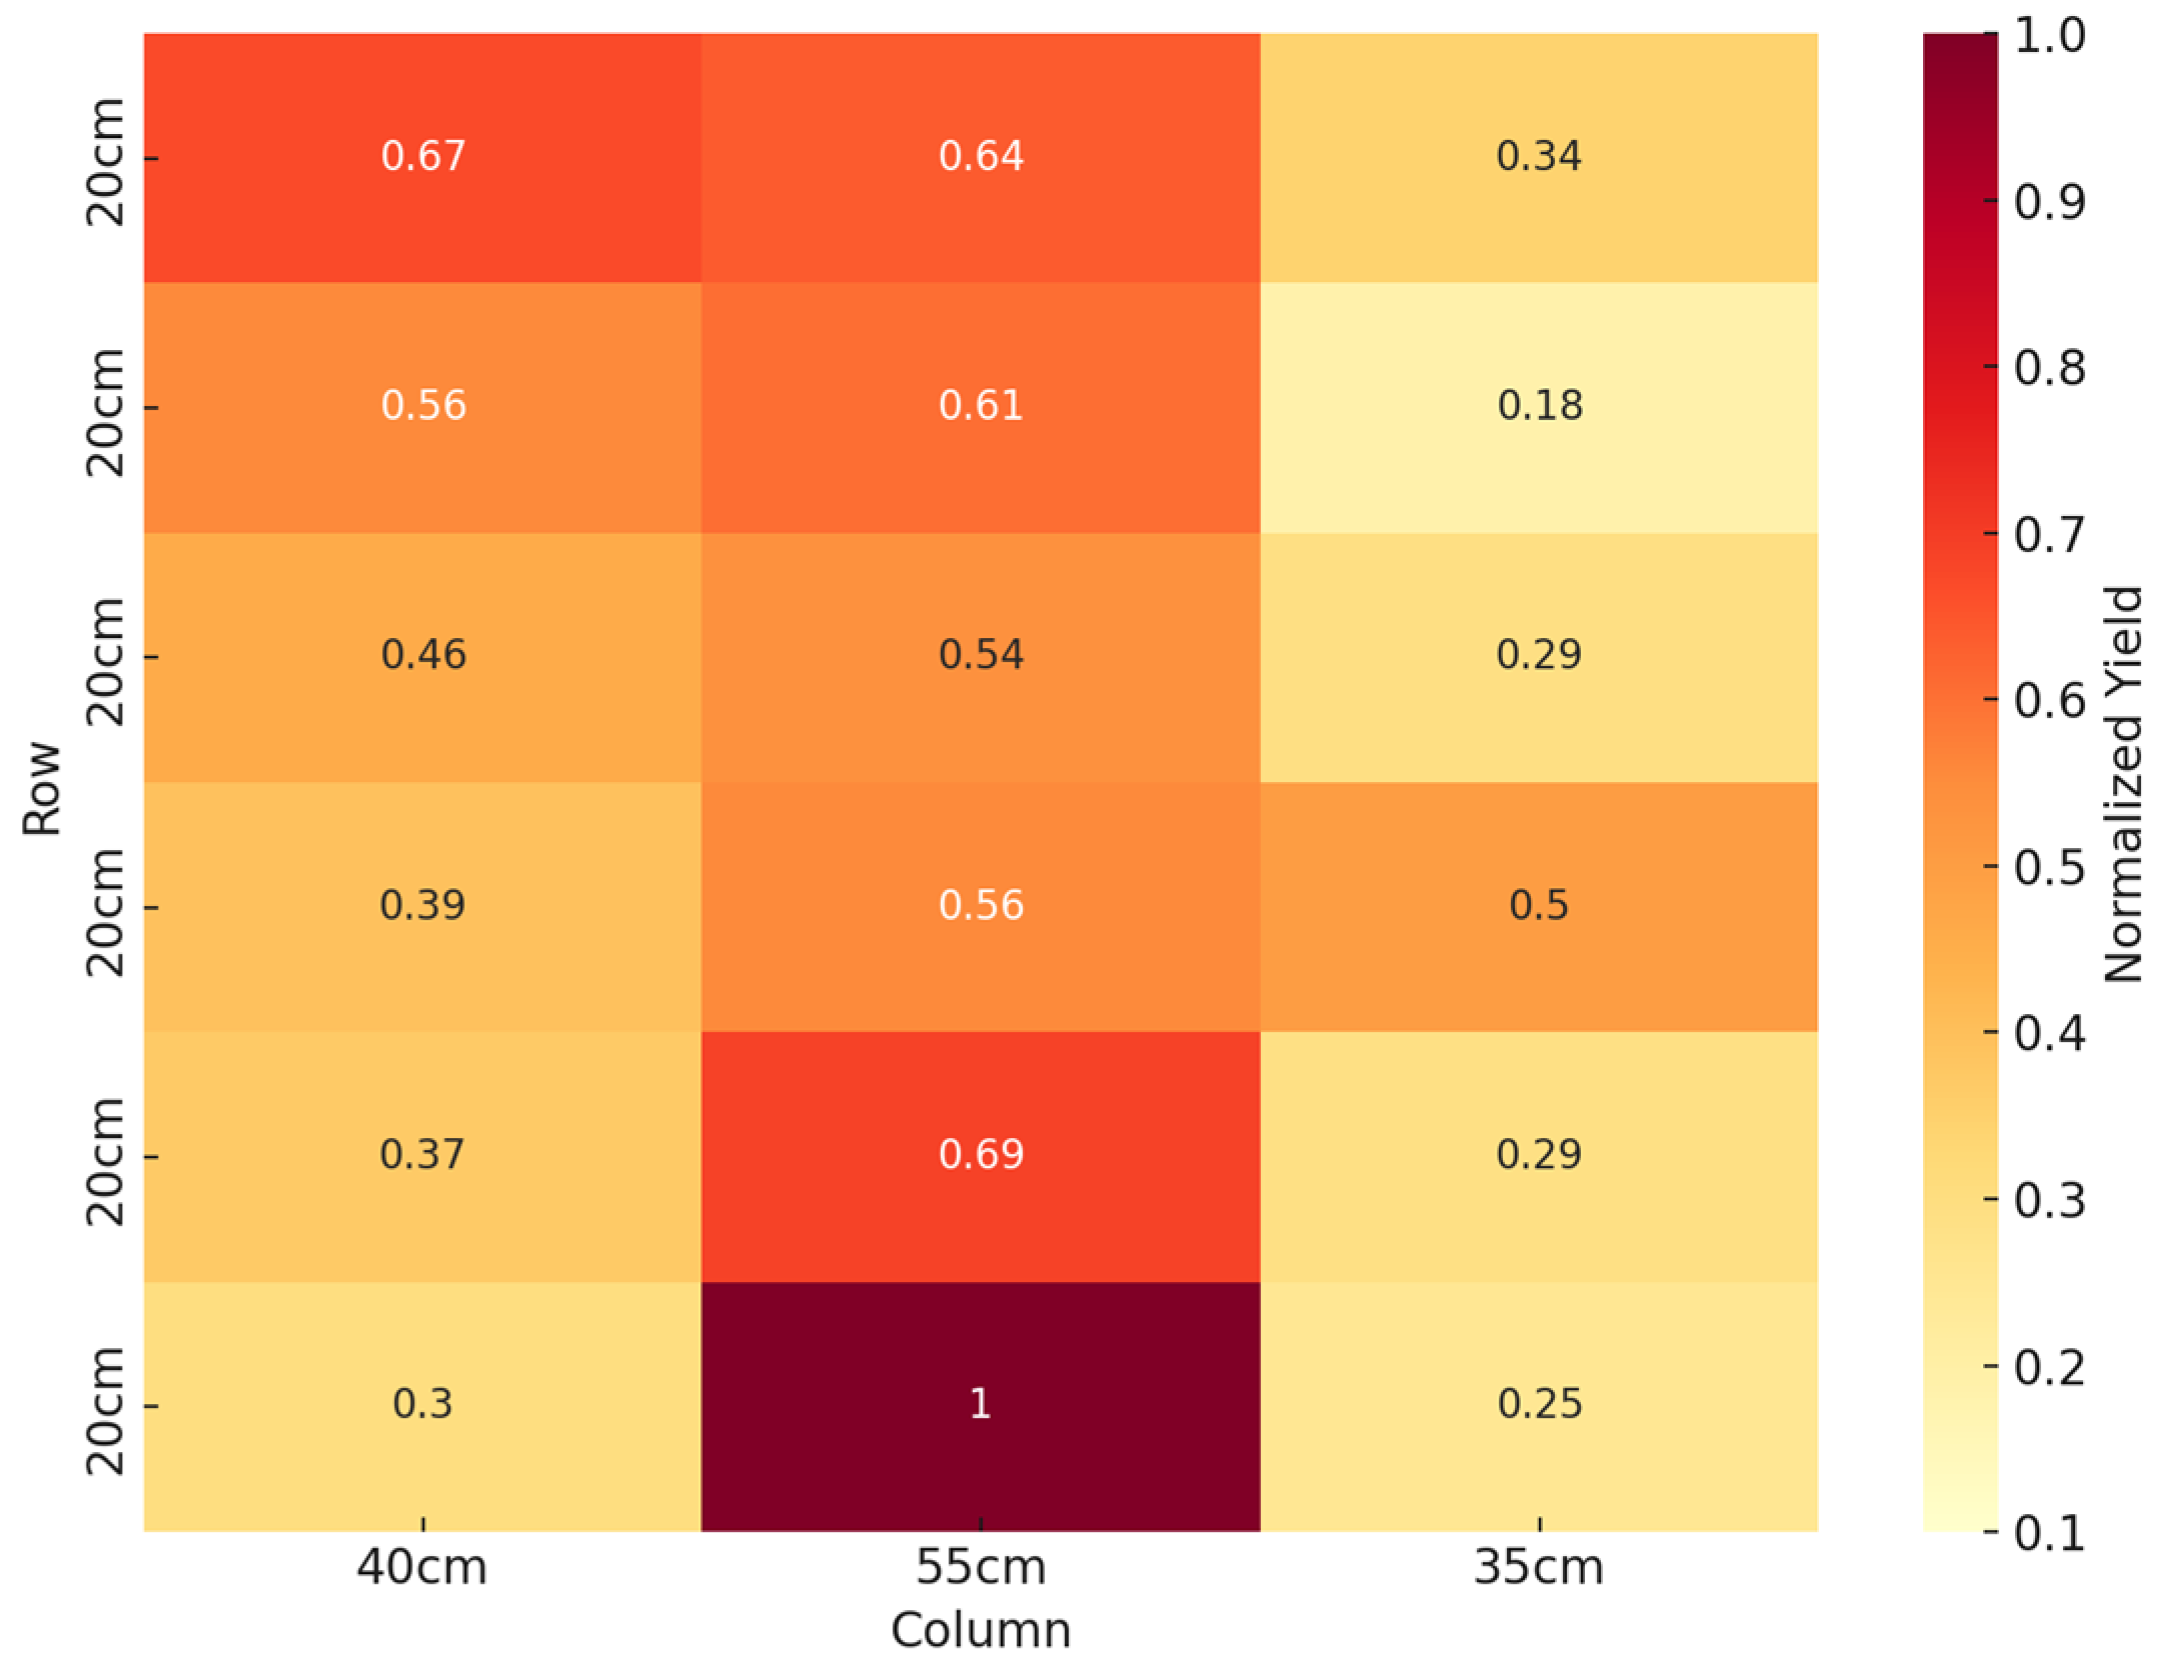
Grass was harvested in rectangles and weighed to compute crop yield estimates in g/cm2. A normalized yield was calculated as the ratio between the yield measured in each rectangle over the maximum yield in each experiment. Figure 6, Figure 7 and Figure 8 present the normalized yield heatmaps for Experiments 1, 2, and 3, revealing significant differences in crop yield distribution among the three setups.
Experiment 1 (no shading) showed a relatively uniform yield distribution with a range of 0.500 to 1.000. Experiment 2 (continuous partial shading) displayed a more varied pattern, with yields ranging from 0.185 to 1.000, highest in the central unshaded column and lowest in shaded areas. Experiment 3 (intermittent partial shading) exhibited the most diverse yield pattern, ranging from 0.320 to 1.000, with improved yields in shaded areas compared to Experiment 2.
These results highlight several key findings in agrivoltaic systems. Shaded areas generally showed lower yields, demonstrating the impact of reduced light exposure. However, high yields in central unshaded columns suggest potential benefits from the altered microclimate created by surrounding panels. The intermittent shading in Experiment 3 appeared to mitigate some of the negative effects of continuous shading seen in Experiment 2. Vertical yield variations were observed in shaded areas, with lower rows often outperforming upper rows, possibly due to external sunlight influence.

3.2. Discussion

This study examined simulated agrivoltaic conditions on grassland growth, revealing complex interactions between shading and the microenvironment. Reduced light intensity under panels affected photosynthesis and yield, with impacts varying between continuous and intermittent shading setups.
Soil moisture was better preserved under panels, suggesting potential for efficient water use. However, yield analysis showed lower and scattered yields in shaded areas, highlighting the challenge of balancing energy and crop production. Significant soil temperature variations were observed, with a 4–5 °C increase in shaded experiments potentially affecting crop growth processes.
This research is in its early stages, with plans for future experiments involving different crops, actual photovoltaic panels, and diverse environmental conditions. Evapotranspiration will be a key focus in upcoming studies to provide a more comprehensive understanding of agrivoltaic systems.

4. Conclusions

This initial study has provided valuable insights into the complex interactions within agrivoltaic systems, highlighting both potential benefits and challenges in balancing energy production and crop yield. The research revealed significant effects of panel shading on light distribution, soil moisture, and temperature, all of which influence crop growth and yield.

Author Contributions

Conceptualization, C.C. and S.M.; methodology, N.P. and C.C.; software, C.C. and S.M.; validation, J.C. and N.P.; formal analysis, J.C. and N.P.; investigation, J.C. and N.P.; data curation, J.C. and N.P.; writing—original draft preparation, J.C.; writing—review and editing, C.C., S.M. and J.C.; visualization, J.C.; supervision, C.C. and S.M.; funding acquisition, C.C. and S.M. All authors have read and agreed to the published version of the manuscript.

Funding

This research was funded by the Italian National Recovery and Resilience Plan (PNRR) through a doctoral scholarship (No. 3906-3114).

Institutional Review Board Statement

Not applicable.

Informed Consent Statement

Not applicable.

Data Availability Statement

The data presented in this study are available on request from the corresponding author.

Acknowledgments

The authors would like to thank the Gaudenzio Fantoli laboratory of Politecnico di Milano for providing the facilities and support necessary for conducting this research.

Conflicts of Interest

The authors declare no conflicts of interest. The funders had no role in the design of the study; in the collection, analyses, or interpretation of data; in the writing of the manuscript, or in the decision to publish the results.

References

  1. Dupraz, C.; Marrou, H.; Talbot, G.; Dufour, L.; Nogier, A.; Ferard, Y. Combining solar photovoltaic panels and food crops for optimising land use: Towards new agrivoltaic schemes. Renew. Energy 2011, 36, 2725–2732. [Google Scholar] [CrossRef]
  2. Weselek, A.; Ehmann, A.; Zikeli, S.; Lewandowski, I.; Schindele, S.; Högy, P. Agrophotovoltaic systems: Applications, challenges, and opportunities. A review. Agron. Sustain. Dev. 2019, 39, 35. [Google Scholar] [CrossRef]
  3. Barron-Gafford, G.A.; Pavao-Zuckerman, M.A.; Minor, R.L.; Sutter, L.F.; Barnett-Moreno, I.; Blackett, D.T.; Thompson, M.; Dimond, K.; Gerlak, A.K.; Nabhan, G.P.; et al. Agrivoltaics provide mutual benefits across the food–energy–water nexus in drylands. Nat. Sustain. 2019, 2, 848–855. [Google Scholar] [CrossRef]
  4. Marrou, H.; Wery, J.; Dufour, L.; Dupraz, C. Productivity and radiation use efficiency of lettuces grown in the partial shade of photovoltaic panels. Eur. J. Agron. 2013, 44, 54–66. [Google Scholar] [CrossRef]
  5. Adeh, E.H.; Good, S.P.; Calaf, M.; Higgins, C.W. Solar PV power potential is greatest over croplands. Sci. Rep. 2019, 9, 11442. [Google Scholar] [CrossRef] [PubMed]
  6. Campana, P.E.; Stridh, B.; Amaducci, S.; Colauzzi, M. Optimisation of agrivoltaic systems: Synergies for rural communities’ resilience in the food-water-energy nexus. Renew. Sustain. Energy Rev. 2021, 150, 111452. [Google Scholar]
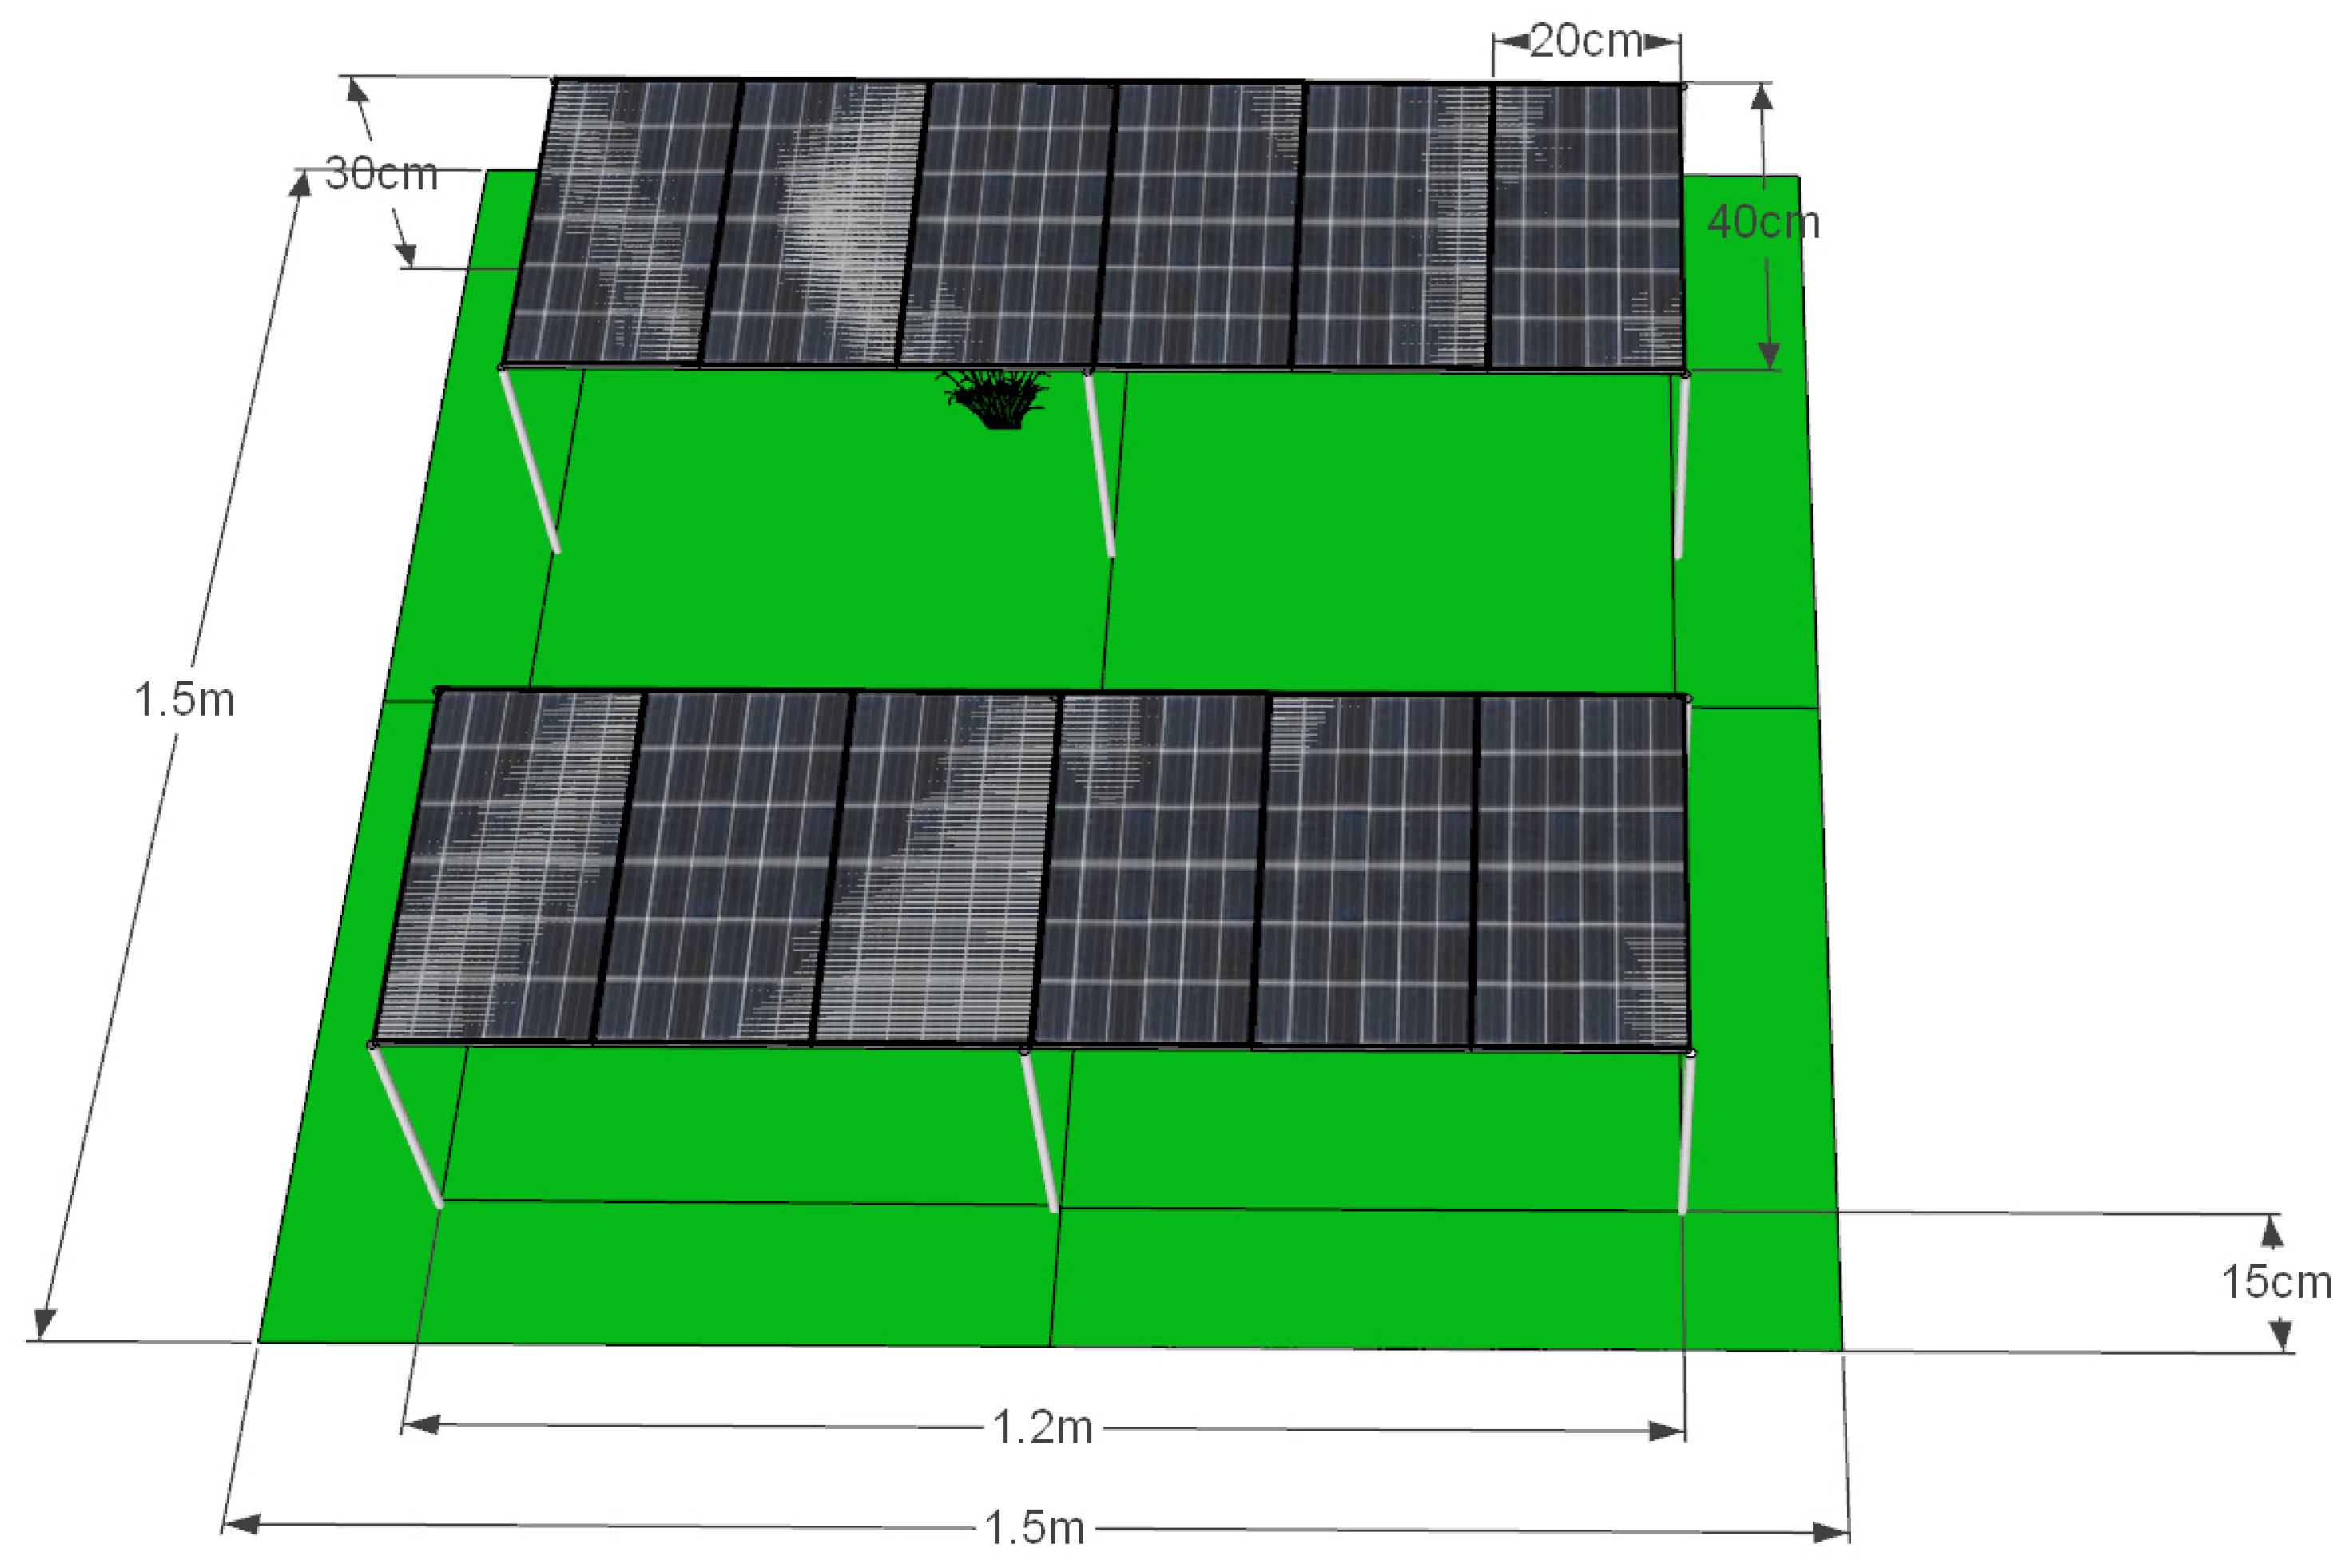
Figure 1. Schematic diagram of Experiment 2 setup.
Engproc 82 00005 g001
Figure 2. Actual setup of Experiment 3 with intermittent shading panels.
Engproc 82 00005 g002
Figure 3. Comparison of light levels in Experiment 2 and 3.
Engproc 82 00005 g003
Figure 4. Comparison of soil moisture: Probe 1 and Probe 2 across Experiments.
Engproc 82 00005 g004
Figure 5. Comparison of soil temperature: Probe 1 and Probe 2 across Experiments.
Engproc 82 00005 g005
Figure 6. Normalized yield heatmap of Experiment 1.
Engproc 82 00005 g006
Figure 7. Normalized yield heatmap of Experiment 2.
Engproc 82 00005 g007
Figure 8. Normalized yield heatmap of Experiment 3.
Engproc 82 00005 g008
Table 1. Comparison between the statistics of air temperature in the two experiments.
Experiment Comparison StatisticsExperiment Mean ± SD
Experiment 120.39 ± 1.04
Experiment 224.57 ± 1.22
Experiment 328.16 ± 1.47
Table 2. Comparison between the statistics of radiation in the three experiments.
ExperimentIncoming Shortwave Radiation Average (Mean ± SD)
Experiment 130.37 ± 85.55
Experiment 2112.32 ± 163.62
Experiment 3119.20 ± 154.03
Disclaimer/Publisher’s Note: The statements, opinions and data contained in all publications are solely those of the individual author(s) and contributor(s) and not of MDPI and/or the editor(s). MDPI and/or the editor(s) disclaim responsibility for any injury to people or property resulting from any ideas, methods, instructions or products referred to in the content.