Proceeding Paper

Real-Time Monitoring of a Lithium-Ion Battery Module to Enhance Safe Operation and Lifespan †

by
Ioannis Christakis
,
Vasilios A. Orfanos
,
Pavlos Chalkiadakis
and
Dimitrios Rimpas
*
Department of Electrical and Electronic Engineering, University of West Attica, P. Ralli & Thivon 250, 12244 Egaleo, Greece
*
Author to whom correspondence should be addressed.
Presented at the 11th International Electronic Conference on Sensors and Applications (ECSA-11), 26–28 November 2024; Available online: https://sciforum.net/event/ecsa-11.
Eng. Proc. 2024, 82(1), 66; https://doi.org/10.3390/ecsa-11-20423
Published: 25 November 2024

Abstract

:
Lithium batteries are characterized as the heart of every electronic device, introducing a plethora of benefits like high energy density and durability without the need for maintenance. However, lithium cells suffer from increased temperatures caused by high voltage and peak loads. These operating conditions lead to lithium deposition and partial electrolyte decomposition, limiting the total capacity (state of health) or even causing possible breakdown of the batteries. Hence, consistent monitoring is essential to ensure the maximum lifespan without impacting safety. In this paper, a compact module consisting of three batteries is introduced to gather values like temperature, voltage and current, all transferred to an online server and monitored through the Grafana application. The tests indicate that the temperature is very high when the power output increases the stress on the battery components. To further project this pattern, two distinct sets of batteries were used for testing the use of different power states, revealing that a 2.5-fold increased power output results in voltage drops. The results show that a high power output, tested on the second set of batteries with a limited state of health, is increased by an additional 5%, while the battery is highly stressed within the manufacturer safety zone.

1. Introduction

Since the invention of the first accumulator, battery technology has progressed rapidly throughout the years. From alkaline nickel–cadmium (Ni-Cd) cells to rechargeable lead acid and lithium-ion batteries, each type provides specific advancements to power any electronic device [1]. Lithium batteries are now widely adopted as they possess a plethora of advantages including a high energy density and low self-discharge rate, without the need of maintenance. Therefore, they are the perfect choice for modern electronics like laptops, smartphones, drones and electric vehicles [2]. They consist of a positive (anode) and negative (cathode) electrode with an electrolyte for ion transfer and a separator layer to avoid short-circuits and total breakdown. Hence, lithium cells are easy to manufacture, and their light weight is beneficial for applications that must be compact and robust like electric vehicles or monitoring tools.
Unfortunately, lithium battery technology has its limitations. Increased temperature caused by a high current due to peak loads and the need for fast charging is considered a great flaw. Lithium dendrites are formed inside the cell, causing the maximum capacity or state of health (SoH) of the battery to decrease [3]. In addition, constant operation above the operational limits can lead to partial electrolyte decomposition or even possible breakdown. Hence, battery values like voltage, current, capacity and temperature, inside and out of the cell, must be monitored regularly to ensure safe operation and maximized life cycles, a parameter that determines the lifespan of the battery [4]. These parameters may be used to calculate valuable values such as the following [5,6,7]:
  • State of voltage (SoV), to be merged with state of charge;
  • State of health (SoH);
  • Depth of discharge (DoD).
SoV can be used as an alternative to state of charge to indicate the current capacity of the battery, while state of health reflects the maximum capacity of the cells at any given time [7]. Depth of discharge shows the percentage exploited after each use; for example, if a battery was charged at 80% and discharged to 20%, the DoD rate would be 60%. A high DoD can lead to excess stress on the cells which has to be avoided to enhance battery lifetime [8]. Since voltage is constantly monitored, capacity can be easily calculated by utilizing the state of voltage value and then the other two values can be computed to determine the battery state to maximize longevity, serving as a diagnostic tool.
Monitoring these criteria is crucial, as it provides an easy and adequate scheme to diagnose battery status. A low state of charge enhances battery stress as operation below 20% charge can lead to increased temperatures, causing lithium deposition and limiting the state of health [9]. On the other hand, operation at high SoC limits induces stress on the electrolyte and separator, which may cause additional damage or breakdown. This effect is also connected with a high DoD, which, as stated by the literature and previous works, has to be retained within a 20–80% limit for maximum efficiency and lifespan [7,10]. In previous work, a compact module was introduced, based on Arduino, that monitored a single cell through a 10 s time rate [11]. The results showed that a low DoD and current output lead to SoH preservation after 50 cycles, with limited losses and operation at temperatures way below the maximum limit of 40 °C.
This paper is the next step of the project presented in the Design and Development of a Low-Cost and Compact Real-Time Monitoring Tool for Battery Life Calculation [11]. Its aim is to establish a larger module based on the Arduino Platform. Three lithium batteries are equipped with a voltage and temperature sensor and a common current sensor each. Cell arrays are connected in series to provide a typical value of 12 volts which is widely applicable in mobile applications. The output temperature and load voltage–power are also introduced in the assembly, while a five-second timeframe is selected for faster and precise diagnosis through the Arduino device with additional automations. All values are transferred through Wi-Fi to an application server for real-time monitoring. Hence, the connection between the SoV and depth of discharge parameters and battery aging will be investigated.

2. Materials and Methods

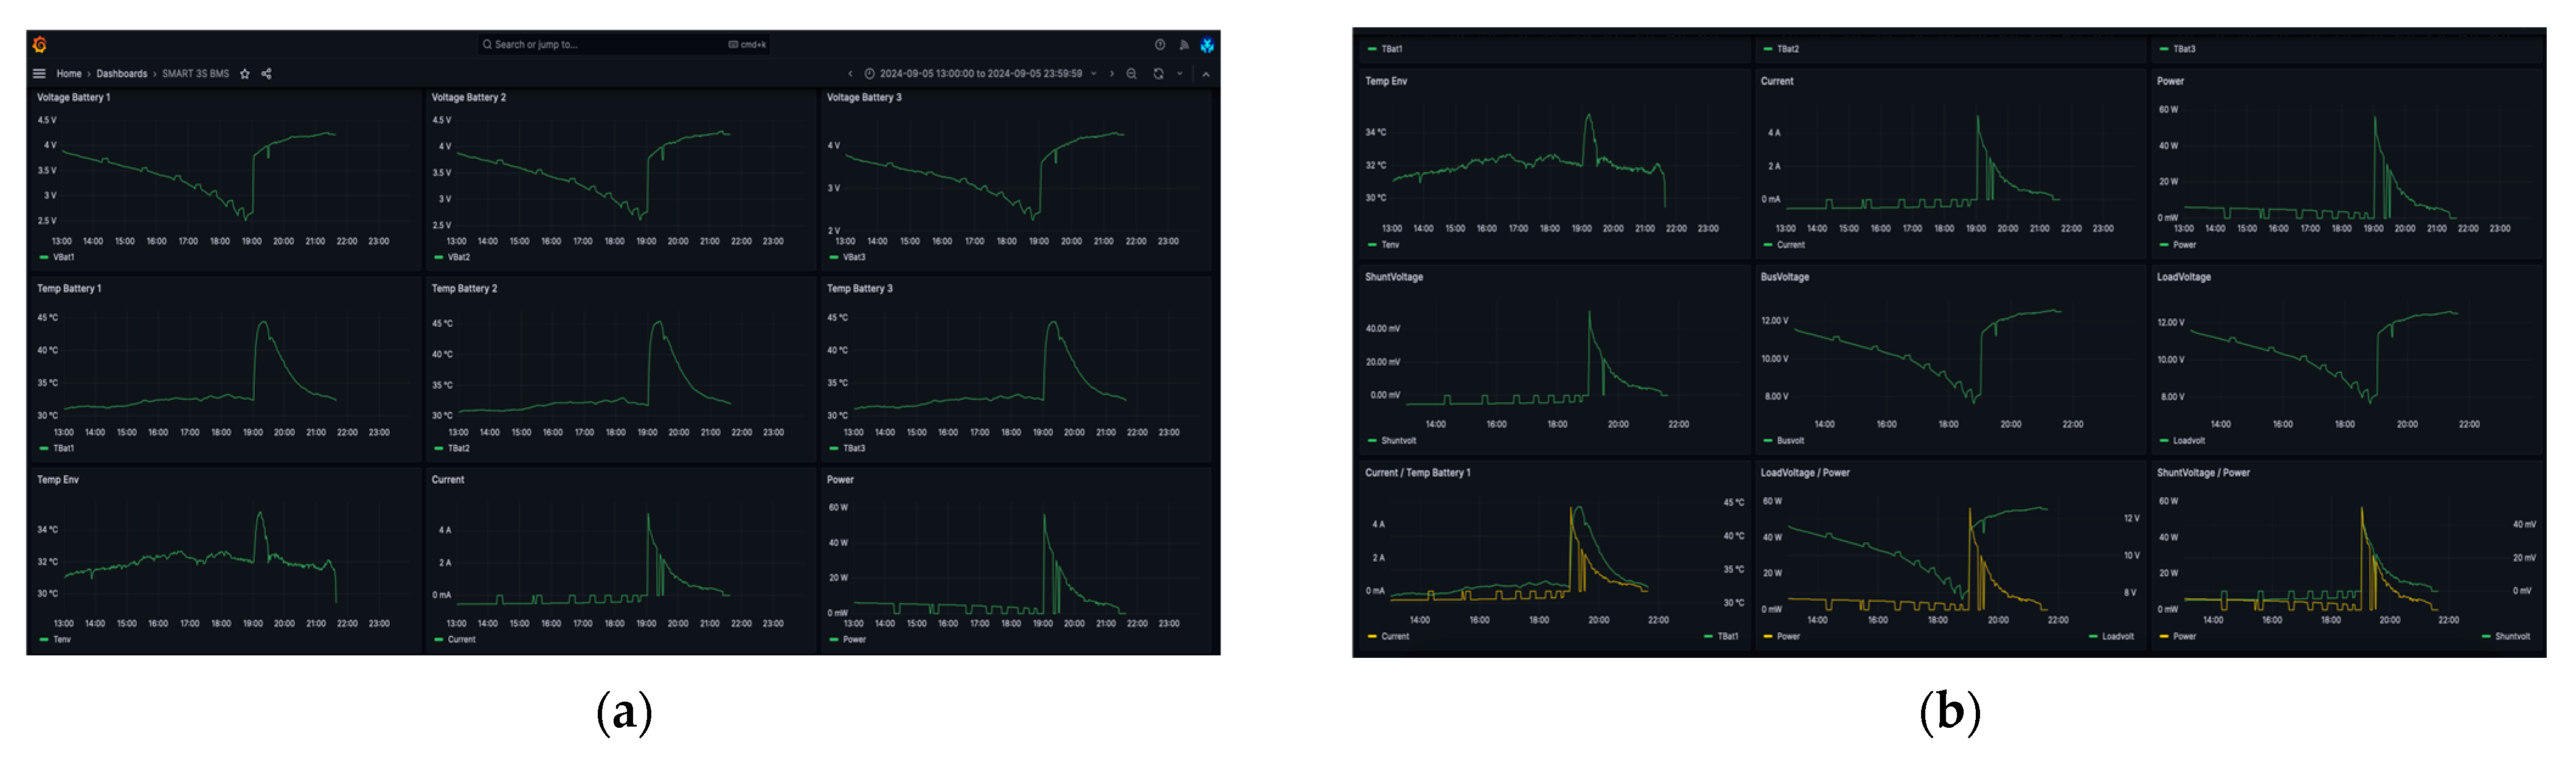
2.1. Experimental Layout

For the experiment, it was necessary to implement a board to enclose all components involved in the measurements. The heart of the system is the microcontroller, ESP32 Devkit v4, while the CPU used is the Xtensa dual-core 32-bit LX6 microprocessor, operating at 240 MHz [12]. It was selected as it is a well-sized unit with a very high processing power and has a plethora of ports (16 analogs with 12-bit analog-to-digital converter and 30 digital ports). Additionally, communication protocols such as SPI, UART, I2S and I2C are supported. The microcontroller includes transmission, wireless networking (Wi-Fi) and Bluetooth protocols, programmed using the user-friendly Arduino IDE programming environment. In low-cost microcontrollers, energy efficiency is feasible according to [13], which constitutes an important factor in mobile applications.
A simple 3S Battery Management System (BMS) with a 25 Amps Li-ion Battery Protection Board was used, as shown in Figure 1, to manage the power energy of three 18650 batteries [14]. Samsung INR18650-30Q batteries (Suwon, Republic of Korea) were selected with a capacity of 3000 mAh and a nominal voltage of 3.7 volts, connected in series for a total of 12 V. From the BMS, the voltage of each battery was obtained by using a resistor network and a trimmer to micro-adjust the voltage divider. The voltages of the batteries were sent to the analog ports of the microcontroller.
A power-meter device based on the INA219 integrated circuit was used to measure the total voltage and current of the DC Bus transferring the information to the controller via the I2C protocol [15]. A DS18B20 temperature sensor was installed at each battery negative pole to record the temperature variations during charging–discharging. In addition, a similar temperature sensor was placed opposite to the batteries to measure the ambient temperature. The temperature sensors transmit the measurement data by means of a 1-Wire protocol, while the microcontroller sends the measurement data to the database every 60 s, using an HTTP POST message, via Wi-Fi [11].
The microcontroller was connected to all of the devices on the board, as its function was to take readings from all of them and send them to a central server for collection and data logging. The information system is based on a Linux operating system, while the applications are run through the open-source influxDB database and Grafana visualization software, with constant access and csv file export selected [16]. Figure 2 and Figure 3 show the visualized data at the Grafana User Interface.

2.2. Battery Parameter Calculation

Temperature and current values were used separately to observe the stress applied to each cell. Also, all values collected were exploited to calculate the battery operation parameters like state of voltage, state of health and depth of discharge. As these parameters are typically hard to calculate due to the requirements of complex strategies like neural networks, certain rules are applied in this work for simplification [17,18]:
  • SoV equals the ratio of the monitored voltage divided by the nominal value;
  • SoH is defined as the battery maximum voltage as manufactured, divided by the nominal value;
  • DoD is manually computed as the SoV difference before and after each use.
The following equations are utilized to calculate all three parameters:
For state of voltage:
S o C = V V R A T E D
For state of health:
S o H = V M A X V R A T E D
For depth of discharge:
DoD = SoVEND − SoVSTART

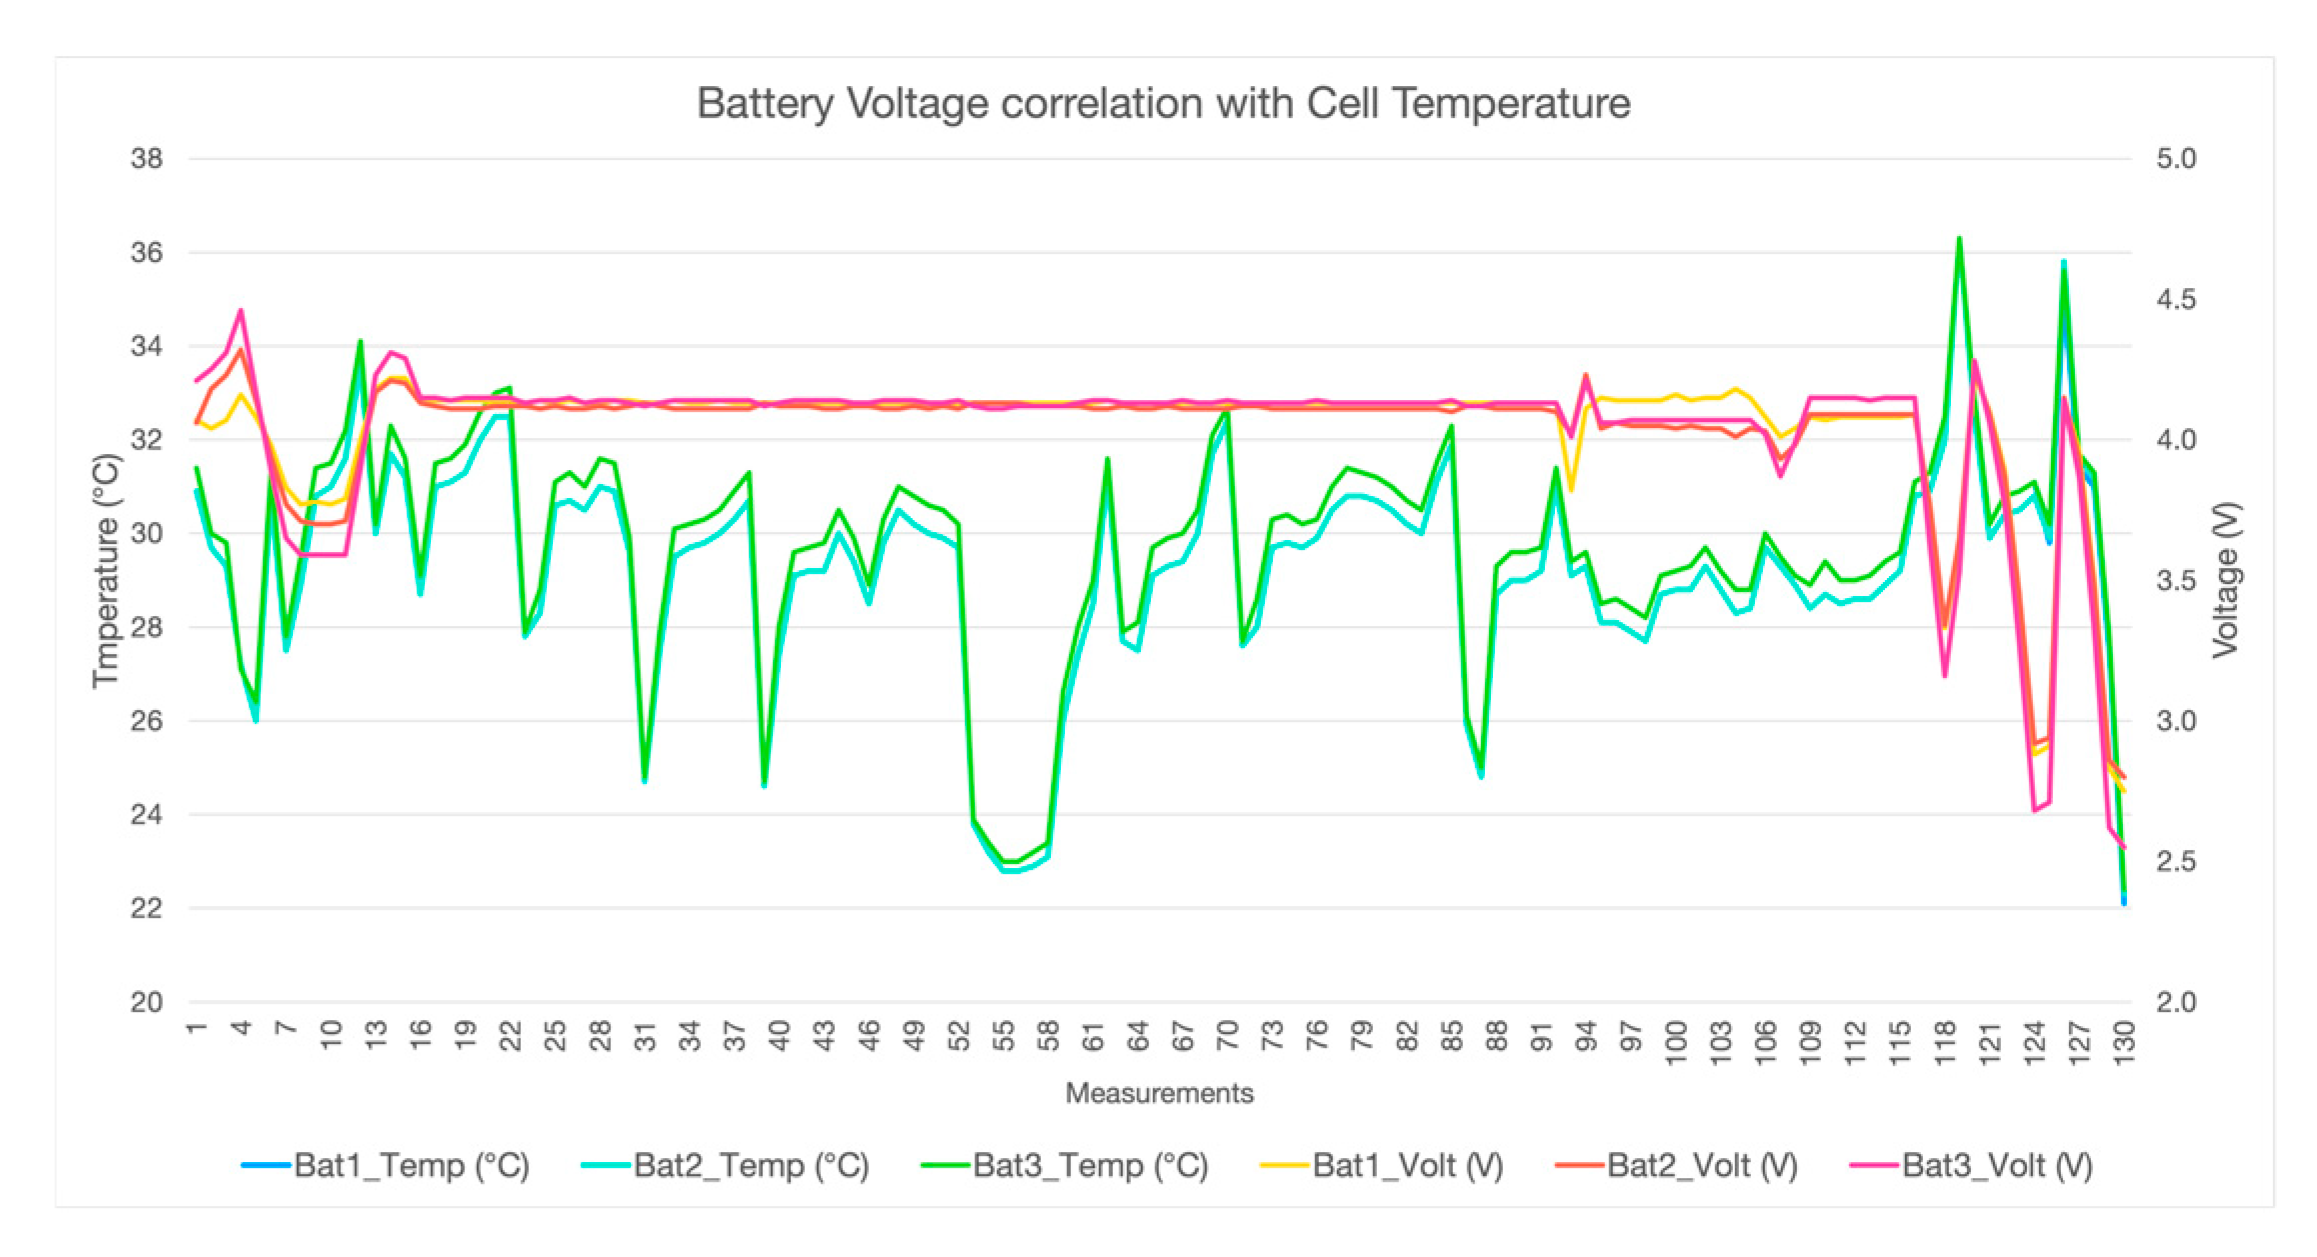
3. Results and Discussion

Over 20,000 measurements were collected over a monthly period, with testing taking place in the province of Agia Paraskevi in Athens, Greece. To validate the performance and accuracy of the BMS, each battery temperature and voltage was recorded so that proper charging was ensured, as shown in Figure 3 above.
The next step was the correlation between cell temperature and bus voltage and current. Both voltage and current are connected to cell temperature but unrelated to each other. As the current increases, a voltage drop is noticeable; however, its variation is directly associated with fluctuations in cell temperature, as noticed in previous work [11]. The depth of discharge in each test varied between 20% and 60%. This occurred until the control module shut off due to a low voltage. The results of both the DC bus and each battery separately were similar. So, to avoid high stress on the battery, temperature must be balanced, as can be seen in Figure 4 below.
Lastly, the need to control battery temperature is seen in Figure 5 below. Despite the fluctuations in power and voltage, cells operate within their optimum temperature (20–30 °C). The batteries were fully charged and a step of 0.5 V was exploited with a small break to reveal the differences in battery state when the electrolyte became stable again after several seconds. The power output reached 12 W, leading to a 10 °C battery temperature increase with an adequate voltage drop. Afterwards, it dropped steadily, and the cell internal temperature was normalized. This pattern continued until the DC bus reached 9 V, where it was shut off by the microcontroller. All small power spikes were controlled, and the battery was protected from getting too warm, avoiding high stress. However, in applications such as EVs where high power is required, cooling is essential; otherwise, the lifespan can be massively reduced.
Two different sets of batteries were utilized to test different operating conditions. Different depth of discharge and power output scenarios were applied to measure the battery stress via the state of health parameter. Battery set No.2 showed a 6% drop in state of health with the same DoD range but with 2.5 times the power applied. All results are summarized in Table 1.

4. Conclusions

In this work, a compact and affordable module has been introduced for lithium battery monitoring through a web app platform. Different values like cell temperature, voltage and current were gathered to calculate various parameters like state of health. As stated in previous work [11], stress on the battery is mainly applied by high currents during charging or discharging, leading to increased temperatures and hence lithium plating and capacity loss. Two sets of batteries were tested with different power outputs. The results reveal that high power in the second set of cells led to a 5% bigger drop in state of health and high voltage variations; hence, the stress on the battery was increased, but still within the safety zone. Further work should be based on a more advanced monitoring system focused on a rule-based strategy that will allow the battery to operate in the safe zone. Thus, the aim is for safety conditions to always be satisfied and for battery longevity to be increased for maximum performance, moving toward the goal of minimum waste.

Author Contributions

Conceptualization, D.R. and I.C.; methodology, D.R.; software, I.C.; validation, I.C. and V.A.O.; formal analysis, V.A.O.; investigation, P.C. and V.A.O.; resources, I.C.; data curation, D.R.; writing—original draft preparation, I.C. and D.R.; writing—review and editing, D.R. and I.C.; visualization, P.C.; supervision, D.R.; project administration, I.C.; funding acquisition, I.C. and V.A.O. All authors have read and agreed to the published version of the manuscript.

Funding

This research received no external funding.

Institutional Review Board Statement

Not applicable.

Informed Consent Statement

Not applicable.

Data Availability Statement

The data that support the findings of this study are available from the corresponding author upon reasonable request.

Conflicts of Interest

The authors declare no conflicts of interest.

References

  1. Townsend, A.; Gouws, R. A Comparative Review of Lead-Acid, Lithium-Ion and Ultra-Capacitor Technologies and Their Degradation Mechanisms. Energies 2022, 15, 4930. [Google Scholar] [CrossRef]
  2. Guo, Y.; Cai, J.; Liao, Y.; Hu, J.; Zhou, X. Insight into Fast Charging/Discharging Aging Mechanism and Degradation-Safety Analytics of 18650 Lithium-Ion Batteries. J. Energy Storage 2023, 72, 108331. [Google Scholar] [CrossRef]
  3. Hu, X.; Xu, L.; Lin, X.; Pecht, M. Battery Lifetime Prognostics. Joule 2020, 4, 310–346. [Google Scholar] [CrossRef]
  4. Teodorescu, R.; Sui, X.; Vilsen, S.B.; Bharadwaj, P.; Kulkarni, A.; Stroe, D.-I. Smart Battery Technology for Lifetime Improvement. Batteries 2022, 8, 169. [Google Scholar] [CrossRef]
  5. Vermeer, W.; Chandra Mouli, G.R.; Bauer, P. A Comprehensive Review on the Characteristics and Modeling of Lithium-Ion Battery Aging. IEEE Trans. Transp. Electrific. 2022, 8, 2205–2232. [Google Scholar] [CrossRef]
  6. Zeng, J.; Liu, S. Research on Aging Mechanism and State of Health Prediction in Lithium Batteries. J. Energy Storage 2023, 72, 108274. [Google Scholar] [CrossRef]
  7. Rimpas, D.; Kaminaris, S.D.; Piromalis, D.D.; Vokas, G. Real-Time Management for an EV Hybrid Storage System Based on Fuzzy Control. Mathematics 2023, 11, 4429. [Google Scholar] [CrossRef]
  8. Liu, J.; Duan, Q.; Ma, M.; Zhao, C.; Sun, J.; Wang, Q. Aging Mechanisms and Thermal Stability of Aged Commercial 18650 Lithium Ion Battery Induced by Slight Overcharging Cycling. J. Power Sources 2020, 445, 227263. [Google Scholar] [CrossRef]
  9. Che, Y.; Deng, Z.; Tang, X.; Lin, X.; Nie, X.; Hu, X. Lifetime and Aging Degradation Prognostics for Lithium-Ion Battery Packs Based on a Cell to Pack Method. Chin. J. Mech. Eng. 2022, 35, 4. [Google Scholar] [CrossRef]
  10. Hosen, M.S.; Karimi, D.; Kalogiannis, T.; Pirooz, A.; Jaguemont, J.; Berecibar, M.; Van Mierlo, J. Electro-Aging Model Development of Nickel-Manganese-Cobalt Lithium-Ion Technology Validated with Light and Heavy-Duty Real-Life Profiles. J. Energy Storage 2020, 28, 101265. [Google Scholar] [CrossRef]
  11. Rimpas, D.; Orfanos, V.A.; Chalkiadakis, P.; Christakis, I. Design and Development of a Low-Cost and Compact Real-Time Monitoring Tool for Battery Life Calculation. Eng. Proc. 2023, 58, 17. [Google Scholar] [CrossRef]
  12. ESP32-DevKitC V4 Getting Started Guide-ESP32—ESP-IDF Programming Guide v5.3.1 Documentation. Available online: https://docs.espressif.com/projects/esp-idf/en/release-v4.2/esp32/hw-reference/esp32/get-started-devkitc.html (accessed on 21 September 2024).
  13. Katsoulis, S.; Koulouras, G.; Christakis, I. Energy-Efficient Data Acquisition and Control System Using Both LoRaWAN and Wi-Fi Communication for Smart Classrooms. In Proceedings of the 2024 13th International Conference on Modern Circuits and Systems Technologies (MOCAST), Sofia, Bulgaria, 26–28 June 2024; pp. 1–4. [Google Scholar] [CrossRef]
  14. BMS-20A-3S-S_SGT.Documentation. Available online: https://www.mantech.co.za/Datasheets/Products/BMS-20A-3S-S_SGT.pdf (accessed on 21 September 2024).
  15. INA219 Product Specification. Available online: https://www.ti.com/lit/ds/symlink/ina219.pdf?ts=1726895648050 (accessed on 22 September 2024).
  16. Hindi, I.; Alyaman, M.; AboZenah, A.; Zaid, A.; Shrara, M. Smart Alarm IoT System: Monitoring Elevator Traffic and Meteorological Data on Job Sites Using MQTT and InfluxDB Integrated with Grafana. In Proceedings of the 2024 15th International Conference on Information and Communication Systems (ICICS), Irbid, Jordan, 13–15 August 2024; IEEE: Piscataway, NJ, USA, 2024; pp. 1–6. [Google Scholar]
  17. Zhang, T.; Guo, N.; Sun, X.; Fan, J.; Yang, N.; Song, J.; Zou, Y. A Systematic Framework for State of Charge, State of Health and State of Power Co-Estimation of Lithium-Ion Battery in Electric Vehicles. Sustainability 2021, 13, 5166. [Google Scholar] [CrossRef]
  18. Hu, X.; Feng, F.; Liu, K.; Zhang, L.; Xie, J.; Liu, B. State Estimation for Advanced Battery Management: Key Challenges and Future Trends. Renew. Sustain. Energy Rev. 2019, 114, 109334. [Google Scholar] [CrossRef]
Figure 1. The layout consisting of the battery board, current and voltage collectors, NTCs and the Arduino device.
Engproc 82 00066 g001
Figure 2. All fifteen parameters monitored and visualized through the Grafana Interface. Specifically, the following values are available: (a) battery voltages and temperatures; (b) ambient temperature, bus current, voltage and power and various juxtapositions.
Engproc 82 00066 g002
Figure 3. Battery fluctuations for the 3 battery cells in correlation with the internal temperature.
Engproc 82 00066 g003
Figure 4. The correlation between cell temperature and battery voltage and current variations based on two separate measurements: (a) DC bus; (b) battery cell No.1. The negative values signify that the batteries are being discharged, showing that the INA219 detects a loss of power in energy storage.
Engproc 82 00066 g004
Figure 5. Battery temperature is highly affected by power spikes, leading to voltage drops.
Engproc 82 00066 g005
Table 1. Battery parameters for two different sets of batteries tested.
ParameterBat_Set No.1Bat_Set No.2
Maximum Power12 W30 W
State of Health_Before100%100%
State of Health_After99%94%
Depth of Discharge 120–60%20–60%
1 Typical DoD range achievable due to layout limitations.
Disclaimer/Publisher’s Note: The statements, opinions and data contained in all publications are solely those of the individual author(s) and contributor(s) and not of MDPI and/or the editor(s). MDPI and/or the editor(s) disclaim responsibility for any injury to people or property resulting from any ideas, methods, instructions or products referred to in the content.

