Proceeding Paper

Comparative Study of Asparagus Production and Quality in Two Coastal Regions of Peru Based on Meteorological Conditions for Crop Productivity Optimization †

Ingeniería, Ingeniería Mecatronica, Universidad San Ignacio de Loyola, Lima 15024, Peru
*
Author to whom correspondence should be addressed.
Presented at the III International Congress on Technology and Innovation in Engineering and Computing, Lima, Peru, 20–24 November 2023.
Eng. Proc. 2025, 83(1), 14; https://doi.org/10.3390/engproc2025083014
Published: 15 January 2025

Abstract

:
This study focuses on remote sensing and monitoring of asparagus crops in the provinces of Ica and Trujillo, highlighting their importance in global food security. Using satellite images and temperature data, productivity was compared using the NDWI, NDVI, and EVI indices. The Grad-CAM technique was used to analyze the AlexNet Convolutional Neural Network (CNN) model, seeking to improve productivity. Although AlexNet validated the satellite images, it showed some confusion in regions of medium and low productivity. The model, supported by Grad-CAM, will contribute to the monitoring of optimal climatic conditions.

1. Introduction

Agriculture is vital for global food security, and satellite technology and advanced analysis techniques are crucial for optimizing crop productivity. This is especially relevant in the case of asparagus, an important export crop in Peru. Currently, yield prediction is conducted empirically using linear regressions based on previous harvests. As such, ref. [1] developed the TURION simulation model for the cyclic crop in Peru, employing a mechanistic approach with 27 physiological parameters based on field and literature data. Validation was performed on 38 plots with 75 commercial harvests, 3 to 12 years after establishment, addressing aspects such as the growth rate, stem diameter variation, and shoot volume. The detection and assessment of asparagus crop health and productivity is achieved through a multi-faceted approach using satellite imagery analysis. These provide a panoramic view that allows growers and experts to assess key aspects such as crop health, shoot size, and water irrigation. Ref. [2] identified the contamination of asparagus crops by the fungus Stemphylium vesicarium, causing purple blotches and decreasing the commercial value. A regression model was applied with Pleiades-1st satellite imagery to identify the contamination by removing edge bands, normalizing moisture data, and applying atmospheric correction. This effective approach using colorized imagery provides a valuable tool for pest detection in asparagus crops.
Vegetation indices, such as the NDVI (Normalized Difference Vegetation Index) and the NDWI (Normalized Difference Water Index), are essential for assessing crop health and the presence of water in agricultural management. Generated from satellite imagery, they provide valuable information. In the Northern Hemisphere, temperature shows a positive correlation with most areas compared to precipitation, while in the Southern Hemisphere, a positive correlation is observed with precipitation. Ref. [3] highlights that NDVI variations provide crucial information regarding changes in global vegetation cover, allowing for analysis of the ecological environment. Their study examined the spatio-temporal variation between 1982 and 2014 worldwide using the NDVI and global climatic factors. A positive correlation between the NDVI and temperature was identified, evidencing the extreme influence of climatic factors on plant growth. On the other hand, plant diseases affect the quantity and quality of crops, generating losses. Thus, ref. [4] proposed the use of artificial intelligence and computer vision, specifically the AlexNet architecture, to classify leaf diseases. By training with more than 40,000 reference images from the PlanVillage-Dataset, an accuracy of 98.9% was achieved. This demonstrates the efficiency and speed of disease detection using these techniques. Furthermore, according to ref. [5], the characterization of diseases in crops with human intervention has lower efficiency than previously trained neural networks (CNNs) such as AlexNet or Google Net. Monitoring studies for asparagus cultivation use models that incorporate in situ data and farmer experience, considering crucial variables such as temperature changes in areas with inconsistent winters and summers. They propose a methodology that employs remote sensing observations through Sentinel 1 satellite dual polarization data, especially VH polarization, to monitor canopy formation, growth rate, and more. In addition, they present a machine learning regression algorithm that provides spatiotemporal results of the estimated number of stems at each phenological stage of the crop, showing improvements after the implementation of the study [6]. This paper explores the use of satellite imagery and vegetation indices for the detection and evaluation of asparagus crops using advanced technologies to identify the efficiency and sustainability of asparagus.

2. Methodology

A comparative study of asparagus production and quality was conducted in two coastal regions of Peru, considering their different meteorological conditions to optimize crop productivity. The process consisted of four stages. In the first stage, Sentinel-2 satellite images were acquired through LandViewer to obtain a detailed view of the study areas. The second stage involved a detailed analysis of the climate, humidity, and wind in the selected areas using data from recognized meteorological organizations. In the third stage, the acquired images were processed using advanced analysis techniques to identify specific crop features, such as their growth and health status. The fourth stage involved the training and use of a neural network model based on the AlexNet architecture. This model determines the state of the asparagus harvest based on data and images from the previous stages. The implementation of this model allowed for the accurate and efficient assessment of crop status, facilitating productivity optimization.

2.1. Extraction of Satellite Images from Sentinel-2 via LandViewer

The first step in our comparative study involved acquiring high-resolution images from the Sentinel-2 satellite using the LandViewer platform. This process was essential for obtaining a detailed and precise view of the selected study areas, which were the asparagus fields in two coastal regions of Peru. In this case, the chosen regions or locations were the Salaverry district in the Trujillo province, La Libertad region (Figure 1a). On the other hand, we chose the Salas district in the Ica province, Ica region (Figure 1b). Likewise, the extraction of high-quality images was crucial for our study, as it allowed us to capture fine and subtle details in the asparagus fields that might go unnoticed in lower-quality images. These details can be indicative of the health and productivity of asparagus crops, and their accurate capture was fundamental to the success of our analysis. For the correct extraction of images with their respective study index, we used three study indices, namely the Normalized Difference Vegetation Index (NDVI) (Equation (1)), the Normalized Difference Water Index (NDWI) (Equation (2)), and the Enhanced Vegetation Index (EVI) (Equation (3)). These indices were obtained through the following band combinations.
N D V I = B 8 A B 04 B 8 A + B 04
N D W I = B 03 B 08 B 03 + B 08
N D W I = B 8 A B 04 B 8 A + 6 × B 04 7.5 × B 02 + 1
As shown in Figure 1a,b, dotted lines are used to delineate the boundaries of the study areas. These lines play a crucial role in ensuring the precise geographical segmentation required for the analysis. In particular, Figure 1a defines the study area for the La Libertad region, providing a clear framework for data collection and interpretation within this specific zone. Similarly, Figure 1b demarcates the boundaries of the Ica region, enabling focused analysis and preventing overlap or interference with adjacent areas. This segmentation not only facilitates a more structured and systematic approach to the study but also enhances the accuracy and reliability of the results by isolating the variables specific to each region.
These extracted images are the result of a specific combination of Sentinel-2 bands, as shown in the equations. Therefore, each of these images provided valuable information about the current conditions of the asparagus fields. For example, the RGB images gave us a visual representation of the fields as they would appear to the naked eye. On the other hand, vegetation indices such as the NDVI, NDWI, and EVI allowed us to quantify specific aspects of vegetation, such as vegetation density, soil moisture, and photosynthetic efficiency. It is important to note that image extraction was carried out systematically and repeatedly over time. This enabled us to monitor changes in the conditions of the asparagus fields and correlate these changes with meteorological conditions and crop productivity.

2.2. Study of Climate, Humidity, and Wind in Selected Areas

The second step in our methodology involved a comprehensive analysis of climatic conditions in the selected areas, namely the Salaverry district in the Trujillo province, La Libertad region, and Salas, Ica. This analysis was conducted using data and graphs provided by the WeatherSpark website, which offers detailed information about the average weather in various locations around the world. Climatological data include information on temperature, humidity, wind speed and direction, and other factors that may influence the productivity of asparagus crops.
In the district of Salaverry, climatological data were collected and analyzed to identify patterns and trends related to the productivity of asparagus crops. This analysis provided us with a deeper understanding of how the specific climatic conditions of Salaverry can influence the production and quality of asparagus.
The temperatures in Salaverry, Trujillo, exhibited an annual variation between 15 °C and 26 °C, which directly impacts the growth and harvest of asparagus. Additionally, precipitation varied throughout the year, reaching peaks in February, April, and October, with the least amount of rainfall recorded in August. On the other hand, wind speed varied throughout the year, peaking in August at 14.3 km/h, with lower speeds in March and November at 10.7 km/h and 12.0 km/h, respectively.
Similarly, a detailed climatological analysis was conducted in Salas, Ica, to understand how the climatic conditions of this region can affect the productivity of asparagus crops. By comparing climatological data from Salaverry and Salas, differences and similarities can be identified that will be useful for optimizing crop productivity.
According to climatic data, Salas experienced temperatures ranging from 15 °C to 26 °C throughout the year, with variations in precipitation peaking in February and April, and the least amount of rain in August. The precipitation peaks in February and April may have coincided with the beginning of the asparagus harvest season, potentially affecting the quantity and quality of asparagus shoots. In Salas, the wind speed varied throughout the year, peaking in November at 9.3 km/h, with lower speeds in February and June at 8.3 km/h and 7.4 km/h, respectively. These variations in wind speed could directly impact the growth and harvest of asparagus, affecting the productivity of this crop.

2.3. Image Processing and Attainment of Desired Classification

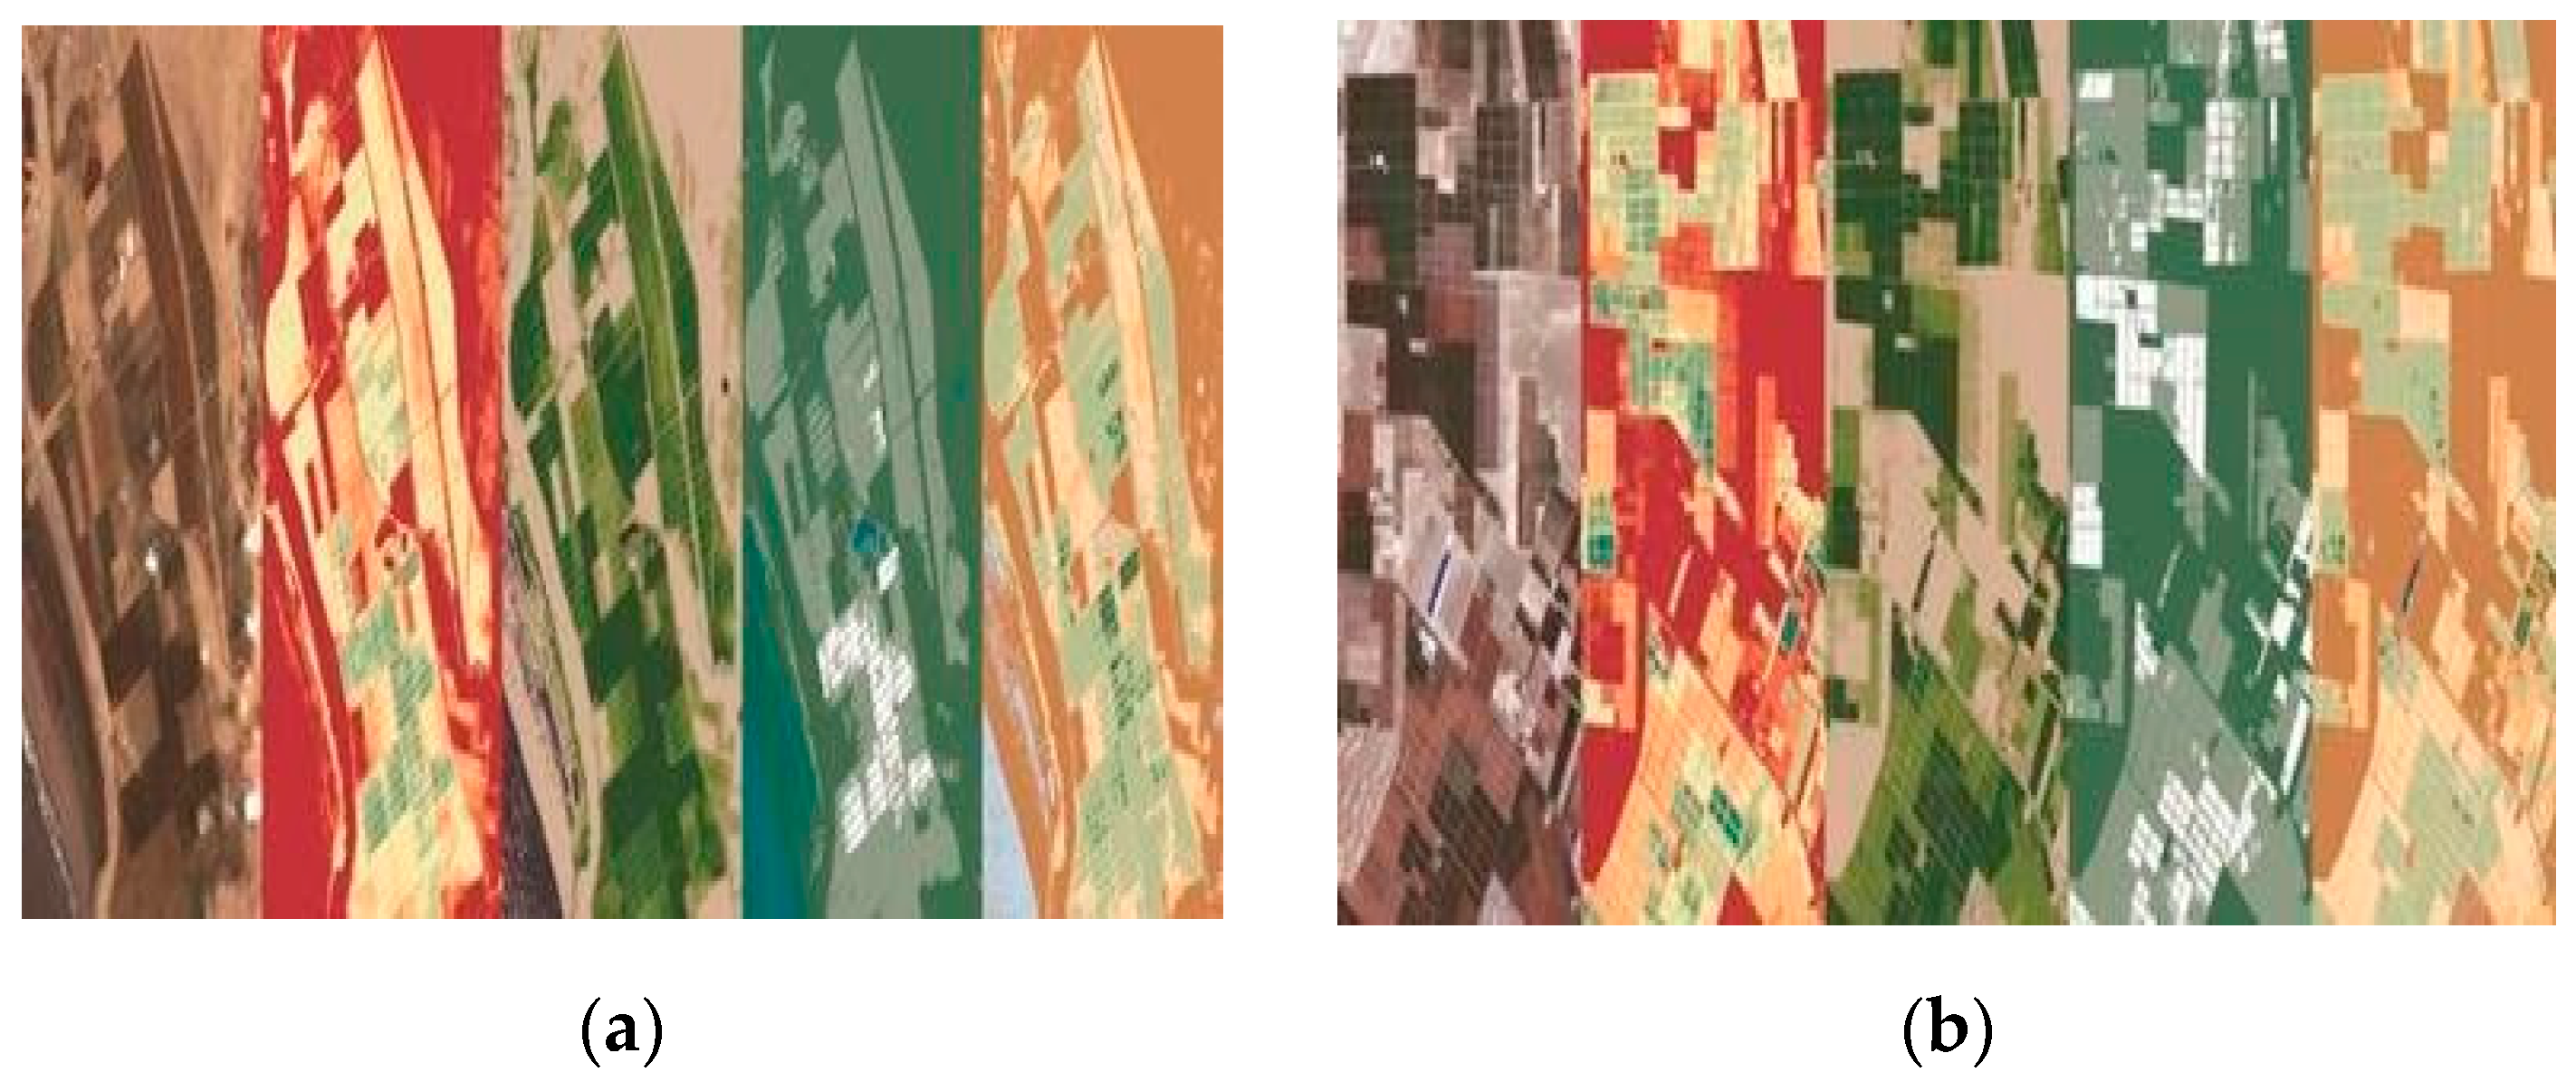
Image processing was pivotal in our study for extracting valuable information from satellite images. MATLAB, a high-level programming environment, was employed for this purpose. Initially, we standardized the image sizes using MATLAB functions to ensure uniformity before inputting them into the neural network for classification. Following image scaling, we combined five distinct images: RGB, the NDVI, the classic NDVI, the NWDI, and the EVI [7]. Each image offered a unique perspective on field vegetation, providing a comprehensive view of productivity. Despite varying measurement scales for indices such as the NDVI, the classic NDVI, the NWDI, and the EVI (Table 1), understanding these scales was crucial for interpreting classification results and making informed decisions about field productivity.
Based on these indices, we classified the field into three categories: high, medium, and low productivity. This classification allowed us to identify areas of the field that may need additional attention or that are particularly productive.
As shown in Figure 2a, this is the training image of the La Libertad region, which will be input into the neural network for analysis. The various colors in the image represent different indices, namely the Natural Index, NDVI, NDWI, and EVI, as outlined in Table 1. These indices are crucial for understanding vegetation health, water content, and overall environmental conditions. Similarly, Figure 2b presents the corresponding data for the Ica region, illustrating the application of the same indices for comparison and analysis.

2.4. Training and Use of the Neural Network Model (AlexNet)

This study utilized AlexNet, a proven Convolutional Neural Network (CNN) architecture renowned for its efficacy in image classification [8]. Consisting of five convolutional layers, three fully connected layers, and a softmax output layer, AlexNet enables the extraction of high-level features crucial for accurate harvest state classification. MATLAB was employed for training using a pre-trained AlexNet on ImageNet with an input image size of 227 by 227 pixels. The model was trained on labeled Sentinel-2 satellite images representing various harvest states, adjusting its weights and biases during training to minimize prediction differences [9]. Post-training, AlexNet classified new images, determining harvest states by analyzing softmax output probabilities.
In terms of accuracy and efficiency, AlexNet demonstrates effectiveness in image classification tasks. This study anticipated the model’s ability to accurately assess asparagus crop states based on Sentinel-2 satellite images. However, the final accuracy depended on factors like image quality, training set representativeness, and network architecture suitability. Despite these challenges, confidence remained in the methodological approach’s ability to yield accurate and beneficial results for optimizing asparagus crop productivity.

3. Results

In this section, we present the results obtained during the training and evaluation of Grad-CAM in the framework of the study entitled “Comparative Study of Asparagus Production and Quality in Two Coastal Regions of Peru Based on Their Different Meteorological Conditions for Crop Productivity Optimization”.
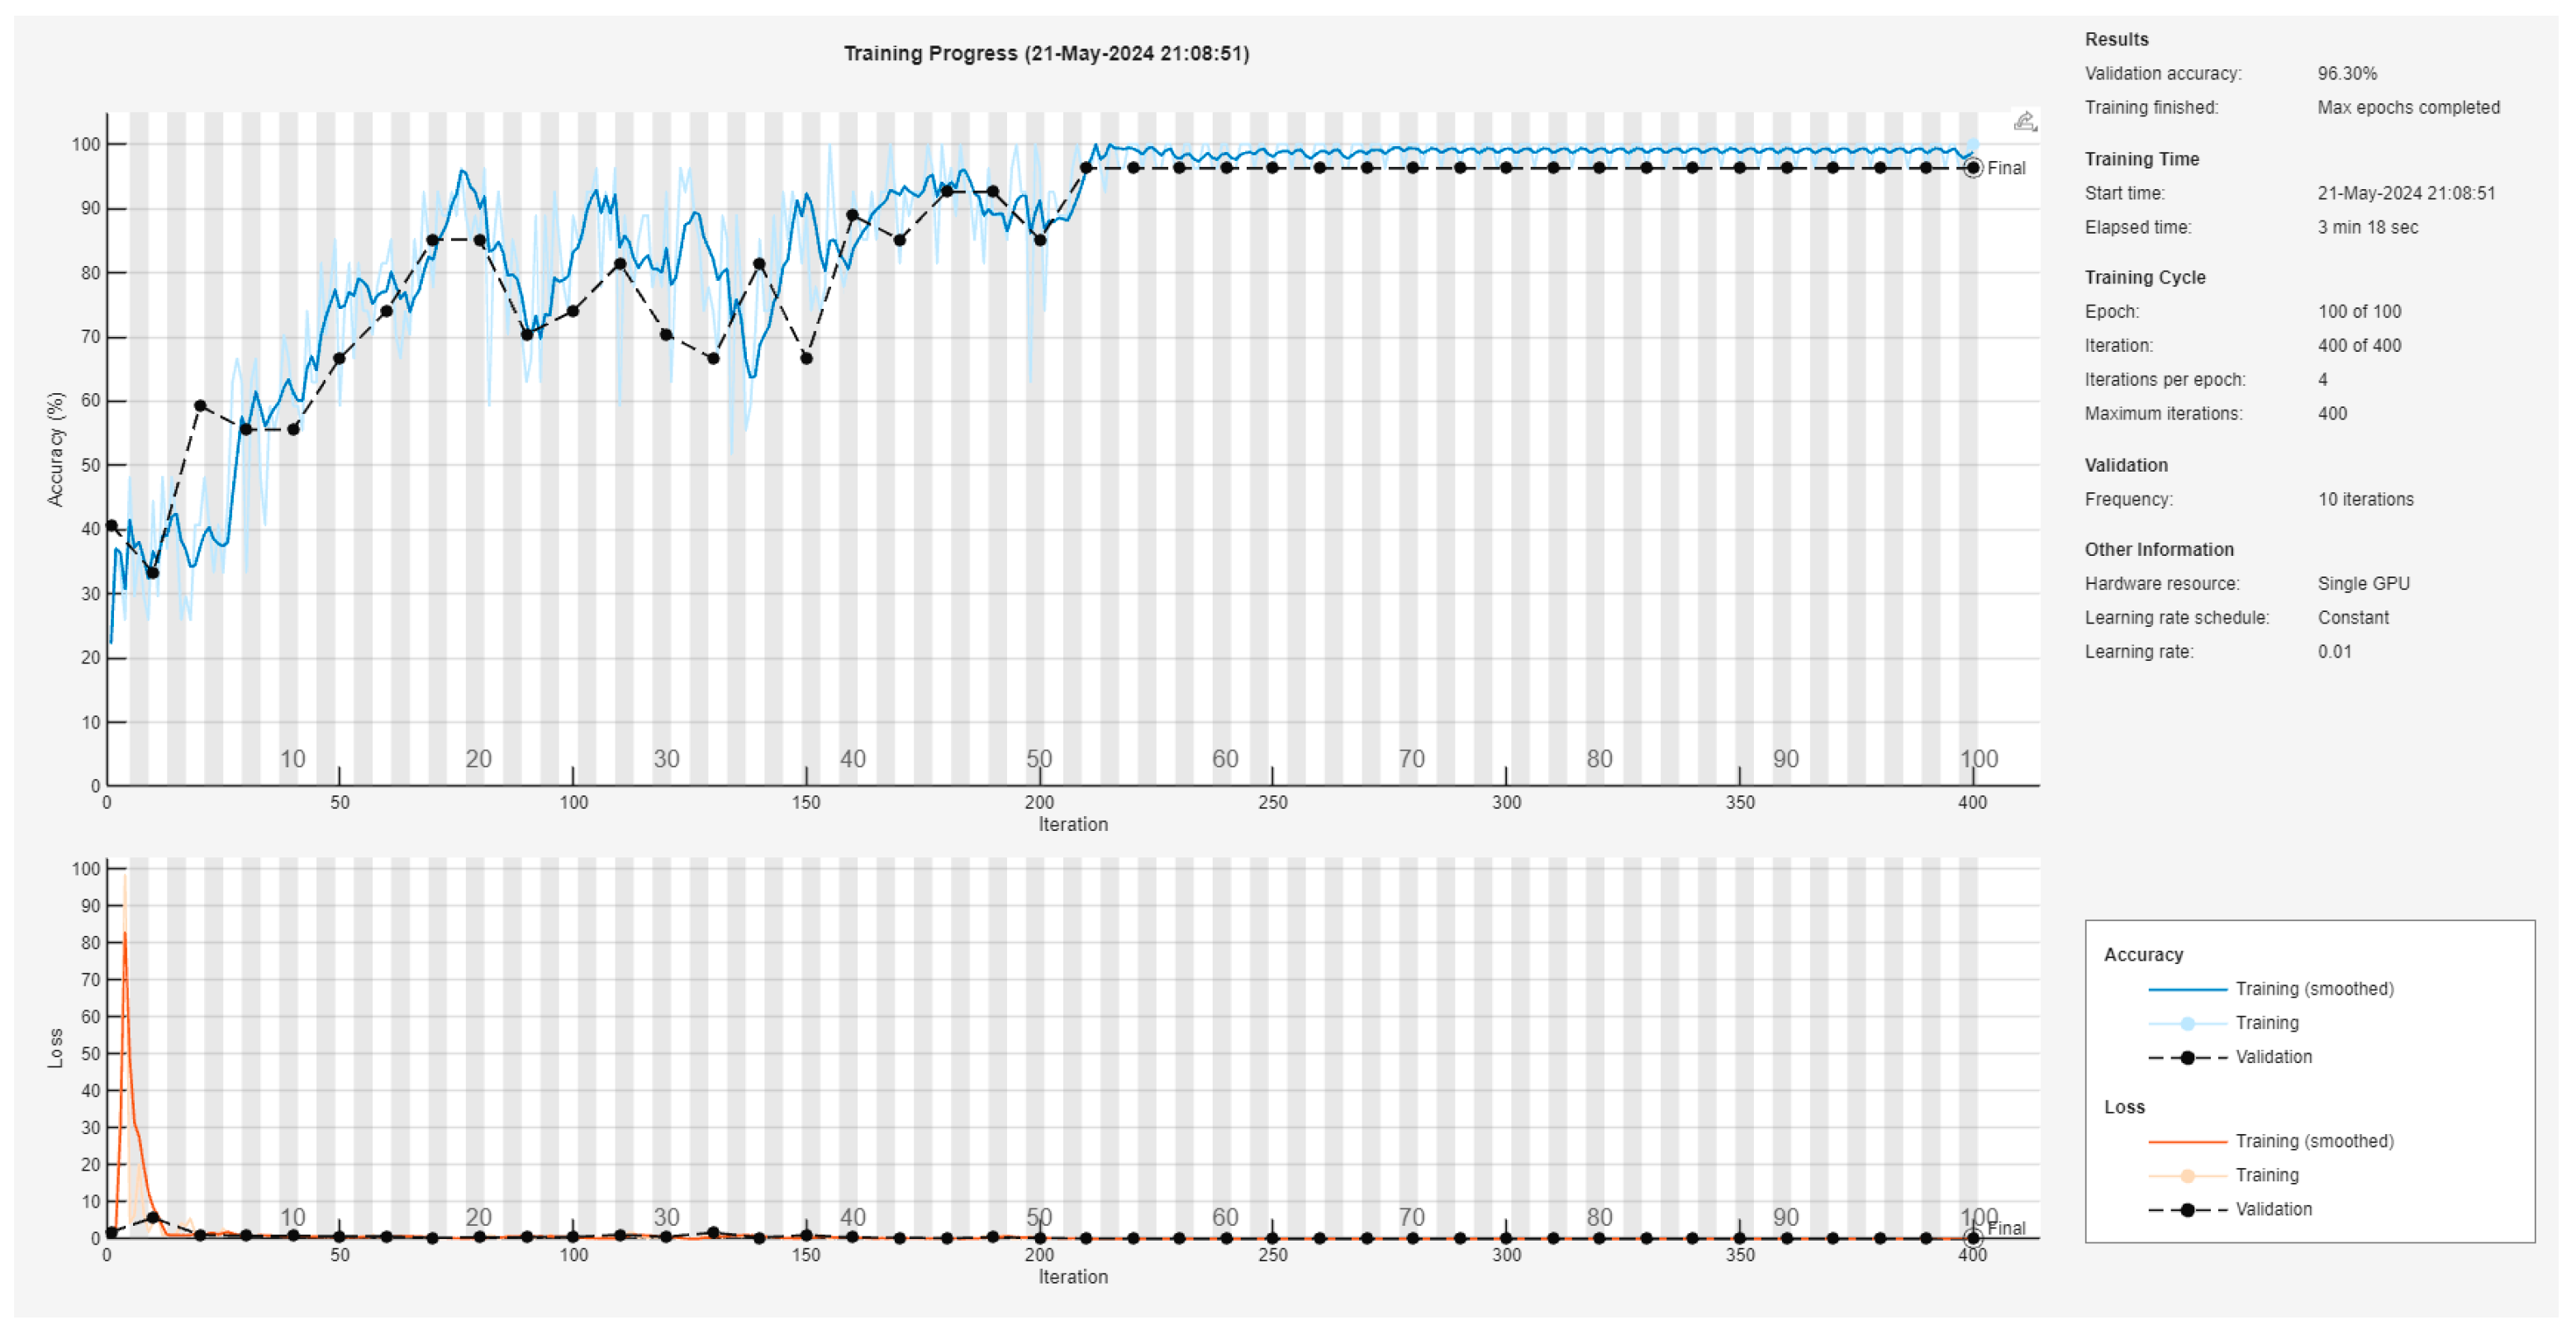
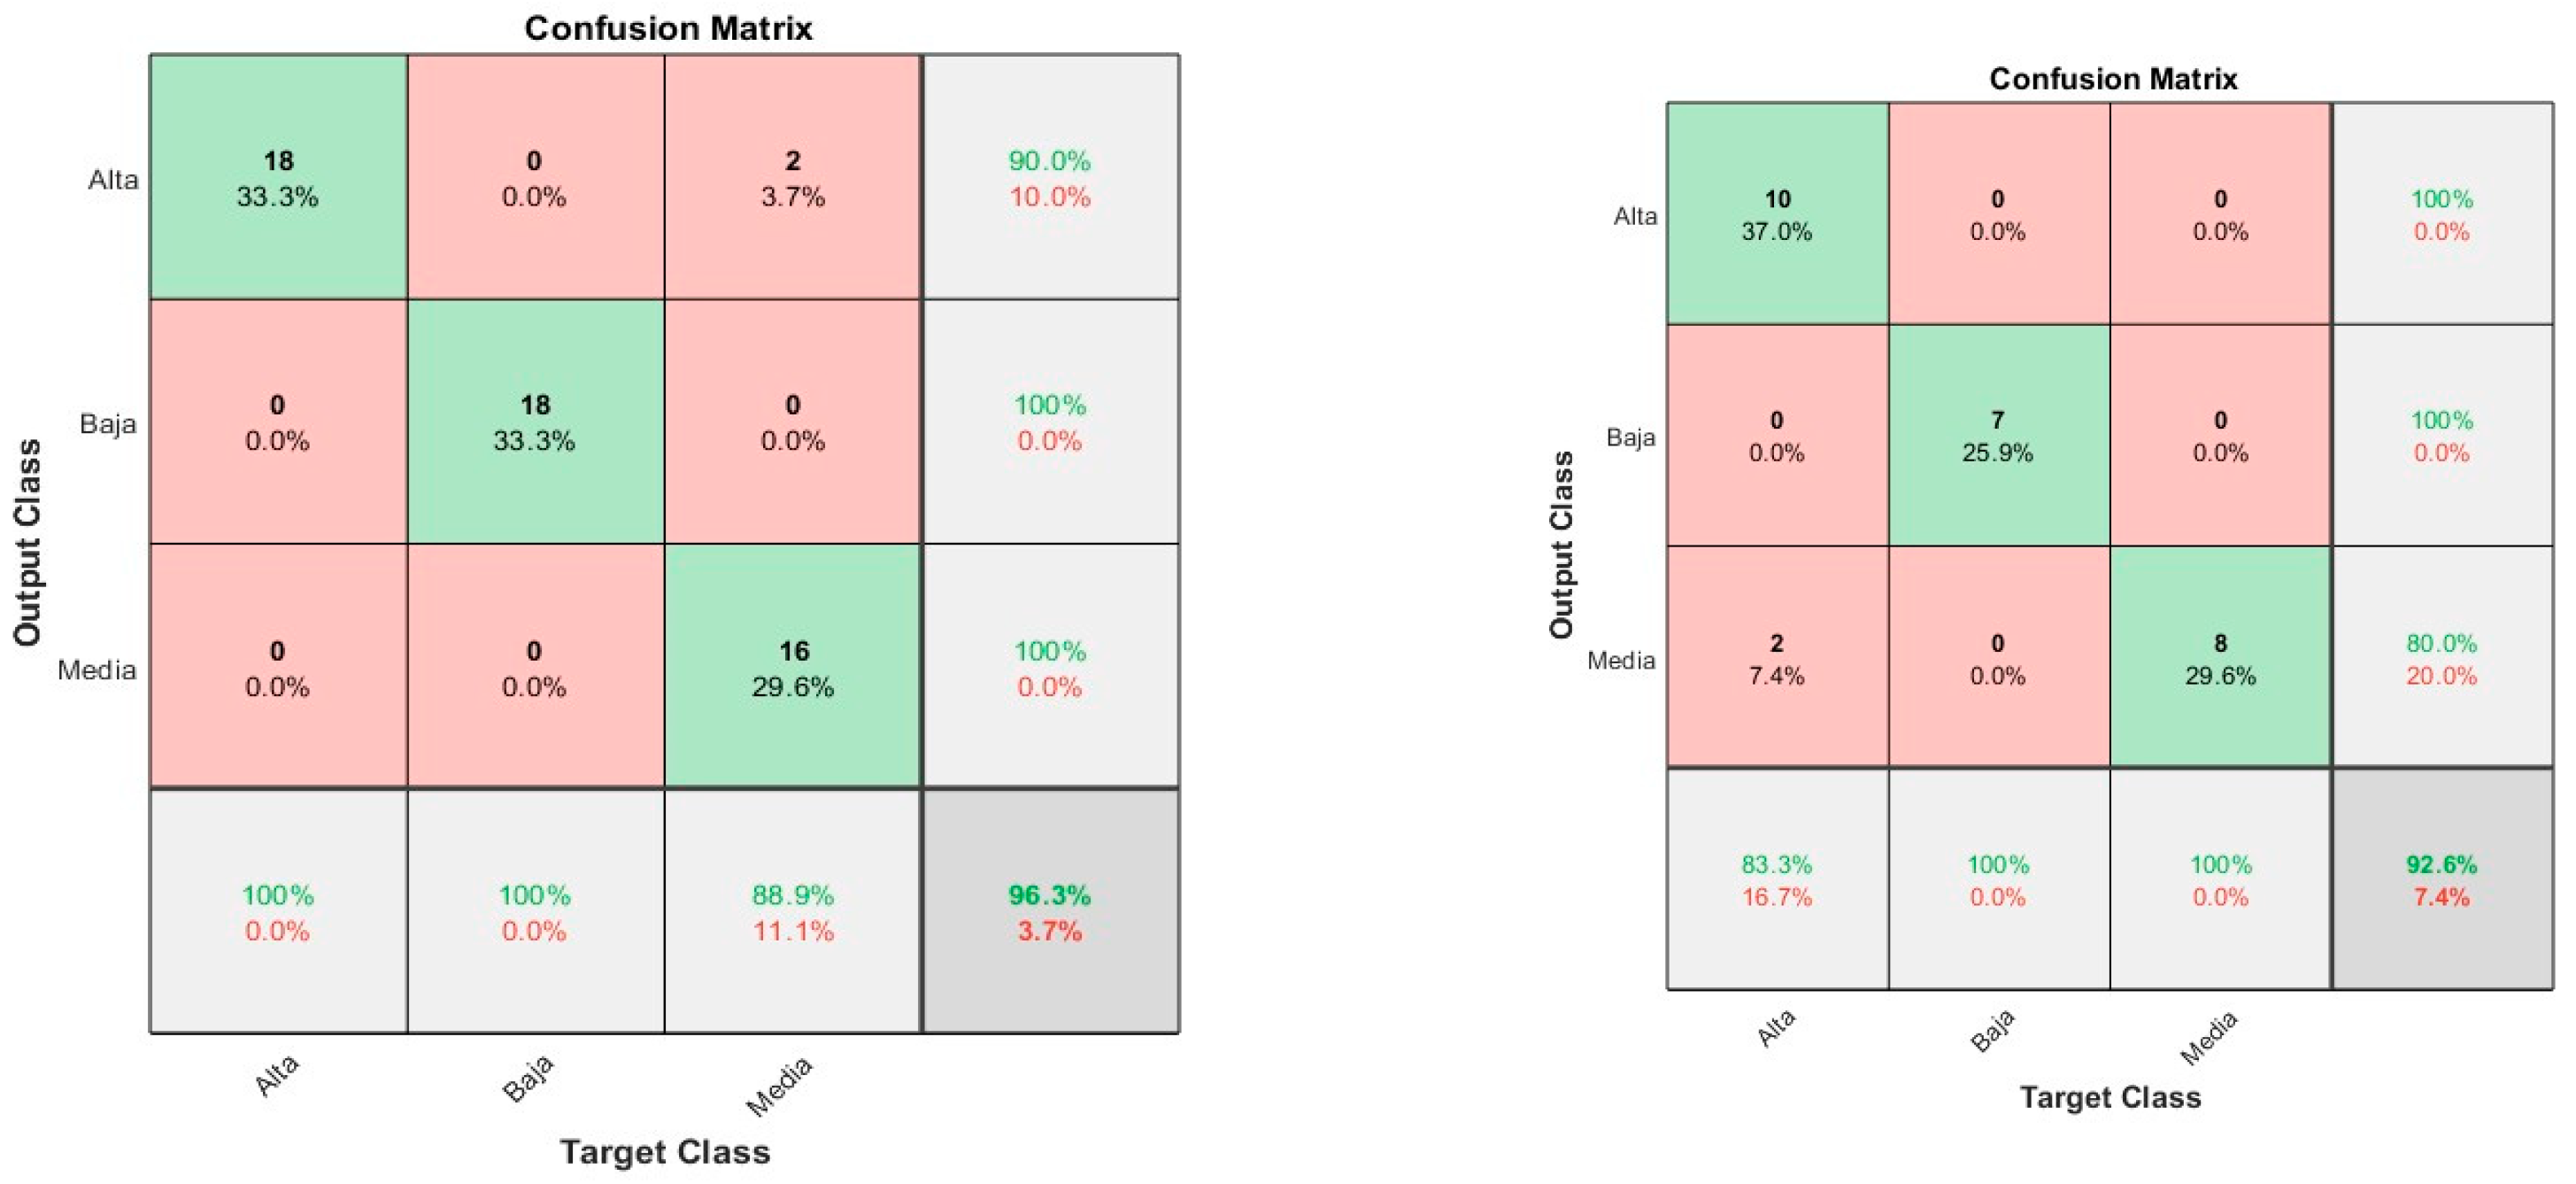
Figure 3 illustrates the results of the neural network training used to predict crops in the La Libertad region [10]. The network demonstrated a notable accuracy of 96.30% in data validation, indicating a substantially effective training process relevant to our research objectives. However, a more detailed analysis reveals certain limitations. During training, the neural network encountered difficulties recognizing two images, incorrectly categorizing them as medium or low quality. This observation is reflected in the associated confusion matrix (Figure 4).
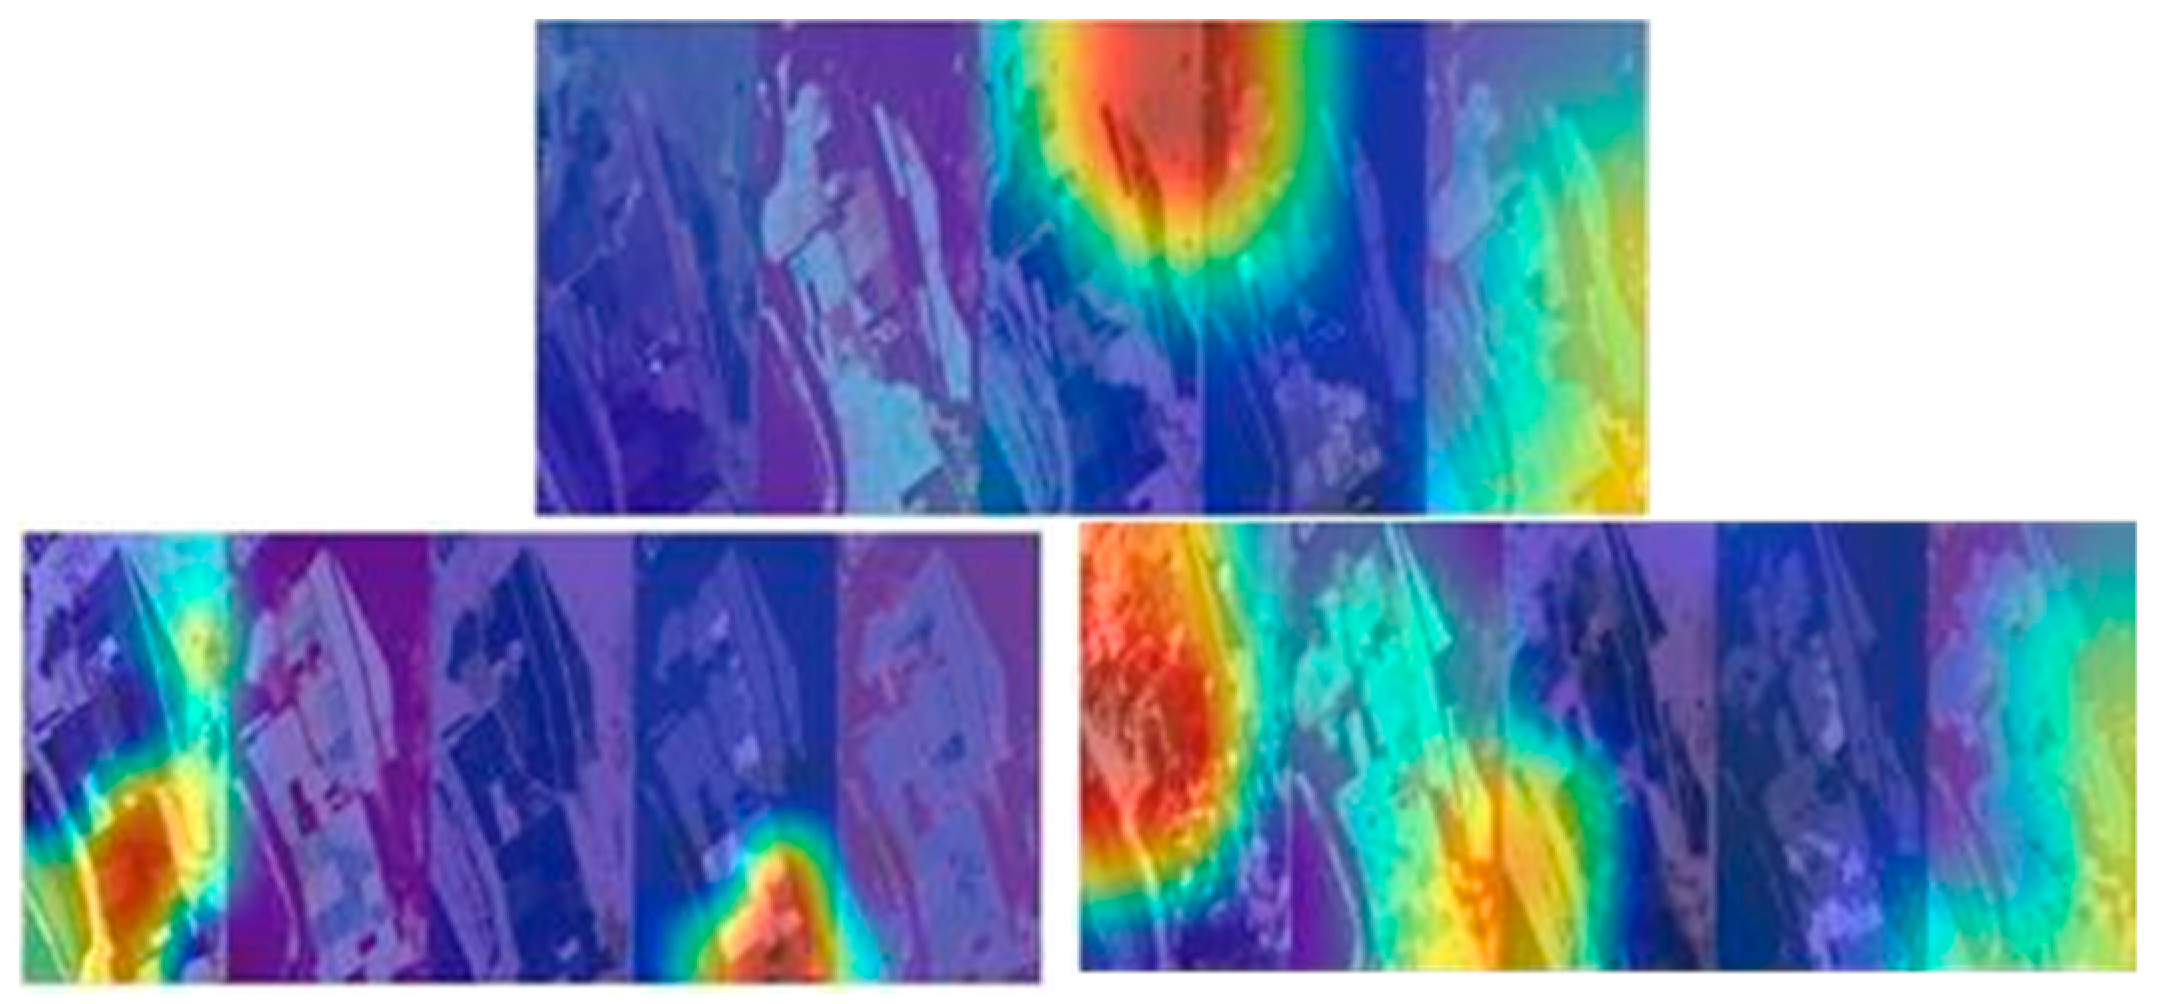
In the validation phase, a similar challenge was identified with an image misclassified as being between low or medium quality. In comparison, the neural network based on the AlexNet architecture demonstrated general classification capability, but these specific instances of confusion highlight potential areas for model improvement. This analysis is further corroborated by the examination of Grad-CAM (Figure 5), providing a detailed perspective on the network’s focus areas during classification.
While our neural network exhibited overall strong performance in classifying images from the La Libertad region, province of Trujillo, Salaverry district, it is important to note that the network assists in accurately categorizing the entered image for the evaluation of the climate of the month corresponding to the image.
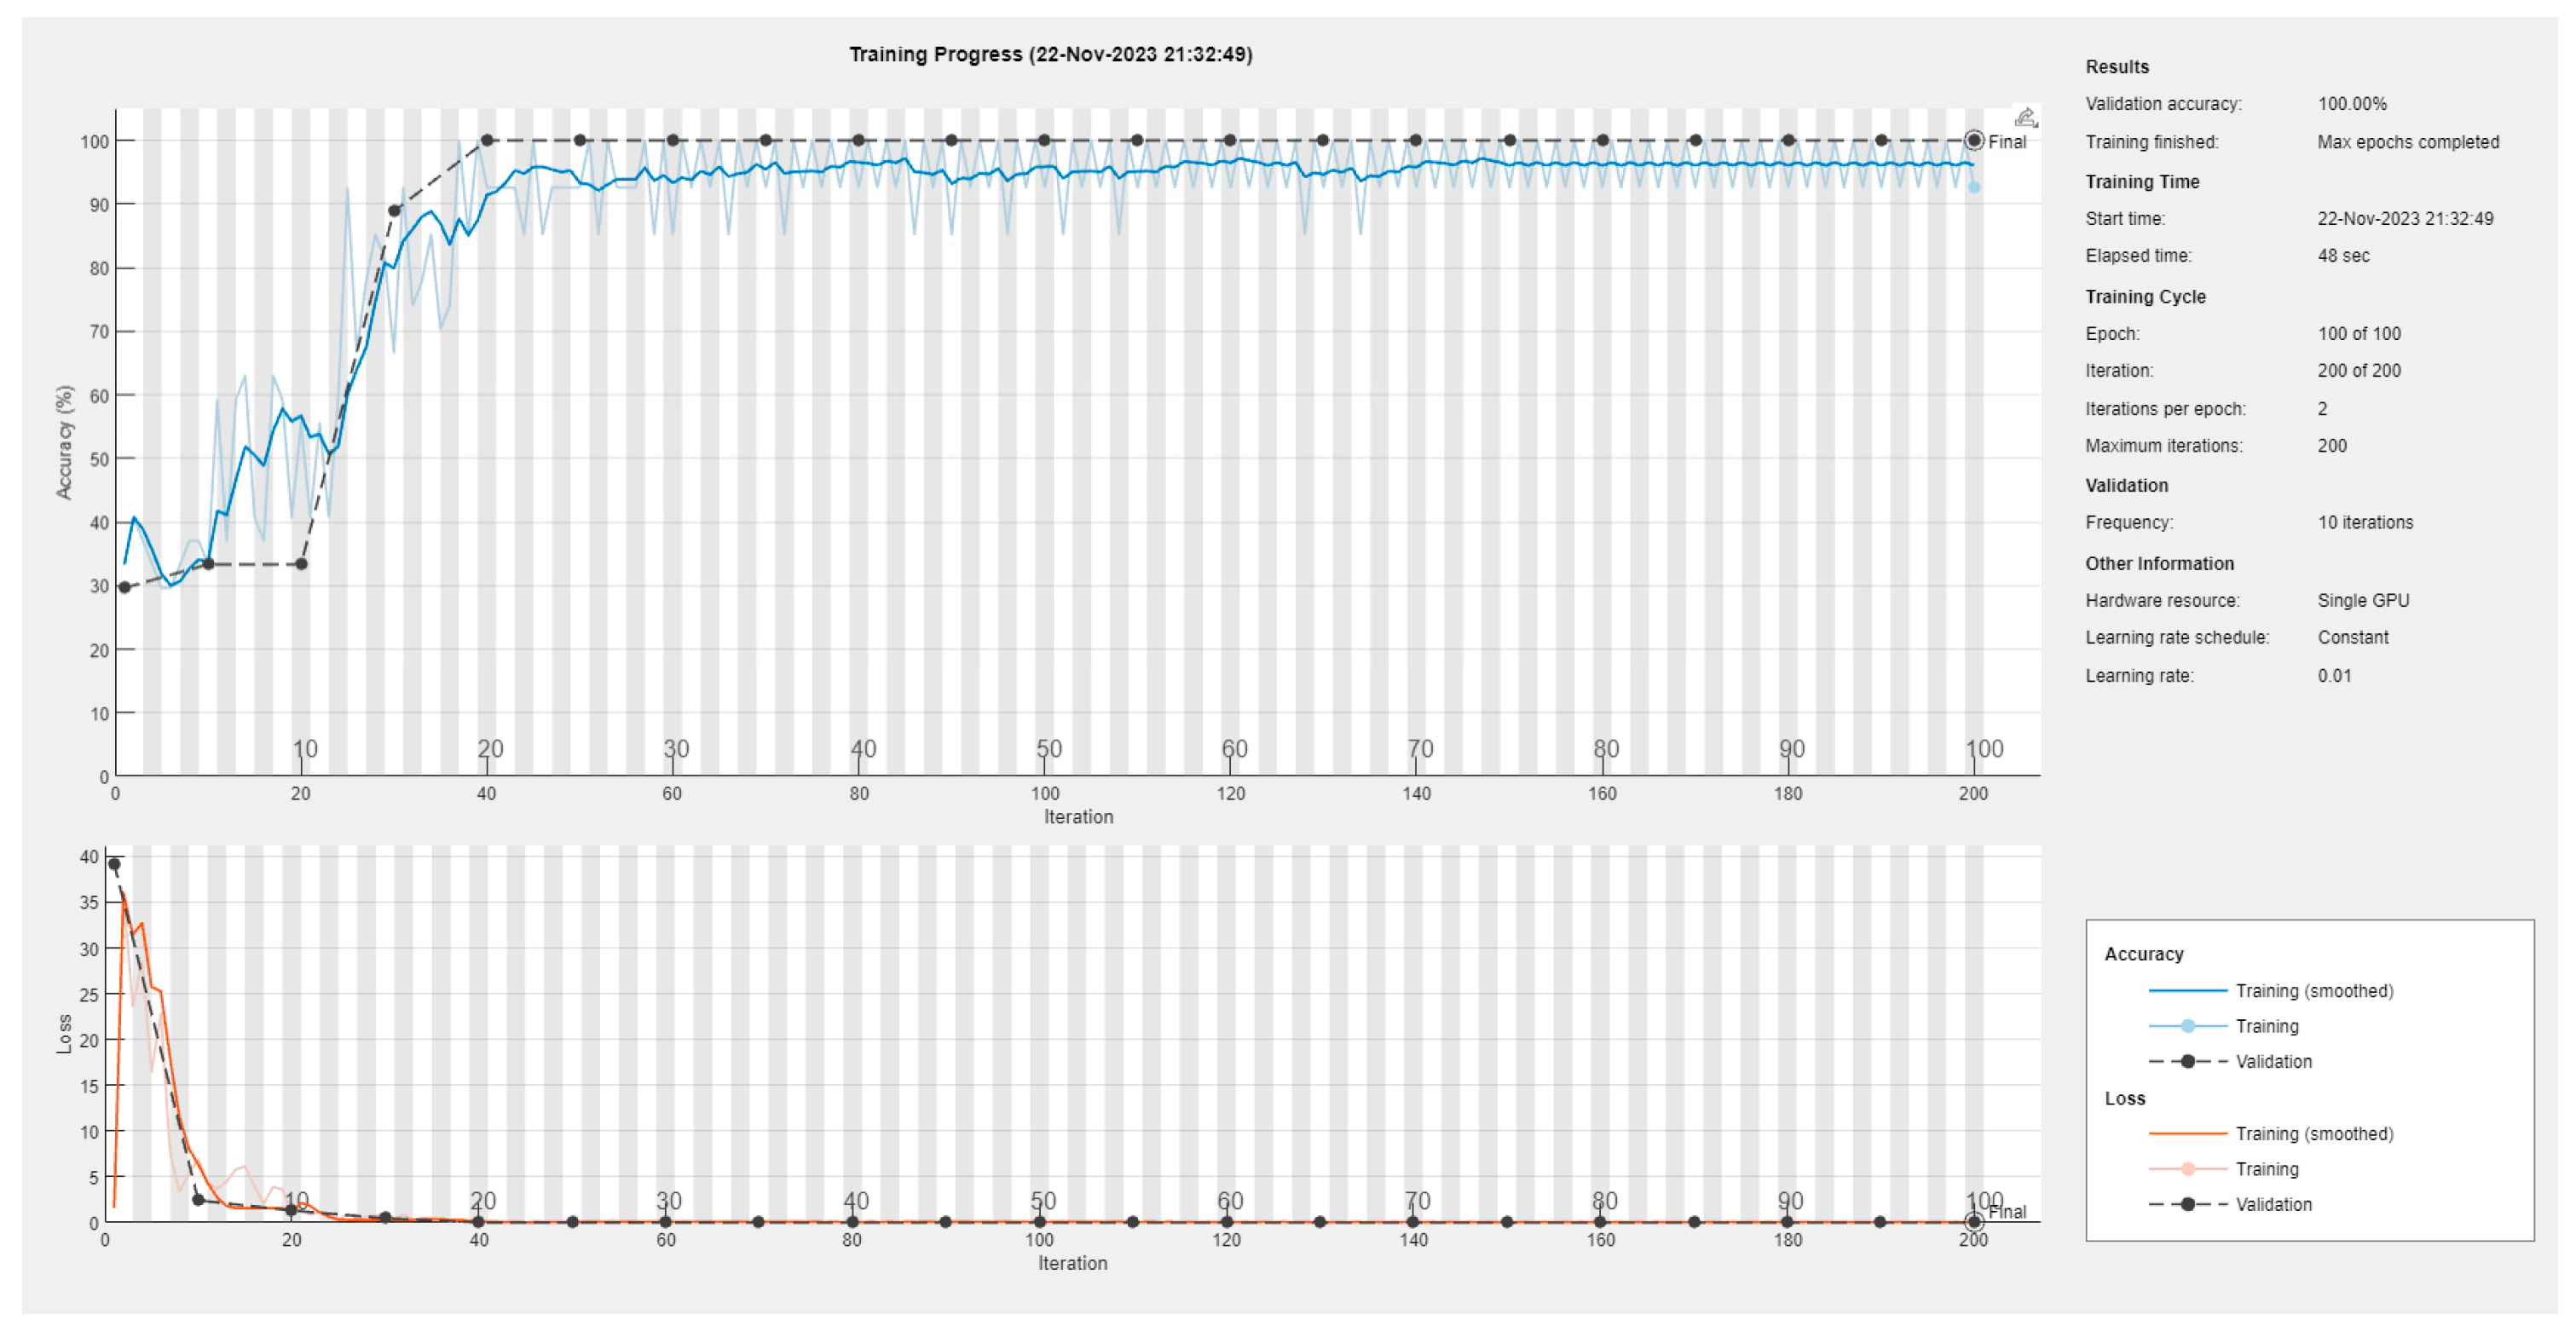
Expanding our analysis to the Ica region, Figure 6 illustrates a remarkable 100% accuracy achieved during neural network training [11]. This implies that the training model and neural network exhibited exceptional precision during the validation phase. However, a nuanced observation reveals potential intricacies in the training set, as evidenced by discrepancies in image classification within the confusion matrix (Figure 7). It is noteworthy that while the overall accuracy is perfect, delving into the details exposes areas where the model may benefit from further refinement. The retained intricacies in the training set underscore the importance of scrutinizing both successful and erroneous classifications.
Now we can see that in the Grand Cam evaluation, the fields are recognized by different patterns, which validates that the network can identify any field, indicating that for the high productivity field, more image quantity is required to recognize that it is of a certain category (Figure 8) [12]. This feeds what the confusion matrix says, as at the time of training the network may make a mistake in choosing whether it is high or medium productivity because the patterns of these two productivity levels are very similar [10].

4. Discussion

According to our results, the AlexNet neural network was trained with a small number of images (225), 45 images for each class (RGB, the NDVI, the classical NDVI, the NDWI, and the EVI) after preprocessing, as described by ref. [5], where the higher the number of training images, a response accuracy of 99.80% response accuracy with a total of 800 images was obtained, while for a range of images from 71 to 297, a maximum accuracy of 93.79% was obtained. Although the results showed a high percentage of image validation by the neural network in both regions, it does not mean that the response accuracy will be high.
On the other hand, training was conducted with the five classes mentioned above, and this may have interfered with the responses, ref. [13] only analyzed the NDVI which can obtain the data of two bands and obtained results of an accuracy up to 99.78%. It must be considered that there must be a balance between the data entered in each class because an imbalance can be a counterproductive factor due to overfitting and incorrect training, and because the latter process can entail many hours on a computer with a high-performance GPU, which limits the results [4].
The AlexNet neural network is a good alternative for agribusiness use; however, it is more often used to identify diseases in specific crops due to its potential capacity as a limited learning system [13], as seen in the study conducted by ref. [5] where 148,428 images of leaves infected with nine diseases were taken and the classifier was trained with a Convolutional Neural Network (CNN) by evaluating a dataset for disease identification, which focused on manual classification features of the type of pathology present on the leaf, in order to be able to establish parameters related to plant health. The accuracy performances of AlexNet are low compared to other neural networks such as GoogLeNet, InceptionV3, and Xception ref. [6].
On the other hand, the network was given three analysis alternatives (high, medium, and low), resulting in a high learning result, but with errors at the time of testing. This may be due to the number of alternatives proposed, since in works such as that of [8] only two alternatives were used in order not to incur the error, which was achieved since the network had an accuracy of 99.83%, but this also influences the amount of data entered, as mentioned above. As such, a mixture of fewer alternatives and a larger entered set of data gave us as a result with a higher accuracy compared to other combinations of parameters.
In addition, it was taken into consideration that there may be a misreading by the neural network due to the fact that images were used where the crops are very variable, such that in the study area, the asparagus could have been at different seasonal stages, giving greater margin of error to the system. On the other hand, another reason that may have affected the accuracy of the model used may be the mixed pixels in the same scanned plane, as well as an insufficient spatial resolution for the crop, i.e., an inability to distinguish between two continuous pixels, which generates erroneous readings, as may have been the case of confusion between the medium and low productivity levels [2].

5. Conclusions

The AlexNet neural network, implemented with the GradCAM method, proved to be successful in the validation of satellite images, achieving remarkable accuracy percentages, such as 100% in the Salas classification and 96.30% in the Salaverry classification. Despite the high accuracy percentages, confusion was observed in the neural network, especially between the medium and low parameters. This suggests a possible limitation in the learning capacity of the network to deal with the complexity required by the satellite images.
The importance of proper data preprocessing is emphasized, as misinterpretation of pixels in the image could lead to errors. This critical step must be approached carefully to ensure the quality of the input data. The inclusion of five proposed classes (RGB, the NDVI, the NDWI, the original NDVI, and the EVI) shows the diversity of analyses carried out. This comprehensive approach allowed for a deeper understanding of the images and may be crucial for the development of more accurate models in the future.
Future analyses using neural networks with a higher learning capability are suggested. This could help overcome the current limitations and improve the accuracy of the responses, especially in addressing the observed confusion between the medium and low parameters.

Author Contributions

Conceptualization: S.C., P.V., D.P. and G.H.; Methodology: S.C. and A.A.; Software: S.C.; Validation: P.V. and S.C.; Formal Analysis: S.C.; Investigation: S.C., P.V., D.P. and G.H.; Resources: A.A. and S.C.; Data Curation: S.C. and P.V.; Writing-Original Draft Preparation: D.P. and G.H.; Writing-Review and Editing: S.C. and P.V.; Visualization: S.C., P.V., D.P. and G.H.; Supervision: A.A.; Project Administration: A.A., D.P. and G.H.; Final Statement: G.H. All authors have read and agreed to the published version of the manuscript.

Funding

This research did not receive external funding.

Institutional Review Board Statement

Not applicable.

Informed Consent Statement

Not applicable.

Data Availability Statement

The data supporting the results of this study are available upon reasonable request from the corresponding author. The data are stored in the author’s personal storage and can be shared after appropriate request and approval.

Conflicts of Interest

The authors declare no conflict of interest.

References

  1. Romero-Vergel, A.P. TURION: A physiological crop model for yield prediction of asparagus using sentinel-1 data. Eur. J. Agron. 2023, 143, 126690. [Google Scholar] [CrossRef]
  2. Navrozidis, I.; Alexandridis, T.K.; Dimitrakos, A.; Lagopodi, A.L.; Moshou, D.; Zalidis, G. Identification of purple spot dis-ease on asparagus crops across spatial and spectral scales. Comput. Electron. Agric. 2018, 148, 322–329. [Google Scholar] [CrossRef]
  3. Wang, M.; Fu, J.; Wu, Z.; Pang, Z. Spatiotemporal Variation of NDVI in the Vegetation Growing Season in the Source Region of the Yellow River, China. ISPRS Int. J. Geo-Inf. 2020, 9, 282. [Google Scholar] [CrossRef]
  4. Araiza, M.; Guerrero, C.; Olvera, C.; Meada, V.; Espinoza, G.; Bordón, R. Redes Neuronales Convolucionales para la Detección y Clasificación de Enfermedades de Plantas Basadas en Imágenes Digitales. Uazedumx [Internet]. 2018. Available online: http://ricaxcan.uaz.edu.mx/jspui/handle/20.500.11845/1910 (accessed on 30 September 2023).
  5. Brahimi, M.; Boukhalfa, K.; Moussaoui, A. Deep learning for tomato diseases: Classification and symptoms visualization. Appl. Artif. Intell. AAI 2017, 31, 299–315. [Google Scholar] [CrossRef]
  6. Silva-Perez, C.; Marino, A.; Cameron, I. Monitoring Agricultural Fields Using Sentinel-1 and Temperature Data in Peru: Case Study of Asparagus (Asparagus officinalis L.). Remote Sens. 2020, 12, 1993. [Google Scholar] [CrossRef]
  7. EOS DATA ANALYTICS. NDMI: Fórmula del Índice e Interpretación de Valores. EOS Data Analytics. 7 February 2022. Available online: https://eos.com/es/make-an-analysis/ndmi/ (accessed on 14 September 2023).
  8. Mokhtar, U.; El Bendary, N.; Hassenian, A.E.; Emary, E.; Mahmoud, M.A.; Hefny, H.; Tolba, M.F. SVM-based detection of tomato leaves diseases. In Advances in Intelligent Systems and Computing; Springer International Publishing: Cham, Switzerland, 2015; pp. 641–652. [Google Scholar]
  9. Centro Nacional de Planeamiento Estratégico (2022). Análisis de Imágenes Satelitales Para el Estudio de Dinámicas Territoriales. Available online: https://cdn.www.gob.pe/uploads/document/file/4010273/CEPLAN%20-%20Analisis%20de%20imagenes%20satelitales_.pdf.pdf (accessed on 13 September 2023).
  10. Simonyan, K.; Vedaldi, A.; Zisserman, A. Deep Inside Convolutional Networks: Visualising Image Classification Models and Saliency Maps. 2014. Available online: https://arxiv.org/pdf/1312.6034 (accessed on 18 September 2019).
  11. Kapishnikov, A.; Venugopalan, S.; Avci, B.; Wedin, B.; Terry, M.; Bolukbasi, T. Guided Integrated Gradients: An Adaptive Path Method for Removing Noise. In Proceedings of the IEEE/CVF Conference on Computer Vision and Pattern Recognition, Nashville, TN, USA, 20–25 June 2021; pp. 5050–5058. [Google Scholar]
  12. Selvaraju, R.R.; Cogswell, M.; Das, A.; Vedantam, R.; Parikh, D.; Batra, D. Grad-CAM: Visual Explanations from Deep Net-works via Gradient-based Localization. Int. J. Comput. Vis. 2020, 128, 336–359. [Google Scholar] [CrossRef]
  13. Unnikrishnan, A.; Sowmya, V.; Soman, K.P. Deep AlexNet with reduced number of trainable parameters for satellite image classification. Procedia Comput. Sci. 2018, 143, 931–938. [Google Scholar] [CrossRef]
Figure 1. Salaverry district, Trujillo, La Libertad (a), and Salas district, Ica, Ica (b).
Engproc 83 00014 g001
Figure 2. Images ready to enter the Salaverry–Trujillo (a) and Salas–Ica networks (b).
Engproc 83 00014 g002
Figure 3. Neural network training: La Libertad.
Engproc 83 00014 g003
Figure 4. Confusion matrices: La Libertad.
Engproc 83 00014 g004
Figure 5. Grad-CAM of La Libertad.
Engproc 83 00014 g005
Figure 6. Neural network training: Ica.
Engproc 83 00014 g006
Figure 7. Confusion matrices: Ica.
Engproc 83 00014 g007
Figure 8. Grad-CAM of Ica.
Engproc 83 00014 g008
Table 1. A description of the index ranges.
IndexRangeDetailed Interpretation
NDVI−1 to 1−1 to 0: non-vegetated surface, 0 to 1: healthy vegetation and increasing density.
NDWI−1 to 1−1 to 0: non-water or non-aqueous surfaces, 0 to 1: areas with water presence.
EVI−1 to 1−1 to 0: non-vegetated surface, 0 to 1: healthy vegetation and increasing density.
Note: Own elaboration.
Disclaimer/Publisher’s Note: The statements, opinions and data contained in all publications are solely those of the individual author(s) and contributor(s) and not of MDPI and/or the editor(s). MDPI and/or the editor(s) disclaim responsibility for any injury to people or property resulting from any ideas, methods, instructions or products referred to in the content.