Abstract
Lemon production in Piura, Peru faces climatic challenges such as droughts and El Niño. This study uses satellite indices (NDVI and NDWI) and convolutional neural networks (CNNs, specifically AlexNet) to analyze crop dynamics and health during extreme events. The results highlight the impact of extreme precipitation and temperatures, with reflectance levels as early indicators of deterioration. In 1998, El Niño reduced yield to 9.2 tons/ha, compared to 14 tons/ha in 2014. These variables provide key information for pruning, irrigation, and fertilization decisions, improving crop productivity.
1. Introduction
The El Niño phenomenon (ENP) is an atmospheric event that originates from the increase in sea surface temperature, due to the influx of large masses of warm water from the western Pacific to the equatorial Pacific. During this phenomenon, the ocean transmits energy to the atmosphere and as a result, changes in the distribution of precipitation and environmental temperature are generated; a precedent for this occurred during the ENP 1997–1998 where the temperature on the coast of Peru increased by 5 °C above normal, affecting the economy and productive activities such as agriculture, fishing, and livestock [1]. On the coast of Peru, the significant impact on agriculture due to the increase in air temperature is well known, whose levels depend on the intensity of the event. Temperature variations in each of its phases positively or negatively affect the various stages of plant development as well as its production. Excessive heat causes the plant to form a greater number of vegetative branches and abundant leaves but fewer flowers. Significant variations in precipitation stored in the soil and then taken up by the plant, its excess or deficit, affect the development and growth of crops and have a well-marked water demand from one phase to another; when the water content in the soil is not optimal, photosynthetic activity decreases affecting production and productivity [2].
Space remote sensing is a technique that allows obtaining information from an object on the Earth that is at a certain distance from a satellite sensor, through the measurement of reflected, absorbed, and emitted electromagnetic radiation coming from the Earth-atmosphere system [3]. In this regard, various objects or materials reflect and absorb different wavelengths of electromagnetic radiation, allowing to know and determine the type of material that reflects said wavelength, which can be detected by the sensors of a satellite. Such is the case that the correspondence between the reflected wavelength and the percentage of reflectance of the material on the Earth’s surface generates a spatial reflectance curve known as a spectral signature, giving the possibility of determining it in an optical image coming from satellites; these spectral signatures are unique for each particular characteristic, as they are composed of their own levels of absorption, emission, reflectance, or transmission [4]. In this way, when a study of the coverage or density of vegetation in an agricultural field is carried out, healthy vegetation or leaves absorb the blue and red wavelengths coming from the Sun’s electromagnetic radiation; yet, the green, as well as the near-infrared, wavelengths are reflected. However, as the visible spectrum of the human eye cannot identify infrared radiation, it is observed that healthy vegetation always has the color green [5]. This means that the spectral signature associated with the vegetation cover of a particular fruit crop will depend on the characteristics contained in its healthy leaves, for example, in its epidermis and mesophyll, including the spectral signature of the fruit itself.
On the other hand, unlike empirical or numerical approaches, machine learning methods are receiving increasing attention in research on land surface modeling. Convolutional neural networks (CNNs) have the ability to learn functional relationships between independent and dependent variables. These CNNs provide a hierarchical representation of the input data by using multiple convolutional layers and are effective in handling large amounts of data over long time series. Given these advantages of CNNs, some studies have used them to predict the normalized difference vegetation index (NDVI) [6]. Therefore, a novel hybrid deep model is presented to predict climate events using a combined training algorithm. Initially, preprocessing of the input satellite image is performed using the median filtering method. Subsequently, the preprocessed image is divided into segments using the k-means clustering algorithm, which is based on weighted cubic chaotic maps. After this stage, features are extracted from the segmented image, such as the differential vegetation index (DVI), normalized differential vegetation index (NDVI), modified transformed vegetation index (MTVI), green vegetation index (GVI), and the soil-adjusted vegetation index (SAVI) [7].
At the national level, the Piura Region led the harvests with 57.3%, with the provinces of Sullana and Piura being the most notable, contributing with 48.3% and 45.7%, respectively, to the total harvested in the department. Regarding yield, a notable decrease was observed in 1998 due to the 1997/1998 El Niño phenomenon, reaching only 9.2 tons per hectare and causing the loss of agricultural land. Similarly, the El Niño phenomena of 2004–2005 and 2009–2010 affected production, reducing it to 202 thousand and 197 thousand tons, respectively [8].
The objective of the present study is to analyze the growth and health trend of the lemon crop during the El Niño phenomenon, evaluating spatial–temporal agricultural production, using variables such as the NDVI, the NDWI, and temperature. This, in turn, can help growers make informed decisions about pruning, irrigation, and fertilizer application to improve overall crop productivity.
2. Materials and Methods
2.1. The Proposed Methodology
The proposed methodology involves data preparation, specifically collecting remote sensing images such as the NDVI and NDWI extracted from Sentinel-2. Subsequently, image preprocessing takes place, where both images are merged to serve as input variables for the neural network. Finally, the database will be classified based on three criteria (Figure 1).
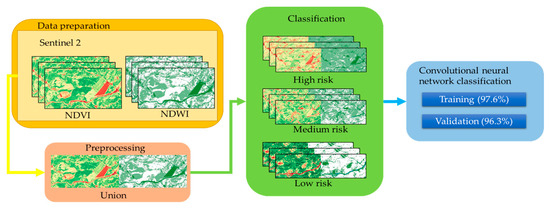
Figure 1.
Block diagram of the algorithm.
2.2. Study Area
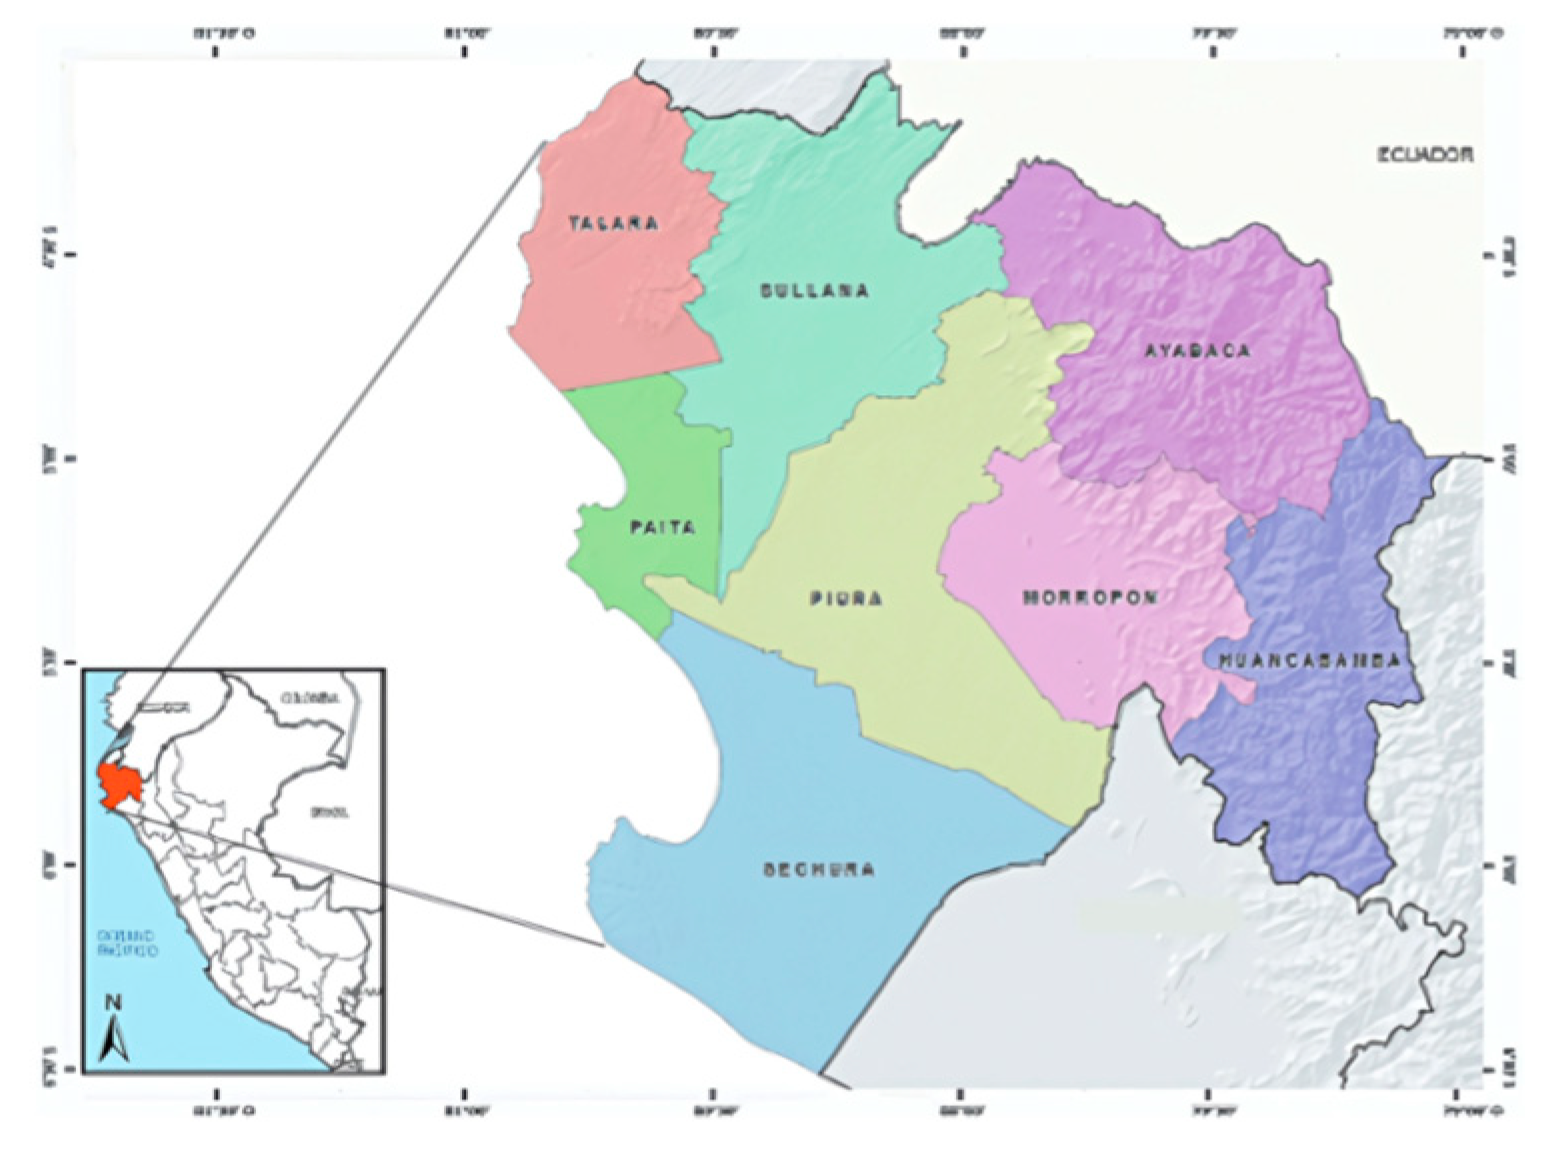
The Piura Region is one of the main lemon-producing regions, with an average national production of 55.2% recorded in the last decade. The main producing areas in this region are the San Lorenzo Valley, Sullana, and Chulucanas [9]. Tambo Grande, located in the San Lorenzo Valley, is the leading district in lime production (Figure 2) [10]. However, it is among the departments most affected by adverse climatic events, such as the El Niño phenomenon, prolonged periods of drought, cyclones, and landslides. For the present study, we focus on a small productive area in Tambo Grande, delimited by the latitudes of (−4.960641, −4.933791° S), longitudes of (−80.302248, −80.254354° W), and covering an area of 15.88 km2.
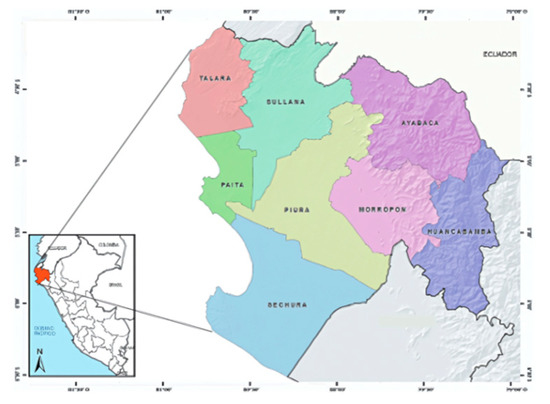
Figure 2.
Study area.
2.3. Meteorological Data
For this study, meteorological data obtained through Landviewer and Sentinel-2 satellite images were used, with a resolution of 10 m per pixel and less than 10% cloud cover, covering the lemon fields in Tambo Grande. A total of 96 images in PNG format, with dimensions of 2132 × 600 pixels, were used in time series between 1 January 2019 and 15 October 2023. In addition, minimum and maximum temperature data were collected from each satellite image to analyze its correlation with crops. The use of satellite images from Sentinel-2 provides detailed information over large areas of land, offering relevant data on the trend, growth dynamics, and health of crops.
2.4. Remote Sensing Data and Preprocessing
In the present study, the Sentinel-2 reflectance product was utilized to calculate both the NDVI and the NDWI. These calculations were performed by overlaying the necessary high-quality layers to obtain the desired image. The NDVI serves as an indicator that allows us to understand the amount of vegetation in an area. This indicator aids in monitoring crops, assessing droughts, predicting production, and identifying susceptible areas. Using data from the near-infrared (NIR) and red (RED) bands, as per Equation (1), we obtain an image depicting the state of the crops.
NDVI = (Band NIR − Band RED)/(Band NIR + Band RED)
The NDVI varies between −1 and 1, and in the images from red to dark green, values of 1 and dark green show the presence of vegetation in good health and production. Meanwhile, the NDWI is an indicator that helps us identify the presence of water in the area. A high value of this, or presence of light blue color in the image, represents the presence of water, while a low value or presence of dark green color means a lack of water. This value can be altered in Tambo Grande due to the level of risk posed to crops, such as rain and elevated temperatures.
NDWI = (Band GREEN − Band NIR)/(Band NIR + Band GREEN)
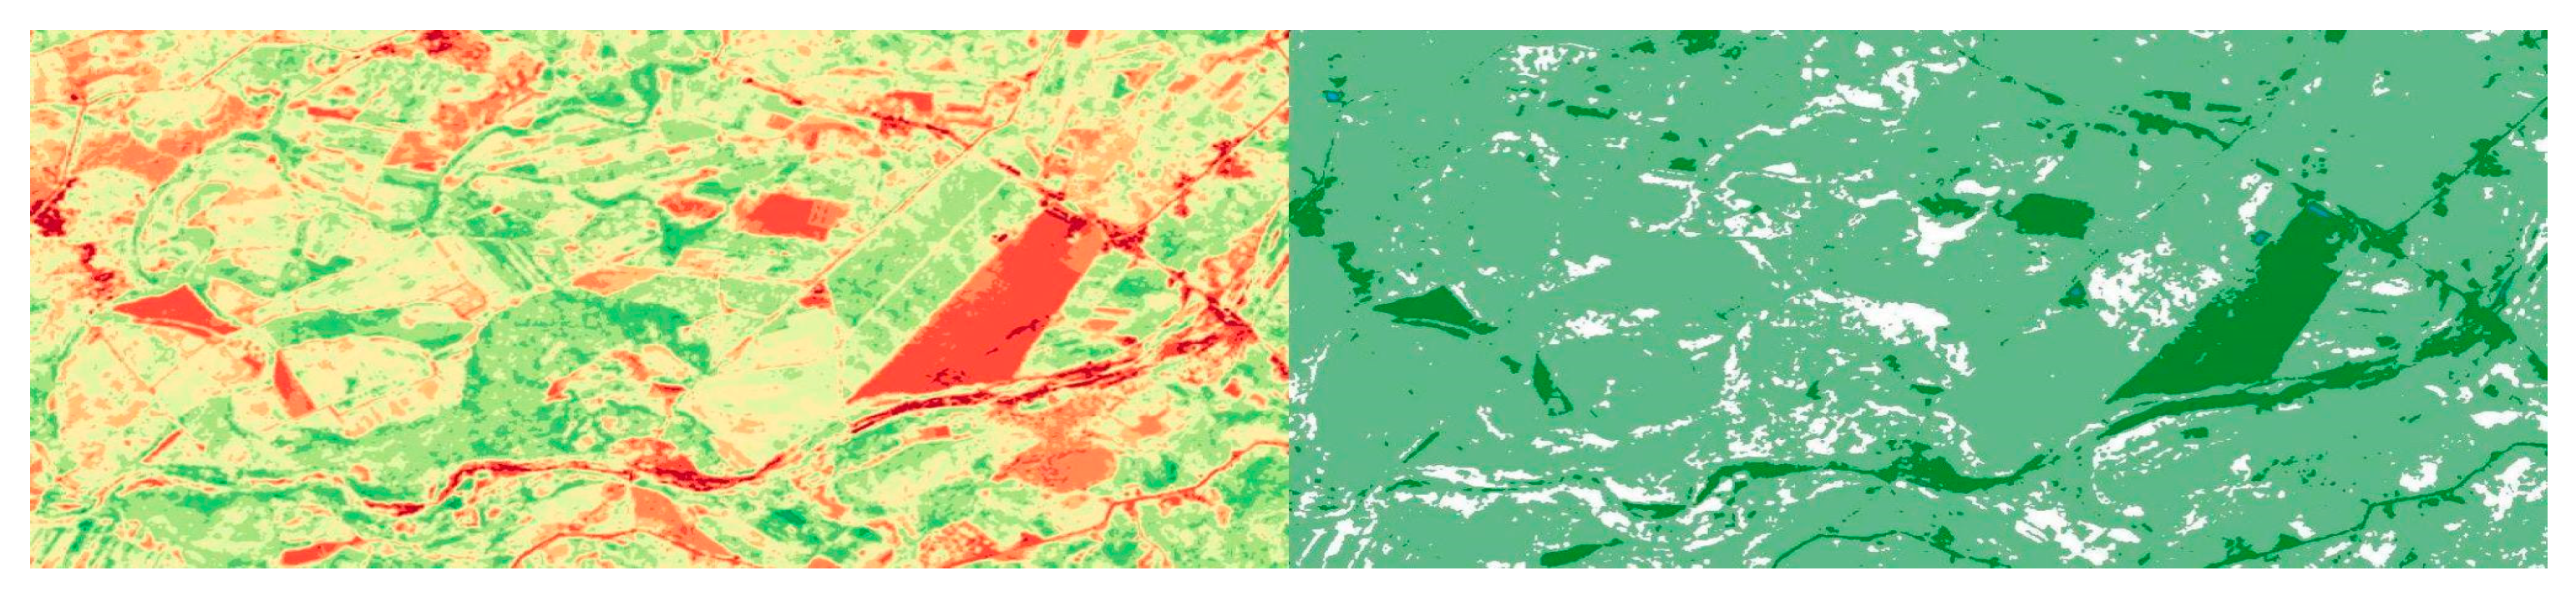
To organize the images, we begin to extract these images using Landviewer and taking the images provided by Sentinel-2 each month. Considering the restrictions of the Section 2.3, and if it is also considered there is more than one image in a single month, a total of 96 images are obtained for both the NDWI and NDVI. After this, the MATLAB R2023b software is used to join both variables corresponding to the same date, as seen in Figure 3, while Table 1 shows the number of joined images corresponding to each year.

Figure 3.
Stitched NDVI and NDWI image of the study area for the month of October 2019. Retrieved from Landviewer.

Table 1.
Images united using Matlab, with a percentage of cloud cover less than 10% between the years 2019 and 2023.
2.5. Classification Criteria
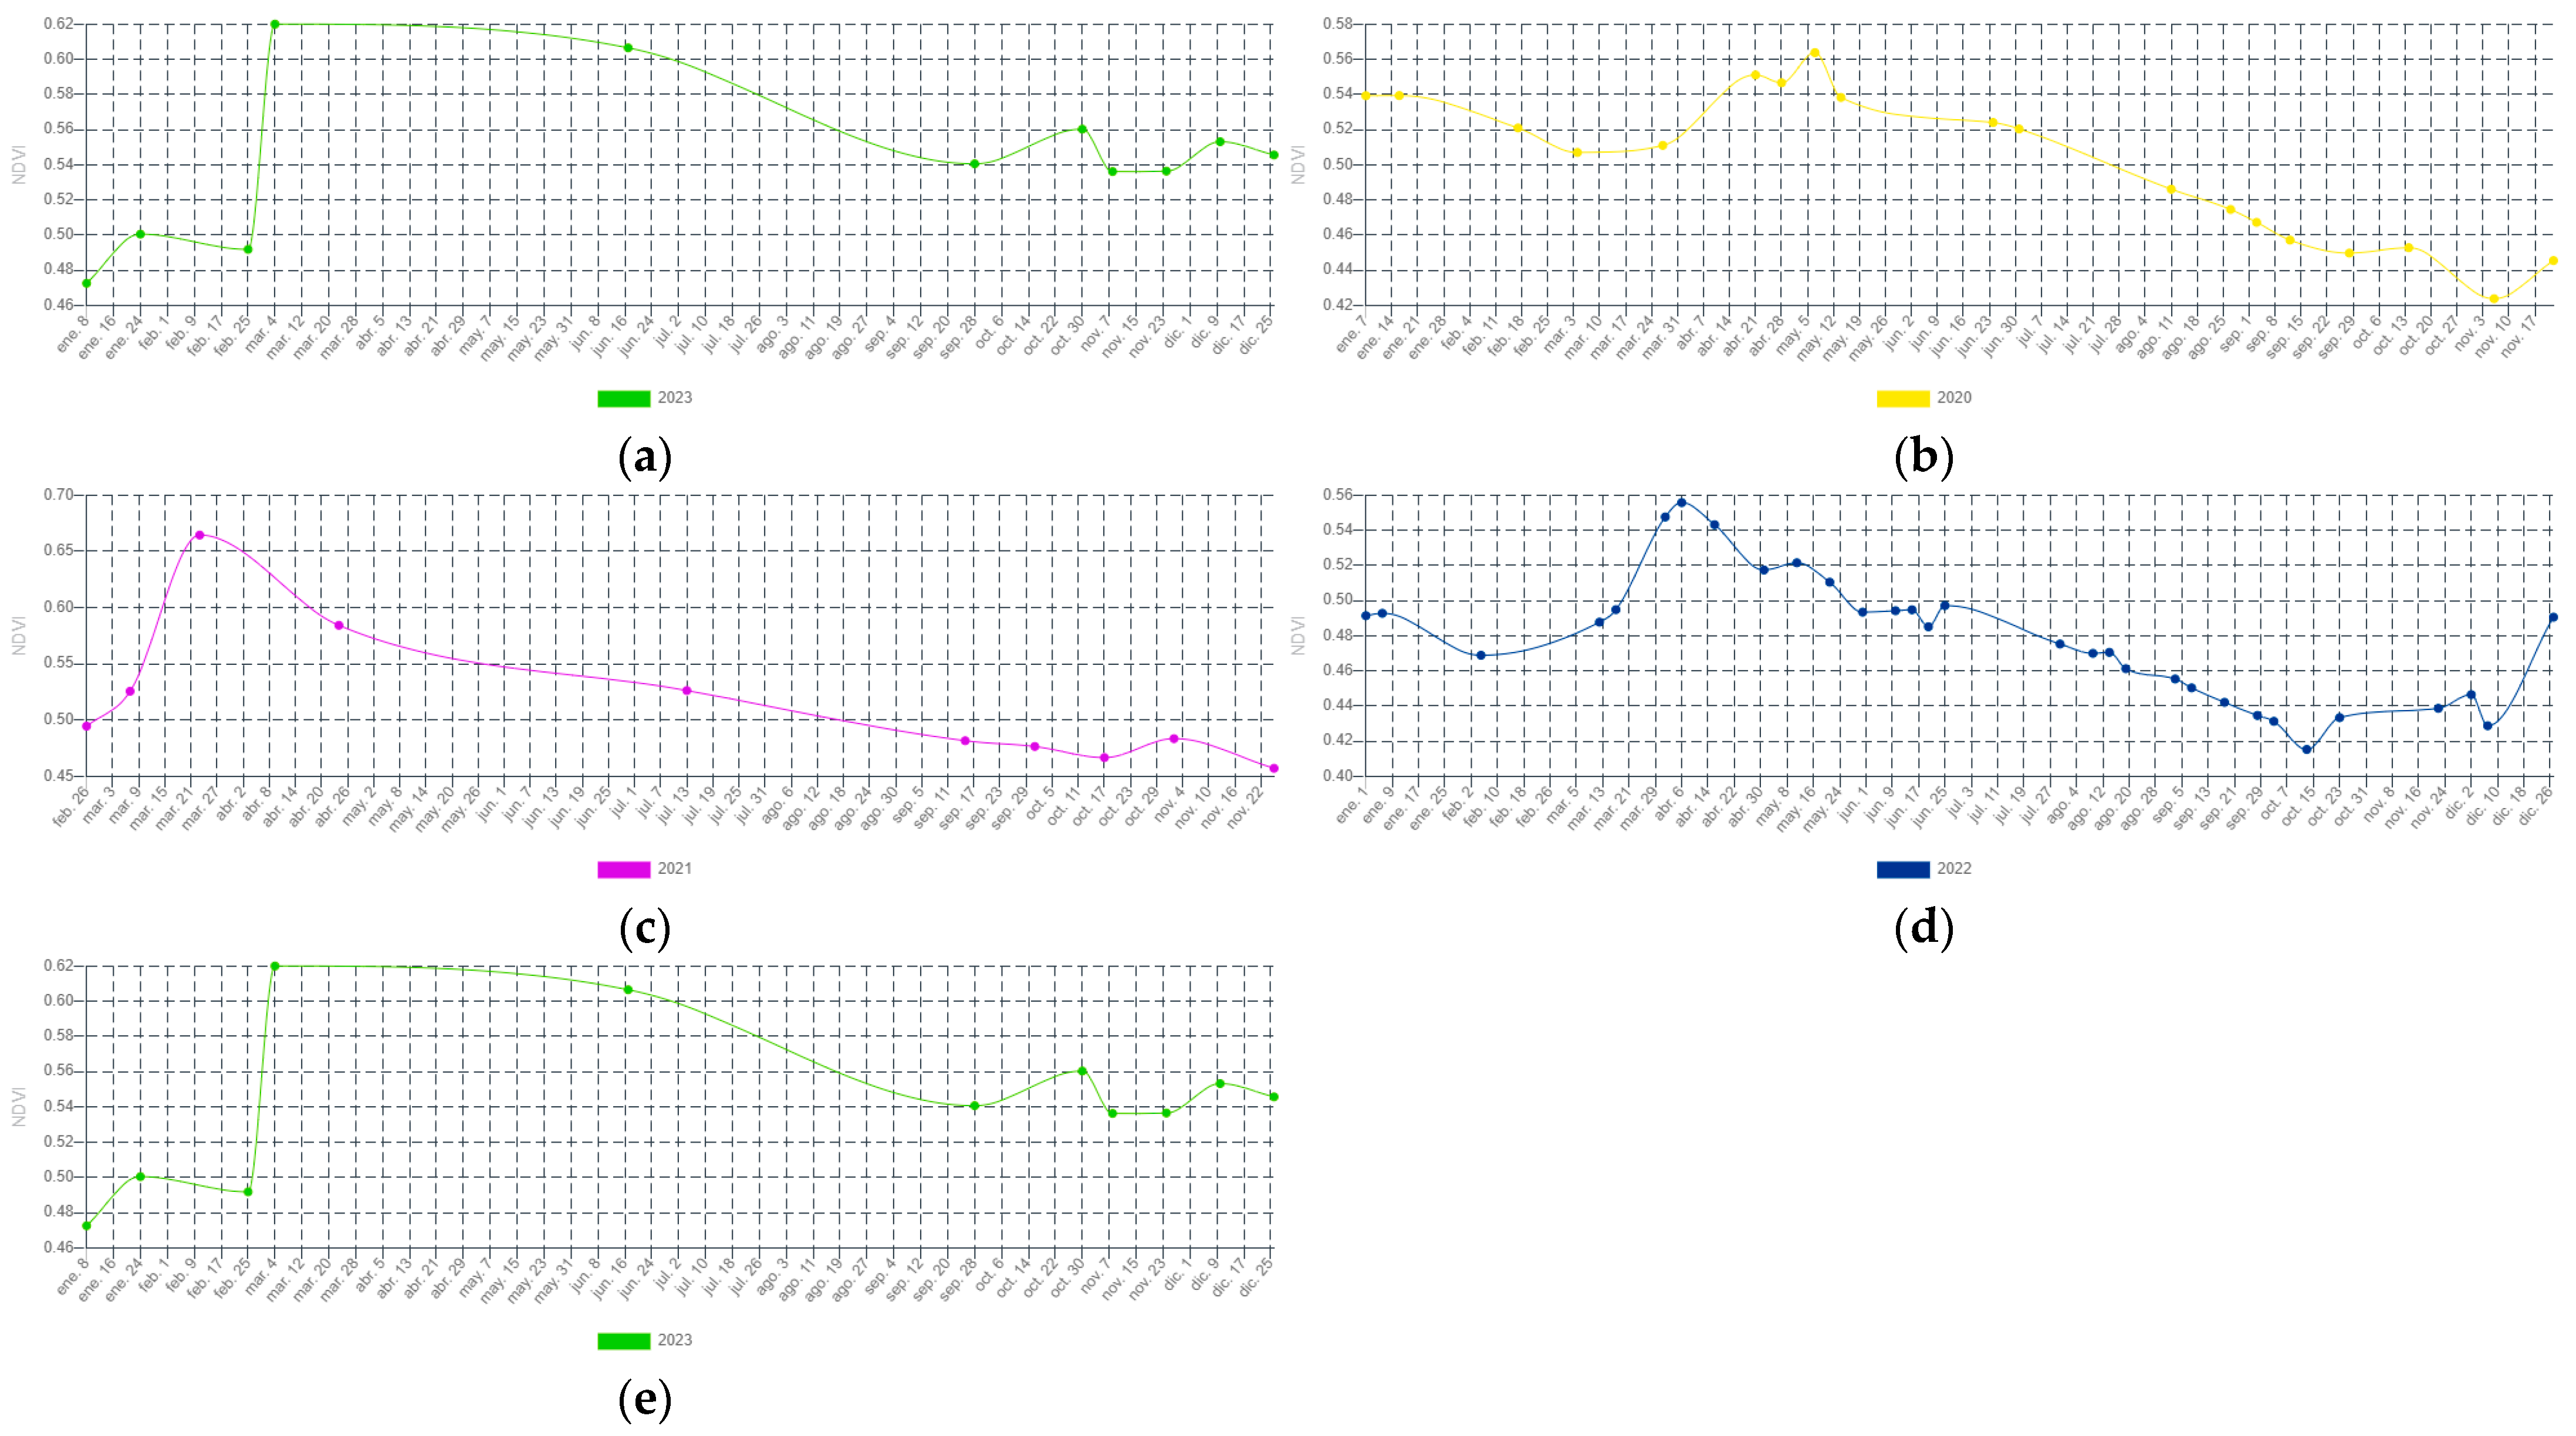
Having the images united, it is classified to determine if the development of the lemon in the study area is at a high, medium, or low risk for a meteorological phenomenon which may occur harming the harvest. To classify it in the aforementioned way, it is performed using data provided by Landviewer with the NDVI time series analysis option, as can be seen in Figure 4, where each month is evaluated to classify it according to the ranges shown in the table. Table 2 shows classifications of high, medium, or low risk.
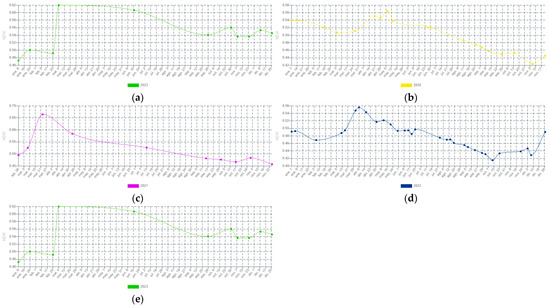
Figure 4.
NDVI time series of the year 2019 (a), 2020 (b), 2021 (c), 2022 (d), 2023 (e). Obtained from the Landviewer webside, using the Landsat 8 time series analysis option.
Table 2.
Risk classification according to the NDVI index.
In addition to the aforementioned criterion, use is made of news programs that have reported irregularities in agricultural production in Tambo Grande, such as droughts [11], intense rains due to the phenomenon of El Niño and Cyclone Yaku [12], the appearance of pests [13]. I have even lost economic capital to continue producing due to COVID-19 [14]. The results of the classification process are summarized in Table 3, which shows the number of images corresponding to each risk classification, categorized as high, medium, or low risk.
Table 3.
Number of images corresponding to each risk classification.
2.6. Training and Validation Environment
The preprocessing of the images and the implementation of the neural network were carried out in the MATLAB 2023b environment. To train the neural network, the deep learning resource Matlab Toolbox was used, which provides us with an interface and tools for the development of deep learning models. This environment has been selected since it has wide acceptance by the scientific community and the ability to implement deep learning models and algorithms.
2.7. CNN Model
A convolutional neural network (CNN) is a highly effective deep learning algorithm in computer vision applications. Its main architecture includes a convolutional layer, a pooling layer, an output layer, and a fully connected layer (Figure 5). The convolutional layer, composed of convolutional filters, plays a crucial role in interacting with the input image to generate the output feature map. The addition of more convolutional layers allows for the capture of more specific patterns and features, giving the network greater learning and pattern discrimination capabilities, although this also makes it more complex and deeper.
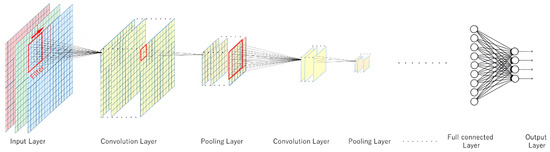
Figure 5.
Illustration of the convolutional neural network. Note: Adapted from illustration of the convolution neural network [15].
Furthermore, in this study we established three categories and tested the classification of images according to the discussed criteria. The AlexNet network was evaluated for this study since it has shown better performance in detecting meteorological features compared to the ResNet, LeNet5, LeNet5-Like, and ZFNet networks. The architecture of the convolutional neural network chosen was “AlexNet”, and the most important things to highlight would be that this architecture is 8 layers deep, and the input image must have a size of 227 by 227 and can classify images according to the criteria assigned, where some examples of the classifications that can be made would be identification of animals, races, sign language, etc. For our classification of high, medium, and low risk, one can reference the Results Section, where the performance model, the training and validation confusion matrices, and the Grad-CAM results are shown.
2.8. Validation Method
The validation of the results of the neural network will be carried out by correlating them with the temperature values in the area. This approach seeks to validate the accuracy of the network and evaluate the relationship between temperature and the level of risk in crop dynamics. Since temperature is a crucial climatological component that affects crop development, variability in temperature patterns can indicate climatological phenomena. This validation method will not only support the neural network results but will also establish temperature as an additional indicator to prevent adverse events. In addition, it will provide a complete perspective on how thermal conditions can anticipate the proximity of climatological phenomena in the Piura Region.
3. Results
3.1. Performance Model
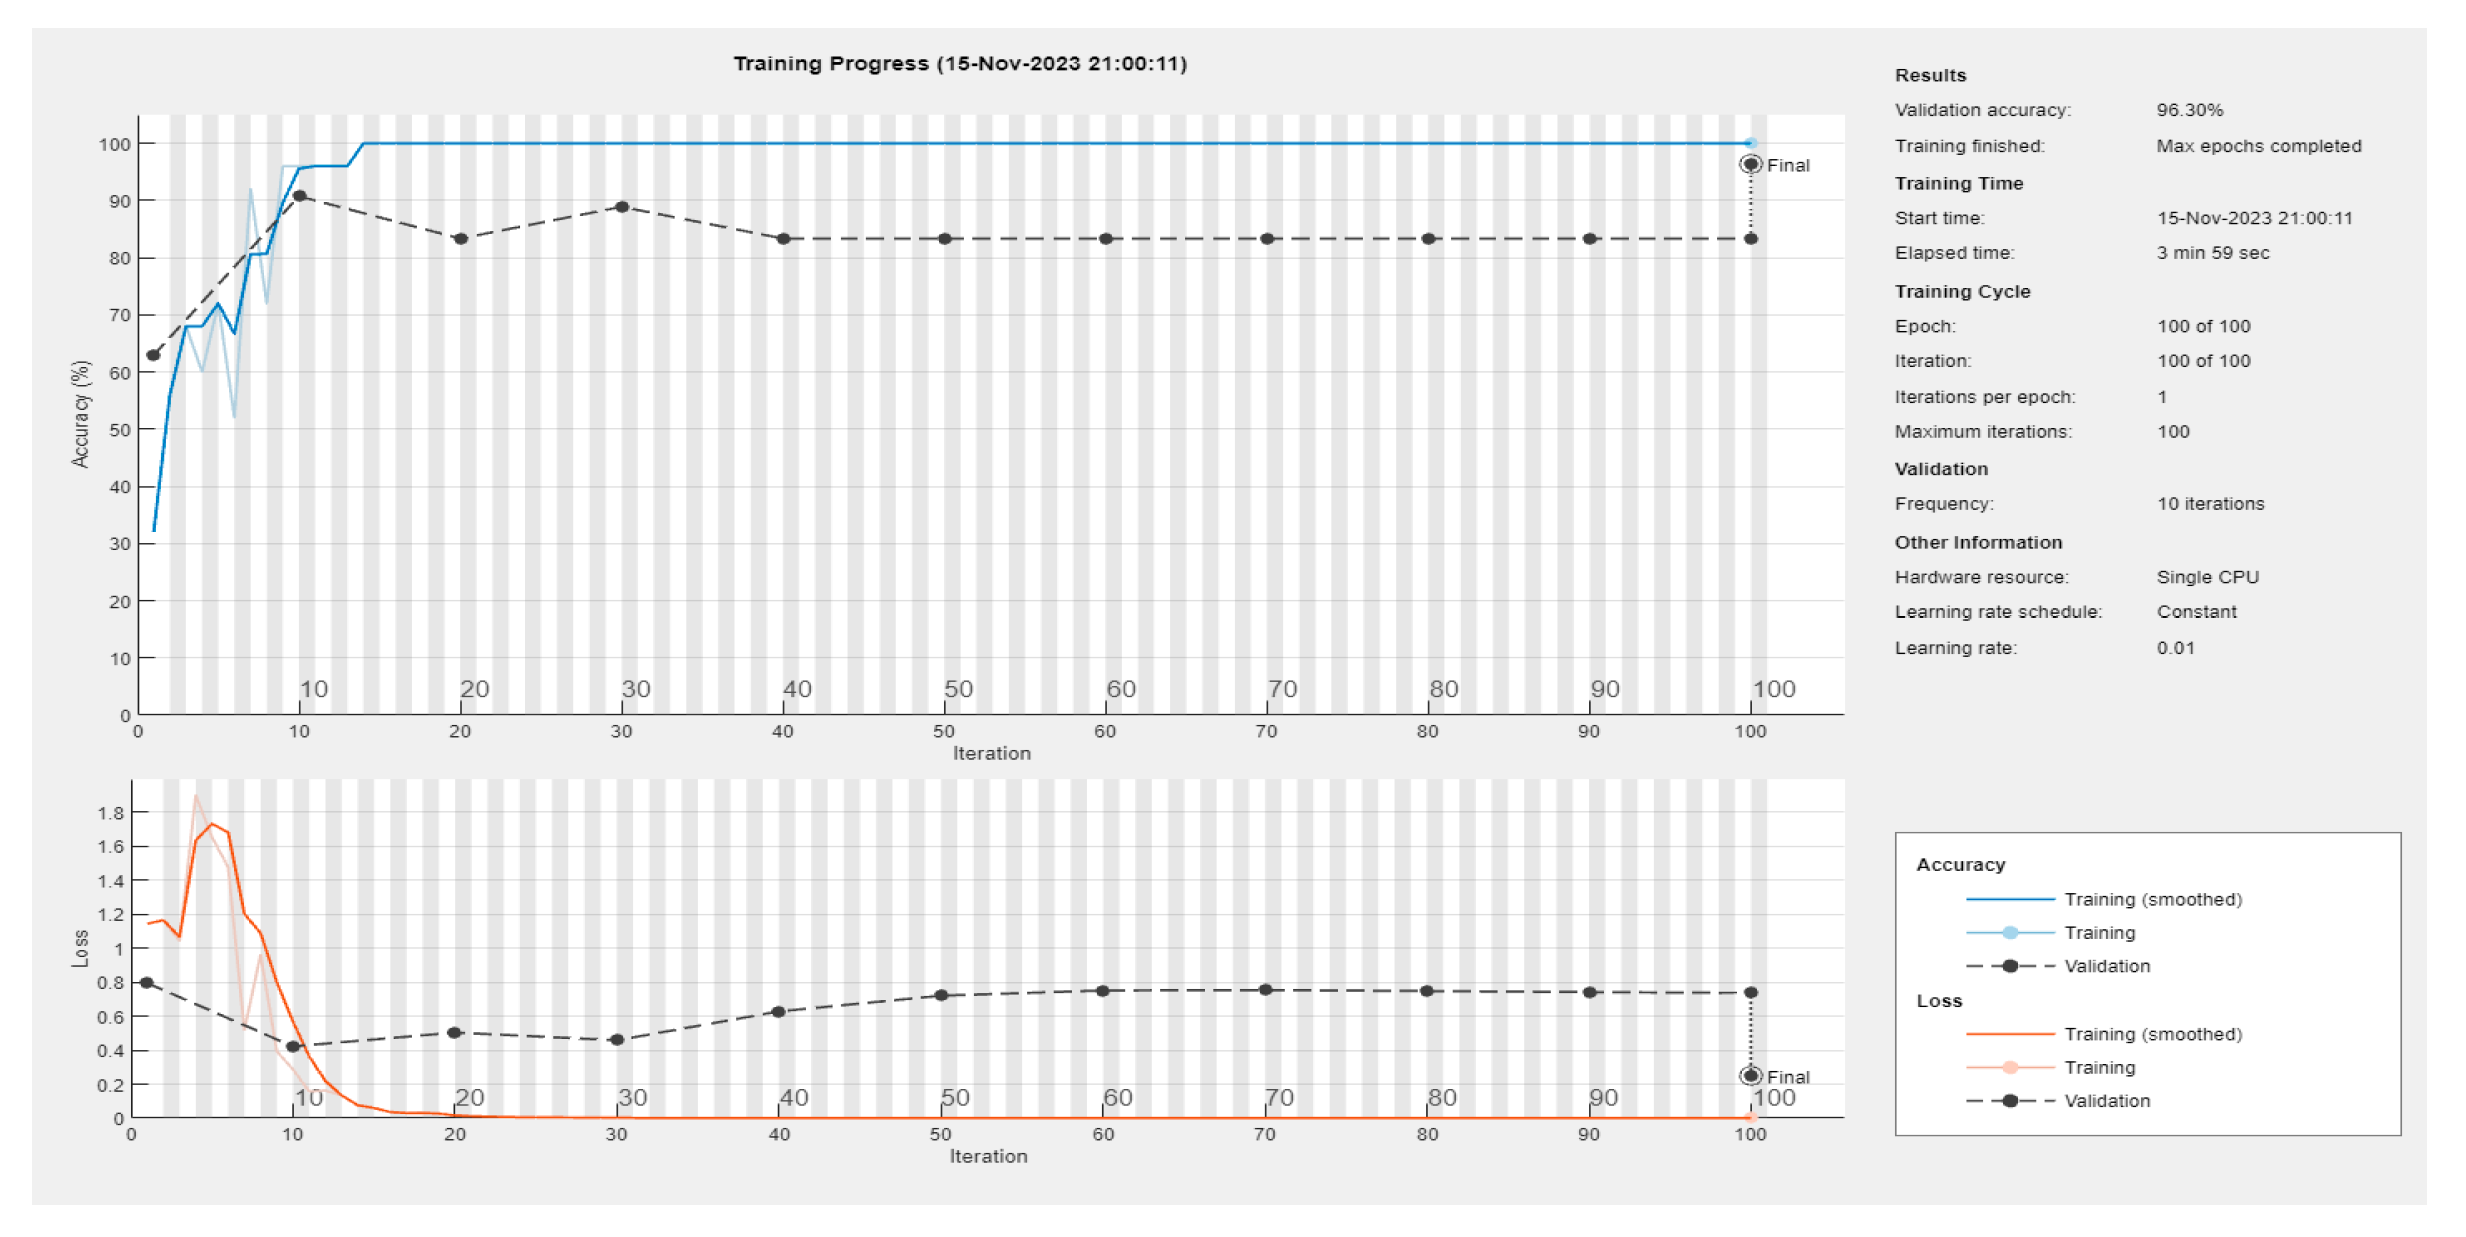
The network training AlexNet model has given us a percentage of 96.30% accuracy, with a batch parameter of 25 and epoch parameter of 100. The learning and error curves are seen in Figure 6, where fluctuations are shown little pronounced. Furthermore, the training and validation time lasted 3.59 min.
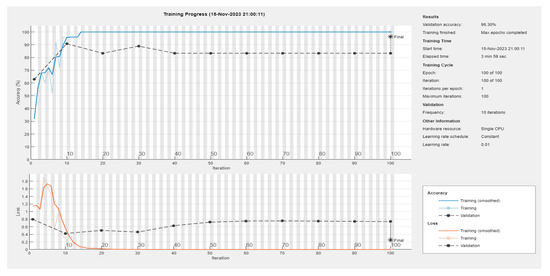
Figure 6.
Accuracy and resulting loss learning curves of the AlexNet network.
3.2. Analysis of Metrics
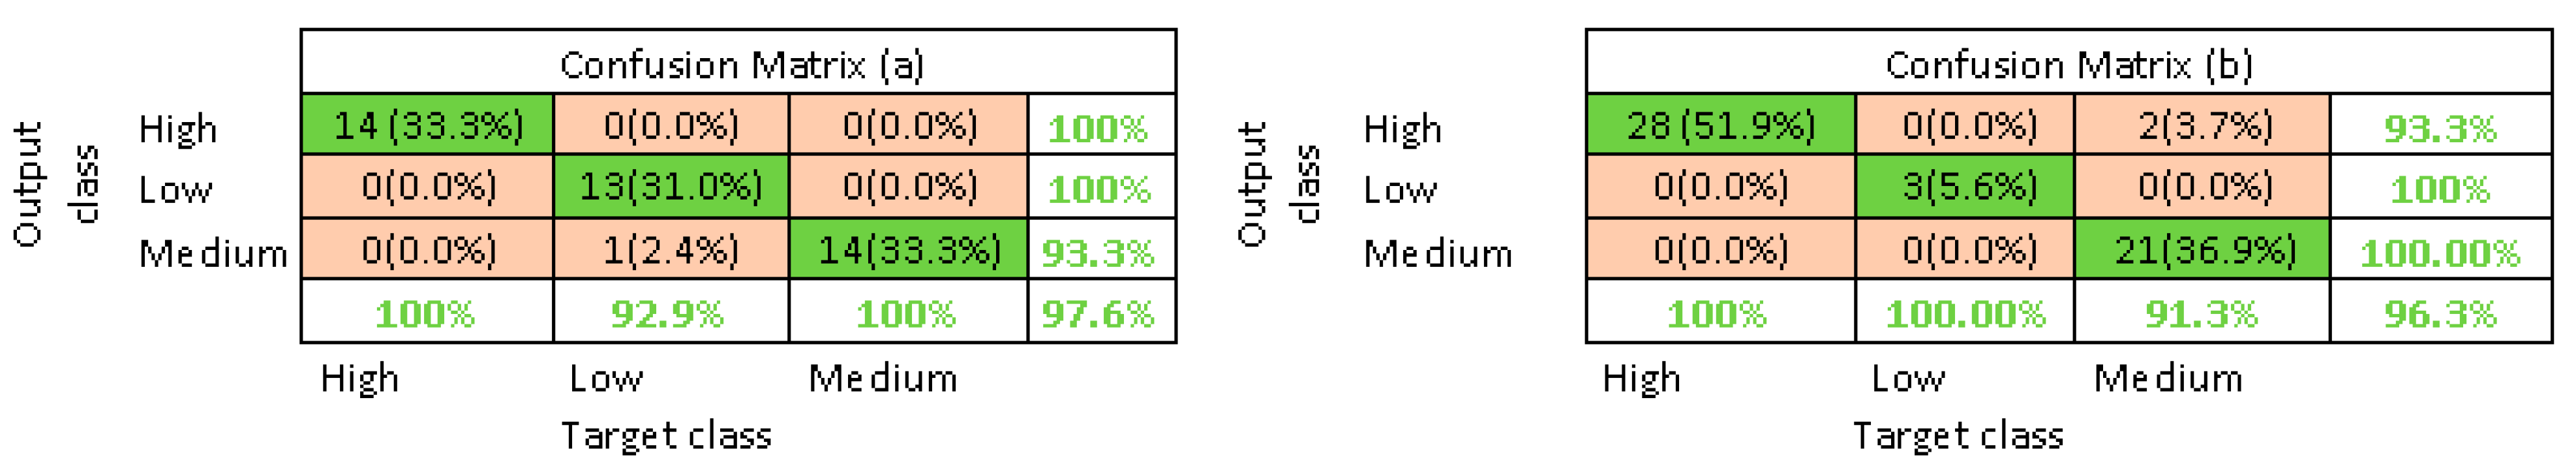
Evaluating the confusion matrices in greater detail, it is observed in matrix (a) of Figure 7 that in the training, an accuracy percentage of 97.6% was obtained, with a low-risk image being confused as a medium-risk image, and in matrix (b) of the same figure it is shown that in the validation, it was only wrong to distinguish two images of medium risk considering them as high risk, giving a total percentage of 96.3%.
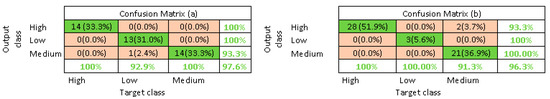
Figure 7.
Training confusion matrix (a) and validation confusion matrix (b).
3.3. Grad-CAM Results
This section shows the heat maps generated in Figure 8. This summarizes the three predicted results for each crop risk level.
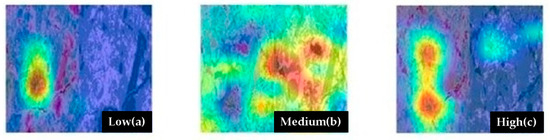
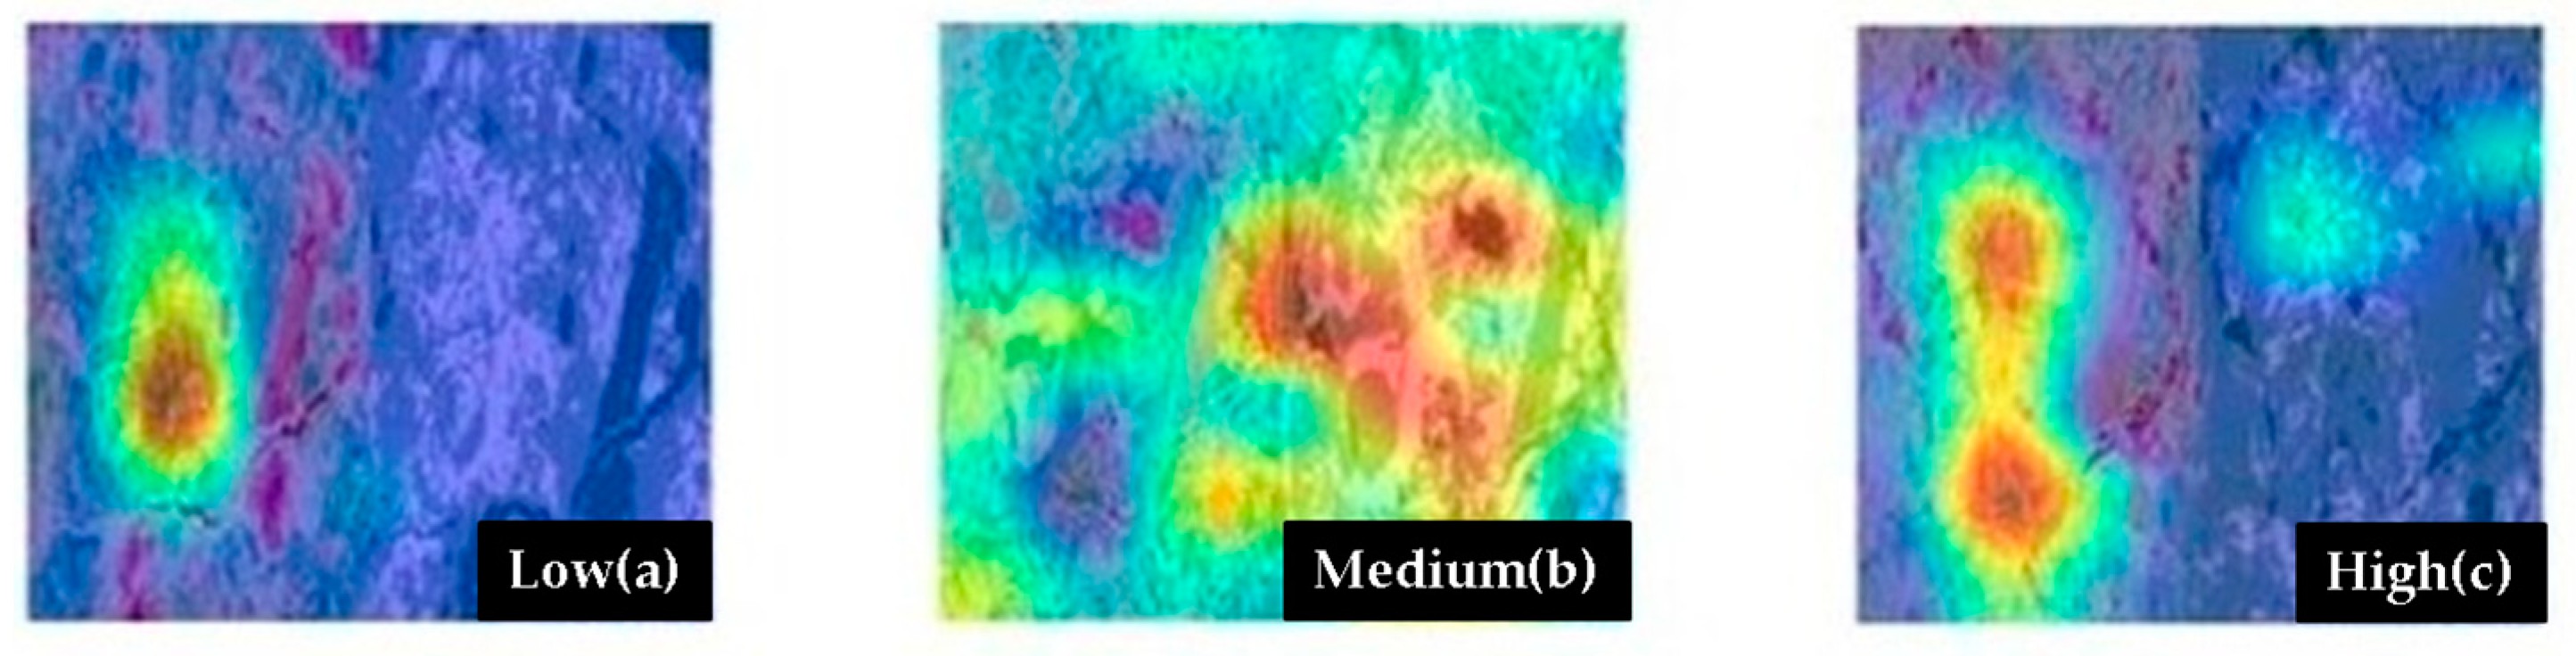
Figure 8.
Selective results of Grad-CAM: (a) low-risk class, (b) medium-risk class, and (c) high-risk class.
In case (a), without harmful weather events, the neural network focuses mainly on the NDVI, indicating that in low-risk periods, plant health is crucial in determining crop performance. In sample (b) with medium risk, the network focuses on the NDVI and NDWI, suggesting that the risk assessment should consider both aspects, the health of the plants and the water level in the crops. In the high-risk case (c), the network highlights the NDVI and the river, suggesting that plant health and river level are key indicators anticipating adverse weather events.
4. Discussion
According to the learning curve (Figure 6), the AlexNet architecture model generated smooth training and validation curves without observing pronounced fluctuations, obtaining a performance of 96.30%, results that indicate that during the training process there were no issues. This aligns with the findings of Morelos et al. [16], who demonstrated that AlexNet achieved great performance with 94.1%, while other models like VGG-19 and Inception v3 showed optimal accuracy (100%). In a study conducted by Manataki et al. [17], the authors stated that metrics are used to plot learning curves, provide valuable information about the training process, and reveal the presence of learning problems such as overfitting. Regarding loss and validation loss, signs of overfitting appear when the loss during model training decreases while the validation loss increases or remains constant. Regarding precision and validation, high precision coupled with low validation precision can signal the existence of overfitting. On the other hand, the confusion matrices (Figure 7) were useful to observe the number of samples that are truly positive during training and that are correctly predicted as positive, as well as the samples misclassified, demonstrating that the neural network can make mistakes; in this study, the neural network made mistakes mainly between medium- and low-risk images, so it is necessary as time goes by to expand the database with more low-risk classification images.
The use of the Grad-CAM technique allowed us to provide more information about how the model makes predictions, what it has learned, and if differences are observed. In image Figure 8a, the neural network focuses mainly on the NDVI image during periods without harmful weather events, suggesting that in times of low risk, the evaluation of the health status of plants is crucial to determine performance of the crop. In image Figure 8b, which represents a medium risk, the network focuses on both the NDVI and NDWI images, indicating that to validate the risk it is necessary to consider both aspects, the health of the crops and the water level. Finally, in image Figure 8c, the network highlights the NDVI area and pays attention to the river, suggesting that during periods of high risk, plant health and river level may be key indicators that anticipate the proximity of meteorological phenomena.
5. Conclusions
This study has shown that artificial intelligence techniques play a fundamental role in creating solutions that help protect the integrity of agricultural crops against the effects of extreme weather events such as climate change and the El Niño phenomenon. The level of precision obtained by the AlexNet model in a set of images collected from the Sentinel-2 satellite provides an alternative to predict future extreme climate events that helps in decision making to minimize the harmful effects of these events on the health of the lemon crop.
Author Contributions
Conceptualization, L.M. and M.O.; methodology, L.M.; software, M.R.; validation, L.M., M.O. and P.F.; formal analysis, L.M.; investigation, L.M.; resources, M.O.; data curation, M.R.; writing—original draft preparation, L.M.; writing—review and editing, M.O.; visualization, P.F.; supervision, A.A.; project administration, L.M. All authors have read and agreed to the published version of the manuscript.
Funding
This research received no external funding.
Institutional Review Board Statement
Not applicable.
Informed Consent Statement
Not applicable.
Data Availability Statement
All data is available in the same article.
Conflicts of Interest
The authors declare no conflicts of interest.
References
- Hijar, G.; Bonilla, C.; Munayco, C.V.; Gutiérrez, E.L.; Ramos, W. Fenómeno del niño y desastres naturales: Intervenciones en salud pública para la preparación y respuesta. Rev. Peru. De Med. Exp. Salud Pública 2016, 33, 300–310. [Google Scholar] [CrossRef]
- Sanabria, J. Impacto del Evento del Niño en la Agricultura Peruana Campaña 2002–2023. Available online: https://repositorio.senamhi.gob.pe/handle/20.500.12542/465 (accessed on 2 November 2023).
- Aldana, C.; Saavedra, Y.; Gonzales, J.; Gálvez, D.; Palacios, C.; Aldana, W.; Moncada, W. Spatial-temporal agricultural production of Citrus x limon and Mangifera indica, using spectral signatures and satellite images. Sci. Agropecu. 2021, 12, 557–570. [Google Scholar] [CrossRef]
- Machwitz, M.; Hass, E.; Junk, J.; Udelhoven, T.; Schlerf, M. CropGIS—A web application for the spatial and temporal visualization of past, present and future crop biomass development. Comput. Electron. Agric. 2019, 161, 185–193. [Google Scholar] [CrossRef]
- Zhu, X.; Xu, D.; Xin, X.; Shen, B.; Ding, L.; Wang, X.; Chen, B.; Yan, R. The spatial-temporal distribution of different grassland types in hulunber grassland based on remote sensing from 1992 to 2015. Sci. Agric. Sin. 2020, 53, 2715–2727. [Google Scholar] [CrossRef]
- Sol, Y.; Lao, D.; Ruan, Y.; Huang, C.; Chuan, Q. A Deep Learning-Based Approach to Predict Large-Scale Dynamics of Normalized Difference Vegetation Index for the Monitoring of Vegetation Activities and Stresses Using Meteorological Data. Sustainability 2023, 15, 6632. [Google Scholar] [CrossRef]
- Stateczny, A.; Praveena, H.D.; Krishnappa, R.H.; Chythanya, K.R.; Babysarojam, B.B. Optimized Deep Learning Model for Flood Detection Using Satellite Images. Remote Sens. 2023, 15, 20. [Google Scholar] [CrossRef]
- Ministerio de Agricultura y Riego—MIDAGRI. Informe del Limón. 2017. Available online: https://repositorio.midagri.gob.pe/handle/20.500.13036/401 (accessed on 12 September 2023).
- Banco Central de Reserva del Perú—BCRP. Caracterización del Departamento de Piura. 2023. Available online: https://www.bcrp.gob.pe/docs/Sucursales/Piura/piura-caracterizacion.pdf (accessed on 5 November 2023).
- CNA. Agricultores de Tambo Grande Hacen Retroceder al Gobierno de Sagasti: Norma que Autorizaba Actividad Minera no va más. 2021. Available online: https://www.cna.org.pe/agricultores-tambogrande-hacen-retroceder-al-gobierno-sagasti-norma-autorizaba-actividad-minera-no-va-mas/ (accessed on 5 November 2023).
- La República. Más de 12.000 Agricultores Perderían sus Cultivos, Aate Escasez de Agua en Reservorio San Lorenzo. 2022. Available online: https://larepublica.pe/sociedad/2022/11/17/mas-de-12000-agricultores-perderian-sus-cultivos-ante-escasez-de-agua-en-reservorio-san-lorenzo-lrnd (accessed on 7 November 2023).
- La República. Agricultores Piden a Boluarte Rescate Financiero Ante S/600 Millones en Pérdidas por Lluvias en Piura. 2023. Available online: https://larepublica.pe/sociedad/2023/10/10/piura-fenomeno-el-nino-agricultores-piden-a-dina-boluarte-rescate-financiero-ante-s600-millones-en-perdidas-por-lluvias-el-nino-costero-tambogrande-lrnd-266860 (accessed on 7 November 2023).
- Diario Correo. Plaga del Limón Originaría Escasez y Aumento de Precio en Piura. 2023. Available online: https://diariocorreo.pe/edicion/piura/plaga-del-limon-originaria-escasez-y-aumento-de-precio-en-piura-noticia/ (accessed on 10 November 2023).
- La república. Piura: Más de 10.000 Agricultores en Tambogrande no Recibieron Ayuda Económica. 2020. Available online: https://larepublica.pe/sociedad/2020/08/24/piura-mas-de-10000-agricultores-en-tambogrande-no-recibieron-ayuda-economica-lrnd#:~:text=La%20consecuencia%20del%20estado%20de,Usuarios%20del%20Valle%20San%20Lorenzo (accessed on 30 September 2023).
- Takechi, H.; Aragaki, S.; Irie, M. Differentiation of River Sediments Fractions in UAV Aerial Images by Convolution Neural Network. Remote Sens. 2021, 13, 3188. [Google Scholar] [CrossRef]
- Morellos, A.; Pantazi, X.E.; Paraskevas, C.; Moshou, D. Comparison of Deep Neural Networks in Detecting Field Grapevine Diseases Using Transfer Learning. Remote Sens. 2022, 14, 18. [Google Scholar] [CrossRef]
- Manataki, M.; Papadopoulos, N.; Schetakis, N.; Di Iorio, A. Exploring Deep Learning Models on GPR Data: A Comparative Study of AlexNet and VGG on a Dataset from Archaeological Sites. Remote Sens. 2023, 15, 12. [Google Scholar] [CrossRef]


Disclaimer/Publisher’s Note: The statements, opinions and data contained in all publications are solely those of the individual author(s) and contributor(s) and not of MDPI and/or the editor(s). MDPI and/or the editor(s) disclaim responsibility for any injury to people or property resulting from any ideas, methods, instructions or products referred to in the content. |
© 2025 by the authors. Licensee MDPI, Basel, Switzerland. This article is an open access article distributed under the terms and conditions of the Creative Commons Attribution (CC BY) license (https://creativecommons.org/licenses/by/4.0/).