Proceeding Paper

Quantitative Risk Assessment of Ammonia Release from Storage Tanks Using RISKCURVES Software †

by
Alimatun Nashira
1,
Anindita Putri Nugrahani
1,
Anisa Ur Rahmah
1,* and
Teguh Cahyono
2
1
Department of Chemical Engineering, Universitas Muhammadiyah Surakarta, Sukoharjo 57169, Indonesia
2
PT Gexcon Indonesia, Jakarta 12520, Indonesia
*
Author to whom correspondence should be addressed.
Presented at the 8th Mechanical Engineering, Science and Technology International Conference, Padang Besar, Perlis, Malaysia, 11–12 December 2024.
Eng. Proc. 2025, 84(1), 80; https://doi.org/10.3390/engproc2025084080
Published: 21 March 2025

Abstract

:
Ammonia is a gas with high toxicity, which is produced in large amounts as raw materials for nitrogen-based fertilizer. Fertilizer plants in Indonesia are sometimes located not far from residential areas, requiring risk assessment for the loss of containment (LoC) event of ammonia. Many studies have modeled ammonia release using ALOHA software but stopped the calculation at the consequence modeling and did not evaluate the risk quantitatively. In this study, a quantitative risk assessment (QRA) was conducted for the LoC of ammonia from the storage tank at PT X, a fertilizer industry in Indonesia, using RISKCURVES software. The scenario and their frequency were chosen based on the Netherlands QRA guidelines. The simulation shows five types of phenomena happening, with toxic dispersion being the most dangerous. Atmospheric conditions influence the toxic dispersion but barely affect the fire and explosion phenomena. Despite the severity of the toxic dispersion, the individual risk calculation shows that the risk in the fertilizer plant area is still acceptable based on the standard of UK HSE.

1. Introduction

The global demand for nitrogen-based fertilizers has increased in the last few decades, necessitating higher ammonia production [1]. Ammonia, with the chemical formula NH3, has a boiling point of −33 °C at atmospheric pressure and is generally stored in liquid form inside a pressurized vessel or refrigerated storage tank. Pressurized liquid ammonia easily flashes into the gas phase upon release from containment, making it very easy to spread into the environment. Alternatively, the release of chilled ammonia can form a pool, which evaporates before the toxic cloud spreads. Nevertheless, the release of ammonia from storage tanks poses potential hazards to workers and people in the surrounding environment [2].
Ammonia is a colorless gas with a pungent odor and toxic and corrosive characteristics. Even at low concentrations, ammonia gas is considered hazardous. Ammonia can irritate the eyes, nose, and throat when exposed for two hours at a concentration of 50 ppm. At higher concentrations, longer exposure could cause lung damage and even death. The maximum short-term exposure tolerance is at 300–500 ppm concentrations for 30 to 60 min. Death can occur due to exposure to doses of 5000–10,000 ppm [3].
Several incidents of ammonia release have happened throughout history. The worst incident in history regarding ammonia is the Dakar accident in Senegal, where the overpressure of an ammonia tank caused the rupture and subsequent release of ammonia, causing a total of 129 fatalities and 1150 injuries [4]. Another accident happened on 20 March 1989, in Lithuania, where an ammonia storage tank at the NPK fertilizer plant experienced a rupture at the base, flooding the plant with a pool of 7000 tonnes of liquid ammonia [5]. The ammonia vapors caught fire, which decomposed the stockpile of fertilizer nearby, sending even more poisonous gasses toward the residential area. In Indonesia, the ammonia leak accident also occurred. Aside from a leak in the fertilizer plants [6], the case also happened in an ice factory, where ammonia is often used as a refrigerant [7].
Indonesia has several fertilizer plants that have been built to satisfy the demands of its agricultural sector. Several plants in Indonesia are currently located not far from the residential area. Therefore, it is necessary to conduct a risk analysis of ammonia loss of containment (LoC) from storage tanks in such an industry. The result of a risk assessment, even the semi-quantitative ones, can give information about the quality of their risk management and guide their decision-making in the future [8]. Efforts to address potential hazards that may occur due to the LoC, such as fires, explosions, and toxic dispersion, are made by creating several possible accident scenarios. Modeling those scenarios can be achieved by combining consequence modeling with various types of computer software [9]. Several studies have been conducted in regard to ammonia leak simulation from the Indonesian fertilizer plant [2,10,11]. The simulation results indicate that the consequences of accidents from various leakage scenarios can be well predicted.
To date, all modeling on ammonia leaks in Indonesia used ALOHA software version 5.4.7. While ALOHA results present the consequence as a threat zone, they do not calculate the event’s lethality contour, individual risk, or societal risk. It is because ALOHA is a consequence modeling software, which, as the name implies, only calculates consequences and requires additional data processing to evaluate individual and societal risk. An accident might have a severe effect, but if the probability is very small, the risk might not be significant. In addition to that, any consequence modeling software can only evaluate every scenario separately and cannot add up the resulting risks from every scenario. Based on the explanation above, a quantitative risk analysis of ammonia gas released from storage tanks against the surrounding population and factory workers is necessary. In this study, RISKCURVES software was used to evaluate quantitatively both the consequence and risk of ammonia leakage from industry.

2. Methods

The analysis was conducted using RISKCURVES software version 11.4 (Gexcon BV, Driebergen-Rijsenburg, The Netherlands). The chosen calculation method is the combined model, which allows the software to simulate fire, explosion, and toxic dispersion models simultaneously based on the detected chemical properties. The object of the simulations is the ammonia storage tanks at PT X in Indonesia, which store ammonia in a refrigerated vessel (−33 °C) at atmospheric pressure. PT X is a fertilizer company in Indonesia that produces urea fertilizer. Leak scenarios occur during the day and night, with all the tanks filled to 80% of their maximum capacity (10,000 MT). Data on temperature, pressure, and humidity were shown in Table 1 and taken from the average data at the location of PT X from January to December 2022. The 3 LOC scenarios used are listed in Table 2. They are the scenarios recommended in the guidelines for quantitative risk assessment in the Netherlands. The frequencies given are the default frequencies that cover the failure of the tanks and associated instrumentation pipework. Situations such as corrosion, fatigue due to vibration, and operating errors were not included [12].
The stability class significantly impacts the size of the threat zone in dispersion scenarios. Data on wind speed, cloud cover, and solar radiation were used to select the stability class. Based on these factors, the chosen stability classes for the atmospheric conditions above are B for day and F for night. Three wind speeds were selected based on the data that contributed the most over one year at the PT X location. Atmospheric turbulence and the wind’s speed and direction significantly affect how gas clouds disperse [13].

3. Results and Discussion

3.1. Jet Fire Simulation

A jet fire is a fire event that occurs when pressurized gas is released into the environment from a small gap in a storage tank or pipe, forming a burst due to immediate ignition. The same is true for the research scenario that occurred, where ammonia stored in a high-pressure tank in the liquid phase leaked, making a jet fire possible. One-dimensional jet fire modeling is used to predict the path of the fire so that heat transfer from the source can be known. Theoretically, jet fire could result from both G2 and G3 scenarios, but in this simulation, only G2 scenarios result in jet fire. This is because the release rate in G2 was larger; thus, the gas concentration was able to reach the flammability limit. Table 3 shows the heat radiation contour distance for the jet fire incident from the G2 scenario.
Based on the conducted simulations, there were no significant differences in the consequences between jet fires that occurred during the day and night. A stronger wind slightly lessens the impact of heat radiation, as indicated by the decrease in contour distance. Similar findings were also reported in a study by [14], which suggested that high wind speeds at the chimney surface can decrease combustion efficiency. The contour distance shows that a distance up to 372 m in the downwind direction from the tank could be affected by the heat radiation of 10 kW/m2, which is potentially lethal when exposed for 60 s [15]. The heat radiation did not exceed 35 kW/m2, which means it was not enough to damage the surrounding structure.

3.2. Vapor Cloud Explosion (VCE) Simulations

A Vapor Cloud Explosion (VCE) is a highly dangerous and destructive explosion. It occurs when a large amount of flammable vapor forms, disperses, and is ignited, creating a vapor cloud that leads to an explosion. The impact of VCE is primarily caused by overpressure, which can damage surrounding buildings and process equipment. In this study, VCE could result from both G1 and G2 scenarios. However, the consequence from G1 was more severe, possibly because in instantaneous release, ammonia readily formed a pool, which accelerated evaporation. Table 4 shows the overpressure contour distance for the VCE phenomenon for G1 and G2 scenarios. The overpressure levels of concern in most literature are 1 psi, 3.5 psi, and 8 psi, which are the default of ALOHA software [15]. Only an overpressure of 1 psi (69 mbar) was reached in this simulation, which is strong enough to shatter glass but did not cause injury or other damage to the building. This is expected since ammonia is not known to be explosive. Since the ammonia tank is located more than 100 m from other facilities, every structure would be safe in the case of an explosion.
Again, there are no significant differences between daytime and nighttime accidents. Variations in wind speed also did not appear to affect the explosion substantially. Atmospheric conditions likely had little effect because ammonia is a low-reactivity fuel with very low laminar burning velocity [16]. While the effects of wind speed are not prominent, a difference in trend is observed for G1 and G2 scenarios. In G1, the faster wind speed results in a larger impact distance, while in G2, the opposite happens. The trend in the G2 scenario is in alignment with Perwitasari’s research on primary reformer leaks from holes, which states that wind speed affects the reduction in gas concentration in the air [17]. As wind speed increases, the average concentration of gas in the air decreases more rapidly, leading to a smaller area of flammable cloud. In the G1 scenario, the opposite happened because faster wind speed helps evaporation from the pool more than reducing the existing vapor concentration.

3.3. Pool Fire and BLEVE Blast Simulation

As the name implies, pool fire is where a flammable liquid forms a pool after release, and the vapor above the pool ignites. Boiling liquid expanding vapor explosion (BLEVE) is a phenomenon in which liquid above its atmospheric boiling point is rapidly depressurized, causing very rapid evaporation and expansion. This produces an energy blast that can damage buildings and equipment. A fireball often accompanies it, but not necessarily if the substance is not highly flammable. BLEVE is not limited to flammable liquid since the phenomenon is physical rather than from the chemical reaction of flammable vapor. Both scenarios G1 and G2 resulted in pool fire, but only scenario G1 resulted in BLEVE. The pool fire from scenarios G1 and G2 were very similar because both had the same pool area and similar evaporated mass.
Table 5 shows the contour distances from scenario G1. The overpressure from the BLEVE blast was not affected by atmospheric conditions, which is expected since the blast came from the phase change, not the reaction from dispersed flammable vapor. Meanwhile, the pool fire is slightly affected by wind speed and not at all by the difference in day and night temperatures. Stronger wind increases the heat radiation contour distance, possibly because the wind affects the shape of the flame, elongating it in the downwind direction.

3.4. Toxic Dispersion Simulation

One-dimensional modeling of toxic release is used to predict the dispersion path of toxic gasses, allowing us to identify the areas affected by the release source. All scenarios (G1, G2, and G3) generate toxic cloud phenomena because ammonia is toxic, with the value of Emergency Response Planning Guidelines (ERPG) being 25, 150, and 1500 ppm for ERPG-1, ERPG-2, and ERPG-3, respectively. Below ERPG-1, the general population could be exposed for up to one hour without experiencing more than mild adverse health effects. Meanwhile, above the ERPG-2 concentration is enough to cause serious health effects, and above ERPG-3, it becomes life-threatening. Both the G1 and G2 scenarios are very dangerous due to the very large amount of ammonia released quickly. The lethality of toxic clouds over a distance of wind speed of 1.4 m/s is displayed in Figure 1. It can be seen that the instantaneous toxic cloud in the G1 scenario is highly concentrated around the pool, resulting in high lethality even in the upwind direction. Meanwhile, G2 scenarios did not affect the upwind direction but were more dangerous (higher lethality) in the downwind direction. There is no significant difference in the lethality profile for nighttime and daytime scenarios near the source, but they become observable further than 300 m downwind.
Table 6 shows the maximum distance of concentration contour due to toxic clouds formed during the G2 scenario in various atmospheric conditions. The zone with an airborne concentration above ERPG-3 could go as far as 4.7 km at the maximum wind speed. Wind speed also plays a significant role in the dispersion of toxic gasses, as the gas reach increases with stronger wind. Aside from enhancing advection, wind also increases the ammonia evaporation rate significantly [18]. This finding is similar to Novrikasari’s study, which used ALOHA to predict danger zones in various ammonia leakage scenarios in Indonesia’s plant [11].
Another study that compares the impact of difference time was Anjana’s study, which simulates ammonia release in India using ALOHA software [13]. They reported that accidents during morning hours (08.30 a.m.) are more dangerous than the evening time (05.30 p.m.). In Anjana’s study, morning temperatures were lower than in the evening, but the wind was stronger in the evening. In this study, nighttime is cooler than daytime. Therefore, both studies agreed that lower temperatures and higher humidity were more dangerous for toxic cloud dispersion. Atmospheric conditions usually influence the characteristics of the chemicals undergoing dispersion. Due to the tendency of air to expand from solar radiation absorption, temperatures are higher during the day. This results in gas concentrations being diluted due to air expansion.

3.5. Individual and Societal Risks

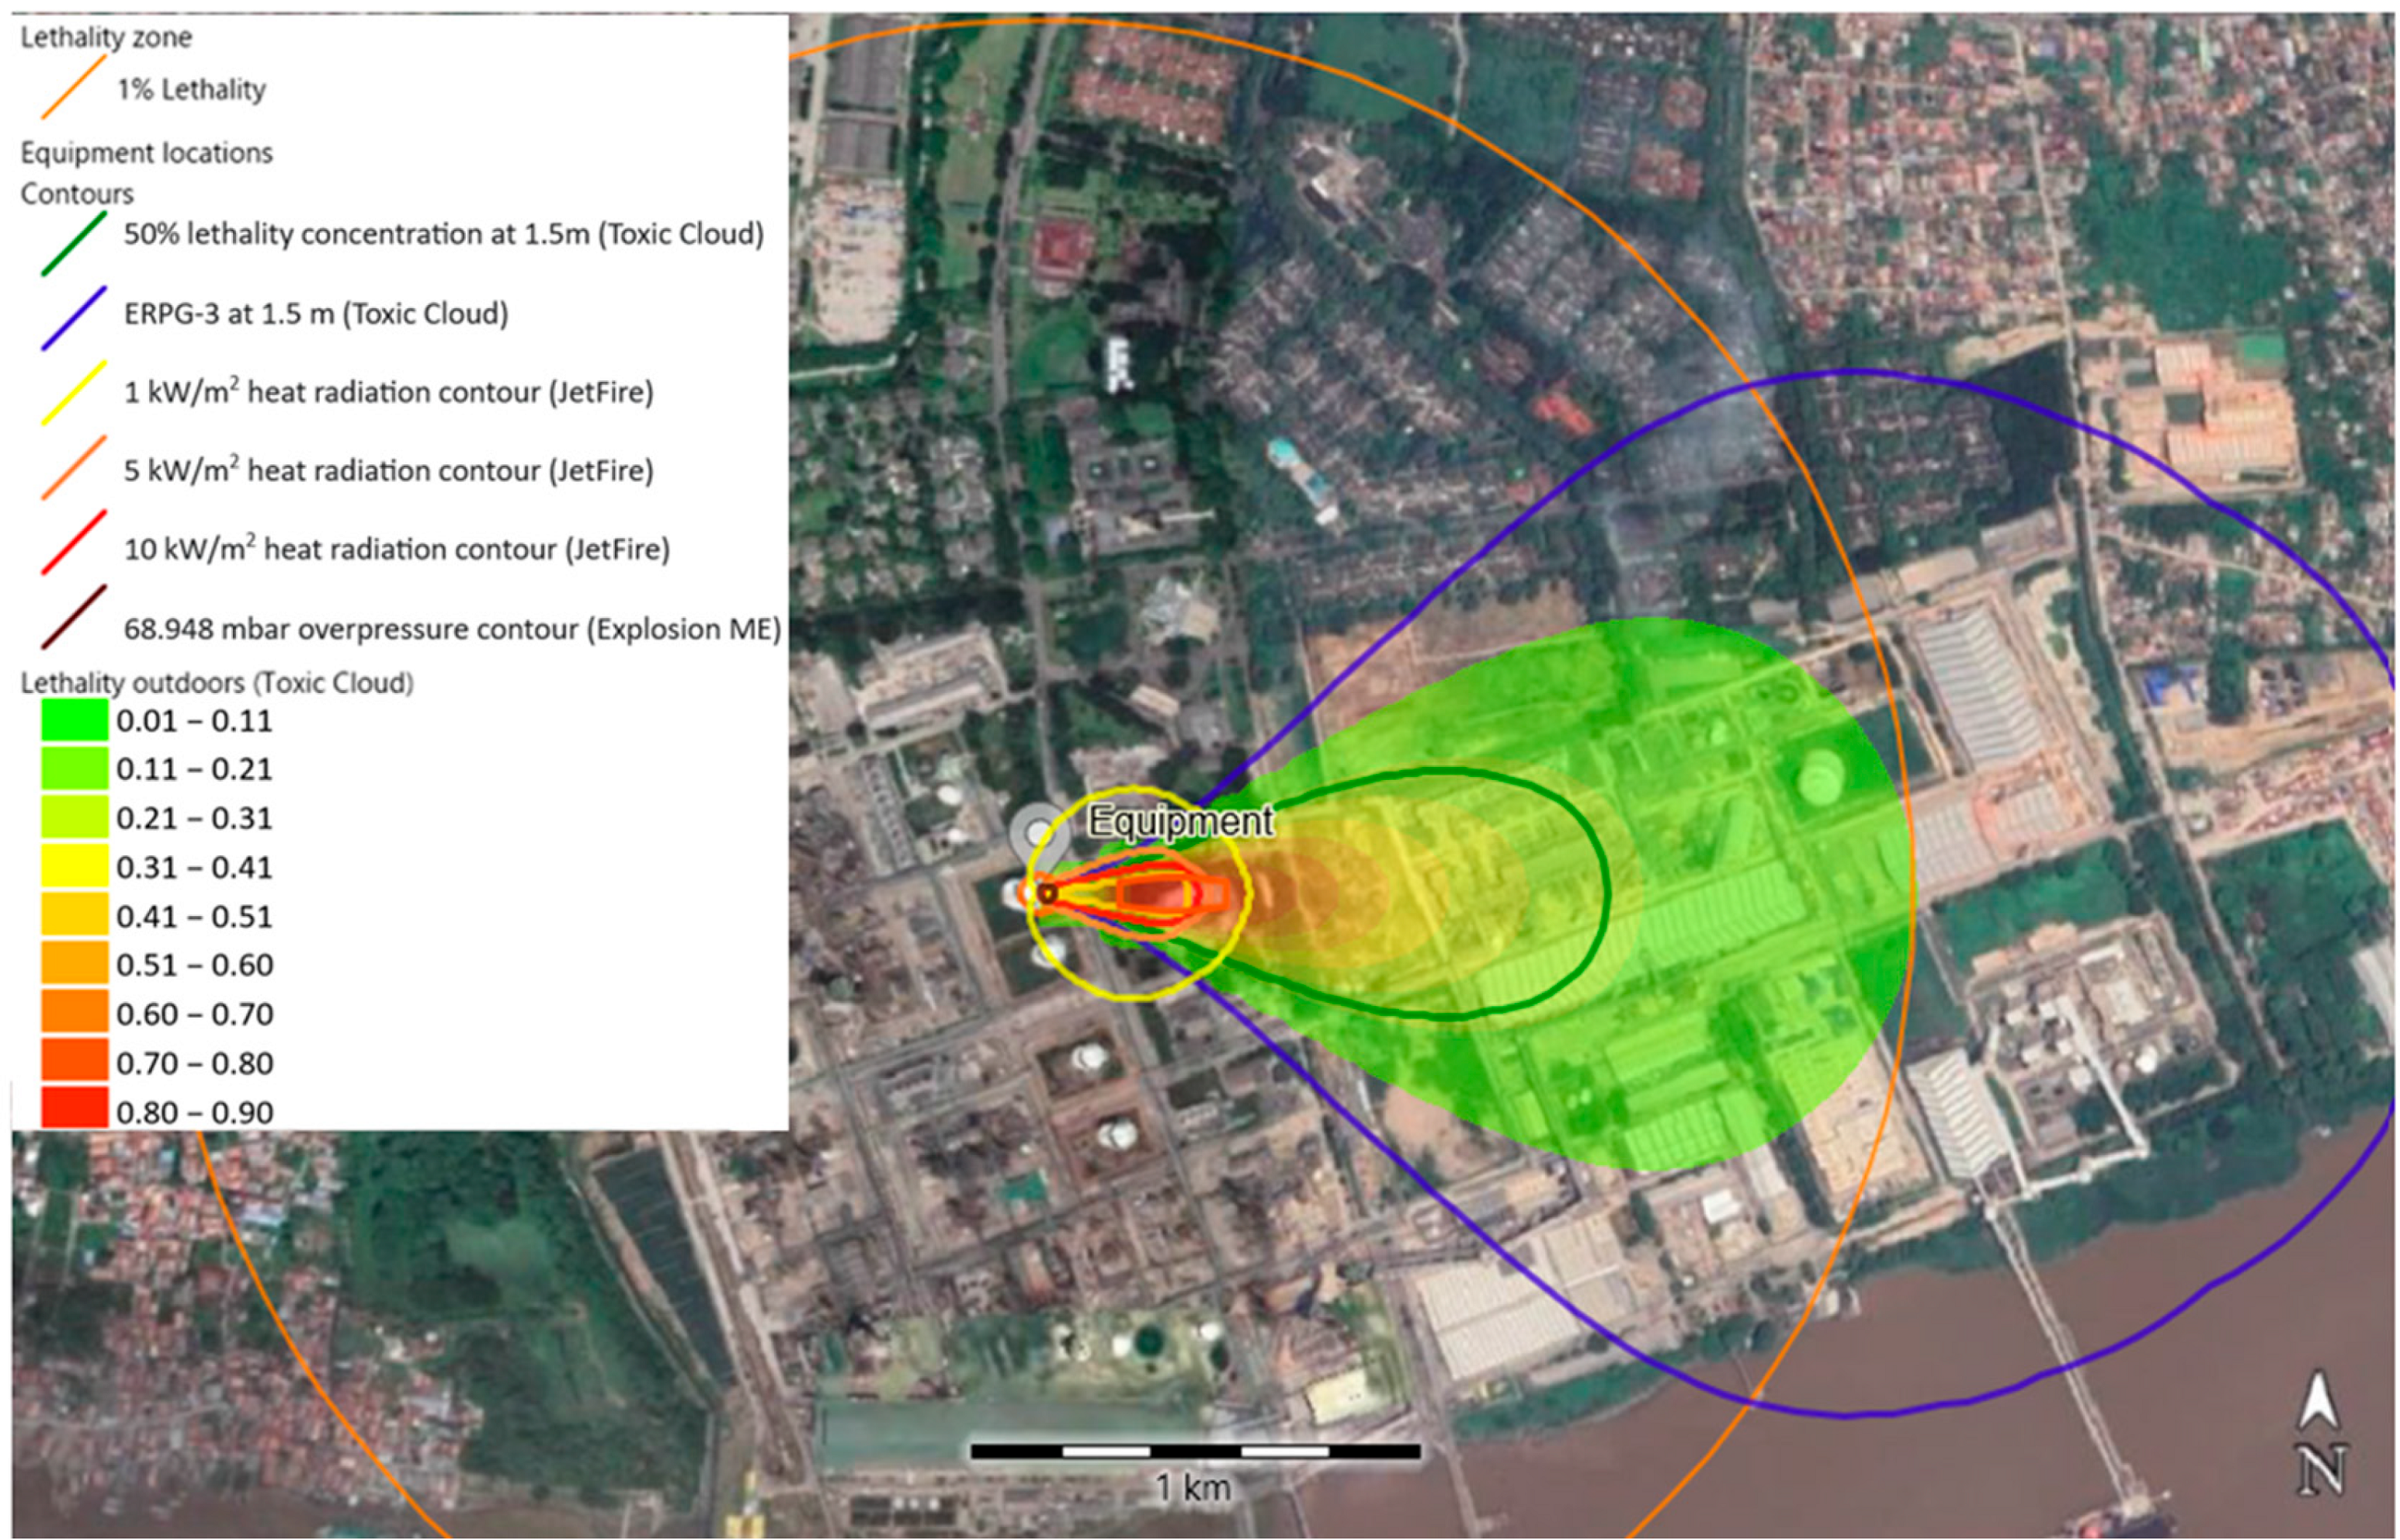
Every phenomenon modeled has its consequence and probability. On the basis of consequence, toxic dispersion is the most dangerous phenomenon, with impact affecting the larger areas compared to fire and explosion, as shown in Figure 2. However, consequence is not the only aspect of risk. Risk is the product of consequence and probability (or frequency). The estimated frequency of the G2 scenario is only 5 × 10⁻⁷ per year, so the risk might not be as bad as the consequence modeling suggests.
Quantitative risk assessment in RISKCURVES gives a more realistic picture compared to consequence modeling because it considers the statistical probability of wind speed and direction, while any consequence modeling software can only input one value for each simulation. Wind direction is very important; as Figure 2 shows, the heavily affected area was in the downwind direction. Wind speed also greatly affects the consequence, as discussed in the previous section. Therefore, in this study, the wind rose over one year was incorporated into meteorological data, providing the probability required to estimate the risk in the surrounding area.
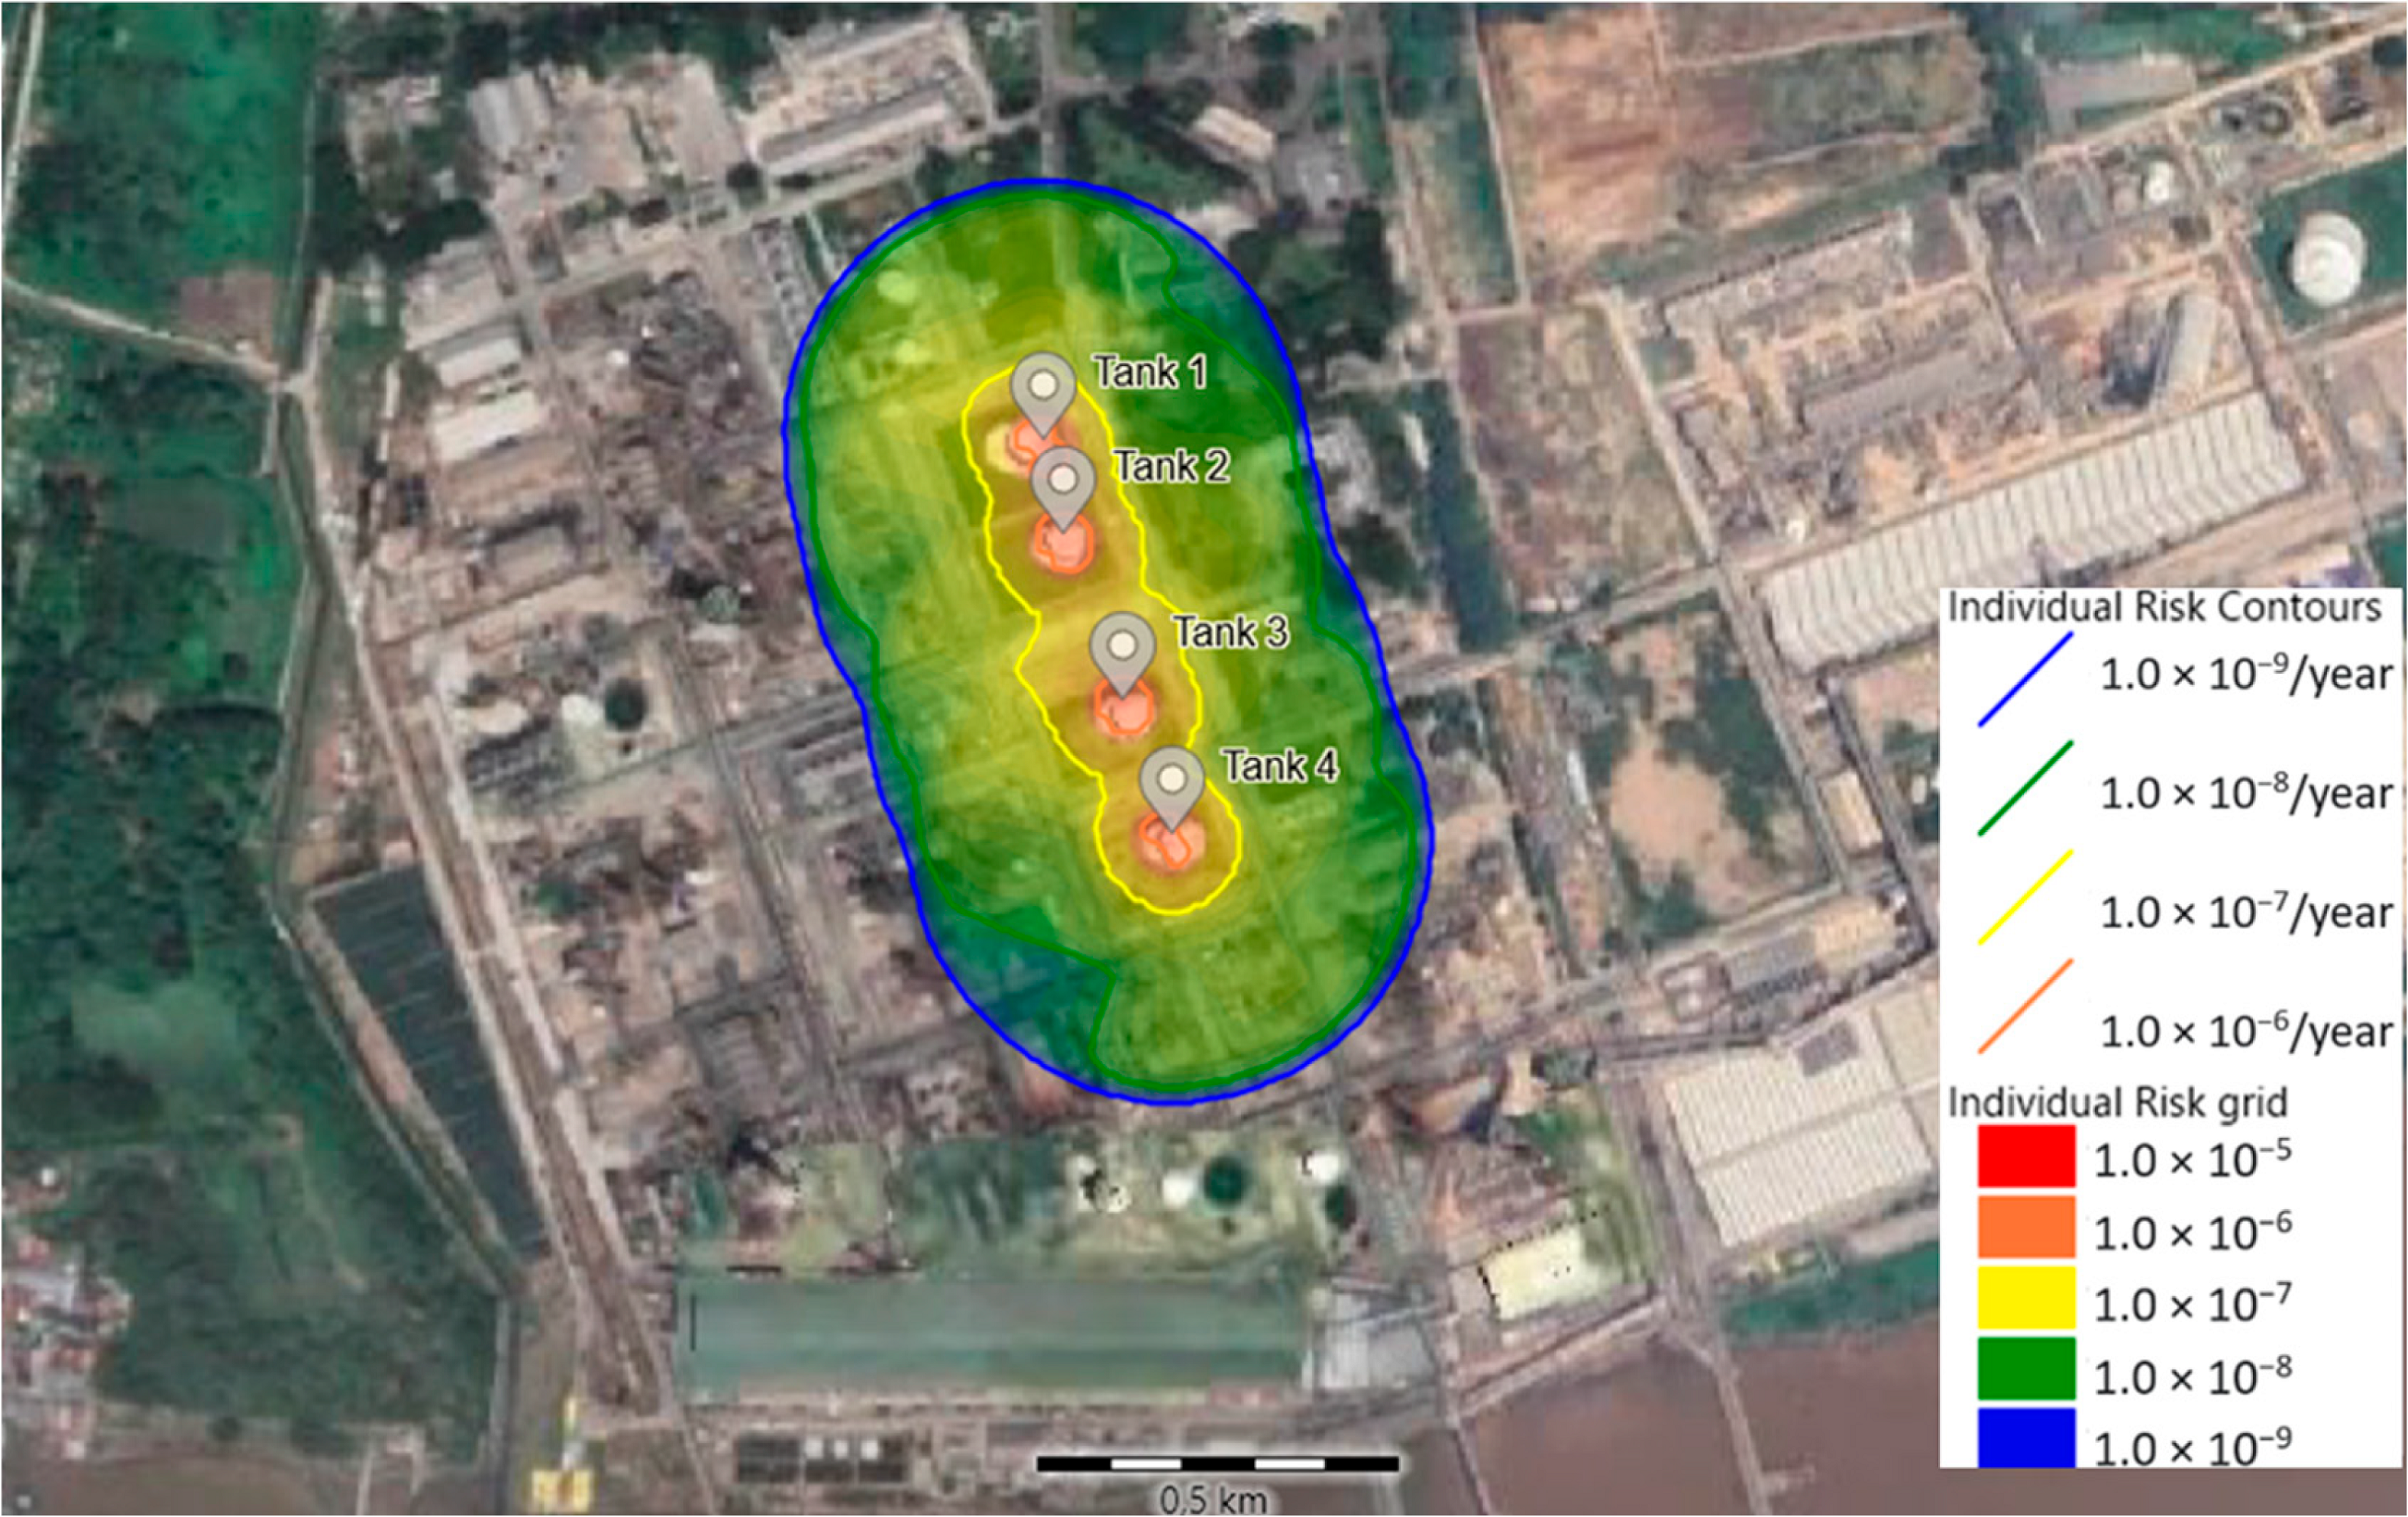
Individual risk is the annual risk of death or serious injury to which specific individuals are exposed. After multiplying consequence and frequency, all the risks from every phenomenon modeled were added up, resulting in individual risk. Since there is more than one ammonia tank in the plant, the risk from each ammonia tank should be considered, something that cannot be conducted in consequence modeling software. The individual risk map caused by four ammonia storage tanks is displayed in Figure 3.
To evaluate whether the risk is acceptable or not, the value of individual risk was compared to the criteria by UK HSE, which is widely used as a standard worldwide [19]. The UK HSE standard for individual risk was expressed as a risk triangle. An individual risk value less than 1 × 10⁻⁶ per year was considered broadly acceptable, while more than 10−3 and 10−4 per year were unacceptable for workers and the public, respectively. According to these criteria, all areas outside of the immediate vicinity of the ammonia storage tank have an acceptable individual risk and are still tolerable for workers even when they have to work right beside the tank. However, the purple book warns that the accident frequency provided was considered rather optimistic [12]. This means that, statistically, the accident frequency tends to be larger and would yield larger risk as well. In addition to that, the risk estimation in this study did not take into account other storage tanks and connecting pipelines, each with their failure frequency. Therefore, the result had to be considered carefully, and people working in the yellow and orange areas on the risk map must be made aware of all the risks.
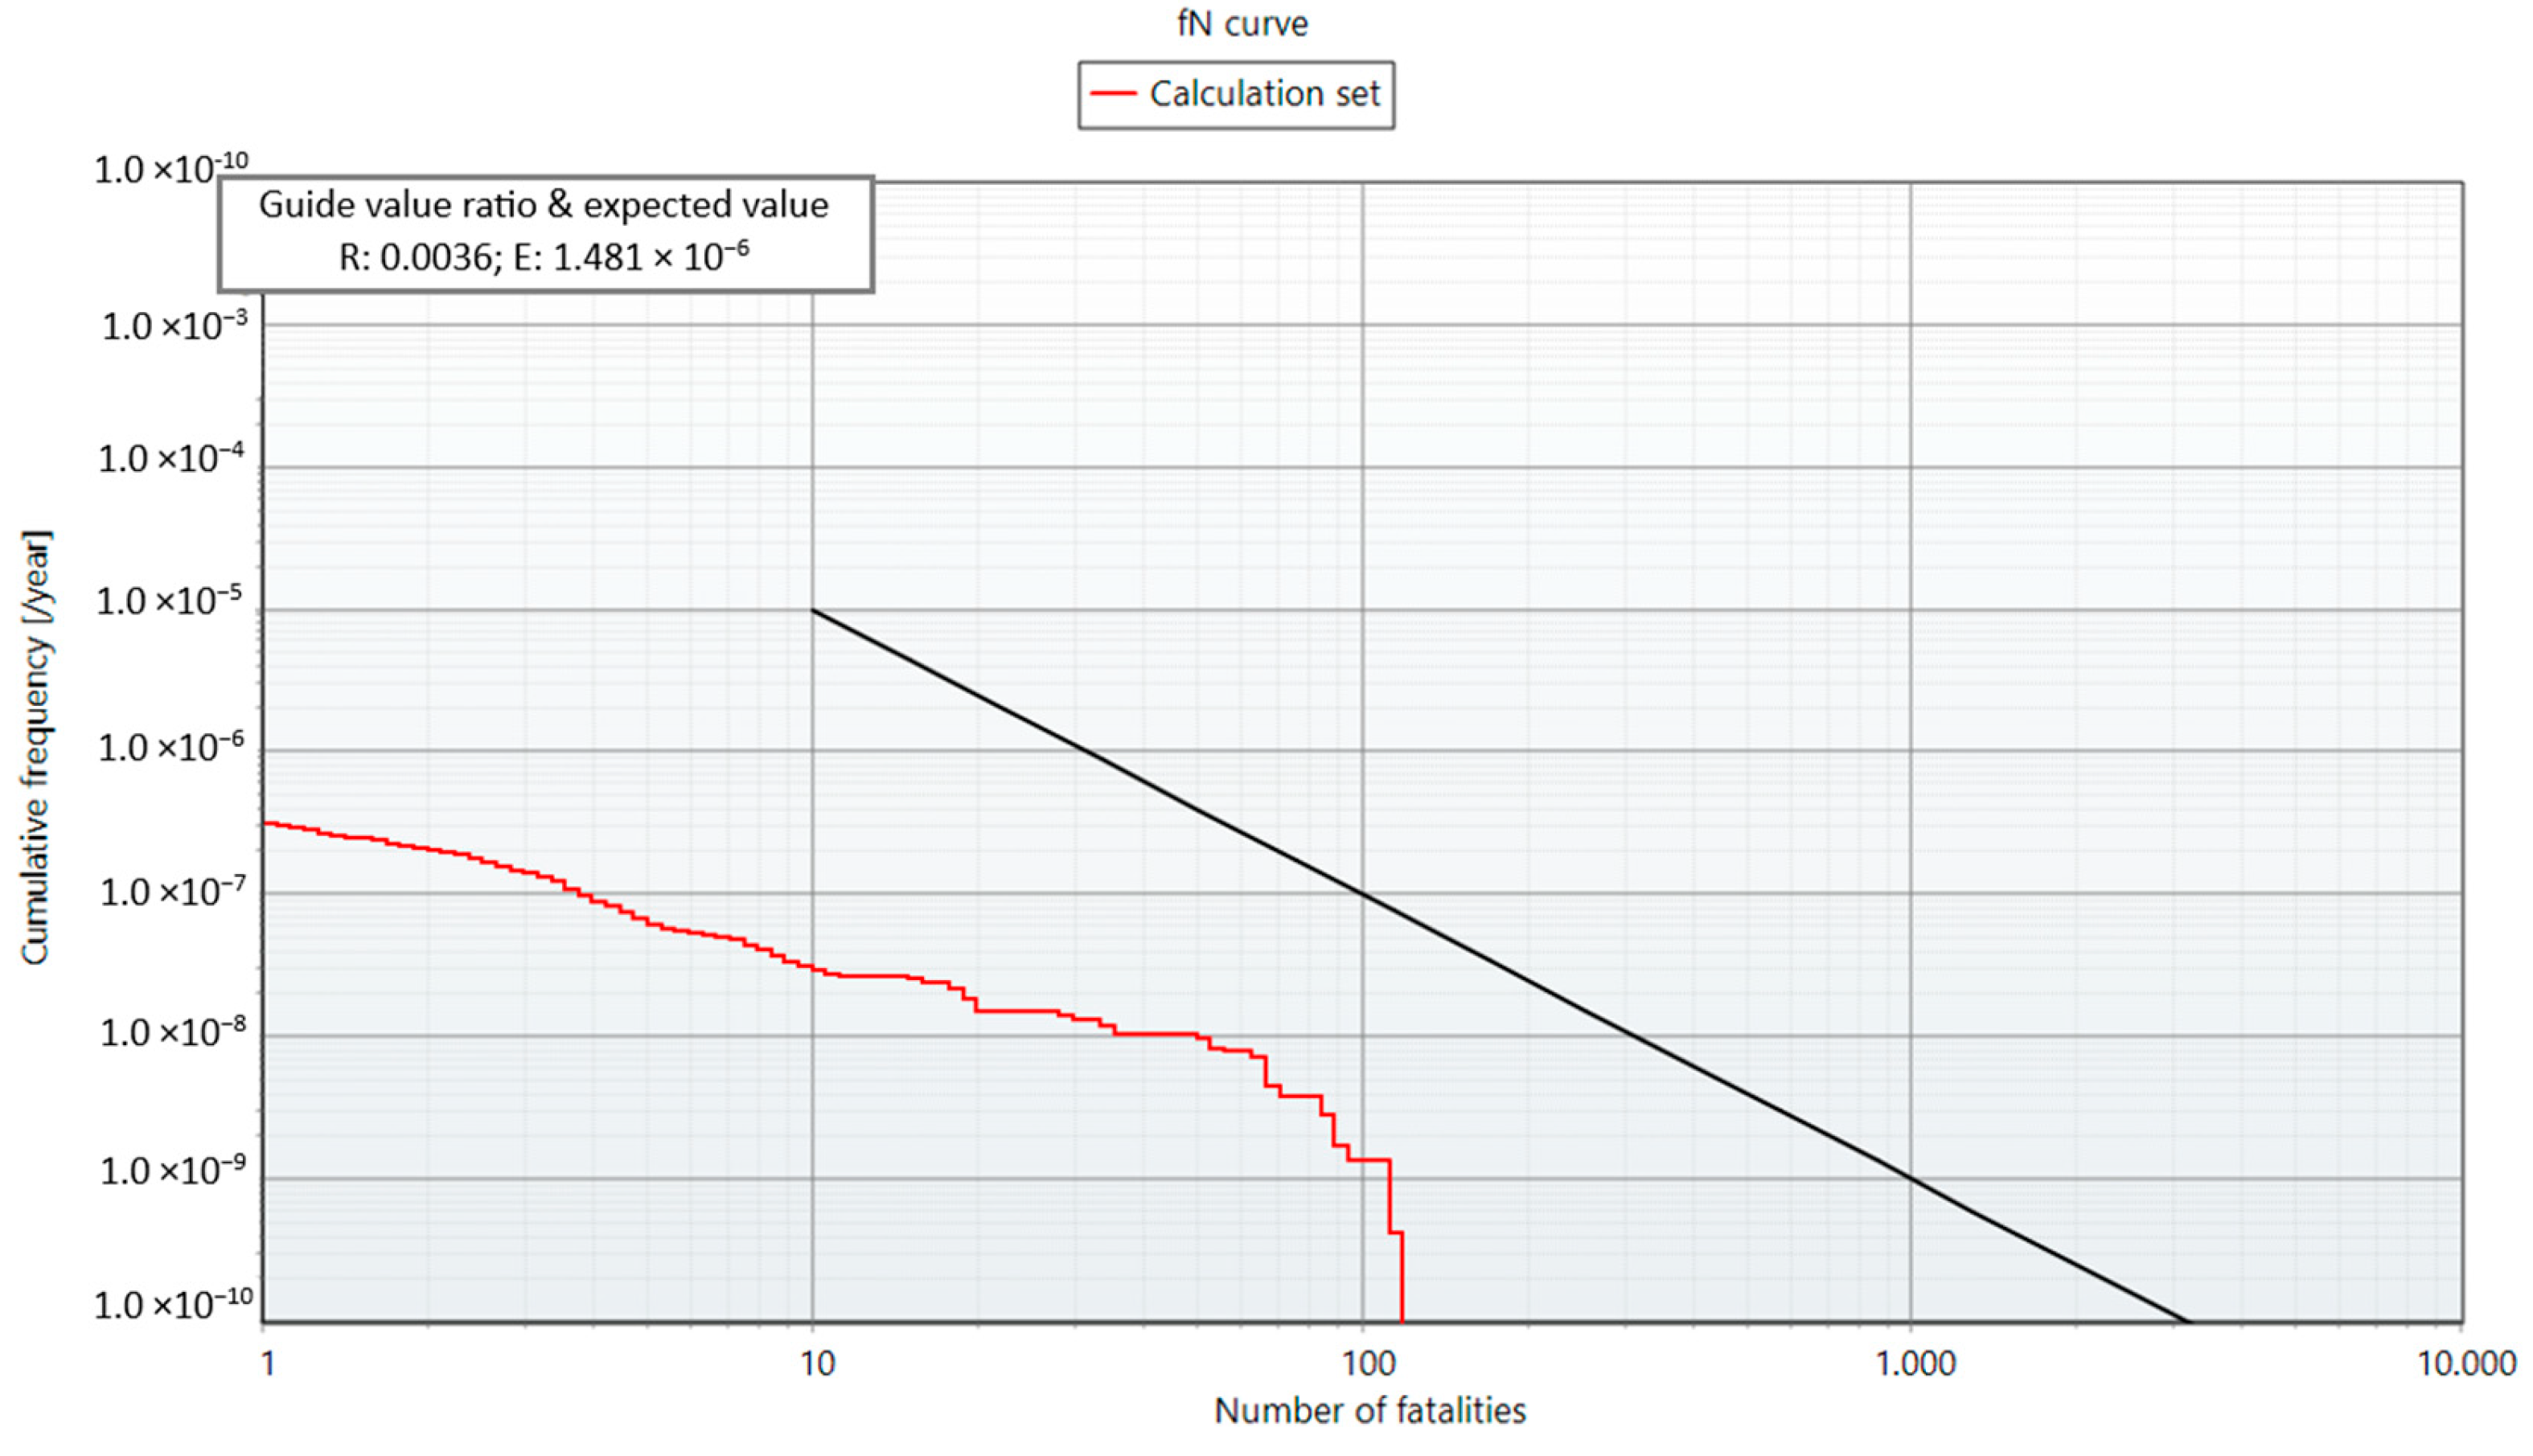
Societal risk is the relationship between the frequency and the number of people suffering from a specified level of harm in a given population due to the realization of specific hazards. Societal risk is usually represented as an F-N curve or Farmer diagram, which presents the cumulative frequency (F) of experiencing N or more fatalities due to all the scenarios. To assess the acceptability of societal risk, a guide value was used, which represented a straight line. Figure 4 shows the societal risk of ammonia leakage from the storage tank (red curve) compared to the guide value used by UK HSE (black line). Since the F-N curve was well below the guideline, the societal risk from the ammonia storage tank was broadly acceptable.

4. Conclusions

A quantitative risk analysis of ammonia gas release was conducted using the RISKCURVES software. Three leak scenarios were evaluated for the release of ammonia gas according to the Netherlands’ QRA guidelines. The simulation results revealed five phenomena caused by ammonia gas release: jet fire, vapor cloud explosion (VCE), pool fire, boiling liquid expanding vapor explosion (BLEVE), and toxic dispersion. Among these, poisonous dispersion poses the most significant hazard due to its extensive affected area, which is heavily affected by atmospheric conditions. Toxic release at night is generally more dangerous than during the daytime, and the maximum wind speed for this area, which is 3.3 m/s, spreads the substance to the farthest distance. Meanwhile, the fire and explosion phenomena were less severe and mostly unaffected by atmosphere conditions because of the low reactivity of burning ammonia. While the consequence of instantaneous ammonia release (G1) and big ammonia leak (G2) is severe due to toxicity, the individual risk and societal risk in the plant area are still considered acceptable. The distance between the tank and other facilities is far enough to ensure that fire and explosion incidents are isolated. This finding indicates that the industry had managed the risk sufficiently by storing the ammonia in refrigerated storage and choosing the plant location and layout. While the risk is still acceptable, the severe consequence of the leak described in this study served as a warning that the operation and maintenance standards always have to be upheld to prevent accidents.

Author Contributions

Conceptualization, A.U.R.; methodology, A.P.N. and T.C.; software, A.N., A.P.N. and T.C.; formal analysis, A.N. and A.U.R.; investigation, A.N. and A.P.N.; writing—original draft preparation, A.P.N.; writing—review and editing, A.N. and A.U.R.; visualization, A.N. and A.U.R.; supervision, A.U.R. All authors have read and agreed to the published version of the manuscript.

Funding

This research is supported by the “Program Kompetisi Kampus Merdeka 2021” funding, from the Ministry of Higher Education, Indonesia.

Data Availability Statement

Data are available upon request.

Conflicts of Interest

The authors declare no conflicts of interest.

References

  1. Statista Research Department Global Consumption of Agricultural Fertilizer from 1965 to 2021, by Nutrient. Available online: https://www.statista.com/statistics/438967/fertilizer-consumption-globally-by-nutrient/ (accessed on 20 September 2024).
  2. Apriani, M. Analisis Risiko Kegagalan Dan Basic Cause Kebocoran Pada Tangki Penyimpanan Amonia. J. Purifikasi 2016, 16, 102–110. [Google Scholar] [CrossRef]
  3. U.S. EPA. Hazards of Ammonia Releases at Ammonia Refrigeration Facilities (Update) [Fact Sheet]. EPA 550-F-01-009. 2001. Available online: https://www.epa.gov/sites/default/files/2013-11/documents/ammonia.pdf (accessed on 3 March 2024).
  4. French Ministry of the Environment. Explosion of an Ammonia Tank March 24,1992 Dakar Senegal. 2006. Available online: https://www.aria.developpement-durable.gouv.fr/wp-content/files_mf/A3485_ips03485_002.pdf (accessed on 2 March 2024).
  5. Stewart, E. Revisiting the Jonava Ammonia Tank Rupture—35 Years On. Loss Prev. Bull. 2024, 295, 2–6. [Google Scholar]
  6. Masriadi. Kebocoran Amonia Di Aceh, PIM Akui Katup Pengaman Pabrik Terbuka. Kompas, 14 November 2016. Available online: https://regional.kompas.com/read/2016/11/14/05163831/kebocoran.amonia.di.aceh.pim.akui.katup.pengaman.pabrik.terbuka (accessed on 2 March 2024).
  7. Prihatini, Z.; Movanita, A.N.K. 200 Warga Dievakuasi Imbas Kebocoran Gas Amonia Di Pabrik Es Karawaci. Kompas, 6 February 2024. Available online: https://megapolitan.kompas.com/read/2024/02/06/17424901/200-warga-dievakuasi-imbas-kebocoran-gas-amonia-di-pabrik-es-karawaci (accessed on 2 March 2024).
  8. Nashira, A.; Rahmah, A.U.; Wahyuningsih, A.; Azizah, P.R.N. Risk Assessment of Hospital Waste Water Treatment Plant Operation—A Case Study of a Class B Hospital in Indonesia. Int. J. Saf. Secur. Eng. 2024, 14, 1305–1317. [Google Scholar] [CrossRef]
  9. El Harbawi, M.; Mustapha, S.; Choong, T.S.Y.; Abdul Rashid, S.; Kadir, S.A.S.A.; Abdul Rashid, Z. Rapid Analysis of Risk Assessment Using Developed Simulation of Chemical Industrial Accidents Software Package. Int. J. Environ. Sci. Technol. 2008, 5, 53–64. [Google Scholar] [CrossRef]
  10. Danasa, A.S.; Soesilo, T.E.B.; Martono, D.N.; Sodri, A.; Hadi, A.S.; Chandrasa, G.T. The Ammonia Release Hazard and Risk Assessment: A Case Study of Urea Fertilizer Industry in Indonesia. IOP Conf. Ser. Earth Environ. Sci. 2019, 399, 012087. [Google Scholar] [CrossRef]
  11. Novrikasari, N.; Lestari, F.; Sudiman, D.R.; Kamso, S.; Nugroho, Y.S.; Prasetyo, B.T.; Wispriyono, B.; Gunawan, F.A.; Andarini, D. Analisis Kesiapsiagaan Bencana Teknologi Dari Pabrik X Pada Aspek Proyeksi Zona Bahaya. J. Kesehat. Lingkung. Indones. 2023, 22, 38–45. [Google Scholar] [CrossRef]
  12. de Haag, P.A.M.U.; Ale, B.J.M. Guideline for Quantitative Risk Assessment “Purple Book”; National Institute of Public Health and the Environment (RIVM): Bilthoven, The Netherlands, 2005. [Google Scholar]
  13. Anjana, N.S.; Amarnath, A.; Harindranathan Nair, M.V. Toxic Hazards of Ammonia Release and Population Vulnerability Assessment Using Geographical Information System. J. Environ. Manag. 2018, 210, 201–209. [Google Scholar] [CrossRef]
  14. Wusnah; Sylvia, N.; Bindar, Y. Kajian Pengaruh Angin Silang Terhadap Karakteristik Nyala Hidrokarbon. J. Teknol. Kim. Unimal 2013, 1, 25–37. [Google Scholar]
  15. Office of Response and Restoration Thermal Radiation Levels of Concern. Available online: https://response.restoration.noaa.gov/oil-and-chemical-spills/chemical-spills/resources/thermal-radiation-levels-concern.html (accessed on 20 September 2024).
  16. Thomas, J.K.; Malik, D.R. Ammonia and Hydrogen Vapor Cloud Explosion Testing (A Tale of Two Gases). In Proceedings of the 62nd Annual Safety in Ammonia Plants and Related Facilities Symposium, Brooklyn, NY, USA, 10–14 September 2017. [Google Scholar]
  17. Perwitasari, P.; Sumardi, S.; Perdana, I. Model Dispersi Gas Dan Vapor Cloud Explosion Pada Kebocoran Outlet Pigtail Tubes Primary Reformer. J. Rekayasa Proses 2018, 12, 9. [Google Scholar] [CrossRef]
  18. Corruchaga, A.; Casal, O.; Palacios, A.; Casal, J. Influence of Wind Speed and Ammonia Concentration on Its Evaporation Rate from Aqueous Solution Spills. J. Loss Prev. Process Ind. 2022, 76, 104750. [Google Scholar] [CrossRef]
  19. UK HSE Guidance on ALARP Decisions in COMAH. Available online: https://www.hse.gov.uk/foi/internalops/hid_circs/permissioning/spc_perm_37/ (accessed on 20 September 2024).
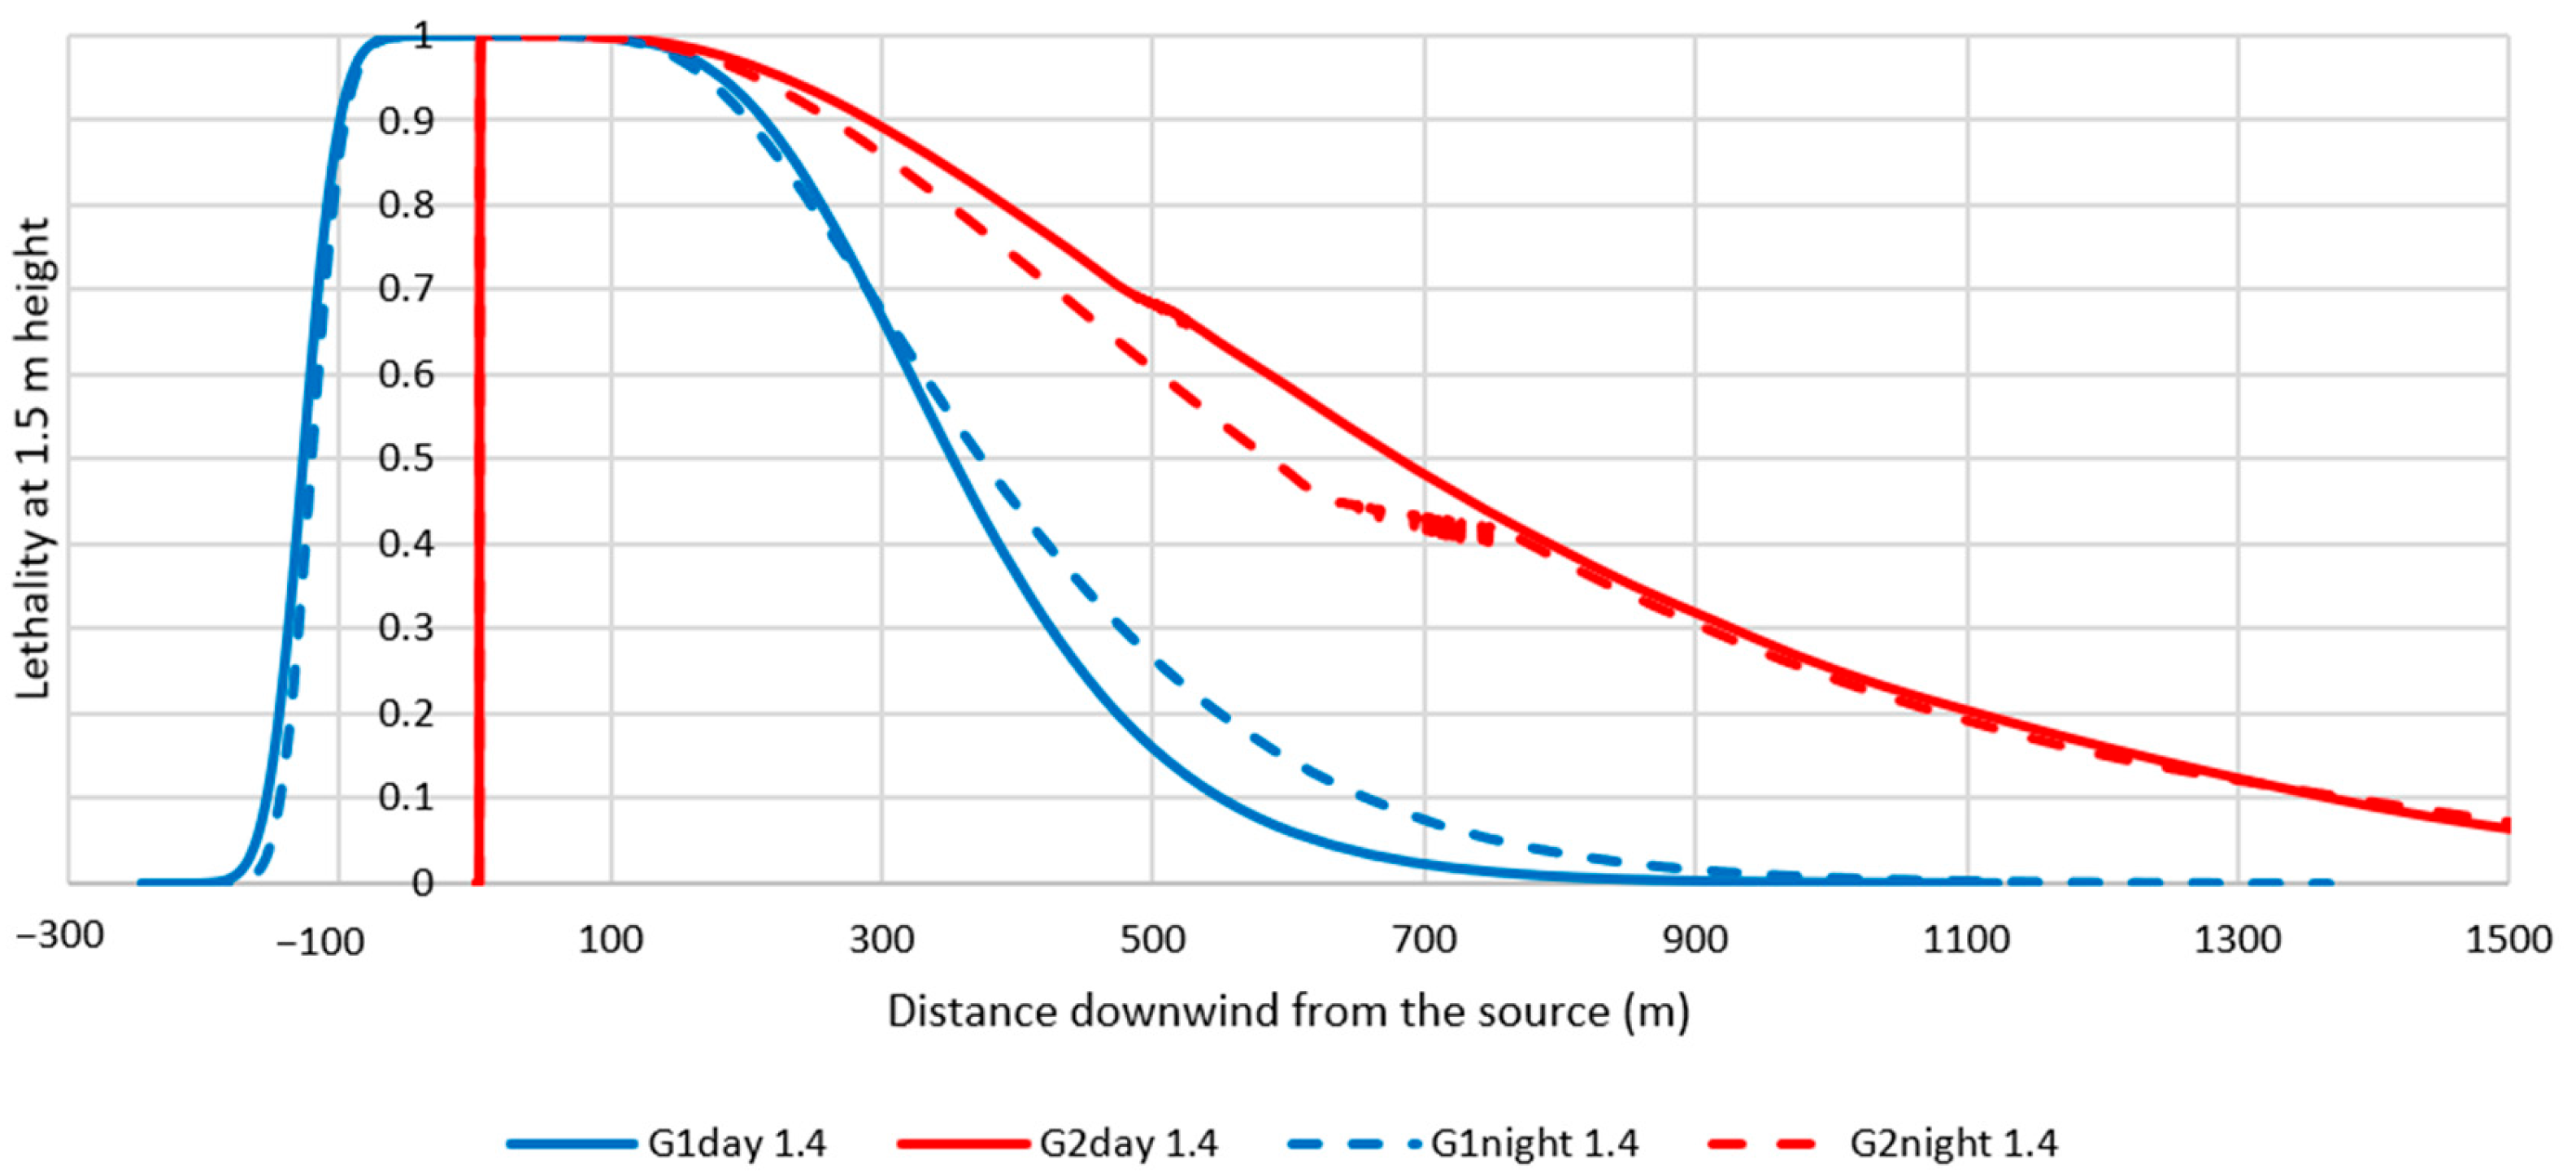
Figure 1. The lethality over distance for toxic cloud from G1 and G2 scenario of 1.4 m/s wind.
Engproc 84 00080 g001
Figure 2. The area affected by scenario G2 at day with 1.4 m/s wind.
Engproc 84 00080 g002
Figure 3. Individual risk map caused by the ammonia storage tank.
Engproc 84 00080 g003
Figure 4. F-N curve representing societal risk of the ammonia storage tanks.
Engproc 84 00080 g004
Table 1. Metereological data for the modeling.
ParameterDayNight
Relative humidity67%92%
Temperature31 °C25 °C
Pressure1.009 bar1.007 bar
Average wind speed0.3 m/s; 1.4 m/s; 3.3 m/s
Table 2. Scenario for ammonia release.
G1G2G3
Release typeInstantaneousContinuous, 10 min to emptyContinuous, hole 10 mm
Frequency5 × 10−75 × 10−71 × 10−5
Table 3. Heat radiation contour distance from G2 scenario.
Heat Radiation ContoursDistance (m)
DayNight
0.3 m/s1.4 m/s3.3 m/s0.3 m/s1.4 m/s3.3 m/s
1 kW/m2480465437472456428
5 kW/m2397377345390370339
10 kW/m2372352320365345314
35 kW/m2000000
Table 4. Overpressure contour distance from G1 and G2 scenario.
Scenario and Overpressure ContoursDistance (m)
DayNight
0.3 m/s1.4 m/s3.3 m/s0.3 m/s1.4 m/s3.3 m/s
G1 overpressure contour (69 mbar) 9210111093102111
G2 overpressure contour (69 mbar)423527433427
Table 5. Pool fire and BLEVE contour distance from G1 scenario.
Contour NameDistance (m)
DayNight
0.3 m/s1.4 m/s3.3 m/s0.3 m/s1.4 m/s3.3 m/s
1 kW/m2 (pool fire)140142145140142145
5 kW/m2 (pool fire)767985767985
10 kW/m2 (pool fire)606269606269
69 mbar overpressure (BLEVE blast)343434343434
Table 6. Concentration contour distance for toxic cloud G2 scenario.
Concentration ContourDistance (m)
DayNight
0.3 m/s1.4 m/s3.3 m/s0.3 m/s1.4 m/s3.3 m/s
ERPG-2 at 1.5 m633010,60213,655645910,73113,412
ERPG-3 at 1.5 m152731884413183536134742
50% lethality concentration at 1.5 m92412571043100512881039
Disclaimer/Publisher’s Note: The statements, opinions and data contained in all publications are solely those of the individual author(s) and contributor(s) and not of MDPI and/or the editor(s). MDPI and/or the editor(s) disclaim responsibility for any injury to people or property resulting from any ideas, methods, instructions or products referred to in the content.