
Strength Behavior of Internally Reinforced Beams Subjected to Structural Optimization Under Simple Bending Loading


Abstract
1. Introduction
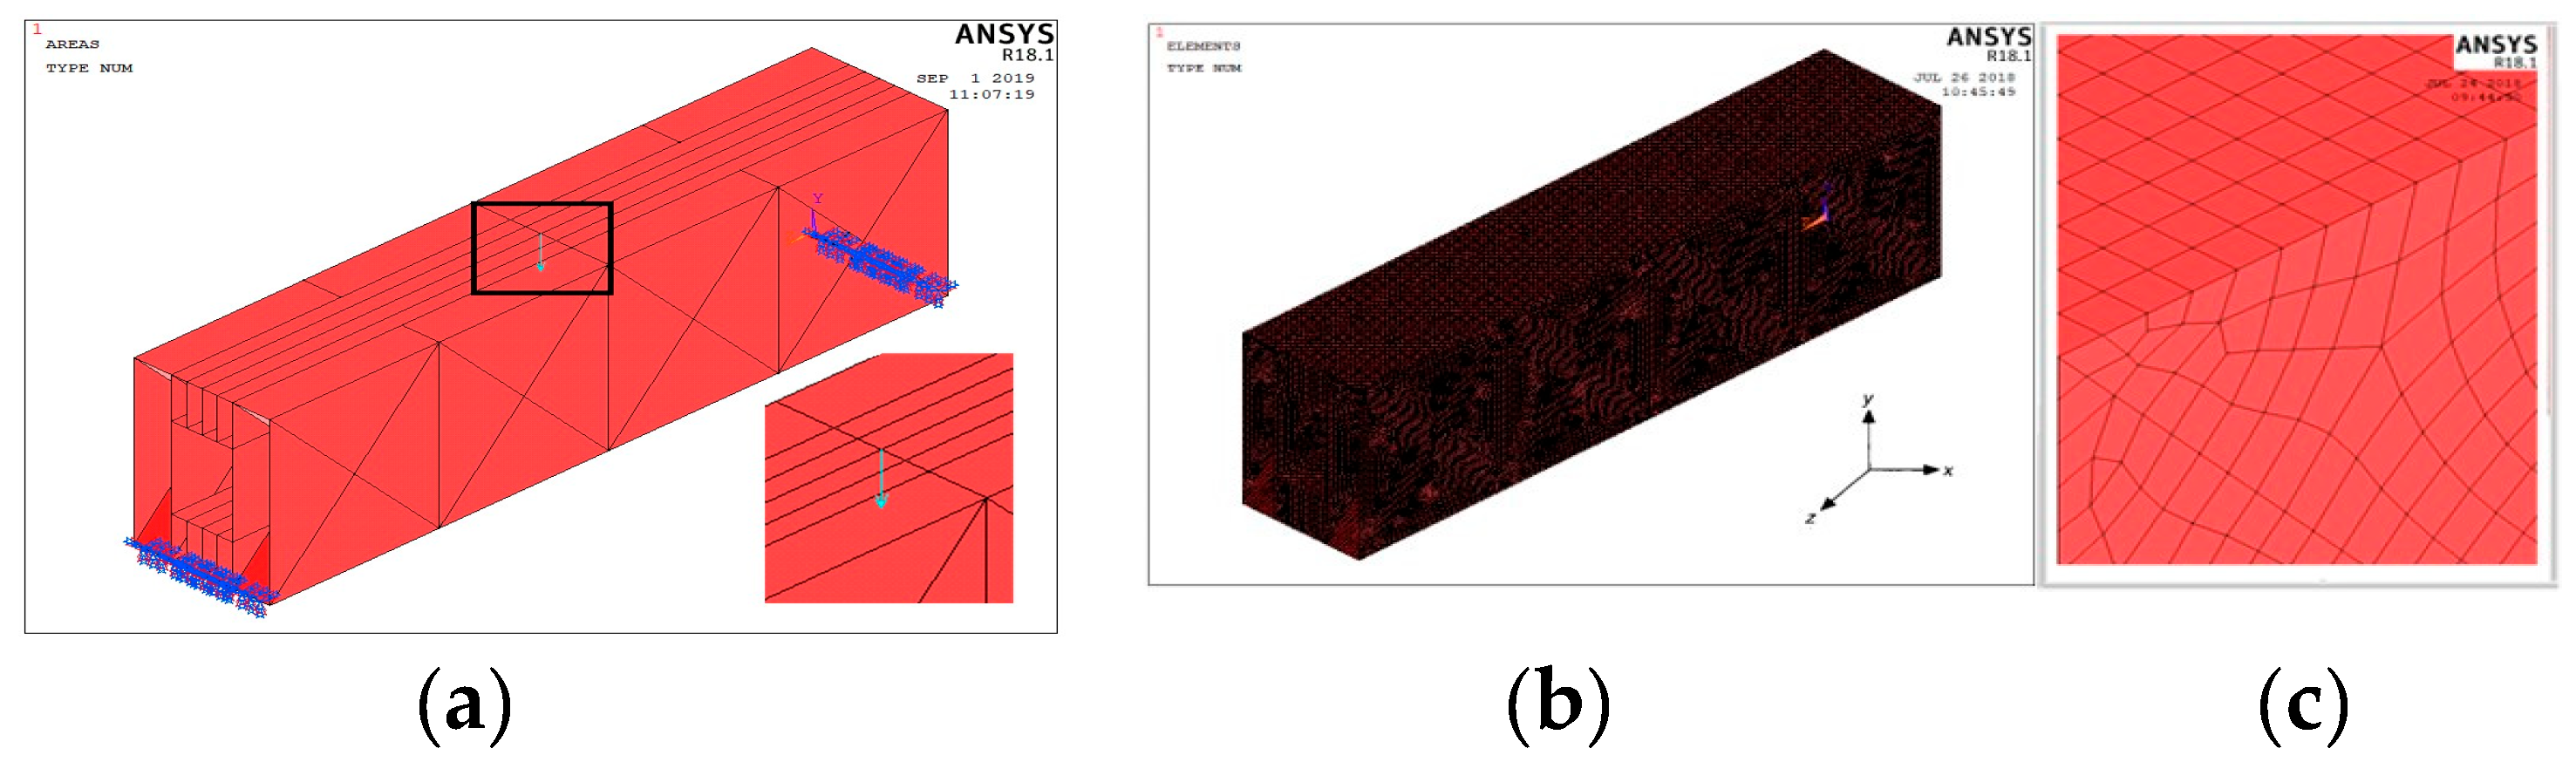
2. Numerical Procedure
3. Results and Discussion
4. Conclusions
- -
- The geometric variables discussed here are highly sensitive regarding calculated values of the Huber–Mises strength.
- -
- The optimization code previously developed in MATLAB 2017b is effective in improving the strength behavior under bending loads, even if the models had their mechanical behavior optimized only in terms of deflections and mass.
- -
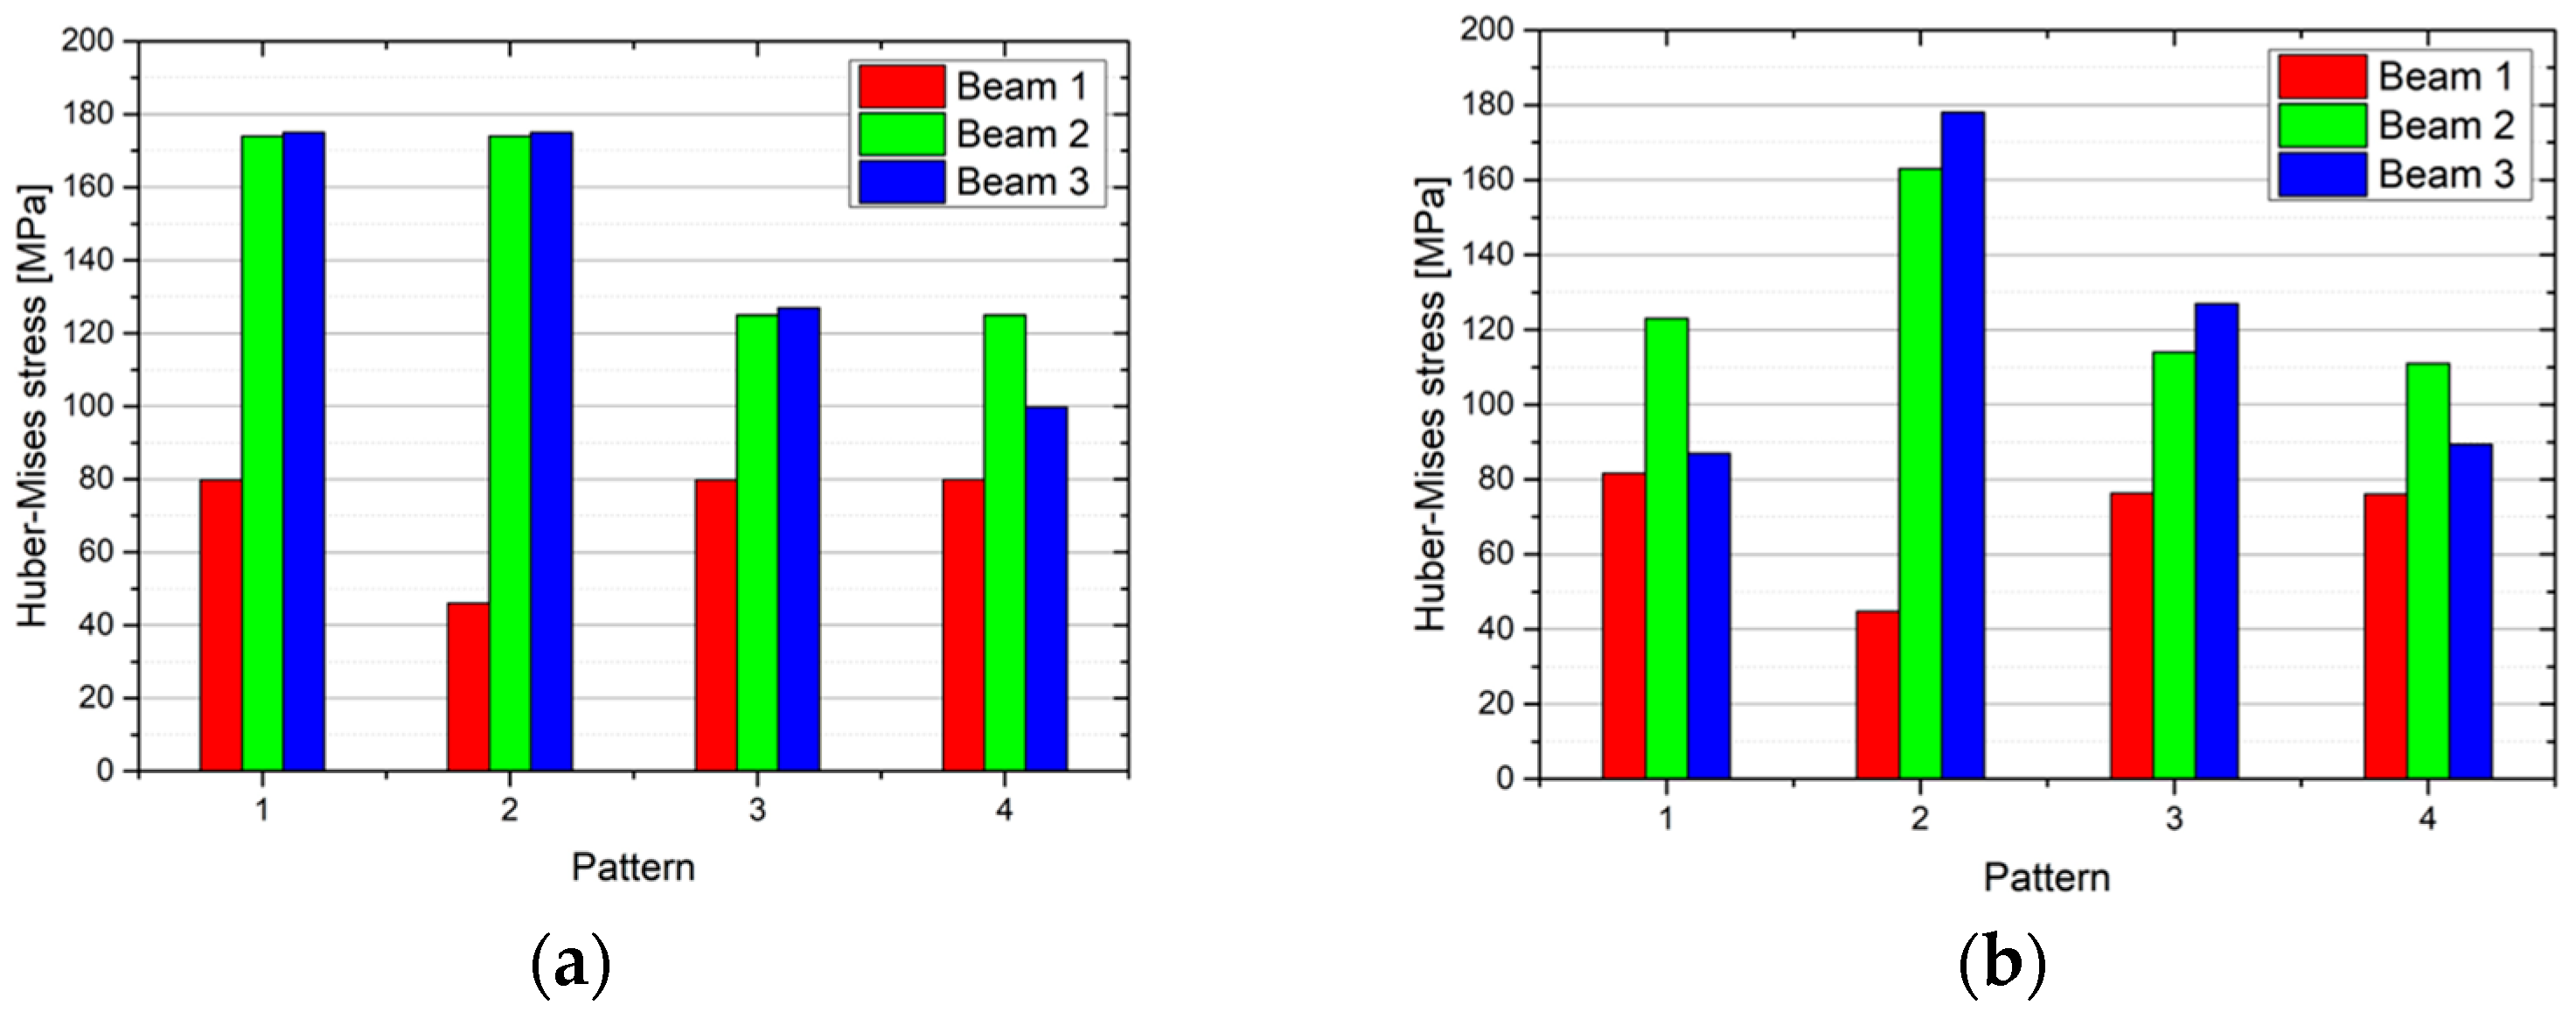
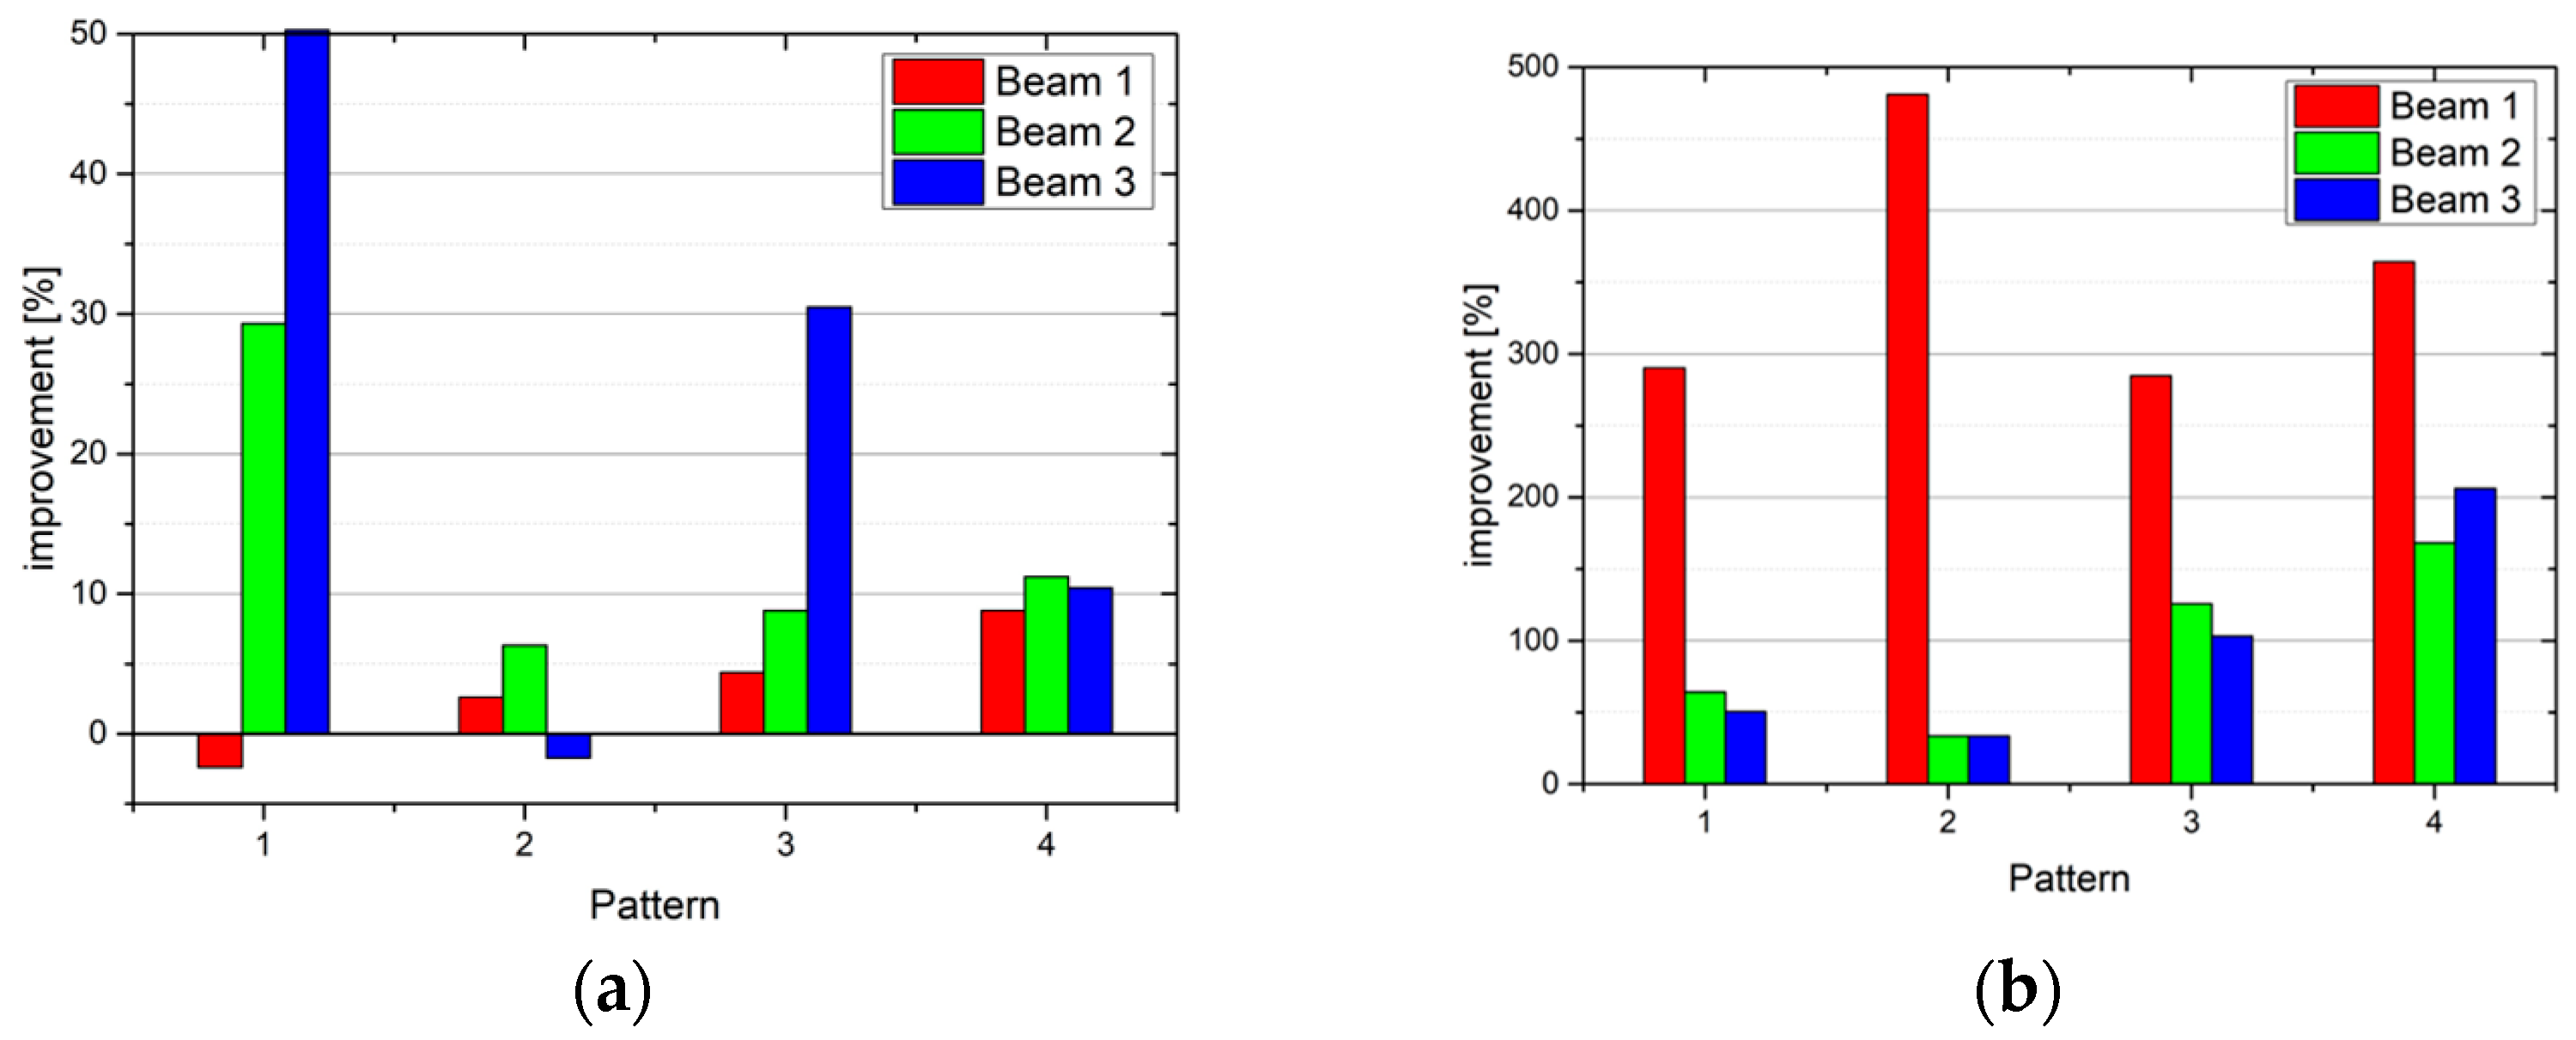
- The developed beams were already proven to be highly effective under bending loading, according to their stiffness behavior [23,24,27,28]. However, their effectiveness in terms of strength is moderate. This is expected, as the strength behavior was not an objective in the previous optimization routine. From the point of view of working conditions, a lowering in the Huber–Mises strength values represents better safety in terms of machine condition, and it may lead to all parts of good quality as well as to an increase in the production rate.
Author Contributions
Funding
Data Availability Statement
Conflicts of Interest
References
- Luévanos-Rojas, A.; López-Chavarría, S.; Medina-Elizondo, M. Optimización de vigas de concreto reforzado para secciones rectangulares con experimentos numéricos. Comput. y Sist. 2018, 22, 599–606. (In Spanish) [Google Scholar]
- Medwadowski, S.J. Nonprismatic shear beams. J. Struct. Eng. 1984, 110, 1067–1082. [Google Scholar] [CrossRef]
- Portland Cement Association. Handbook of Frame Constants: Beam Factors and Moment Coefficients for Members of Variable Section; Portland Cement Association: Skokie, IL, USA, 1947. [Google Scholar]
- Schreyer, H. Elementary theory for linearly tapered beams. J. Eng. Mech. Div. 1978, 104, 515–527. [Google Scholar] [CrossRef]
- Shooshtari, A.; Khajavi, R. An efficient procedure to find shape functions and stiffness matrices of nonprismatic Euler-Bernoulli and Timoshenko beam elements. Eur. J. Mech.–A/Solids 2010, 29, 826–836. [Google Scholar] [CrossRef]
- Rahmanian, I.; Lucet, Y.; Tesfamariam, S. Optimal design of reinforced concrete beams: A review. Comput. Concr. 2014, 13, 457–482. [Google Scholar] [CrossRef]
- Tena-Colunga, A. Stiffness formulation for nonprismatic beam elements. J. Struct. Eng. 1996, 122, 1484–1489. [Google Scholar] [CrossRef]
- Thomas, S.M.; Arulraj, G.P. Optimization of singly reinforced RC beams. Int. J. Res.-Granthaalayah 2017, 5, 199–207. [Google Scholar] [CrossRef]
- Yuksel, S.B. Assessment of non-prismatic beams having symmetrical parabolic haunches with constant haunch length ratio of 0.5. Struct. Eng. Mech. 2012, 42, 849–866. [Google Scholar] [CrossRef]
- Lee, J.; Kim, S.-M.; Park, H.-S.; Woo, B.-H. Optimum design of cold-formed steel channel beams using micro genetic algorithm. Eng. Struct. 2005, 27, 17–24. [Google Scholar] [CrossRef]
- Rajeev, S.; Krishnamoorthy, C.S. Genetic algorithm-based methodology for design optimization of reinforced concrete frames. Comput.-Aided Civ. Infrastruct. Eng. 1998, 13, 63–74. [Google Scholar] [CrossRef]
- Kaveh, A.; Rahami, H. Nonlinear analysis and optimal design of structures via force method and genetic algorithm. Comput. Struct. 2006, 84, 770–778. [Google Scholar] [CrossRef]
- Serpik, I.N.; Mironenko, I.V.; Averchenkov, V.I. Algorithm for evolutionary optimization of reinforced concrete frames subject to nonlinear material deformation. Procedia Eng. 2016, 150, 1311–1316. [Google Scholar] [CrossRef]
- Mangal, M.; Cheng, J.C.P. Automated optimization of steel reinforcement in RC building frames using building information modeling and hybrid genetic algorithm. Autom. Constr. 2018, 90, 39–57. [Google Scholar] [CrossRef]
- Tafraout, S.; Bourahla, N.; Bourahla, Y.; Mebarki, A. Automatic structural design of RC wall-slab buildings using a genetic algorithm with application in BIM environment. Autom. Constr. 2019, 106, 102901. [Google Scholar] [CrossRef]
- Stanton, A.; Javadi, A.A. An automated approach for an optimized least cost solution of reinforced concrete reservoirs using site parameters. Eng. Struct. 2014, 60, 32–40. [Google Scholar] [CrossRef]
- Labibzadeh, M.; Shirin, F.B.; Khajehdezfuly, A. Improvement of performance of the RC beams using the longitudinal spiral reinforcements. Int. J. Struct. Integr. 2022, 13, 922–950. [Google Scholar] [CrossRef]
- Zárate, B.A.; Caicedo, J.M. Finite element model updating: Multiple alternatives. Eng. Struct. 2008, 30, 3724–3730. [Google Scholar] [CrossRef]
- Silva, H.M.; Wojewoda, J. Sensitivity analysis of internally reinforced beams subjected to three-point bending load. Eng. Proc. 2023, 56, 333. [Google Scholar] [CrossRef]
- Silva, H.M.; Wojewoda, J. Sensitivity analysis of internally reinforced beam-subjected torsion loading. Eng. Proc. 2023, 56, 284. [Google Scholar] [CrossRef]
- Silva, H.M.; Wojewoda, J. Determination of the dynamic behaviour of thin-walled hollow-box sandwich beams. Eng. Proc. 2023, 56, 321. [Google Scholar] [CrossRef]
- Silva, H.M.; Wojewoda, J. Determination of the product of inertia of stiffened plates based on Finite Element Method results. Eng. Struct. 2020, 207, 110201. [Google Scholar] [CrossRef]
- Silva, H.M. Optimization of the Mechanical Behaviour of Hollow Box Beams. Ph.D. Thesis, Technical University of Lodz, Lodz, Poland, 2018. [Google Scholar]
- Silva, H.M.; Meireles, J.F. Structural optimization of internally reinforced beams subjected to coupled and uncoupled bending and torsion loadings for industrial applications. Mech. Mech. Eng. 2018, 21, 329–351. [Google Scholar]
- Silva, H.M.; Meireles, J.F.; Wojewoda, J. Experimental validation of a novel thin-walled beam prototype. Mech. Mech. Eng. 2018, 22, 7–17. [Google Scholar]
- Silva, H.M.; Meireles, J.F.; Wojewoda, J. Structural optimization coupled with materials selection for stiffness improvement. Mech. Mech. Eng. 2018, 22, 831–844. [Google Scholar]
- Silva, H.M.; Meireles, J.F. Numerical study on the mechanical behaviour of hollow-box beams subjected to static loadings. Mech. Mech. Eng. 2017, 21, 871–884. [Google Scholar]
- Silva, H.M.; Meireles, J.F. Feasibility of internally reinforced thin-walled beams for industrial applications. Appl. Mech. Mater. 2015, 775, 119–124. [Google Scholar] [CrossRef]
- Silva, H.M.; Meireles, J.F. Determination of material/geometry of the section most adequate for a static loaded beam subjected to a combination of bending and torsion. Mater. Sci. Forum 2012, 730–732, 507–512. [Google Scholar]

| Bending | A1 | A2 | A3 |
|---|---|---|---|
| Pattern 1 | |||
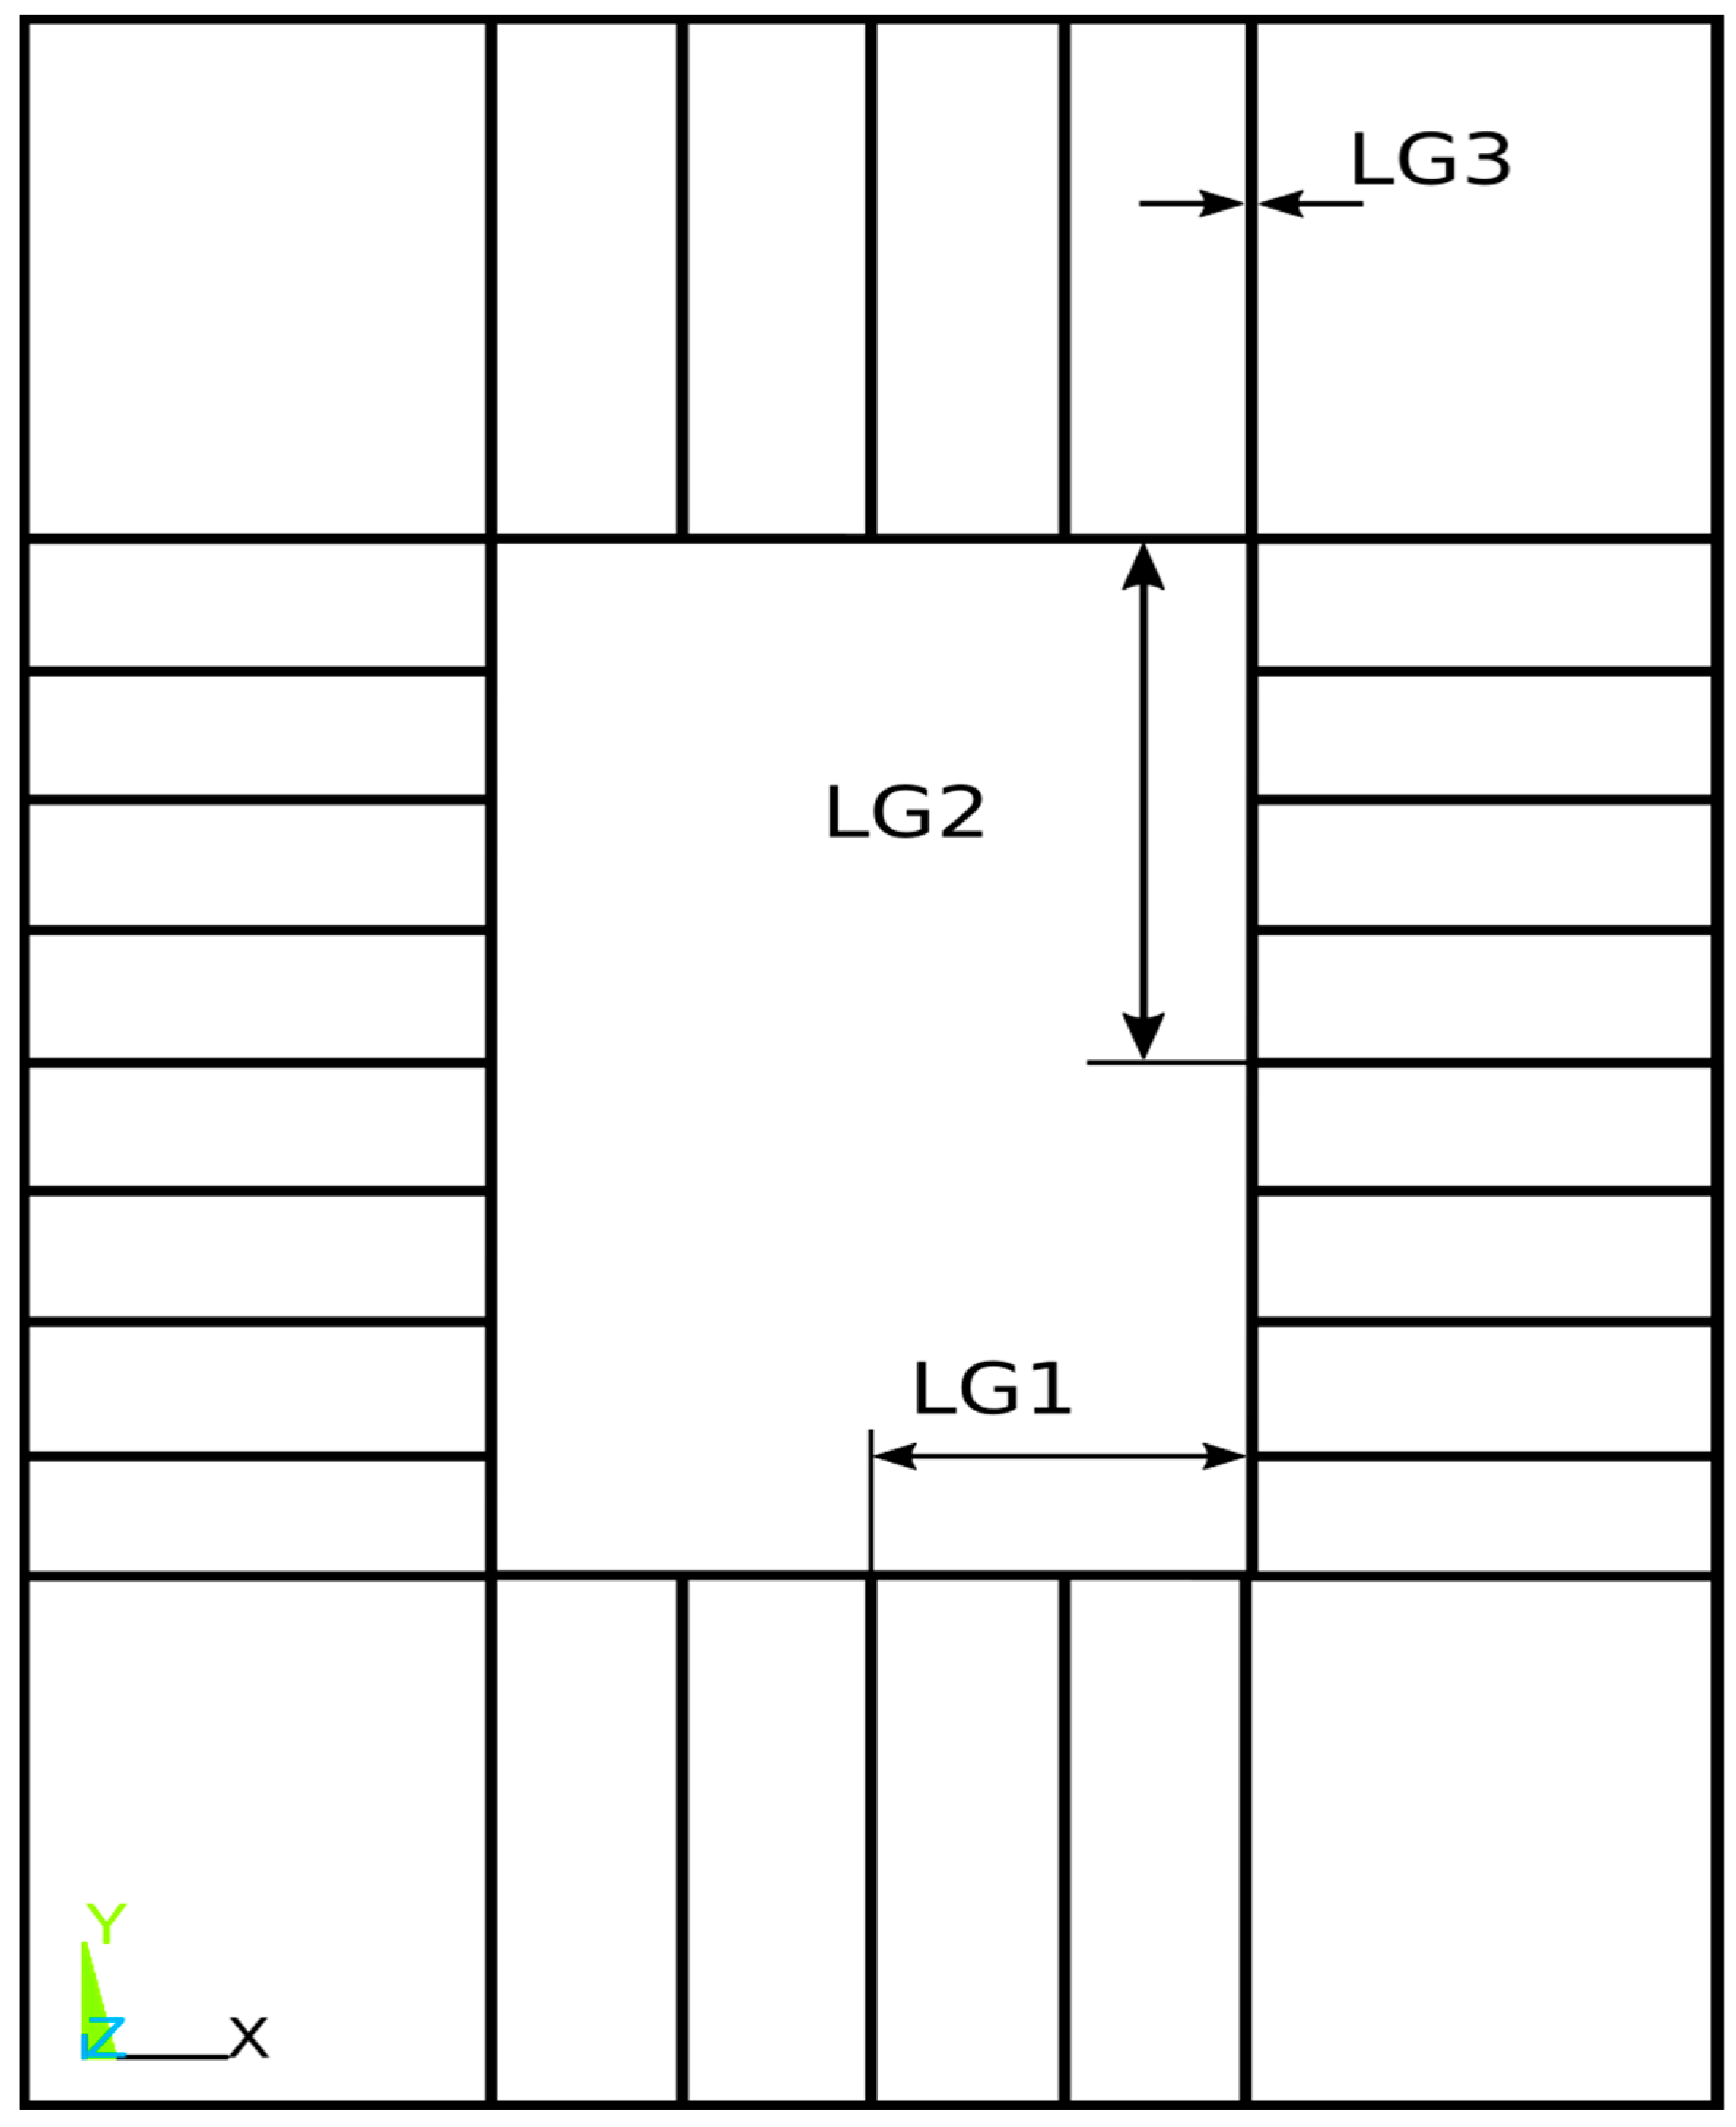
| LG1f [mm] | 48.6 | 18.0 | 18.0 |
| LG2f [mm] | 77.3 | 92.6 | 83.2 |
| LG3f [mm] | 3.74 | 2.79 | 2.63 |
| Final objective | 0.98 | 0.83 | 0.79 |
| Pattern 2 | |||
| LG1f [mm] | 18.0 | 21.7 | 18.0 |
| LG2f [mm] | 101.5 | 76.1 | 119.0 |
| LG3f [mm] | 2.79 | 2.99 | 2.65 |
| Final objective | 0.87 | 0.89 | 0.81 |
| Bending | A1 | A2 | A3 |
|---|---|---|---|
| Pattern 3 | |||
| LG1f [mm] | 45.0 | 21.7 | 18 |
| LG2f [mm] | 75.1 | 90.2 | 95.2 |
| LG3f [mm] | 3.61 | 2.76 | 2.58 |
| Final objective | 0.97 | 0.86 | 0.8 |
| Pattern 4 | |||
| LG1f [mm] | 18.0 | 21.7 | 18.0 |
| LG2f [mm] | 80.5 | 77.0 | 83.6 |
| LG3f [mm] | 2.75 | 3.55 | 2.76 |
| Final objective | 0.80 | 0.85 | 0.77 |
Disclaimer/Publisher’s Note: The statements, opinions and data contained in all publications are solely those of the individual author(s) and contributor(s) and not of MDPI and/or the editor(s). MDPI and/or the editor(s) disclaim responsibility for any injury to people or property resulting from any ideas, methods, instructions or products referred to in the content. |
© 2025 by the authors. Licensee MDPI, Basel, Switzerland. This article is an open access article distributed under the terms and conditions of the Creative Commons Attribution (CC BY) license (https://creativecommons.org/licenses/by/4.0/).
Share and Cite
Silva, H.M.; Vasques, C.M.A.; Wojewoda, J. Strength Behavior of Internally Reinforced Beams Subjected to Structural Optimization Under Simple Bending Loading. Eng. Proc. 2025, 87, 23. https://doi.org/10.3390/engproc2025087023
Silva HM, Vasques CMA, Wojewoda J. Strength Behavior of Internally Reinforced Beams Subjected to Structural Optimization Under Simple Bending Loading. Engineering Proceedings. 2025; 87(1):23. https://doi.org/10.3390/engproc2025087023
Chicago/Turabian StyleSilva, Hugo Miguel, César M. A. Vasques, and Jerzy Wojewoda. 2025. "Strength Behavior of Internally Reinforced Beams Subjected to Structural Optimization Under Simple Bending Loading" Engineering Proceedings 87, no. 1: 23. https://doi.org/10.3390/engproc2025087023
APA StyleSilva, H. M., Vasques, C. M. A., & Wojewoda, J. (2025). Strength Behavior of Internally Reinforced Beams Subjected to Structural Optimization Under Simple Bending Loading. Engineering Proceedings, 87(1), 23. https://doi.org/10.3390/engproc2025087023