Article

A Combined Approach of Remote Sensing, GIS, and Social Media to Create and Disseminate Bushfire Warning Contents to Rural Australia

1
School of Civil Engineering, Surveying and The International Centre for Applied Climate Science (ICACS), University of Southern Queensland, West Street, Toowoomba 4350, QLD, Australia
2
Centre for Environmental Remote Sensing (CEReS), Chiba University, 1-33 Yayoi-cho, Inage City 263-8522, Japan
3
Envi Forecasting Co., No. 6, Carrow Street, North Kelyville 2155, NSW, Australia
*
Author to whom correspondence should be addressed.
Earth 2021, 2(4), 715-730; https://doi.org/10.3390/earth2040042
Submission received: 30 July 2021 / Revised: 10 September 2021 / Accepted: 19 September 2021 / Published: 6 October 2021

Abstract

:
Bushfires are an integral part of the forest regeneration cycle in Australia. However, from the perspective of a natural disaster, the impact of bushfires on human settlements and the environment is massive. In Australia, bushfires are the most disastrous natural hazards. According to the records of the Parliament of Australia, the recent catastrophic bushfires in NSW and Victoria burnt out over 10 million hectares of land, a figure more significant than any previous bushfire damage on record. After the deadly 2009 Black Saturday bushfires, which killed 173 people in Victoria, public attention to bushfires reached a new peak. Due to the disastrous consequences of bushfires, scientists have explored various methods to mitigate or even avoid bushfire damage, including the use of bushfire alerts. The present study adds satellite imagery and GIS-based semi-real-time bushfire contents to various bushfire warnings issued by government authorities. The new product will disseminate graphical bushfire contents to rural Australians through social media, using Google Maps. This low-cost Media GIS content can be delivered through highly popular smartphone networks in Australia through social media (Facebook and Twitter). We expect its success to encourage people to participate in disaster mitigation efforts as contributors in a participatory GIS network. This paper presents a case study to demonstrate the production process and the quality of media GIS content and further discusses the potential of using social media through the mobile network of Australia while paying attention to mobile blackspots. Media GIS content has the potential to link with the public information systems of local fire management services, disseminate contents through a mobile app, and develop into a fully automated media GIS content system to expand the service beyond bushfires.

1. Introduction

Bushfires (a local term for forest fires) have been an integral part of the dynamics in the Australian environment for all its known history. Australian natural ecosystems have evolved with fire, and the landscape, along with its biological diversity, has been shaped by bushfires [1]. Some Australian flora and fauna have evolved to coexist with bushfires, and in eucalypt forests, fire functions as a vital part of the regeneration cycle of the vegetation. The Australian climate is predominantly hot, dry, and prone to drought. In the country’s southeast, strong winds often associated with summertime cold fronts can lead to very high fire danger. According to the Australian Bureau of meteorology, vast areas of Australia suffer from bushfire threats [2]. These bushfires have become a critical phenomenon as part of Australian natural hazards. According to the records, from 1967 to 2013, major Australian bushfires resulted in over 8000 injuries and 433 deaths. Figure 1 shows the number of fatalities caused by major fires in Australia between 1926 and 2019/2020 [3,4]. During 1976–2013, bushfires caused approximately AUS 4.7 billion (excluding most indirect losses) in damages [1]. Public attention to bushfire disasters reached a new peak after the deadly Black Saturday bushfire in Victoria in 2009. The Black Saturday disaster killed 173 people (Figure 1), injured 500 more, and caused over AUS 2.5 billion in damages while destroying over 2000 homes [5,6].
Bushfires in Australia often start when dry winds blow from central Australia toward the coastal areas where forests are located. Most of these fires occur in the hot summer months of January and February [3]. Eucalypt varieties in Australian forests are especially prone to fire due to the highly flammable oil in their leaves. The increasing trend of higher than the average annual temperature in Australia indicates the possible adverse impact of the temperature to cause more bushfires [7]. However, the dry winds and the increasing temperatures are not the only cause of bushfires. According to the Australian Institute of Criminology data, in 2008, 13% of bushfire incidents were caused by deliberate actions, while 37% were suspicious.
The geographic orientation of some Australian residential areas increases the risk to the residents from bushfires. Over the last 100 years, large cities in Australia have expanded into the surrounding bushland. Moreover, the closer proximity of residential areas to the forest is particularly critical in many isolated rural communities. Most of the forest regions and grasslands in regional Australia are prone to bushfires and there is a positive relationship in the distance from houses to forests and grasslands [8] to fatalities and damage that occur. The CSIRO’s life and loss database analysis of 110 years of deaths in bushfires found that 85% of fatalities were recorded within 100 m of a forest [3]. The closer proximity of houses to bushlands in regional Australia is visible in high-resolution Google Earth images. The impact of this was proven by the increased bushfire damage in the long, disastrous bushfire season of 2019. Figure 2 shows one of the regions severely burnt in the 2019/2020 bushfires in NSW, Australia. The images of the region show that Nymboida is fully surrounded by the forest and that homes are in close proximity to the bush. About 80 homes were destroyed in the hamlet of Nymbodia, 700 km northeast of Sydney, by the 2019/2020 bushfire [9]. The latest Google Earth image shows the burnt-out forest in brown.
According to an Australian government report, about 1.7 million people in 25 local government areas live in high-risk residential areas, and Logan and Sunshine Coast in Queensland top the list.
To mitigate bushfires, Australia has a wide range of activities. All state governments have local fire risk mitigation programs; for example, the NSW fire service is well established and uses social media to deliver information [10]. Government authorities are engaged in robust field operations in every bushfire event, and electronic and print media cover fire events and disaster mitigation efforts. However, the present study investigated the information available in bushfire warning systems and found a lack of real-time satellite imagery in use. To fill the information gap, this study presents media GIS contents based on remote sensing and GIS and delivered in near-real-time to support rural communities. The meaning of “near-real-time” comes from the near-real-time satellite image availability from the MODIS (Moderate-resolution Imaging Spectroradiometer) system, which is the primary source for media content we produced. The term semi-real time used in this study can be defined as the time gap between acquiring daily satellite images to release the content to media, which is 1–2 days. To locate bushfire hotspots, the NASA FISMS database, which updates in real-time, phase is used. The time to produce the media GIS content adds to the process, but the prospects of this study suggest an automated data processing step. The methodology, case study, and discussion sections explain how to implement the proposed approach to support fire mitigation in rural Australia. The goal in this project is for Media GIS contents to be shared through social media with rural communities and to attract their participation in bushfire mitigation efforts. Media GIS contents will guide them to understand the nature and developments of the fire and directions of the smoke and other relevant information such as nearby towns where possible rescue and service facilities may available, the extent of forest cover, and proximity to high-risk areas. The content provides the direct link to access Google Maps. The GIS analysis of the process is based on available government information, fire warning, satellite data, Google Earth images, geographic (elevation, road network, etc.) and social (rescue centres, hospitals, etc.) information.
The present study has two research objectives to address the information gap in bushfire warning contents, 1. introduce a unique method to produce “bushfire Media GIS contents” using semi-real time MODIS satellite imagery and GIS, 2. disseminate those contents to rural Australians to provide visually appealing bushfire information for familiarising status of the bushfire based on satellite data among rural communities. Media GIS can be counted as a sub-section of GIS that produces scientifically accurate spatial content while optimising data visualisation standards. The present system should be treated as supplementary graphic content for rural communities to follow bushfire development in satellite data, supported with GIS information. Other objectives of the study are, linking rural communities through social media to promote participatory GIS (PGIS) to attract community participation for mitigation efforts, and educating the public about how semi-real-time satellite data are used in bushfire monitoring.

2. Data and Methods

Australia has various programs at the federal and state levels to combat bushfire disasters [1,11,12]. This research aims to provide the latest bushfire information in graphically appealing spatial contents through social media to the people in bushfire risk areas. User groups can be formed when the bushfire media contents reach people in areas of great risk to encourage broader participation in exchanging local bushfire information. The schematic presentation of the media content production process is presented in Figure 3. Four primary data types are required to produce Media GIS contents, i.e., MODIS satellite data, Google Earth, open-source GIS data, and other GIS data. Section 2.1 explains how MODIS data are applied in bushfire contents. MODIS imagery combined with Google Earth images and applicability of open source and other GIS data is discussed in Section 2.2 and Section 2.3.

2.1. NASA Active Fire Data in Bushfire Monitoring

MODIS sensors mounted on Terra and Aqua satellites delivering satellite imagery are useful for a range of applications, including forest fire monitoring and damage assessments [13,14,15,16,17,18]. Terra MODIS and Aqua MODIS monitor the entire Earth’s surface every 1 to 2 days, acquiring data in 36 spectral bands [19]. NASA provides global scale real-time active fire data for earth surface fire monitoring using three beneficial data formats: Shapefiles, KML, and Text file. NASA also offers active fire information through VIIRS (Visible Infrared Imaging Radiometer Suite) data [20,21].
The data from NASA’s Visible Infrared Imaging Radiometer Suite (VIIRS) are used to measure cloud and aerosol properties, ocean colour, sea and land surface temperature, ice motion and temperature, fires, and Earth’s albedo [21]. Figure 4 is compiled with NASA’s FIRMS (Fire Information and Resource Management Service) data from Sept to Dec 2019 with Google Earth images. FIRMS is one of the most reliable fire spot data products NASA published globally, including GPS reading of the fire and probability percentage of correct identification of fire.
To perform fire detection, NASA examines each pixel of the MODIS swath and ultimately assigns it to each of the following classes: missing data, cloud, water, non-fire, fire, or unknown. The confidence value was added to help users gauge the quality of individual fire pixels included in the Level 2 fire product. However, the confidence level of fire spot identification varies in meaning in different parts of the world. According to NASA, the end-users have found such fire spots useful after excluding false fire occurrences. For MODIS, the confidence value ranges from 0% to 100% and can be used to assign one of the three fire classes (low-confidence fire, nominal-confidence fire, or high-confidence fire) to all fire pixels within the fire mask. The likelihood of detecting a fire under the tree canopy is unknown. Users can receive fire email alerts by subscribing to the NASA’s email alerts [22]. The present study has been built on reliable access to NASA’s FIRMS data.

2.2. Method and Standards to Produce Media GIS Contents

A Geographic Information System (GIS) is a computer system that analyses and displays geographically referenced information. It uses data that is attached to a unique location [23]. A GIS’s power comes from combining information in a spatial context to find relationships among used data layers. Media GIS introduced in this report can be considered as a sub-division of GIS. Creation of Media GIS content involves; collect, store, analyse, produce, and distribute the contents of natural disasters and other significant environmental incidents. The Media GIS content production has to optimise six basic standards: accuracy, high esthetic quality, speed, low cost, reusability [24] and encouragement of user participation. To maintain these standards, the content maker must know GIS, remote sensing, graphics, and multimedia portals. The web-based data visualisation methods regularly improve [25,26], and the content producer must study new technological developments regularly. At the implementation level, the production process can be established by government authorities or through volunteer participation. The media content and image/GIS data layers must be archived under the topic, geographic region, and date (metadata) of bushfire content production. The production standards are explained in the following sections.

2.2.1. Accuracy of the Contents

Geometrically rectified MODIS imagery is acquired from NASA’s worldview [27] site together with the respective KML (Keyhole Markup Language) file. KML is the data format used by Google Earth Pro and Google Maps [28]. The KML files open in Google Earth to extract finer image data from smoke-free areas, together with GIS data and to link the bushfire content with google maps. The geographical accuracy of the content is set to WGS84 datum, which is standard for Google Earth and MODIS products. The accuracy of the bushfire contents depends on the content creator’s knowledge in GIS, satellite image interpretation and computer graphics.

2.2.2. High Aesthetic Quality in Media GIS

Presenting landscapes in graphic content influences people’s acts and behaviour in the landscape environment [29]. The landscape is a complicated concept, but it can be defined as the appearance of land and water from a certain distance [30]. Visualisation and complexity had received extensive scientific attention since early 2000 [31], when complex satellite images and GIS data started to merge. Visualising the complexity in the landscape while maximising the presentation accuracy and content delivery speed is a challenge. The use of colours (hue), fonts (type, size, colour, and orientation), and symbols in Media GIS contents must be carefully selected to optimise the authentic quality. Graphics should be produced in full-colour TIF (Tag Image File Format) and end products in JPG (Joint Photographic Experts Group). MODIS offers a spatial resolution of 250 m × 250 m pixels in its Natural Colour image [27]. MODIS KMZ formatted data has been used to extract super-resolution images from google earth to carry out image sharpening (Figure 5).

2.2.3. Production Speed

The data mining, GIS data generation, and graphic production efficiency optimise the speed of content production. To undertake these tasks, some skills in GIS (ArcGIS, QGIS) and graphics (Photoshop) software and Google Earth are necessary. Knowledge about natural disasters and local conditions is also useful. Building an automated process to extract MODIS images and setting the primary graphic product facilitate an increase in the production speed.

2.2.4. Cost-Effectiveness

The primary data sources that should be freely accessible are MODIS satellite data, Google Earth, and open-source Geographic data. There are free computer graphic packages such as GIMP or Pixar with cognitive capabilities. QGIS (Quantum GIS) is a free alternative for ArcGIS for GIS operations. The cost for Photoshop is relatively small compared to its excellent functionality. A CS version of Photoshop is around AU$350 (2021). The case study in this project used MODIS (250m spatial resolution) satellite data, Google Earth, QGIS, and Photoshop CS3. Data processing was conducted on windows 64-bit desktop PC, which has 8GB internal memory. The cost for the content production was negligible if the time factor was excluded.

2.2.5. Encourage User Participation (PGIS)

Promotion of the participation of the local community in bushfire mitigation in the future is the target of Media GIS content. Figure 3 shows the expected establishment of PGIS through disseminating media GIS content among people in the affected area. The case study content and a Twitter of a parallel bushfire study was posted on Facebook (FB) and the response of people was positive. Media GIS content must be popular on social media to attract more local people. The present report describes the value and production methodology of media GIS contents and the content of the case study. It is expected that a user group will be established after a mobile app is developed to bring content to users. The satellite image and GIS based media GIS content production process is explained for the user to follow the methodology straightforwardly.
Figure 3 shows How the content production flow links with the PGIS flow. PGIS is a collective term that describes the community application of a diverse range of geographic information technologies and systems [32]. PGIS can be used to fill the communication gaps for affected people, rescue operations, and policymakers. It uses digital maps, satellite imagery, sketch maps, and other items to help with involvement and awareness on a local level [33]. In this study, Media GIS contents aim to engage with the affected rural communities in bushfire disasters through PGIS to widen awareness on a local level. The involvement of the local community is an integral part of the research objectives since the overall aim of the study is to promote the safety of the local community from bushfire disasters. Participation of the local community is the PGIS arm of this project.

2.3. Graphic Production

2.3.1. Geometric Registration

The media GIS content production has several steps, i.e., satellite image and GIS data collection, geometric registration, image sharpening, image analysis, design of the content, and final graphic compilation. The content creation must be done by the Media GIS content producer optimising the usefulness of the content and production speed. Satellite images are collected from the MODIS website [19], using a process that was briefly explained in Section 2.1.
Geometric registration of imagery and GIS data is a fundamental data processing step in any GIS project. However, geometric registration was unnecessary for the present study since all gathered data are in the WGS84 datum.

2.3.2. MODIS Image Fusion with High-Resolution Google Earth Imagery

Image sharpening is an image enhancement technique used to increase the visual quality of low-resolution images. There are two widely used sharpening methods. The first is the spatial filtering approach, which extrapolates edge information from a high spatial resolution panchromatic band at 10 m and adds it to the low spatial resolution narrow spectral bands [34]. The second method is the colour normalising approach, which is based on the ability to separate image hue and brightness components in spectral data [35]. This study used a combined approach to sharpen the low-resolution MODIS image using a very high-resolution Google Image and colour normalising methods. Since the bushfire smoke is visible in near-real-time data, the MODIS image was first enhanced by colour normalisation. Then in Photoshop, only the smoke and clouds free land area in the MODIS image was masked and replaced manually with the high-resolution Google image. Photoshop has tremendous capabilities to improve image quality, and even NASA uses it for various image and photo analysis tasks [36]. A section of the MODIS image before and after sharpening is presented in Figure 5.
The image analysis for the content is based on the objectives of the respective media GIS content. The case study image of this research was analysed by highlighting bushfire smoke and sharpening the rest of the area land cover.

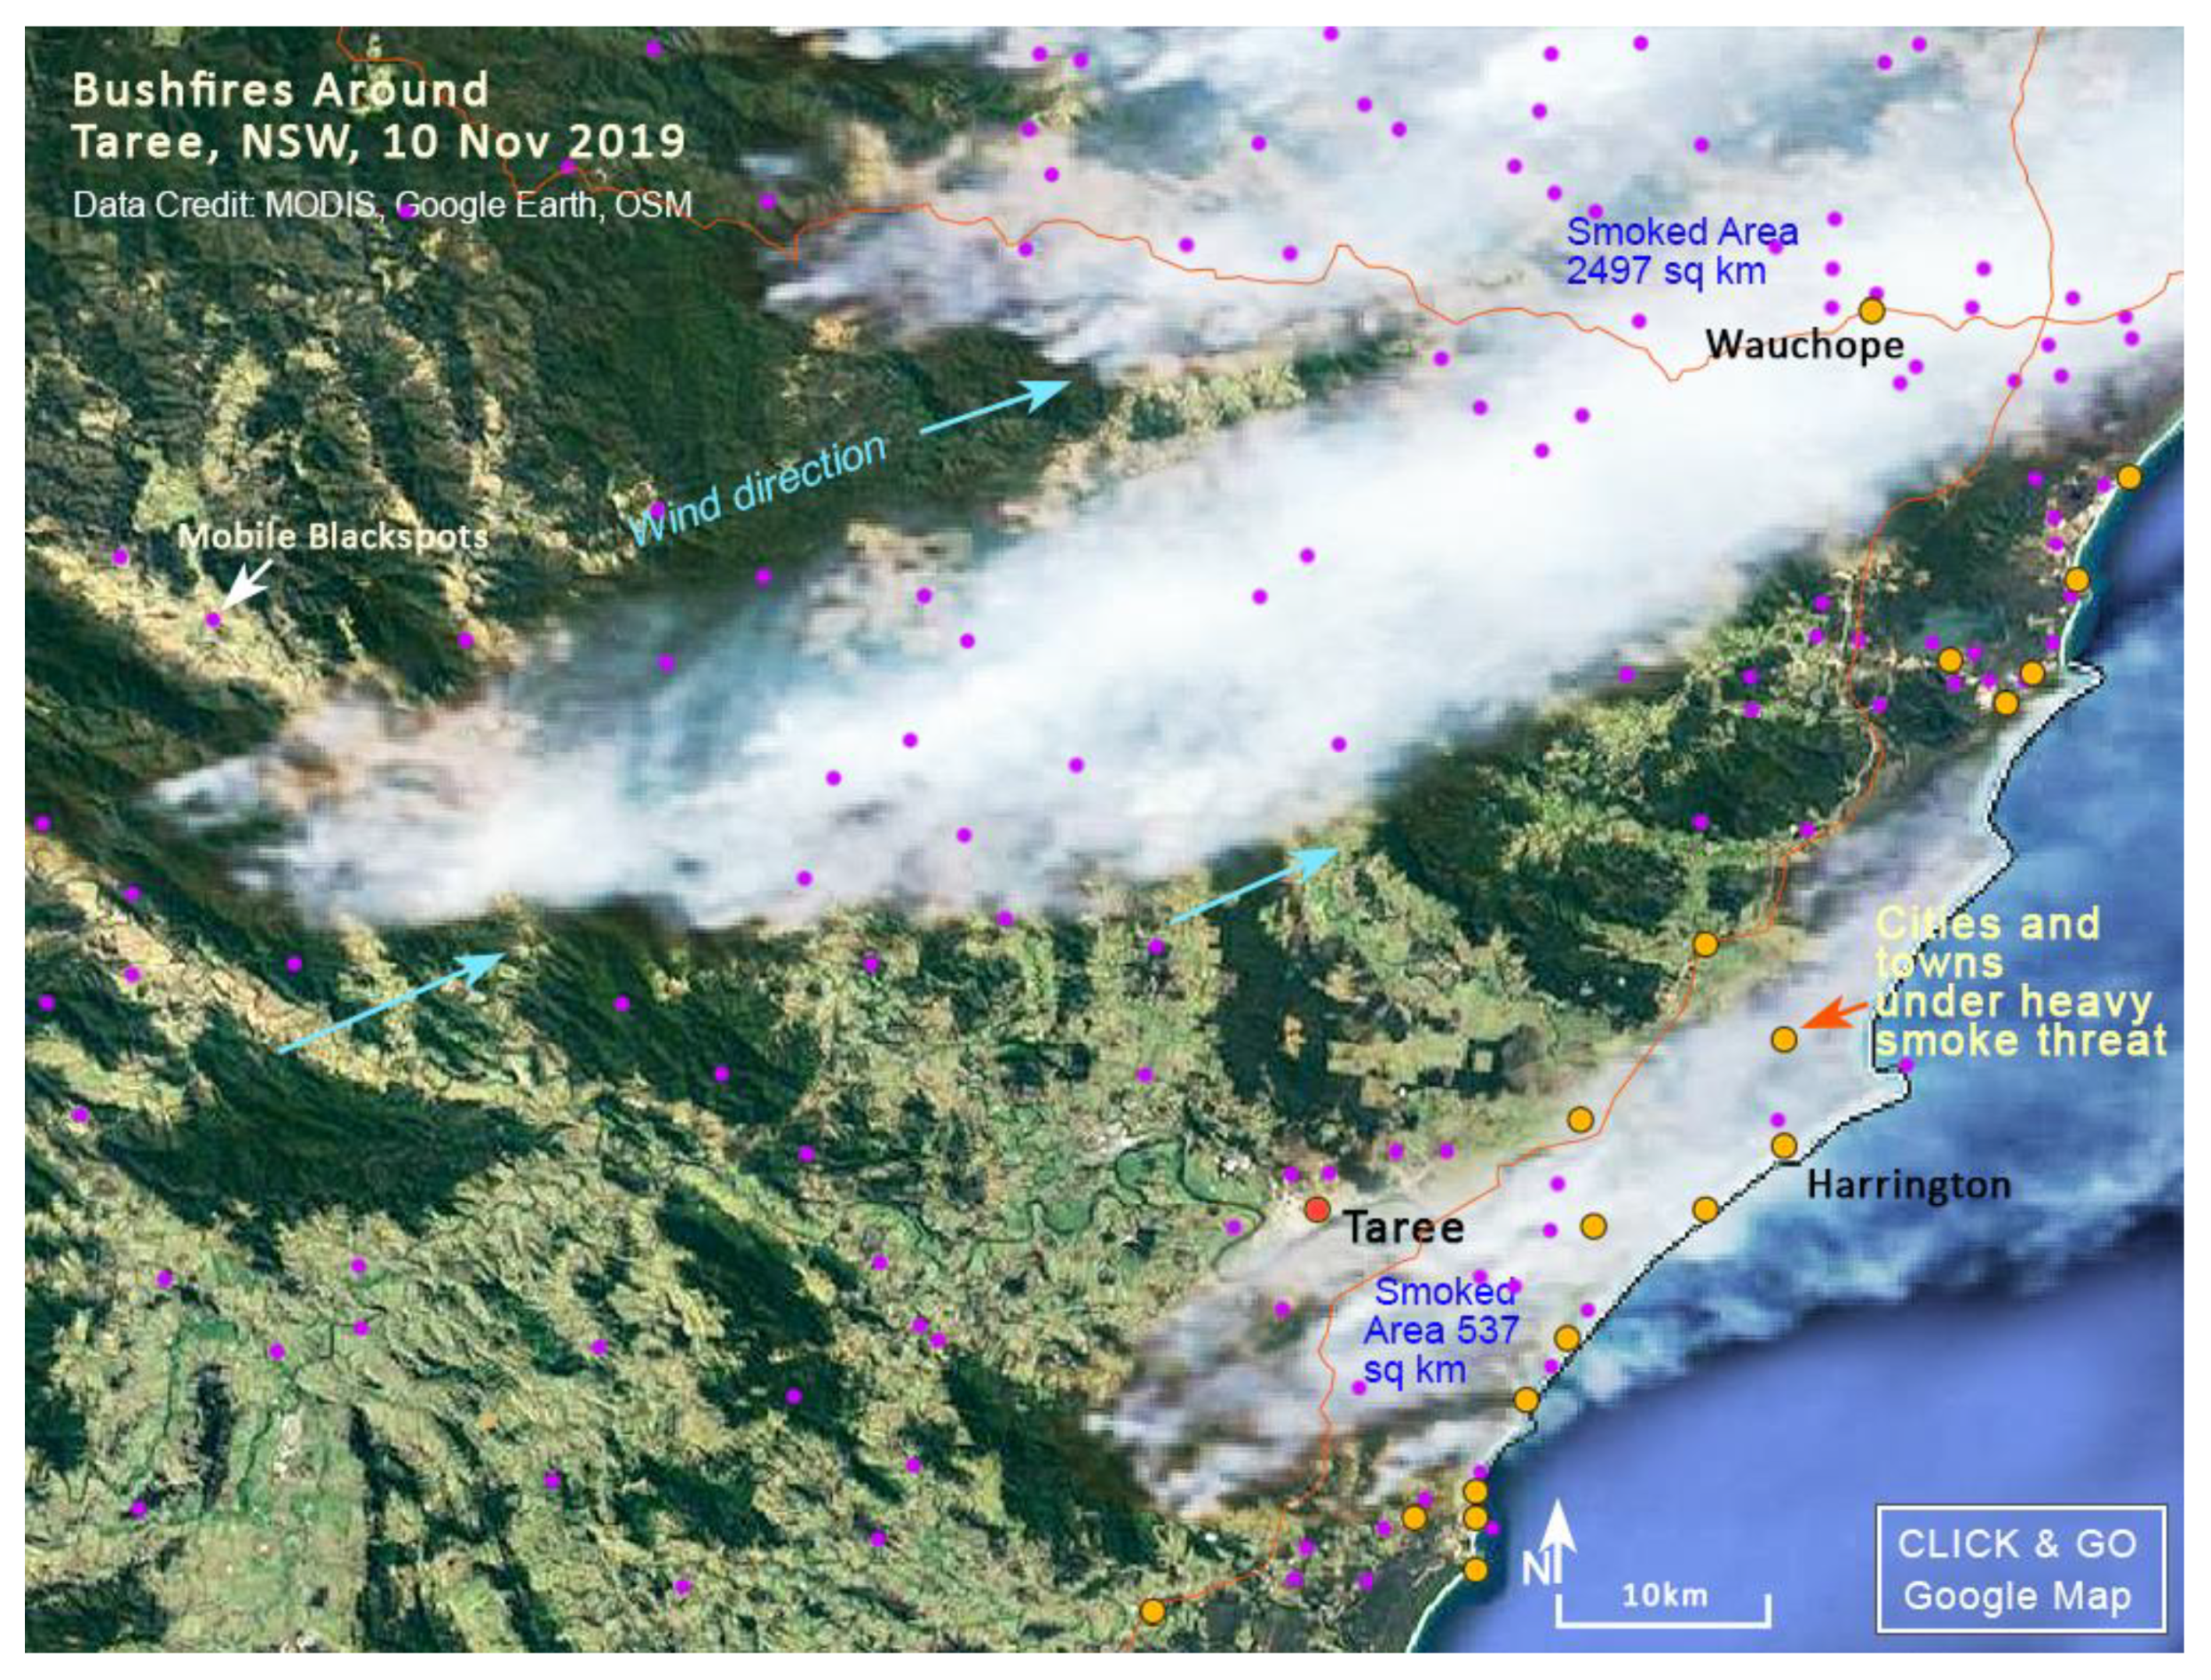
3. The Case Study—New South Wales Bushfire, November 2019

The case study shows the media GIS content of the bushfire incident in NSW, Australia, in late 2019′s summer dry season. The Media GIS graphic contains: enhanced MODIS visual band combination (Figure 6), Google high-resolution image portion to show the forest cover around bushfires, road network and airports (open-source maps), and significant cities/townships. Roads and surrounding cities and towns are marked for the user to identify local areas easily. The graphic was compiled in Photoshop with a size of 640 × 480 pixels. The basic standards to follow to produce Media GIS contents explained in Section 2.3 were applied throughout the process.
Figure 7 presents the completed Media GIS content of the NSW bushfire. The priority of the content is to present the MODIS bushfire image with the high-resolution Google Earth base image. The figure contains cities and towns in the pathway of the bushfire smoke. According to the content creating procedure explained in Section 2, the media GIS content has qualities such as simplicity, geographic accuracy, and authenticity. The user can access the same region in Google Map through the embedded clickable icon (CLICK & GO Google Map). The access from media GIS content to Google Map works using an iframe, which can be customised to match the smartphone interface.
The MODIS image was sharpened with Google Earth’s super-resolution image to produce perhaps the most detailed landscape information available as semi-real-time bushfire content. Wind direction is given, and possible affected cities and towns are marked. The user can click on the “CLICK & CO GOOGLE MAP” to directly access the content of the google map since the graphic content is embedded into a web page with an ifram to google map.

4. Publishing Media GIS Contents on Social Media

4.1. Status of Social Media in Australia

In media GIS content production, fire-spots and the direction of smoke will show with a combination of other relevant information such as nearby towns, the extent of forest cover, and where mobile blackspots are located. Detailed local information can be accessed through the link to Google Maps. The GIS analysis will be based on available government information such as weather forecasts, fire warning for local regions, any super-resolution satellite data, Google Earth, geographic data (elevation, slope) and other social media information (roads, hospitals). The depth of the information included in media GIS content depends on the data availability and the objectives of the content producer. The Media GIS contents deliver to rural communities to attain two objectives. One is to provide graphic bushfire warnings enriched with semi-realtime satellite data. The other objective is to attract the participation of local people to input information to the warning system and exchange ground conditions with fellow community residents. The participation of rural communities can be linked through already well-established electronic communication facilities in Australian society. Once a method is established to connect local communities, positive feedback from people can be assumed to support bushfire mitigation efforts.
When considering the recent developments and the flexibility in handling information technology, the Internet, including social media, is becoming an integral part of the daily life of Australia. The country’s population on 28 July 2021 [37], was 25,815,741 by and about 10.8% of this population was in rural areas. According to the Australian Bureau of Statistics, as of 30 June 2018, there were approximately 27.0 million mobile handset subscribers in Australia, an increase of 1.1% since December 2017. International market and consumer data providers such as Statista published smartphone penetration data, and Australia’s figure was 79.6% in 2020, while the US it was 81.6% and in Germany it was 77.9% [38]. According to another market survey, by 2020, 92% of Australians owned smartphones [39]. Therefore, FB is becoming a valuable social media to deliver disaster information and attract attention from local communities. In Australia, there are 16 million FB accounts and 5.3 million Twitter accounts active in 2021. There were 18.00 million social media users in Australia as of January 2021. The number of mobile social media users has increased by +4.3% within the last ten months, and data indicate 1 in every 3 min online is spent on social media in Australia [40], making social media use in portable devices in Australia an ideal platform to deliver bushfire media contents.

4.2. A Significant Barrier for Bushfire Content Delivery

Even regular internet communication may be disturbed or terminated; modern WiFi technology can establish mobile WiFi hotspots to maintain communication. Technically, this activity starts with tethering or phone-as-modem, connecting PC’s internet connection with other devices. People can connect through WiFi hotspots and participate in PGIS to support bushfire mitigation efforts in a disaster situation. However, Australia’s rich electronic media environment has some concerns about signal transfer to mobile and internet users. The Department of Communications and the Arts collects nominations of regional locations with poor or no mobile coverage from public members, State, Territory and Local Governments and Members of Parliament [41]. In Figure 8, these mobile black spot data are combined with bushfire affected regions in Figure 7. The distribution of mobile blackspots shows, despite the large rural population who use FB and Twitter and are keen on environmental disasters may face difficulties in accessing the bushfire contents due to signal dropping at various spots in the disaster zone.
It is hard to make residential areas visible below the smoke; however, smoke-free areas show the land cover clearly. Figure 9 presents a large-scale media content around Taree, NSW, to demonstrate the capability of media GIS contents to variable the scale according to the presentation objectives. However, the close-up media-GIS content is still not showing the micr0-level ground information since the sky is mostly covered by smoke from the bushfire. Mobile blackspots are gradually diminishing according to the expansion of new mobile base stations. In mid-2021, the Australian government established 67 new mobile base stations (15 Field Solutions Group, 4 Optus and 48 Telstra) which will address coverage issues across regional and remote Australia, including in bushfire-prone areas and along major highways [41].

5. Discussion

The Australian authorities and local residents are taking various measures to combat one of the worst natural disasters in Australia, bushfires. Apart from direct engagements with fires, altering the natural environment to reduce the fire hazard is another action considered by authorities as mentioned in a study; “Because fuel reduction burning is the only feasible means of fuel reduction on a landscape scale, it is widely used throughout Australia” [42]. The knowledge about the fire-resisting vegetation conditions by Australian indigenous people and non-indigenous research communities has been widely applied for fire mitigation activities throughout the country. However, when bushfires occur, the direct impact on local communities, fauna, and flora is massive. Therefore, the collective participation of all related people in bushfire mitigation is timely important. Australian fire prevention agencies and NASA make available various bushfire related data sources for the public. In this background, the involvement of rural communities in bushfire mitigation is crucial. However, the flow of information to these communities is not smooth because of a variety of technical and social reasons. “I could see the real value of us educating the locals,” said Glenn O’Rourke, Deputy Captain and Community Safety Officer at the Wollombi Rural Fire Brigade [43] in NSW.
Media GIS contents we introduced in this study can be promoted as a useful information source for rural communities in bushfire-prone regions. From the content production point of view, media GIS content is a combined product of web GIS and near-real time satellite data based content. The user views the latest bushfire image in the content with some related information such as wind direction, and the area covered by smoke in sq km. Then, for detailed local infrastructure information, the user can access Google Map through a web map interface set by an iframe link. The overall production process was introduced to develop the content at least cost and with easy-to-understand methodology for interested users to participate. As explained in Section 3 and Section 4, the production cost is minimal for the media GIS content, while the accuracy is set to the global standard WGS84 datum. Near-real-time spatial data-based bushfire contents and updates can be disseminated through local newspapers, TV, and social media, encouraging participatory user cohort and online forums to discuss the ongoing bushfires. The daily updates of NASA MODIS fire products, user-friendly Google Earth functions such as placemarks, and open source GIS data, provide opportunities for interested participants to input information into image maps directly. Bushfire contents contain direct links to open Google Maps, which helps the user to explore local geography in detail. Similarly, it is possible to cloud clickable image links to fire warnings of state authorities and weather forecasts. Future research prospects of a mobile app can be developed for users to provide a greater convenience to navigate through media GIS content and participate in disaster mitigation actions by contributing local information. By establishing a PGIS network, individuals and groups in disaster affected communities can participate in bushfire information exchange.
The media GIS content carries the latest map and quantitative information (e.g., the approximate area affected by smoke in Figure 9) extracted through the MODIS satellite data analysis, providing additional spatial information on bushfires. An experimental level display of bushfire content produced in a parallel study was published in FB and Twitter. During the trial period of May 2018 to June 2019, FB reached 896 people, and during May–June 2019, Twitter recorded 644 impressions [44]. Participatory comments on the respective bushfire hazard can be expected when regularly publishing the content in electronic media, including FB and Twitter. To build an effective service, the content producer should establish a system to collect responses and update the content regularly.
PGIS inputs from local people can enrich the bushfire GIS database to improve the strength of Media GIS contents. Editable image maps can be developed for the users to add local information and convert Media GIS content into valuable and practical products. The next stage of this study will discuss how to link with PGIS information, coordinate with local bushfire warnings, and existing fire services. The overall process aims to educate rural communities in semi-real time use of satellite images and geographic data to promote PGIS and expand public awareness and involvement in disaster mitigation.

6. Conclusions and Future Research Prospects

MODIS satellite imagery can successfully produce “semi-real-time” Media GIS contents to display most of the natural disasters, especially when the disaster continues for several days and effects large areas. This paper has presented the production process of media GIS contents rich in spatial information taken from MODIS imagery sharpened with Google Earth super-resolution images and other GIS data. The inclusion of a link within the media content map to access google map enables the user to check all available map information at street level. The advantage of media GIS contents is the inclusion of the latest conditions extracted from MODIS on a semi-real time basis. Production of Media GIS needs maximisation of several standards, i.e., high aesthetic quality, geographic accuracy, and production speed. In this research, Media GIS content on bushfires are introduced to increase the awareness of bushfire information captured by satellite images for rural communities. The production process involves the background of remote sensing, GIS, digital mapping, computer graphics, and electronic media.
When the bushfire media content provides valuable semi-real time map-based information in a graphically attractive and geographically accurate manner, a response from people in the affected area (PGIS) can be expected for fire mitigation efforts. Residents in local communities interested in environmental disasters can be targeted as the primary group of residents to participate in disaster mitigation efforts by exchanging local information. The well-established electronic media platform in Australia will ensure the success of media GIS content delivery and will assist in establishing local community participation.
Apart from some forest regions with no or poor internet connection, most populated localities are connected by the Internet [45] in Australia. If landline communication is disrupted in a critical bushfire disaster situation, WiFi technology can establish mobile WiFi hotspots to maintain the network communication. In a crucial situation, people can connect through WiFi hotspots and participate in PGIS to support bushfire mitigation efforts. However, when bushfire content is disseminated through electronic social media, the signal access capacity to mobile phones depends on the density of the local mobile antenna network and the distribution of mobile blackspots. The distribution of mobile blackspots could be one of the major obstacles for bushfire content delivery when people need internet access in remote areas. Future research directions will comprise two paths: improving the qualitative aspect of media content and applying the same methodology to produce content for other natural disasters such as floods and droughts in Australia. Adding a PGIS request into the bushfire GIS content and developing a mobile app will help improve the qualitative aspect of bushfire media content. Establishing content user groups and linking content with government disaster mitigation networks are other essential actions to increase the use of semi-real-time media GIS content.

Author Contributions

Conceptualization, K.P. and R.T.; methodology, K.P.; software, K.P.; formal analysis, K.P.; investigation, K.P.; data curation, K.P. and S.H.; writing—original draft preparation, K.P.; writing—review and editing, K.P. and S.H.; visualization, K.P.; supervision, R.T. and K.A. All authors have read and agreed to the published version of the manuscript.

Funding

This research received no external funding.

Institutional Review Board Statement

Not applicable.

Informed Consent Statement

Not applicable.

Acknowledgments

Authors are thankful to CEReS, Chiba University, Japan, for institutional support (CI15-103) under CEReS Overseas Joint Research Program, 2015.

Conflicts of Interest

The authors declare no conflict of interest.

References

  1. Geoscience Australia, 2019, Bushfires. Available online: https://www.ga.gov.au/scientific-topics/community-safety/bushfire (accessed on 5 November 2020).
  2. BOM (Bureau of Meteorology), Bushfire Weather. 2009. Available online: https://www.bom.gov.au/weather-services/bushfire/about-bushfire-weather.shtml (accessed on 12 July 2021).
  3. CSIRO, 2012, Life and House Loss Database, Description and Analysis, Final Report. Available online: https://www.bushfirecrc.com/sites/default/files/managed/resource/life_house_loss_report_final_0.pdf (accessed on 5 November 2019).
  4. statista.com, 2021, Number of Deaths Due to the Bushfire Season in Australia between October 2019 to February 2020, by State. Available online: https://www.statista.com/statistics/1104739/australia-bushfire-human-fatalities-by-state/ (accessed on 22 August 2021).
  5. Australian Institute of Criminology, 2008, Proportion of Deliberate Bushfires in Australia. Available online: https://aic.gov.au/publications/bfab/bfab051 (accessed on 4 August 2021).
  6. Disaster Assist, Victorian bushfires (January to February 2009). 2010. Available online: https://www.disasterassist.gov.au/PreviousDisasters/StateandTerritories/Pages/VIC/Victorianbushfires(JanuaryFebruary2009).aspx (accessed on 29 September 2019).
  7. BOM (Bureau of Meteorology), Annual Climate Statement 2013. 2013. Available online: http://www.bom.gov.au/climate/current/annual/aus/2013/ (accessed on 13 July 2021).
  8. Hannam, P. The Sydney Morning Herald. 2016. Available online: https://www.smh.com.au/environment/the-10-sydney-regions-most-exposed-to-bushfire-risk-20161107-gsk08y.html (accessed on 21 August 2019).
  9. Harris, R. The Sydney Morning Herald. In Devastated Nymboida, Dark Humour Keeps Residents Going; Nine Entertainment Co.: Sydney, NSW, Australia, 2019; Available online: https://www.smh.com.au/politics/federal/in-devastated-nymboida-dark-humour-keeps-residents-going-20191118-p53bft.html (accessed on 23 October 2020).
  10. NSW RFS, 2021, Facebook. Available online: https://www.facebook.com/pg/nswrfs/posts/ (accessed on 8 November 2019).
  11. NSW Rural Fire Service. 2019. Available online: https://www.rfs.nsw.gov.au/plan-and-prepare (accessed on 5 November 2019).
  12. Rural Fire Service, QLD, 2019, Prepare. Act. Survive. Available online: https://www.ruralfire.qld.gov.au/BushFire_Safety/Pages/default.aspx (accessed on 16 October 2019).
  13. Badarinath, K.V.S.; Sharma, A.R.; Kharol, S.K. Forest fire monitoring and burnt area mapping using satellite data: A study over the forest region of Kerala State, India. Int. J. Remote Sens. 2011, 32, 85–102. [Google Scholar] [CrossRef]
  14. CSIRO, 2019, Bushfire Research. Available online: https://www.csiro.au/en/Research/Environment/Extreme-Events/Bushfire/Bushfire-research (accessed on 7 June 2019).
  15. Dutta, R.; Das, A.; Aryal, J. Big data integration shows Australian bushfire frequency is increasing significantly. R. Soc. Open Sci. 2016, 3, 150241. Available online: https://www.ncbi.nlm.nih.gov/pmc/articles/PMC4785963/ (accessed on 24 October 2019). [CrossRef] [PubMed] [Green Version]
  16. Friedl, M.A.; McIver, D.K.; Hodges, J.C.; Zhang, X.Y.; Muchoney, D.; Strahler, A.H.; Woodcock, C.E.; Gopal, S.; Schneider, A.; Cooper, A.; et al. Global land cover mapping from MODIS: Algorithms and early results. Remote Sens. Environ. 2002, 83, 287–302. [Google Scholar] [CrossRef]
  17. Hall, D.K.; Riggs, G.A.; Salomonson, V.V.; DiGirolamo, N.E.; Bayr, K.J. MODISsnow cover products. Remote Sens. Environ. 2002, 83, 181–194. [Google Scholar] [CrossRef] [Green Version]
  18. Zhan, X.; Sohlberg, R.A.; Townshend, J.R.; DiMiceli, C.; Caroll, M.L.; Eastman, J.C.; Hansen, M.C.; DeFries, R.S. Detection of land cover changes using MODIS 250 m data. Remote Sens. Environ. 2002, 83, 336–350. [Google Scholar] [CrossRef]
  19. MODIS Web. 2019. Available online: http://modis.gsfc.nasa.gov/ (accessed on 23 October 2019).
  20. FIRMS, NASA Fire Information Resource Management System. 2018. Available online: https://firms.modaps.eosdis.nasa.gov/map/#z:6;c:151.9,-38.5;t:adv-points;d:2018-09-01..2018-09-27;l:firms_viirs,firms_nrt_modis_a (accessed on 24 October 2019).
  21. Gsfc.NASA, Visible Infrared Imaging Radiometer Suite (VIIRS). 2018. Available online: https://jointmission.gsfc.nasa.gov/VIIRS.html (accessed on 23 October 2019).
  22. Earthdata, NASA. 2019. Available online: https://earthdata.nasa.gov/earth-observation-data/near-real-time/firms/active-fire-data (accessed on 14 October 2020).
  23. USGS, What Is a Geographic Information System (GIS)? 2019. Available online: https://www.usgs.gov/faqs/what-a-geographic-information-system-gis?qt-news_science_products=1#qt-news_science_products (accessed on 12 November 2019).
  24. Perera, K.; Tateishi, R. Semi-real-time media contents on haze hazard in Ganges River Basin. In Proceedings of the 14th CEReS International Symposium of Remote Sensing, Chiba, Japan, 13–14 November 2008. [Google Scholar]
  25. Friedman, V. Data Visualization: Modern Approaches. 2007. Available online: http://www.smashingmagazine.com/2007/08/02/data-visualization-modern-approaches/ (accessed on 14 November 2019).
  26. Ostrow, A. 16 Awesome Data Visualization Tools. 2007. Available online: http://mashable.com/2007/05/15/16-awesome-data-visualization-tools/ (accessed on 12 November 2019).
  27. Worldview, NASA. 2021. Available online: https://worldview.earthdata.nasa.gov/ (accessed on 20 May 2021).
  28. USNA, 2019, KML Overview. Available online: https://www.usna.edu/Users/oceano/pguth/md_help/html/kml_overview.htm (accessed on 20 November 2020).
  29. Tress, B.; Tress, G. Capitalising on multiplicity: A transdisciplinary systems approach to landscape research. Landsc. Urban Plan. 2001, 57, 143–157. [Google Scholar] [CrossRef]
  30. Jahani, A.; Saffariha, M.; Ghiyasi, S. Evaluating the aesthetic quality of the landscape in the environment: A Review of the Concepts and Scientific Developments in the World. IJESB 2019, 12, 35–44. [Google Scholar]
  31. Anal M, 2021, Dimensional Taxonomy of Data Visualization: A Proposal from Communication Sciences Tackling Complexity. Available online: https://www.frontiersin.org/articles/10.3389/frma.2021.643533/full (accessed on 10 August 2021).
  32. IIED (International Institute for Environment and Development), Participatory GIS (Geographic Information Systems). 2015. Available online: http://www.iapad.org/wp-content/uploads/2015/07/EM-Profiles-No-7-Participatory-GIS-6-Oct-09.pdf (accessed on 12 November 2019).
  33. User, A. Participatory GIS. 2012. Available online: http://participationcompass.org/article/show/179 (accessed on 2 May 2019).
  34. Stevens, J. How to Pan-sharpen Landsat Imagery. 2017. Available online: https://earthobservatory.nasa.gov/blogs/earthmatters/2017/06/13/how-to-pan-sharpen-landsat-imagery/ (accessed on 20 October 2010).
  35. NASA Technical Report Server. 2011. Available online: https://ntrs.nasa.gov/search.jsp?R=19850028100 (accessed on 18 July 2019).
  36. The Adobe blog, How Photoshop Helps NASA Reveal the Unseeable. 2015. Available online: https://theblog.adobe.com/how-photoshop-helps-nasa-reveal-the-unseeable/ (accessed on 20 August 2019).
  37. worldometers, 2021, Australia Population. Available online: https://www.worldometers.info/world-population/australia-population/ (accessed on 10 July 2021).
  38. Statista, 2021, Smartphone Penetration Rate as Share of the Population in Australia in 2017 with a Forecast until 2025. Available online: https://www.statista.com/statistics/321477/smartphone-user-penetration-in-australia/ (accessed on 3 July 2021).
  39. Deloitte, 2021, Dive into the Data. Available online: https://www2.deloitte.com/au/en/pages/technology-media-andtelecommunications/articles/digitalconsumertrends.html (accessed on 20 July 2021).
  40. Keats, M. Australian Internet Statistics 2021. Available online: https://prosperitymedia.com.au/australian-internet-statistics/ (accessed on 9 August 2021).
  41. Communications, gov 2021, Mobile Black Spot Program. Available online: https://www.communications.gov.au/what-we-do/phone/mobile-services-and-coverage/mobile-black-spot-program (accessed on 20 May 2021).
  42. Whelan, R.; Kanowski, K.; Gill, M.; Andersen, A. Living in a Land of Fire; article prepared for the 2006 Australia State of the Environment Committee; Department of Environment and Heritage: Canberra, Australia, 2006. Available online: http://www.deh.gov.au/soe/2006/integrative/fire/index.html (accessed on 10 July 2021).
  43. Maddock, N. Smart Strategies for Local Communities. 2015. Available online: http://www.bnhcrc.com.au/news/2015/smart-strategies-local-communities (accessed on 12 February 2020).
  44. Chandra2009. 2019. Available online: https://twitter.com/chandra2009 (accessed on 5 August 2020).
  45. Telstra Coverage Map. 2019. Available online: https://www.telstra.com.au/coverage-networks/our-coverage (accessed on 20 August 2020).
Figure 1. Civilian fatalities due to major bushfire disasters in Australia (data: CSIRO, 2012, statista.com, 2021, accessed on 22 August 2021).
Earth 02 00042 g001
Figure 2. The proximity of houses to the forest in Nymbodia, NSW, is less than 100m. Images show the location of Nymbodia in the forest and the impact of the 2019/2020 fire.
Earth 02 00042 g002
Figure 3. The production process of Media GIS contents and attract rural community for bushfire mitigation through PGIS.
Earth 02 00042 g003
Figure 4. NASA FIRMS data over NSW and Victoria during the heavy bushfire months in 2019 (source: FIRMS, NASA, 2019).
Earth 02 00042 g004
Figure 5. Before (left) and after sharpening (right) the 250 m MODIS image using a high-resolution Google Earth image and several techniques of normalising colours.
Earth 02 00042 g005
Figure 6. The selected original MODIS satellite image of the NSW bushfire shows smoke.
Earth 02 00042 g006
Figure 7. Media GIS content (MODIS image + Google Image + Major roads in yellow + Area information) of NE NSW bushfire, Australia. Names of smoke threatened cities and towns are available in the content text.
Earth 02 00042 g007
Figure 8. The spread of mobile-blackspots (in purple) in bushfire-hit areas. The figure is compiled with MODIS, Google Earth, Open Street Map, and National Mobile Black Spot Database, Australia.
Earth 02 00042 g008
Figure 9. A large-scale bushfire media content represents the region around Taree township, located near the southern border of Figure 7. The user can access local infrastructure information in Google Map through the clickable icon. Purple dots represent mobile blackspots reported in the area.
Earth 02 00042 g009
Publisher’s Note: MDPI stays neutral with regard to jurisdictional claims in published maps and institutional affiliations.

