Abstract
The City of Palma de Mallorca has been historically affected by flood events, with the latest flood of great magnitude occurring in 1962. After decades without large flooding events, since the start of the 21st century, 28 floods have been identified within the city boundaries. As change in the spatial location of these events has been observed, a research to identify where the floods are located nowadays and which causes can be related to such distribution has been undertaken. Six types of floods were identified and the events classified accordingly, with the deficient planned infrastructures, flat urban areas without defined drainage and coastal sectors the three most common types. The results highlight the importance of the urban sprawl and malpractices related to flood risk areas, thus increasing the occurrence of floods of less spatial impact but with greater disturbance on the daily activity of the city inhabitants. Nevertheless, some uncertainties are identified in this research, demonstrating the need of further investigations.
1. Introduction
The complexity of urban environments, with high concentration of population and properties, increases when those areas are affected by natural hazards, such as rainstorms and the resulting floods. Those events are a common feature in the Mediterranean region [1] and the expected increase of such storms [2,3,4] can result in an increase of impacts on cities, which are also expected to rise in terms of population and extension [3,5]. Flooding is the main damaging weather-related disaster around the world. Between 1995 and 2005, floods affected 2.3 billion people and accounted for 47% of all weather-related disasters [6].
Floods affecting urban areas are not new. While historically there were riverine floods, nowadays, urban floods are new, and they can be defined as an event that is caused by the increase of impervious surfaces or the lack of a drainage network which produce runoff processes [7] and cause disturbances on the daily life as well as economic damages. A 1% increase of the impervious cover on a basin can increase the annual flood magnitude by 3.3% [8].
Across Europe, cities have been historically affected by floods as a literature review suggests [9,10,11]. Nowadays, there is still flood impact on urbanized areas, ranging from historically affected cities to new urban spaces. There is a large number of scientific researches studying flood impact in cities as Lisbon [12], Genoa [13,14], Athens [1,15], Savigliano in Italy [16] or Elblag in Poland [17] and in densely urbanized areas such as the south of France [18], central Belgium [19] or the Attica prefecture in Greece [20].
Spain has also experienced an impact in urban spaces. Chronicles and historical references acknowledge the damages of floods on cities in the past [21,22,23,24] while other approaches focus on vulnerability [25,26]. Recent studies focus on the impact of flooding in coastal tourist areas [27,28,29], regional capitals as Salamanca [30] or large conurbations such as Barcelona [31,32] or the Valencia region [33].
Palma de Mallorca is an example of a city affected by historical floods. The 1403 flash flood caused 5000 fatalities, while destroying city bridges and ramparts [34]. Since that event, more than 55 floods have been recorded affecting the city center and its surrounding area [35]. The last main event took place in 1962 when Sa Riera stream overflowed and flooded the central business district, located in the old city center. From 2000 onwards, 28 events have been identified, affecting the municipality, although a changing trend has appeared as the flood’s affectation is located thorough the basin and not only affect the traditional flooding areas, located close to the streams of Palma’s catchments.
Considering this, this research has the following objectives:
- Map the distribution of floods affecting the city of Palma
- Identify and classify the causes of the flood events
In order to develop the research, a methodology of data gathering has been created and a classification of flood types and its spatial location within the urban area has been provided. The results can be a helpful tool to develop protection plans for citizens and infrastructures.
2. Materials and Methods
2.1. Study Area
The City of Palma is the capital of the Balearic Islands and the largest of the archipelago in terms of population and importance. Located in the southwest coast of Mallorca (Figure 1), Palma has a surface of 208.6 km2 and 400,578 inhabitants. The first traces of human presence in the area are from the Roman Empire period and the city shape has been transformed by successive historical epochs. Currently, Palma shows an economical function related to its position as capital of the archipelago and as an important tourist destination. The main result has been an accelerated urban growth that started in the second half of the 20th century and, in turn, has led to an increase of urbanized surfaces, from 5.2 km2 in 1960 to 42.6 km2 in 2013 following a westwards and northwards direction (Figure 2). As an example, the area known as Platja de Palma (Palma’s beach), on the eastern side of the municipality, increased the urban surface from 0.1 km2 in 1956 to 1.007 in 2016, a 953% increase in 50 years [36].
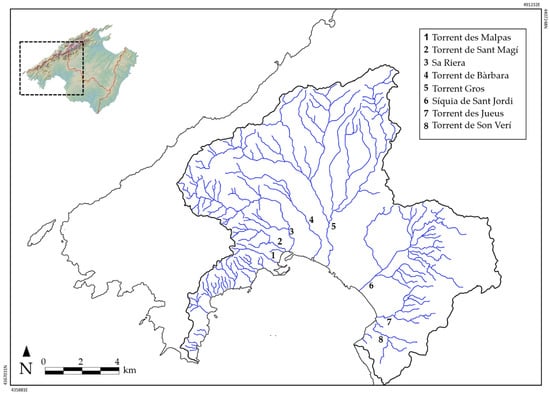
Figure 1.
Location of Palma within the island of Mallorca and its surface water network.
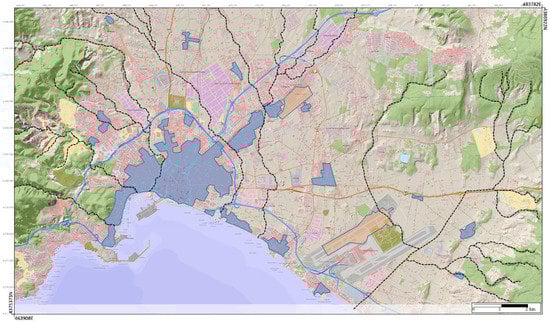
Figure 2.
Urban expansion of Palma. In sky blue the urbanized areas in 1956. Pink shades show the urbanized areas as of 2018 and black dotted line shows the surface stream network of the basin.
Such growth generated inequalities in terms of infrastructures and urban equipment among the city neighborhoods. The lack of control, together with a large period without flooding events across the city, allowed to build new residential and services areas inside flood-prone spaces, even occupying streambeds. A consequence has been the creation of large impervious surfaces, which increases the runoff coefficients and the possible flood peaks.
Furthermore, urbanization has affected the fluvial system of the basin, which is organized with ephemeral streams, locally known as torrents (Table 1). Palma’s basin has a surface area of 521 km2 as it exceeds the municipality limits. It includes eight catchments that end at Palma’s bay (Figure 1) and are distributed as follows.

Table 1.
Characterization of the surface water network in Palma’s basin.
On the western side of the basin the Malpas, Sant Magí and sa Riera streams are located. They are small catchments with low functionality due to the karstic lithology present at the headwaters. Nevertheless, they have high slopes which increase their torrentiality in case extreme rainfall occurs, especially in the area close to the bed mouth. Only sa Riera has a large catchment surface and can present runoff in the headwaters during the rainfall season. The bed was deviated in the 17th century outside the ramparts to avoid the flooding of the city center, but nowadays is again going through the urbanized areas of Palma.
The central area of the basin is occupied by the torrent Gros and Na Bàrbara catchments. They are the largest ones of the basin, both in terms of surface and channel length. During autumn and winter, they can present a continuous runoff in the headwaters. Once inside the urban area, there is a high human influence in terms of cross section shortening, streambed sealing by concrete and channel covering with buildings, roads and infrastructures.
Finally, the eastern side of the basin contains the Siquia de Sant Jordi, Son Verí and Jueus catchments. Their characteristics (low slopes, karstic headwaters and small yearly precipitation totals) make them the less functional waterways of the basin.
Table 1 includes the classification of each stream within a Risk Index, which is used by local and regional authorities to take protective measures in the event that the plan against flooding is activated. The Risk Index value is the result of the qualification of five parameters (catchment surface, number of events between 1930 and 2020, damages caused by past events, current conditions of bed and urbanization extent along the stream). To construct the Index, every parameter has been valued as follows: the catchment surface ranges from 1 (if smaller than 25 km2) to 3 (if larger of 100 km2) and 2 in between. The number of the event’s parameter is rated also between 1 (1 to 3 events) and 3 (more than 7) with 2 assessed to the catchments having between 4 and 7 floods. The damages values range from 1 (small floods affecting houses and communication networks) to 2 (affected infrastructures) and finally 3, when floodwaters destroy buildings, bridges and other infrastructures. The current bed conditions parameter is related to the channelization of the stream. A value of 1 means correctly maintained bed, while 2 is related to partially inadequate bed width and high, 3 means an inadequate bed channel and 4 is when the bed is covered or became a street. Finally, the urbanization degree varies again between 1 (small urbanized areas along the streambed) to 3 (complete urbanization along the streambed) with 2 being those streams with heavy urbanization along its banks.
All the parameters have been quantified and statistically normalized as the main risk factors, the urbanization along the stream and the bed current conditions (covered by streets, low walls, reduced section) are valued twice. The final numerical values range from 0 to 10, where 0 would be a catchment without risk and 10 the maximum level of risk. The numbers are then converted into values ranging from low to very high risk.
Table 2 shows the 20th century flood events that have affected Palma’s basin. The latest large flood event occurred in 1962, when all the streams overflowed their banks, affecting the city and its surrounding area. A large flood is an event in which the flood waters cause important damages in public and private infrastructures, sweeping along cars and goods and supposing a high disturbance of the daily life of affected inhabitants (electric and water shortages, closure of streets and roads, etc.). By contrast, a small event happens when the damages are moderate, regarding buildings and infrastructures, and the daily live disturbance is of low impact, basically reduced to traffic jams.
Table 2.
Flood events affectation in the 20th century. Source: [35].
Currently, all the channel’s mouths are located within the urban structure of Palma. This increases the hazard level of each stream in case of flood. The risk index varies from level 2, which mainly includes the courses running outside the urbanized area and those ending on the western side of the bay, to level 3, for the surface network flowing on the central and eastern areas, increased by their location on heavily populated zones, bed narrowing actions and bridges and roads crossing the streams.
Regarding the stormwater management system, currently the sewage and rainwater networks are linked, thus creating problems when large amounts of rain fall over the city, as the system is unable to absorb the water. As a solution, a pluvial tank is being built in the Eastern side of the city, to avoid the flooding of the sewage treatment plant and the nearby neighborhoods. Its construction started in 2020 and is expected to end in 2022. Moreover, the city council has projected a green plan of parks, called green wedges, which will be located between the seaside and the interior of the municipality, with the objective of enhancing the permeability of the city surface and reducing the flooding affectation.
The region climate is Mediterranean, with dry summers and mild winters. Mean annual rainfall is 449 mm, which falls mostly in autumn, from September to November, showing a maximum in October with an average amount of 69 mm (Figure 3). The precipitation reaches its minimum in summer, even though August rainfall doubles the quantities of June and it is almost four times the mean value of July, the driest month of the year. The rainfall of August can be related to late summer storms, a common feature of Mediterranean climate [37], which cause floods on a regular basis.
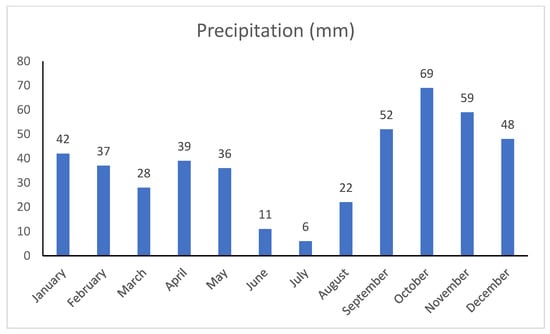
Figure 3.
Monthly rainfall distribution at Palma’s Harbour gauge, 1981–2020. Source: AEMET.
Despite the monthly averages, it is common to have rain events with high amounts of precipitation falling in 24 h or less, especially in the headwaters of the catchment. Examples of such events are the one happening on 29 September 1934, with 172 mm in 24 h, or the 25 September 1972, when 106 mm caused important floods across the urban area of Palma in less than 24 h [35]. Recently, the event of 4 September 2015 resulted in 124.3 mm in one day.
2.2. Data
The data were collected from different sources of information (Table 3). Daily rainfall amounts were taken from the official Spanish Meteorological Agency (AEMET) gauges, which are distributed across the city.
Table 3.
Sources of information.
The daily press of Palma (Diario de Mallorca and Última Hora) was used to identify the affected areas as well as the damages affecting public and private properties. Once available, official reports from city authorities or public services (fire fighters, local police) allowed completing the identification of affected areas and the kind of damages sustained.
Finally, post-flood surveys were used to gather in situ information, usually the day or days after the event. Such research allowed measuring water levels and obtaining visual material, such as pictures or videos taken by witnesses of the event.
2.3. Methodology
A database of events was developed by using a spreadsheet. Information such as date of the flood, rainfall amount, affected areas and damages was recorded from various sources as stated before.
The collected data were introduced on the database. Once verified, the affected areas were located on a city map and research was done in order to identify the flood causes. The season of occurrence is also included to identify possible changes.
Altogether, six types of flooding areas can be included in the city of Palma. The research allows identifying the following categories:
- (a)
- Stream ends located mostly at the easternmost area of Palma’s alluvial plain (Platja de Palma, son Llàtzer, Polígon de Llevant) and affected by the urban pressure in the coastline.
- (b)
- Drained wetlands at the eastern side of the city (Prat de Sant Jordi, Son Banya, Casa Blanca and Son Sant Joan airport).
- (c)
- Natural stream beds, mostly located in the westernmost area of the basin (Son Ferriol, Son Rapinya, Can Valero, Camí dels Reis, Son Moix, Son Armadans, Son Sardina, Secar de la Real, Son Espases, Gènova).
- (d)
- Coastal sectors with flooding favoured by the flow accumulation away from natural watercourses. Located in the central area of the basin, within the ancient urban structure (Passeig Marítim, Plaça Drassana, Passeig Sagrera) and former city outskirts (Arenal).
- (e)
- Flat urban areas without a natural drainage network (Eixample, Soledat, Rafal Nou).
- (f)
- Deficient planned infrastructures (Eusebi Estada Street, Son Oliva neighborhood, circumvallation freeway and underground line).
The six categories change depending on the natural trends of the territory. The first three (a–c) are related to watercourses existing before urbanization, whereas the following two (d and e) are the result of wrongful urban design. Finally, the category f is the result of poor infrastructure planning, affecting both the road network and the underground line, as no pluvial flooding evacuation zones were planned.
3. Results
From 2000 onwards, 28 flood events have affected Palma de Mallorca (Table 4).
Table 4.
List of flood events.
Regarding the seasonal distribution, autumn is the season with the highest frequency of events, with a maximum during September (nine floods). This result conforms with rainfall data, which shows that fall is the season with the largest amount of precipitation and, as a result, the one with the highest number of flood events since the 15th century [38]. On the contrary, winter is the season with least events, only 3.
Regarding the spatial location of the events (Figure 4), fifteen points were identified over the city area, corresponding to the six categories of flood presented before (Table 5).
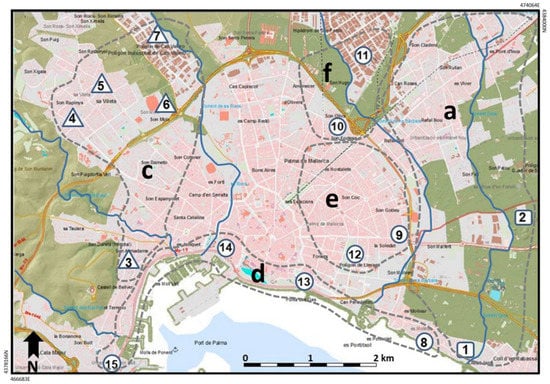
Figure 4.
Map of impact points with identification number (Table 5) and zoning distribution.
Table 5.
Identification of points of impact.
4. Discussion and Recommendations
There is a widespread distribution of the impact points (Figure 4), almost all of them outside the old city and adjacent urban development. Only numbers 13 and 14 are located within the Middle Age city and correspond to the coastal zone development from the 1960’s. Both are examples of pluvial flooding, when the rain cannot find a natural path towards the sea and accumulates on streets and squares. Another example of such kind of flood is number 15, close to the new harbor, where the road network acts as a barrier, not allowing the water flow to reach the sea.
Therefore, there are a large number of flooded zones in Palma’s outskirts and across the city development of the 20th century (numbers 1 to 12). Those critical zones are the result of a failure from local authorities to contain an increased development, which affected flood-prone areas and even natural watercourses, made without proper planning. Such actions integrated the surface water network within the city urbanization, as happened in other Spanish regions [25,39], and as a result, new locations for flooding appeared, usually away from the watercourses.
Some of the new locations are identified in alluvial plains (numbers 1, 2 and 8), which were formerly the city’s orchard and agricultural zone and nowadays are tourist and residential neighborhoods. Meanwhile, numbers 3, 4, 5, 6 and 7 correspond with former torrential networks, nowadays integrated within the urban landscape, therefore losing its ancient functionality and allowing superficial runoff following its former course.
Two more critical points are wrongly planned infrastructures, located on the road network that surrounds the city, as in number 10 and 11, where a large number of underpasses and crossings are flooded after intense rainfall events. Incorrect engineering combined with a decreasing permeability is a risk factor for urban flooding [40].
Finally, the urban expansion from the 20th century led to the occupation of land, which was part of farms, divided in plots to be urbanized. Such land lacks a drainage structure, thus allowing pluvial flood to happen as the falling rain cannot infiltrate the ground due to the paved surfaces and water remains on the surface, flowing on the streets and flooding basements and street-level buildings (numbers 9 and 12).
Regarding damages, the values are not important, as happens in other European areas like Thessaly in Greece [41]. Although data are not available for a large number of events, the press usually refers damages related to cars, basements and shops with a reduced monetary impact and very specific locations.
The spatial distribution is influenced by the expansion of urban land, mainly those areas built at the end of the 20th century and the first years of the 21st century, a common trend for Spain and related to urbanization processes without control and planning [25]. The land change of uses, from agricultural to urbanized surfaces, together with the covering of watercourses and the narrowing of channels as well as the diversion of natural beds, leads to a higher number of events (19 out of 28) caused by impermeable surfaces. On the other hand, flooding as a result of the overflow of natural channels has happened only 8 times, mostly outside the urban limits, close to the stream’s headwaters. Moreover, traditional flood-prone zones within the city are not affected by events, while newest areas are identified surrounding the old city, almost all new neighborhoods appearing after the 1960’s.
Although such processes are common in areas affected by urban floods, there are some specific remarks, which could help the planning of measures to prevent flooding in Palma. Regarding technical actions, there is the need to redesign the sewage and drainage networks throughout the city, to avoid the system inoperability during intense rainstorms. Together with this, the redesign of the channel surface of streambeds currently covered or diverged, upgrading its capacity to contain runoff would be helpful. In the coastal area, a positive action would be the construction of storm water tanks that could avoid the surface flooding once the sewage network and the stream channels are overwhelmed by rainfall. Flooded underpasses, crossings and streets are common features in Palma, which could be solved by building ditches and kerbs covered by bars, thus allowing the infiltration of rain. For new underpasses, avoiding its location in flood-prone areas or too close to stream channels would eliminate the risk for cars and pedestrians.
Regarding future planning, the recovery of traditional rainwater harvesting and storage systems, such as cisterns and wells, will allow to increase water resources available to population while preventing rain falling to the streets from the roofs. Along the stream channels, low-impact development (LID) solutions could be planned, using permeable sidewalks or increasing the green alleys zones across the city. Finally, in the wetlands located on the eastern area of Palma, the recovery of the historical irrigation system would improve the flow of water towards the sea, avoiding the flooding of the lowlands located there.
Finally, the research points out to some limitations and uncertainties. The data sources are limited to official reports and the press coverage, meaning that, if an event is not reported, then the researchers could miss it and it is not included in the database. In terms of uncertainties, three main issues have been identified: On the one hand, one uncertainty derives from the extreme events statistics as, of all the main Mallorca basins, Palma is the only one without catastrophic events for the past 50 years so a doubt exists about what could happen in a landscape heavily affected by human changes. On the other hand, in a changing environment related to an increase of extreme events [42], it must be studied if the increase of small flooding cases has natural causes. Third, currently society is very aware of the extreme events affecting the Mediterranean basin or Europe [43,44], and public administrations are expected to apply protective measures, compulsory by international directives. Such measures have been not applied yet in Palma and its future effects are unknown in terms of reducing floods.
5. Conclusions
This study analyses the temporal and spatial distribution of floods affecting the city of Palma in the first two decades of the 21st century and the probable causes of such distribution.
Six different types of flood have been identified, all related to land use and the runoff network characteristics.
In terms of data availability, daily press proves to be a valuable source of information when combined with official reports and field research. Even so, sometimes information is missing as it happened with the 26 August 2013 event, when nothing was reported on the press or official reports and only oral information was provided about flooding in some streets of Palma, though without a clear location of the area.
Flooding in Palma has become a returning natural risk since the start of the 21st century. Large events, related to extreme torrential rainfall, have not affected the basin since the 1960s while being common in the eastern Mallorca catchments. Instead, current flooding events can be defined as low level but with high impact, resulting in the disruption of daily life (traffic and transportation system congestion, power failures) and usually unknown economic damages.
The identified uncertainties point out the need of a continuous research about urban flooding and its effects, moreover in the wake of the probable impacts of the climate change, which coupled with an increasing urbanization can lead to larger hazards and risk.
To conclude, this paper points out the flood-prone areas in the urban landscape of Palma and aims to increase the level of awareness of public administration and stakeholders regarding the consequences of a poor urban policy and encourage the improvement of measures to avoid future flood impacts with a better spatial planning.
Author Contributions
Conceptualization, J.R.-G. and M.G.-G.; methodology, J.R.-G. and M.G.-G.; formal analysis, J.R.-G. and M.G.-G.; investigation, J.R.-G. and M.G.-G.; resources, J.R.-G. and M.G.-G.; data curation, J.R.-G. and M.G.-G.; writing—original draft preparation, J.R.-G. and M.G.-G.; writing—review and editing, J.R.-G. and M.G.-G. All authors have read and agreed to the published version of the manuscript.
Funding
This research received no external funding.
Institutional Review Board Statement
Not applicable.
Informed Consent Statement
Not applicable.
Conflicts of Interest
The authors declare no conflict of interest.
References
- Diakakis, M.; Deligiannakis, G.; Katsetsiadou, K.; Antoniadis, Z.; Melaki, M. Mapping and classification of direct flood impacts in the complex conditions of an urban environment. The case study of the 2014 flood in Athens, Greece. Urban Water J. 2017, 14, 1065–1074. [Google Scholar] [CrossRef]
- Alfieri, L.; Burek, P.; Feyen, L.; Forzieri, G. Global warming increases the frequency of river floods in Europe. Hydrol. Earth Syst. Sci. Discuss. 2015, 12, 119–1152. [Google Scholar] [CrossRef]
- Brauch, H.G. Urbanization and natural disasters in the Mediterranean. Population growth and climate change in the 21st century. Case studies on Izmit, Algiers and Alexandria. In Building Safer Cities: The Future of Disaster Risk; Kreimer, A., Ed.; The World Bank: New York, NY, USA, 2003; pp. 149–164. [Google Scholar]
- Olcina Cantos, J. El Mediterráneo, región-riesgo. Una visión desde España. In XXX Congress of the International Geographical Union, Tunis; Comité Español de la UGI: Madrid, Spain, 2008; pp. 29–34. [Google Scholar]
- UCCRN. The future we don’t want. How climate change could impact the world’s greatest cities. In UCCRN Technical Report; UCCRN-C40Cities: New York, NY, USA, 2018. [Google Scholar]
- CRED-UNISDR. The Human Cost of Weather-Related Disasters, 1995–2015; Université Catholique de Louvain: Brussels, Belgium, 2015. [Google Scholar]
- Wright, D.B.; Smith, J.A.; Villarini, G.; Baeck, M.L. Hydroclimatology of flash flooding in Atlanta. Water Resour. Res. 2012, 48, W04524. [Google Scholar] [CrossRef]
- Blum, A.G.; Ferraro, P.J.; Archfield, S.A.; Ryberg, K.R. Casual effect of impervious cover on annual flood magnitude for the United States. Geophys. Res. Lett. 2020, 47, e2019GL086480. [Google Scholar] [CrossRef]
- Cyberski, J.; Marek Grzes, M.; Gutry-Korycka, E.N.; Kundzewicz, Z.W. History of floods on the river Vistula. Hydrol. Sci. J. 2006, 51, 799–817. [Google Scholar] [CrossRef]
- Herget, J.; Meurs, H. Reconstructing peak discharges for historic flood levels in the city of Cologne, Germany. Glob. Planet. Chang. 2010, 70, 108–116. [Google Scholar] [CrossRef]
- Elleder, L.; Herget, J.; Roggenkamp, T.; Niessen, A. Historic floods in the city of Prague-a reconstruction of peak discharges for 1481–1825 based on documentary sources. Hydrol. Res. 2013, 44, 202–214. [Google Scholar] [CrossRef]
- Leal, M.; Ramos, C. The potential of two types of urban flooding to cause material damages in Lisbon, Portugal. Int. J. Saf. Secur. Eng. 2018, 7, 190–200. [Google Scholar] [CrossRef]
- Acquaotta, F.; Faccini, F.; Fratianni, S.; Paliaga, G.; Sacchini, A.; Vilimek, V. Increased flash-flooding in Genoa Metropolitan Area: A combination of climate changes and soil consumption. Meteorol. Atmos. Phys. 2018, 131, 1099–1110. [Google Scholar] [CrossRef]
- Faccini, F.; Luino, F.; Sacchini, A.; Turconi, L.; De Graff, J.V. Geohydrological hazards and urban development in the Mediterranean area: An example from Genoa (Liguria, Italy). Nat. Hazards Earth Syst. 2015, 15, 2631–2652. [Google Scholar] [CrossRef]
- Diakakis, M.; Deligiannakis, G.; Pallikarakis, A.; Skordoulis, M. Factors controlling the spatial distribution of flash flooding in the complex environment of a metropolitan urban area. The case of Athens 2013 flash flood event. Int. J. Disast. Risk Reduct. 2016, 18, 171–180. [Google Scholar] [CrossRef]
- Audisio, C.; Turconi, L. Urban floods: A case study on the Savigliano area (North-Western Italy). Nat. Hazards Earth Syst. 2011, 11, 2951–2964. [Google Scholar] [CrossRef]
- Konieczny, R. The September 2017 flood in Elblag (Poland) in perspective. Meteorol. Hydrol. Water Manag. 2018, 6, 66–77. [Google Scholar] [CrossRef]
- Vinet, F. Geographical analysis of damage due to flash flood in southern France: The cases of 12–13 November 1999 and 8–9 September 2002. Appl. Geogr. 2008, 28, 323–336. [Google Scholar] [CrossRef]
- Poelmans, L.; Van Rompaey, A.; Ntegeka, V.; Willems, P. The relative impact of climate change and urban expansion on peak flows: A case study in central Belgium. Hydrol. Process. 2011, 25, 2846–2858. [Google Scholar] [CrossRef]
- Papagiannaki, K.; Lagouvardos, K.; Kotroni, V.; Bezes, A. Flash flood occurrence and relation to rainfall hazard in a highly urbanized area. Nat. Hazards Earth Syst. 2015, 15, 1859–1871. [Google Scholar] [CrossRef]
- Balasch, J.C.; Pino, D.; Ruiz-Bellet, J.L.; Tuset, J.; Barriendos, M.; Castelltort, X.; Peña, J.C. The extreme floods of the Ebro river basin since 1600CE. Sci. Total Environ. 2019, 646, 645–660. [Google Scholar] [CrossRef] [PubMed]
- Barriendos, M.; Rodrigo, F.S. Study of historical flood events on Spanish rivers using documentary data. Hydrol. Sci. J. 2006, 51, 765–783. [Google Scholar] [CrossRef]
- Barriendos, M.; Gil-Guirado, S.; Pino, D.; Tuset, J.; Pérez-Morales, A.; Alberola-Romà, A.; Costa, J.; Balasch, J.C.; Castelltort, X.; Mazón, J.; et al. Climatic and social factors behind the Spanish Mediterranean flood event chronologies from documentary sources. Glob. Planet. Chang. 2019, 182, 102997. [Google Scholar] [CrossRef]
- Llasat, M.C.; Barriendos, M.; Rodríguez, R.; Martín-Vide, J. Evolución de las inundaciones en Cataluña en los últimos 500 años. Ing. Agua 1999, 6, 257–266. [Google Scholar]
- Arranz Lozano, M. El riesgo de inundaciones y la vulnerabilidad en áreas urbanas. Análisis de casos en España. Estud. Geográficos 2008, 265, 385–416. [Google Scholar] [CrossRef]
- Aroca-Jiménez, E.; Bodoque, J.M.; García, J.A.; Díez-Herrero, A. Construction of an integrated social vulnerability index in urban areas prone to flash flooding. Nat. Hazards Earth Syst. 2017, 17, 2951–2964. [Google Scholar] [CrossRef]
- López Díez, A.; Máyer Suárez, P.; Díaz Pacheco, A.; Dorta Anterquera, P. Rainfall and flooding in coastal tourist áreas of the Canary Islands (Spain). Atmosphere 2019, 10, 809. [Google Scholar] [CrossRef]
- López MArtínez, F.; Pérez Morales, A. Influencia del turismo residencial sobre el riesgo de inundación en el litoral de la región de Múrcia. Scr. Nova 2017, 21, 577. [Google Scholar] [CrossRef]
- Pérez-Morales, A.; Gil-Guirado, S.; Olcina Cantos, J. Housing bubbles and the increase of flood exposure. Failures in flood risk management on the Spanish south-eastern coast (1975–2013). J. Flood Risk Manag. 2015, 11, 302–313. [Google Scholar] [CrossRef]
- Criado, M.; Martínez-Graña, A.; Sánchez San Román, J.; Santos-Francés, F. Flood risk evaluation in urban spaces: The study case of Tormes river (Salamanca, Spain). Int. J. Environ. Res. Public Health 2019, 16, 5. [Google Scholar] [CrossRef]
- Cortès, M.; Llasat, M.C.; Gilabert, J.; Llasat-Botija, M.; Turco, M.; Marcos, R.; Martin Vide, J.P.; Falcón, L. Towards a better understanding of the evolution of the flood risk in Mediterranean urban areas: The case of Barcelona. Nat. Hazards 2018, 93, 39–60. [Google Scholar] [CrossRef]
- Martín Vide, J.P.; Llasat, M.C. The 1962 flash flood in the Rubí stream (Barcelona, Spain). J. Hydrol. 2018, 566, 441–454. [Google Scholar] [CrossRef]
- Camarasa-Belmonte, A.M.; Soriano-García, J. Flood risk assessment and mapping in peri-urban Mediterranean environments using hydrogeomorphology. Application to ephemeral streams in the Valencia region (eastern Spain). Landsc. Urban Plan. 2012, 104, 189–200. [Google Scholar] [CrossRef]
- Grimalt, M. Les inundacions històriques de sa Riera. Treb. Geogr. 1989, 42, 19–26. [Google Scholar]
- Grimalt, M.; Rosselló, J. Anàlisi Històrica de les Inundacions a les Illes Balears Segons la guia Metodológica del Ministerio de Agricultura, Alimentación y Medio Ambiente; Conselleria d’Agricultura, Medi Ambient i Territori: Palma de Mallorca, Spain, 2011. [Google Scholar]
- Abril, A. Análisis Demográfico, Económico y Urbanístico del Impacto Turístico en la Platja de Palma. Master’s Thesis, Universidad Miguel Hernández, Elche, Spain, 2017. [Google Scholar]
- Jansà, A. El Clima de les Illes Balears; Lleonard Muntaner Editor: Palma, Spain, 2014. [Google Scholar]
- Grimalt, M.; Rosselló, J. InunIB: Analysis of a flood database for the Balearic Islands. Eur. J. Geogr. 2020, 11, 6–21. [Google Scholar] [CrossRef]
- Box, M.; Morales, A. Barrancos y ramblas: Su incorporación al entramado urbano en el sureste peninsular. Investig. Geogr. 1993, 11, 153–169. [Google Scholar]
- Berndtsson, R.; Becker, P.; Persson, A.; Aspegren, H.; Haghighatafshar, S.; Jönsson, K.; Larsson, R.; Mobini, S.; Mottaghi, M.; Nilsson, J.; et al. Drivers of changing urban flood risk: A framework for action. J. Environ. Manag. 2019, 240, 47–56. [Google Scholar] [CrossRef]
- Bathrellos, G.D.; Skilodimou, H.D.; Soukis, K.; Koskeridou, E. Temporal and Spatial Analysis of Flood Occurrences in the Drainage Basin of Pinios River (Thessaly, Central Greece). Land 2018, 7, 106. [Google Scholar] [CrossRef]
- IPCC. Climate Change 2021: The Physical Science Basis. Contribution of Working Group I to the Sixth Assessment Report of the Intergovernmental Panel on Climate Change. Available online: https://www.ipcc.ch/2021/08/09/ar6-wg1-20210809-pr/ (accessed on 6 November 2021).
- Petrucci, O.; Papagiannaki, K.; Aceto, L.; Boissier, L.; Kotroni, V.; Grimalt, M.; Llasat, M.C.; Llasat-Botija, M.; Rossello, J.; Pasqua, A.A.; et al. MEFF: The database of MEditerranean Flood Fatalities (1980–2015). J. Flood Risk Manag. 2019, 12, e12461. [Google Scholar] [CrossRef]
- Petrucci, O.; Aceto, L.; Bianchi, C.; Bigot, V.; Brázdil, R.; Pereira, S.; Kahraman, A.; Kılıç, Ö.; Kotroni, V.; Llasat, M.C.; et al. Flood Fatalities in Europe, 1980–2018: Variability, Features, and Lessons to Learn. Water 2019, 11, 1682. [Google Scholar] [CrossRef]


Publisher’s Note: MDPI stays neutral with regard to jurisdictional claims in published maps and institutional affiliations. |
© 2021 by the authors. Licensee MDPI, Basel, Switzerland. This article is an open access article distributed under the terms and conditions of the Creative Commons Attribution (CC BY) license (https://creativecommons.org/licenses/by/4.0/).