Abstract
The growing global demand for soybean production combined with its increased market value could result in a new supercycle for this commodity. For Brazilian agribusiness, there has been an opportunity to increase exports, particularly in soybean production, in recent years, and therefore, soybean production has been expanding more and more across the states of the Brazilian Amazon. Soybean is the most important grain crop among temporary crops in the Brazilian Amazon; in 2019, it reached a value of USD 21.78 billion, using a planted area of 124,947 km2 (about 55% of the planted area). At the same time, overall deforestation increased significantly in recent years: 10,897 km2 in 2019 and 9811 km² in 2020. To study these changes, economic, social, and environmental sustainability indicators were identified and analyzed using a regression model, and changes in the main economic and socio-environmental indicators were observed that identified a strong positive correlation between agricultural GHG emissions and soybean-planted area. The impact on the local population was also analyzed between the years 2000 and 2019, and there was a mismatch between the population growth rate and the growth rate of the harvested area, which resulted in the displacement of the populations to the cities, and identified a strong positive correlation between the unemployment rate for young people and the soybean-planted area. In this context, this paper presents an analysis of the correlation between soy expansion and the main economic indicators and socioenvironmental impacts in the Brazilian Amazon.
1. Introduction
The slogan “Brazil–the world’s breadbasket” was started in the Vargas era, covering the period from 1930 to 1945, during which Getúlio Vargas ruled Brazil and Brazil exploded onto the world agricultural scene. The importance of the agricultural and mineral sector has only increased since then, as Brazil is currently the largest producer and exporter of soybeans in the world. To support this development, policy was created in 1939 by the Agronomic Institute of the North (IAN), whose institutional research agenda during these decades included: polyculture, the excavation of siltation channels along the Amazon River, the cultivation of food crops, and the development ranching. IAN predicted that the Amazon would be the world’s breadbasket and a solution to world hunger. The main instrument of this transformation would be the knowledge of its ecology through research related to the so-called “forest ecosystem theory” [1].
Nowadays, the expansion of soybean production in Brazil has been due to the strong global demand for soybeans, especially in China. The soybean-producing areas are increasingly expanding in the states of the Brazilian Amazon. The Amazon went through different border-expansion cycles that were fostered by government colonization plans and based on primary resources such as wood, ore, extractive products, and agribusiness. In the 1970s, colonization encouraged small producers with up to 100 hectares; currently, large soybean monocultures have concentrated within a few groups [2,3].
Current development strategies for the Brazilian Amazon have been following the regional economic integration perspective with a continuous model of economic cycles based on the exploration and transformation of extractive resources that started centuries ago and intensified multiple inequalities in the extractives market [4].
The so-called commodities (Large-scale production of products that function as raw materials and have uniform quality and characteristics, and their price is determined by international supply and demand) boom, or “supercycle”, drew several economists’ attention, who focused on the effect of high prices from primarily export economies. The three main groups of commodities (i.e., fuels, metals, and agricultural products) showed a substantial increase in prices from 2003 to 2014 [5].
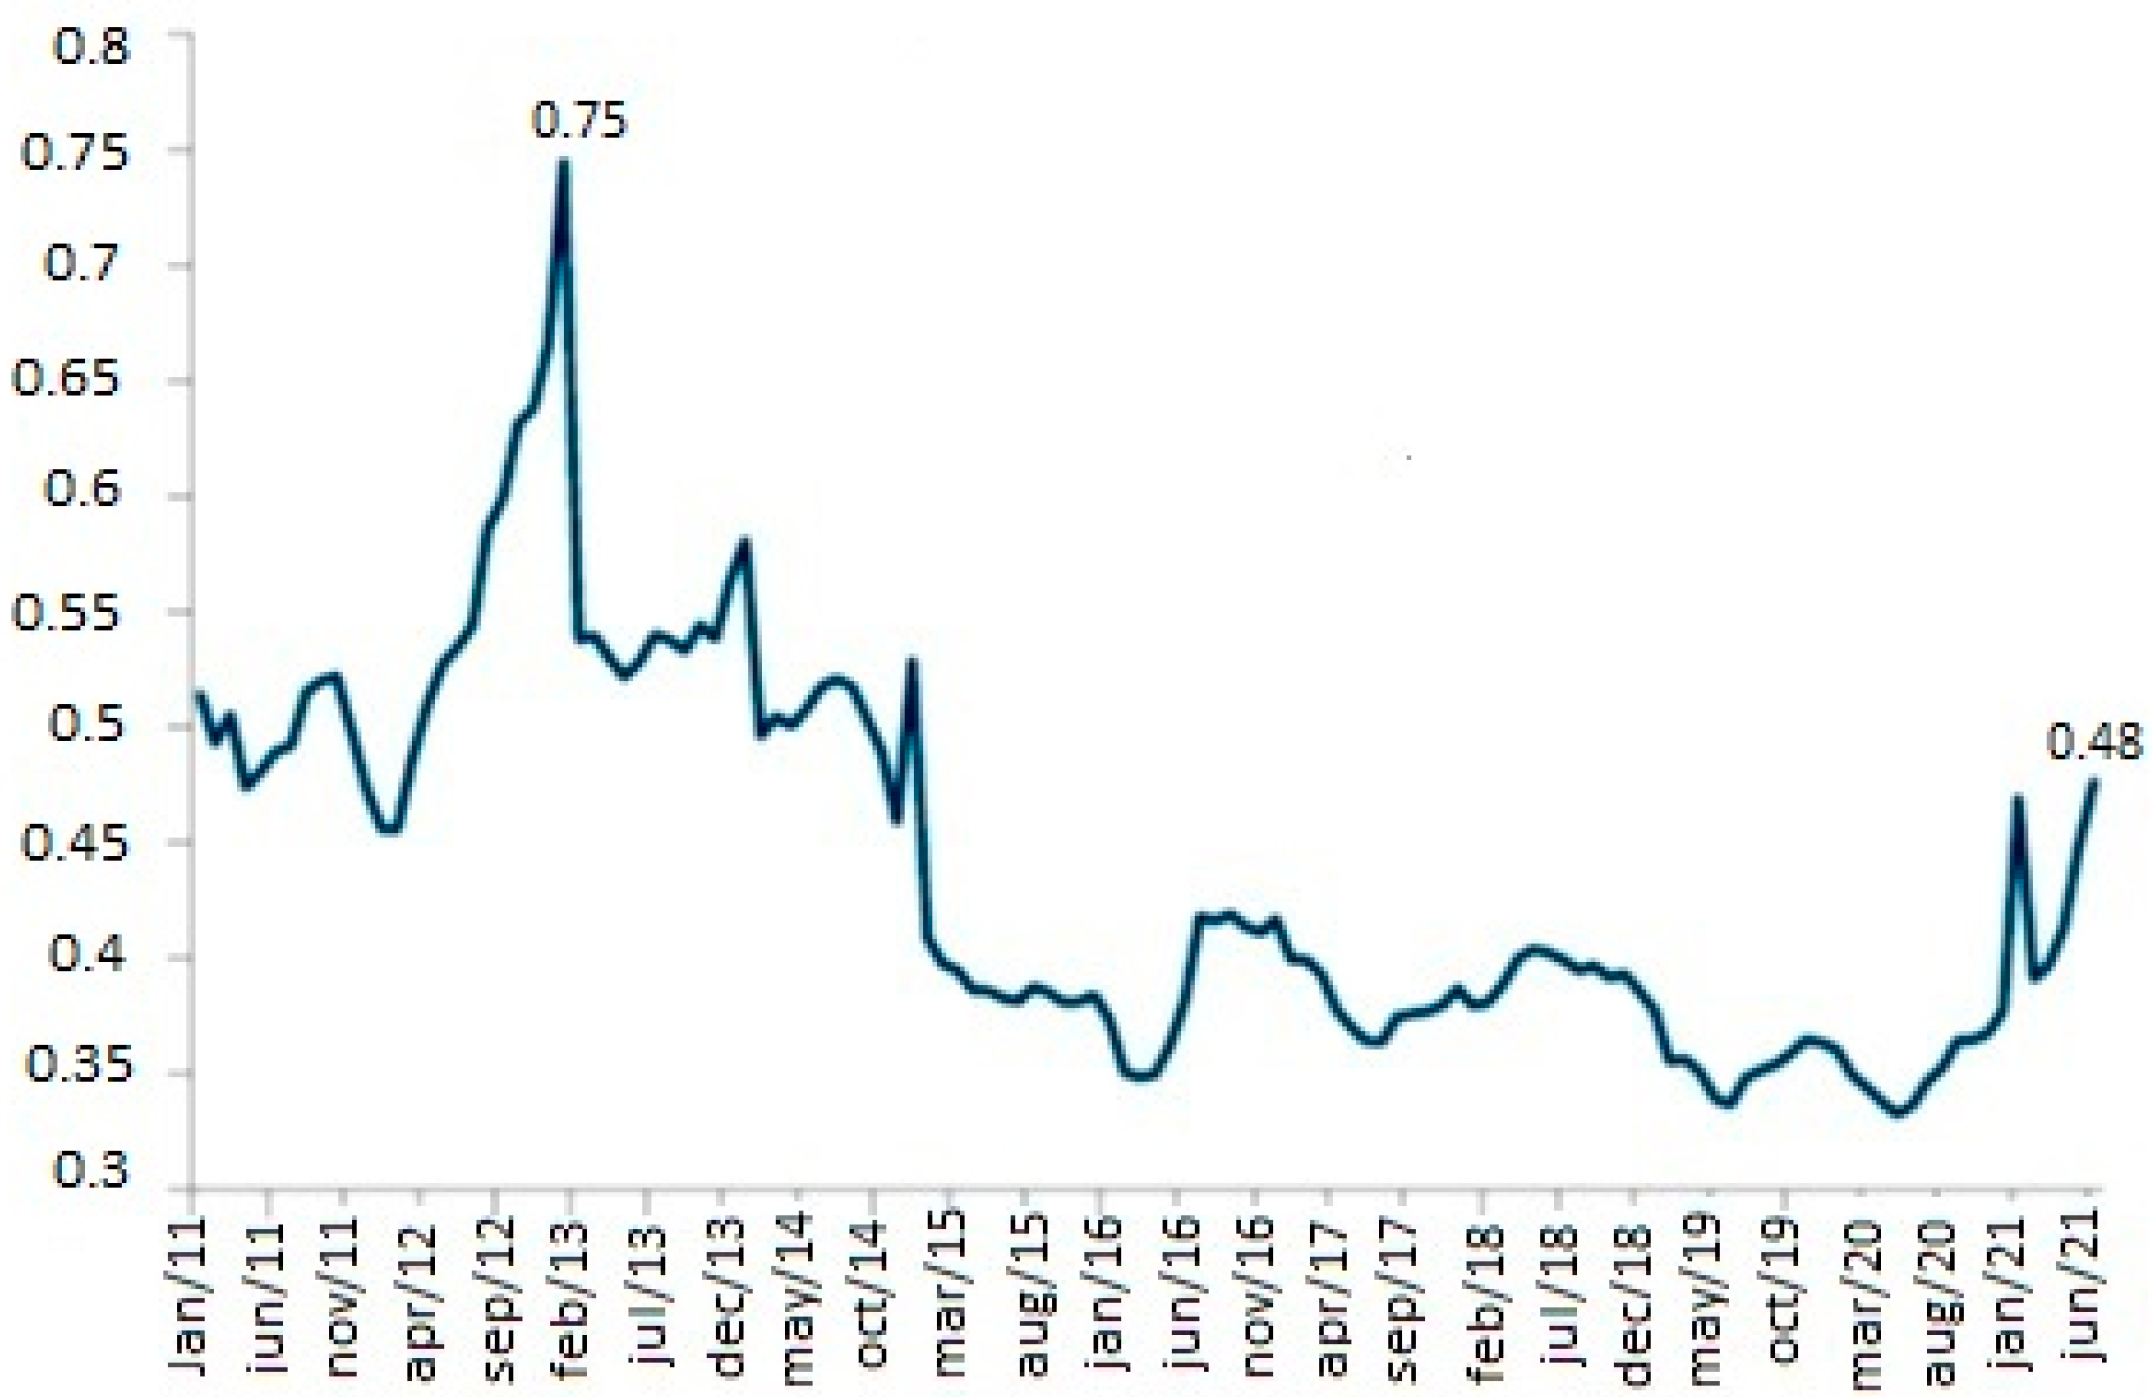
Agricultural commodity prices have fallen over the past two years. However, there has been a recovery in international market prices, starting in the second quarter of 2021. The average price of soybeans can be seen in Figure 1. The persistent upward trajectory of prices in 2021 has raised the hypothesis of a new commodity supercycle, similar to the one observed at the beginning of the last decade. In fact, as of the second quarter of 2021, dollar earnings of Brazilian exports began to reflect the escalation of this price hike, culminating in June 2021 with highs in most of the main exported products [6].

Figure 1.
Brazilian soybean exports average prices (Jan 2011–Jun 2021) (In USD/kg). Adapted: [6].
The agribusiness trade balance ended in June 2021 with USD 10.8 billion in surplus. Soybeans stood out, which has continued to grow by 25.3% since June and should see the year-end with new production and export records [7]. The export’s high-level dependence and investment centralization on the commodities sector would compromise diversified industry formation with possibilities for generating a profit and capital accumulation for economies with this production specialization, especially in stagnation periods when prices fall [5]. Such imbalances would become an obstacle to the consistent industrialization process, capable of forming capital and preventing the low elasticity of commodities from being transferred to prices.
Agribusiness can be one of those responsible for deforestation. The links have been pointed out by [8] between the illegal deforestation in the Amazon and the EU imports of soybeans and beef from Brazil. The correlation analysis between soybean expansion and deforestation rates at the municipal scale [9], showed that there was a relationship between the two events and indicated that soybean production was one of the deforestation factors, albeit not the only one. There have been indications that its expansion directed deforestation to new pioneer areas and shifted livestock to other areas [9].
In [10], they showed that the marginal benefits of soybean expansion have been increasing in the income dimension, but decreasing in education and longevity. On the other hand, changes in soy productivity (a proxy for agricultural intensification) have had a complex impact on the human development index and its dimensions, but in general, its marginal benefits have been decreasing over time.
Since 2019, the increase in demand for commodities such as iron and soybeans may indicate that we are in a new commodities supercycle. Within this context, we analyzed the economic, social, and environmental characteristics of the Brazilian Amazon to identify the impact of increased soy production in this region. The research hypothesis was that the increase in soybean production has impacted the Brazilian Amazon’s sustainability. The article proceeds in the next section with the methodology used for the evaluation of Brazilian Amazon indicators related to economic, environmental, and social impacts.
2. Methodology
The proposed methodology was to identify and analyze sustainability indicators. The ISO-21929 standard defined sustainability indicators as figures or other measures that enable information concerning a complex phenomenon such as environmental impact to be simplified into a form that is relatively easy to use and understand [11].
The Brundtland Report provided the most popular notion of sustainability (i.e., sustainable development): development that meets the needs of the present without compromising the ability of future generations to meet their own needs [12]. Based on a review of sustainable development literature, it might also be stated as: “the development that is likely to achieve lasting satisfaction of human needs and improve of the quality of life under the condition that ecosystems and species are utilized at levels and in ways that allow them to keep renewing themselves” [13].
A methodology to identify sustainability indicators was shown by [14,15,16]. A review of sustainability indices and indicators was presented in [17]. Sustainability indicators were developed and validated by [16], which structured four dimensions: economic, environmental, socio-cultural, and institutional. Many scholars and institutions proposed various indicator-selection criteria [18,19,20].
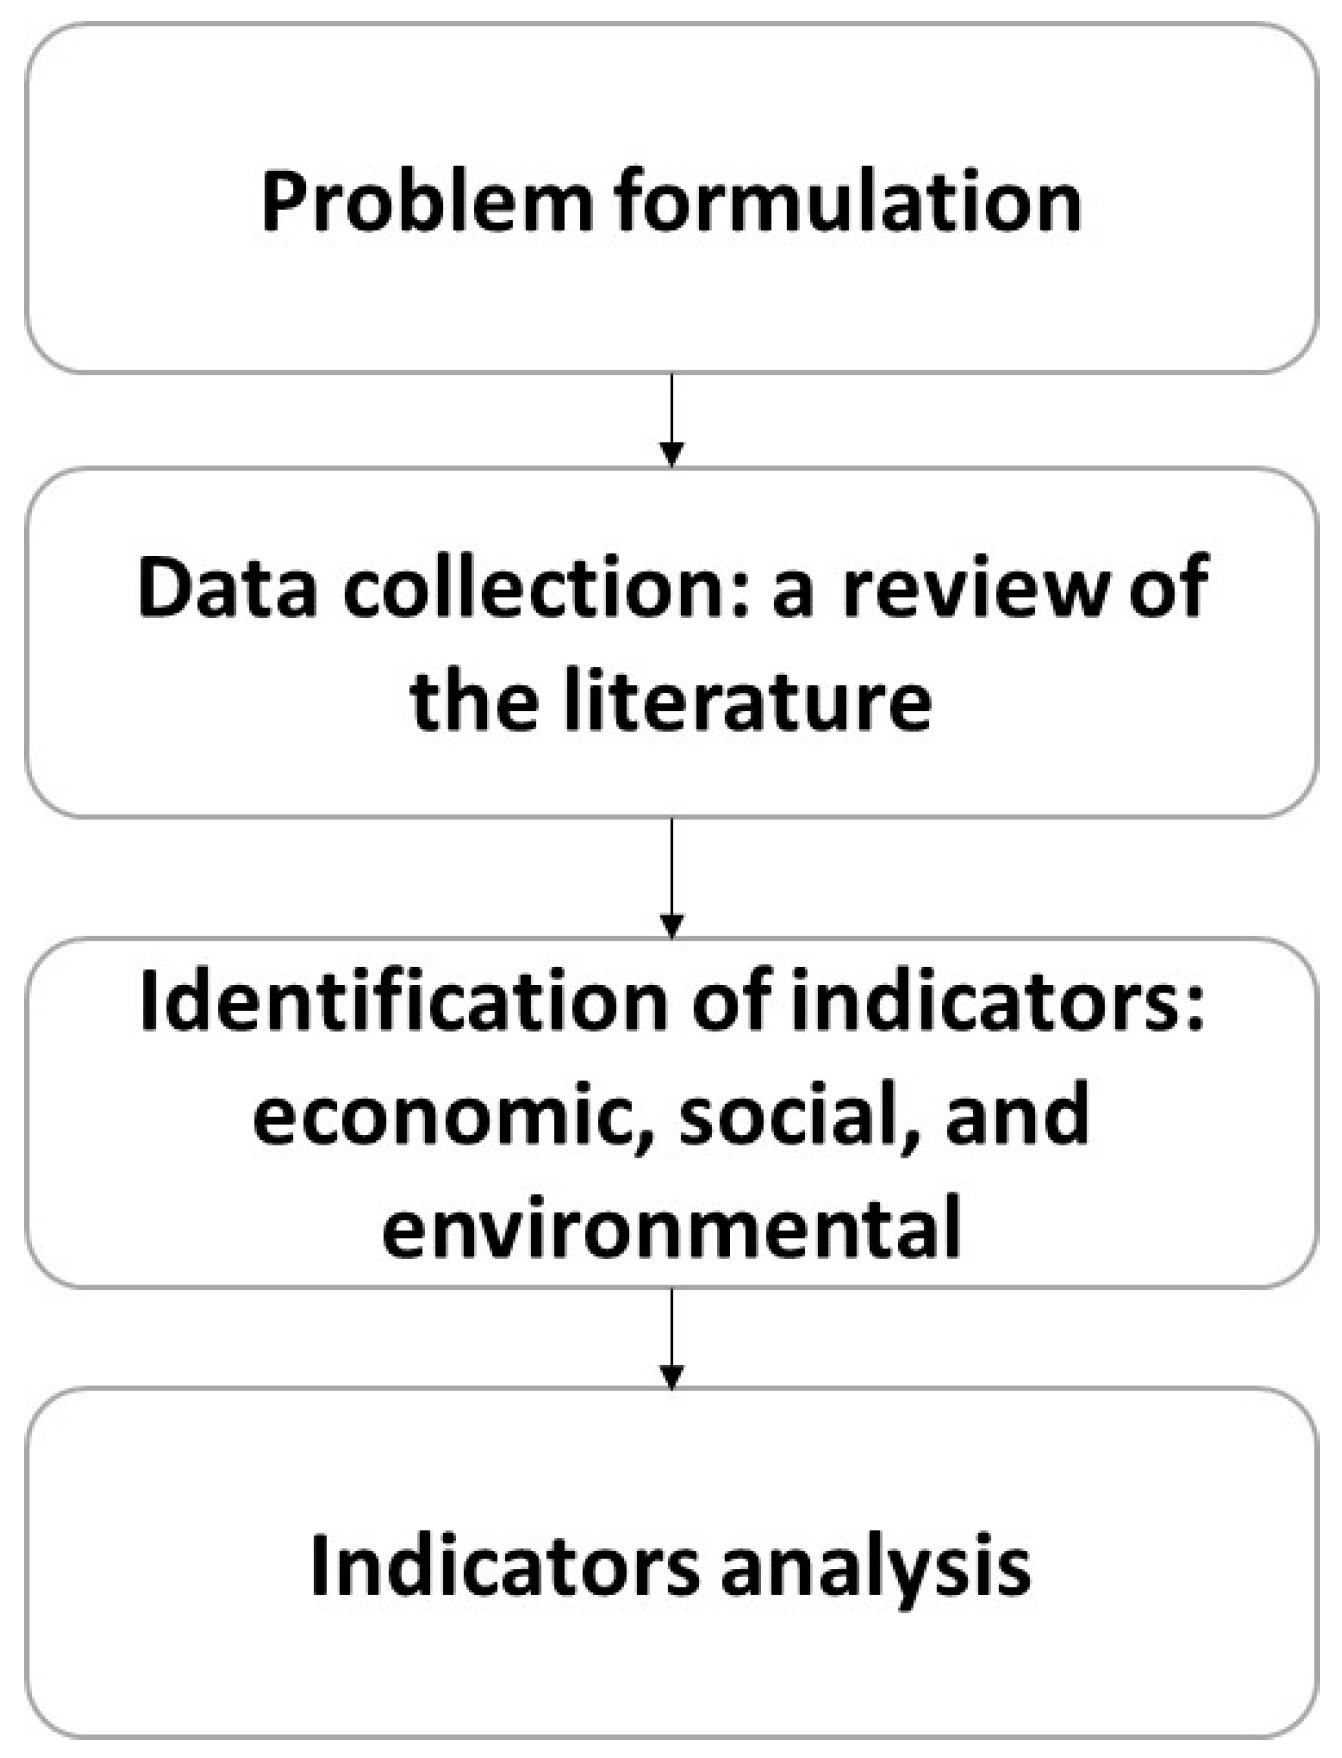
The methodology steps are shown in Figure 2. We began by formulating a research problem to originate research objectives. For the data collection step, we identified indicators by means of a review of the literature. The next step of the methodology clustered the indicators into three categories, environmental, economic, and social, by analyzing the scenario of the increase in soybean production in the Amazon. The main sources consulted in the data collection stage and lists of the sustainability indicators identified can be seen in Table 1.
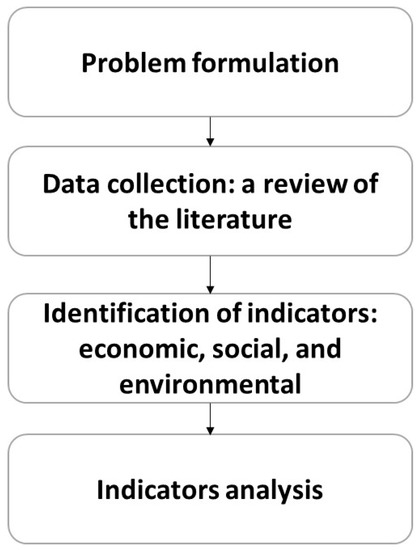
Figure 2.
Methodology steps. Source: Elaborated.

Table 1.
Sustainability criteria and indicators.
The research problem: is there a correlation between soybean production and other indicators of sustainability?
From this research problem, we collected data from the literature and from databases to identify the main sustainability indicators, and later, these indicators were analyzed considering statistical analyses with correlation coefficients. For political decision-making, social and economic indicators were usually adopted. However, to monitor and assess changes and their impacts on the environment, comparative indicators were needed. An economic indicator does not consider social or environmental effects, just as environmental indicators do not reflect social or economic impacts, nor do social indicators consider environmental or economic effects.
The sustainability indicators were divided into social, economic, and environmental components. The identification of sustainability indicators would be carried out through a review of the documentation, which involved the selection of available documentation and a structured review, which involved technical scientific references and databases.
In the indicator-analysis stage, the functional relationships of the identified indicators were considered, establishing a relationship between two variables. The regression analysis was performed under a theoretical framework that justified the adoption of mathematical-causal relationships. Where is the independent or explanatory variable, and is the dependent or response variable, with the aim of predicting the values of a dependent variable () as a function of an independent variable (). After identifying and selecting the indicators that would be the study variables, the hypotheses of this study were:
Hypothesis 1 (H1).
There is a correlation between the analyzed variables.
Hypothesis 2 (H2).
There is no correlation between the analyzed variables.
The Pearson correlation coefficient formula (Equation (1)) was used to test the hypotheses of this study. The correlation coefficient is a measure of strength and direction in a linear relationship between two variables, varying between −1 and +1 [31].
Hence, if the value of r approaches “−1”, it indicates that the various x and y variables have a negative linear relationship. If the value approaches “+1”, it means that there is a positive linear relationship between the variables x and y. If the value approaches “0”, it is concluded that there is no linear relationship between the variables.
Furthermore, the closer the r value is to the value “1”, the stronger the linear correlation. And the closer the r value is to the “0” value, the weaker the linear correlation.
0 < |r| < 0.3: the correlation is weak, and it is difficult to establish a relationship between the variables.
0.3 ≤ |r|< 0.6: the correlation is weak; however, we can consider the existence of a relative correlation between the variables.
0.6 ≤ |r| < 1: correlation is medium to strong; the relationship between the variables is significant, which allows consistency with few conflicts in reaching conclusions.
The coefficient of determination R² is a statistical measure of how close the data are to the adjusted regression line and expresses the amount of variance in the data that is explained by the linear model, with the R² varying between “0” and “1”. In this work, we analyzed the correlation between the identified variables and their coefficient of determination.
3. Amazon’s Sustainability Characteristics
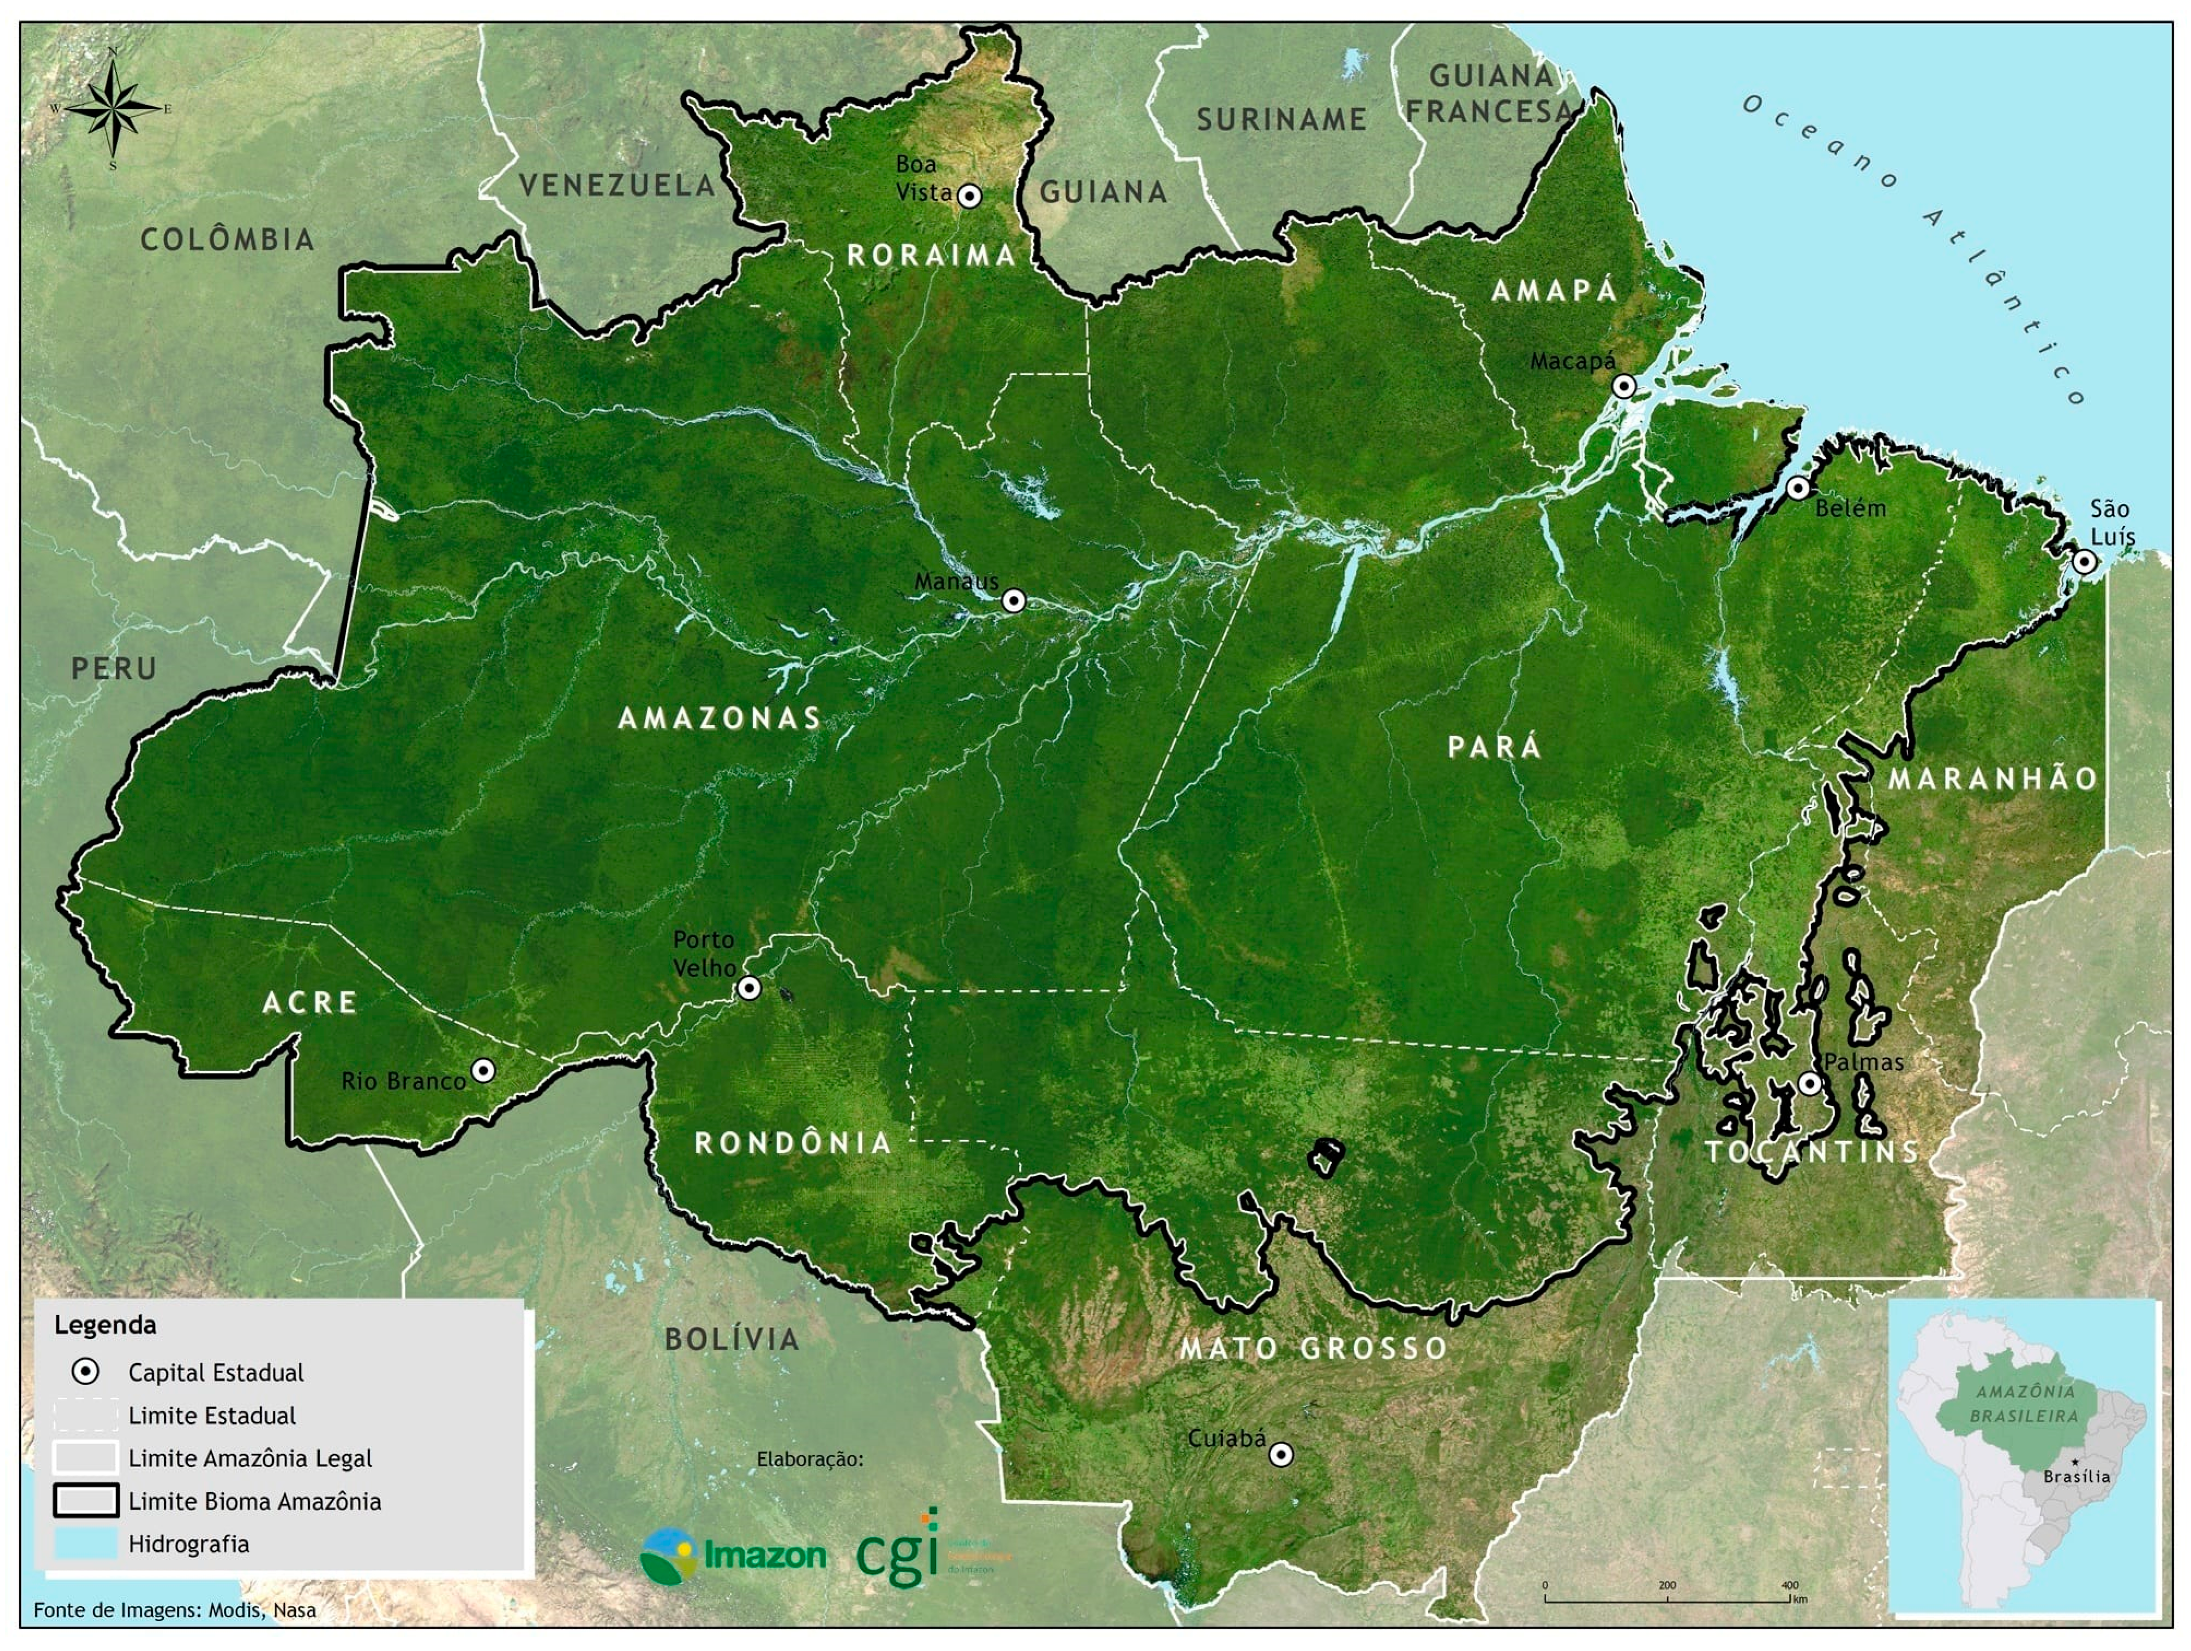
The Brazilian Amazon has approximately 5 million km² comprising 772 municipalities in 9 states and representing 59% of the national territory [26]; the updated Brazilian Amazon map can be seen in green in Figure 3.
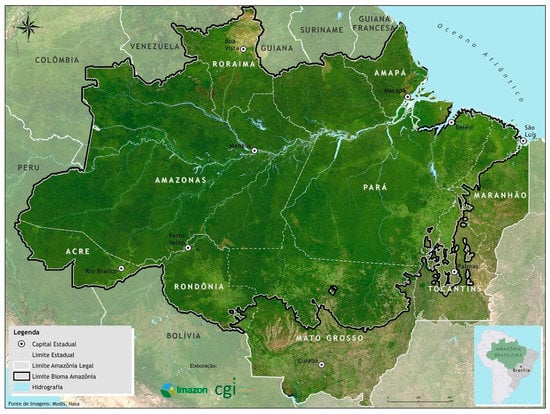
Figure 3.
Brazilian Amazon map. Source: [32].
The Brazilian Amazon’s main economic activities are concentrated in the agricultural industry with commodity exports, such as iron ore, and the service sector, which corresponds to the trade activities in goods and services. In addition, the region is a major producer of energy due to its water potential and natural resources.
The occupation model and Brazilian Amazon exploration gained prominence in the 1970s with the National Integration Program (PIN), an agrarian policy with a motto of “land without men, for landless men”. The National Integration Program foresaw 100,000 family settlements. The National Institute of Colonization and Agrarian Reform (INCRA) required that half of this area be deforested and used in agricultural or livestock production as a precondition for issuing ownership documents [3].
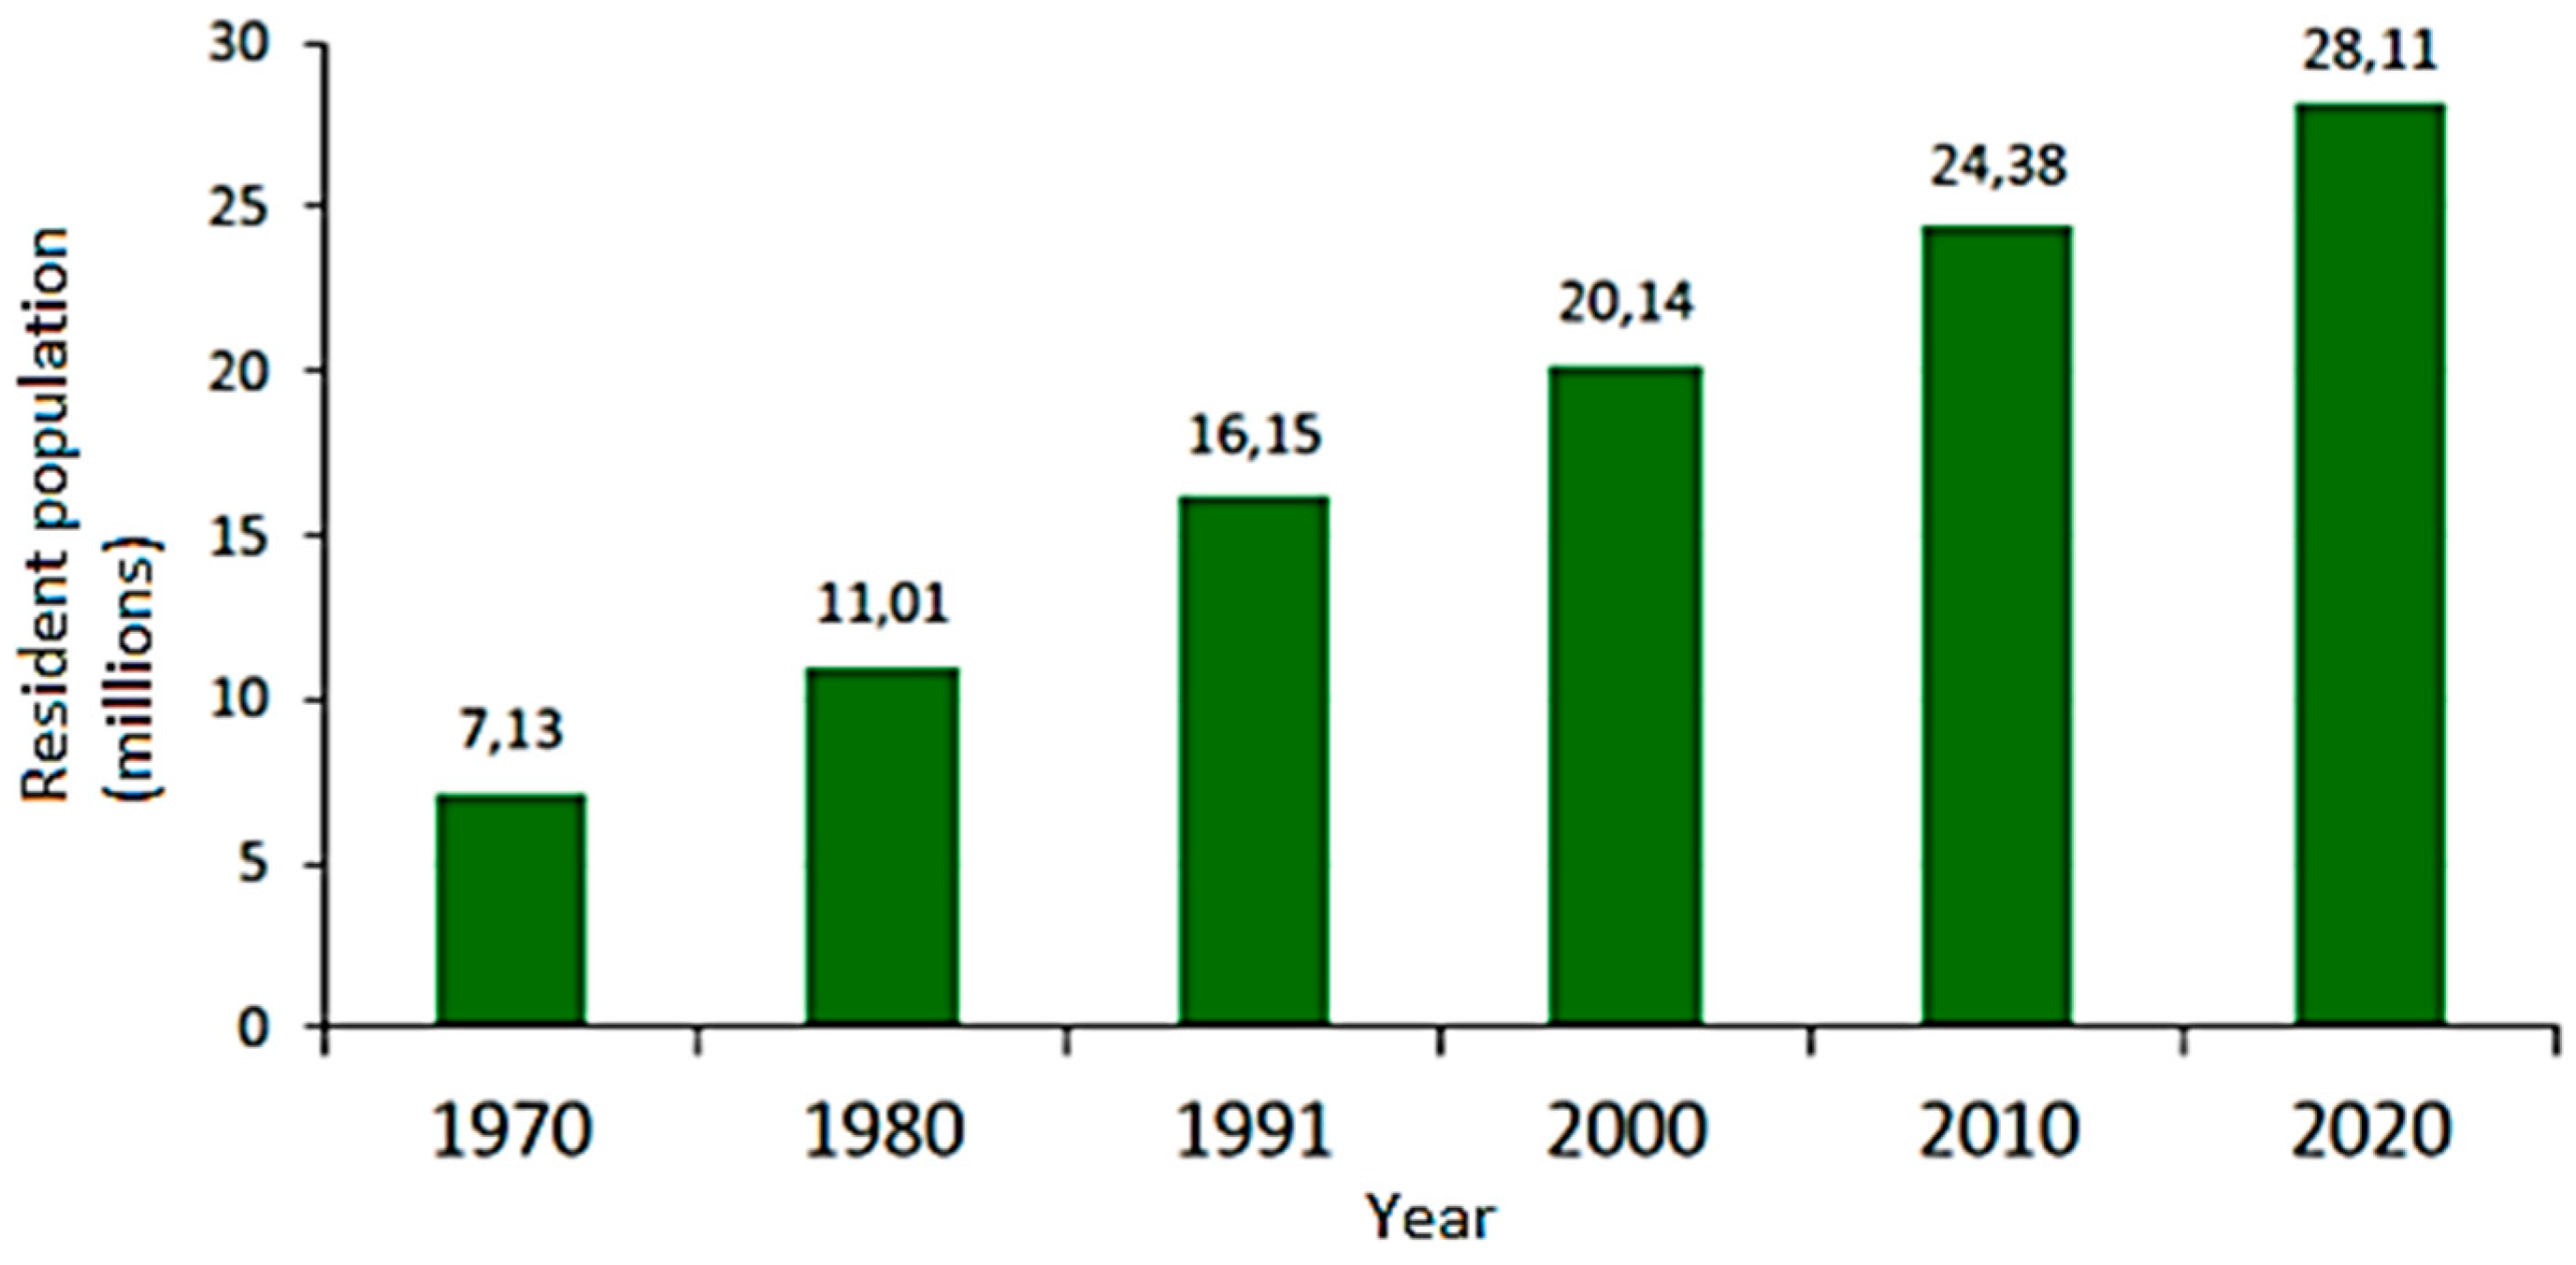
The Brazilian Amazon population increased from 7.13 million inhabitants in 1970 to 28.11 million in 2020. With about 13% of the Brazilian population, the Amazon population density is still low at 5.6 inhabitants per km² [26]. The Brazilian Amazon population evolution over the decades is shown in Figure 4. Despite the substantial increase over the decades, the population growth rate decreased from 35.30% between the 1970s and 1980s to 13.30% between 2010 and 2020, a percentage close to 9.92% of the growth rate in Brazil between 2010 and 2020 [21].
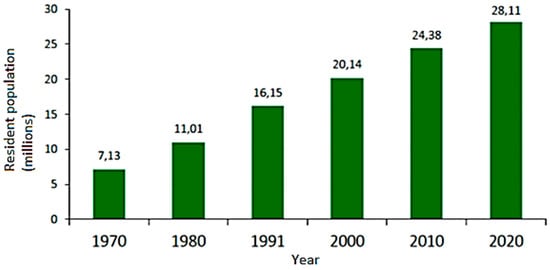
Figure 4.
Amazon Brazilian population evolution between the decades. Source: [21].
3.1. Economic Characteristics
The Brazilian Amazon’s gross domestic product (GDP) totaled USD 158.5 billion in 2018, which represents only 8.7% of Brazil’s GDP [26]. The main economic indicators can be seen in Table 2.
Table 2.
Brazilian Amazon’s main economic indicators. Source: [21].
The Brazilian Amazon’s per capita GDP of USD 5768.14 was below the national average in 2018, which was USD 8680.57. Additionally, in 2018, Rio Grande do Sul, the second-largest soybean-producing Brazilian state, had a GDP per capita of USD 10,429.65, which was 80% higher than the Amazon region’s GDP per capita.
The Brazilian Amazon states’ real GDP total and per capita in 2018 is shown in Table 3. The state of Maranhão had the lowest GDP per capita among the states analyzed, with USD 4 mil, and was less than half the national per capita GDP, and only the state of Mato Grosso had a GDP per capita higher than the national average.
Table 3.
Total and per capita real GDP in the Brazilian Amazon states and Brazil in 2018. Source: [21].
3.1.1. Agricultural Characteristics
Regarding agriculture, the Brazilian Amazon’s harvested area increased from 83,961 km2 in 2000 to 224,445 km2 in 2019. That was a 264.7% increase, and the agriculture production value of those rose from USD 1.66 billion in 2000 to USD 21.78 billion [21].
Soybeans are the most important crop among the Brazilian Amazon’s temporary crops areas planted or in preparation for planting crops of short duration (less than one year) and require new planting after each harvest. In 2019, it reached a production value of USD 10.39 billion and a planted area of 124,947 km2; that is, about 55% of the Brazilian Amazon’s planted area was allocated to monoculture soybeans, the monoculture is a technique based on growing only one crop type at the same time in a specific field (Table 4). However, when analyzing the production value per planted area (USD/km2), soybeans were only the sixth crop with the highest added value among the main temporary crops analyzed.
Table 4.
Planted area (km²) and production value (USD billion) of temporary crops in the Brazilian Amazon in 2019. Source: [21].
The United States Department of Agriculture (USDA) presented the 2021–2022 soybean crop world production projection, which should reach 385.5 million tons, an increase of 21.5 million tons, as compared to the past crop (Table 5). World consumption was forecasted at 380.8 million tons, 11.8 million above the previous cycle. Brazil, the United States, and Argentina are expected to account for 82% of the world’s soybean production in the 2021–2022 season [2].
Table 5.
World soybean production (million t). Source: [2].
The Brazilian products trade balance in the agribusiness sector had a positive balance of USD 10.8 billion with exports of USD 61.5 billion; that is, a growth of 20.9% until June 2021. Soybeans, which had growth of 25.3% during this period, should reach a new record of production and exports in the 2020–2021 crop that has kept Brazil as a higher producer and global soybean exporter [6]. China has been the main destination for Brazilian agribusiness exports in the first half of 2021, with 39% of exports in value, followed by the European Union (14.5%) and the United States (6.4%). In comparison with the same period in 2020, China had increased imports by 20.1%, as did the European Union (16.5%) and the United States (30.2%) [6].
The Brazilian increase in agribusiness exports, especially in soybean and corn crops, has contributed to the production growth in each harvest. The soybean and corn stocks were lower, with the concentration of the stock in China; nevertheless, stocks and Chinese production did not meet domestic demand, which indicated a good outlook for the Brazilian farmers who have started planning their 2021–2022 harvest [6]. Soybean global ending stocks for 2021–2022 have been forecasted to reach 92.6 million. In China, stocks should grow by 2.2 million tons, as compared to the past harvest, totaling 34.0 million tons [2].
The Brazilian states that produced the most soybeans in the 2020–2021 harvest can be seen in Table 6; the Amazonian state of Mato Grosso stood out as the largest producer and has the largest soybean-planted area in Brazil.
Table 6.
The Brazilian states that most produced soybean 2020–2021 (million t). Source: [22].
Even so, permanent crops (that includes the planted area or in preparation for the planting of long-term crops, which after harvest do not need to be planted again, producing for several successive years) in the Brazilian Amazon have also been growing with an emphasis on açai (Euterpe oleracea) and an estimated production value of USD 0.73 billion, banana bunches at USD 0.331, billion, and cocoa in almonds at USD 0.31 billion (Table 7). Even though the planted area is lower as compared to the temporary crops shown in Table 4, the production and planted-area values are higher than the main export commodities such as soybeans.
Table 7.
Planted area (km²) and production value (USD billion) of permanent crops in the Brazilian Amazon in 2019. Source: [21].
The data analysis carried out by [33] revealed that enterprises based in the Amazon exported 955 products between 2017 and 2019. Among these products, 64 were classified as “compatible with the forest” and came from non-timber forestry extraction, agroforestry systems, tropical fisheries and fish farming, and tropical horticulture, and they generated an annual income of USD 298 million, with the global market for these same products moving USD 176.6 billion per year (Table 8). This meant that companies in the Amazon kept a share of only 0.17%.
Table 8.
Amazon forest products and their respective markets. Source: [33].
The IBGE’s Vegetal Extraction and Forestry Production (PEVS) survey can be divided according to origin: natural forest (e.g., logwood, charcoal, firewood), non-timber forest products (NTFP), and planted forest (forestry). In 2019, the roundwood production remained constant in the Brazilian Amazon, with the production of 11.28 million m³ with a value of USD 0.49 billion, while there was an increase in the value of the products from natural forests, which reached USD 0.57 billion. In turn, the planted-forest sector totaled USD 0.27 billion while other NTFPs, which included a range of products such as oils, fruits, seeds, leaves, roots, bark, and resins, totaled USD 209.81 million, with an emphasis on açai (Euterpe oleracea), which has the largest value share (70%) followed by Brazil nuts (Bertholletia excelsa) with 16% [21].
The pasture area in the Brazilian Amazon reached 709,694 km² in 2019; that is, it occupies an area three times larger than the area designated to harvest crops in the Brazilian Amazon. The number of cattle in the Brazilian Amazon increased from 47.2 million heads of cattle in 2000 to 89.2 million heads of cattle in 2019, of which the states of Mato Grosso and Pará had 32 million and 21 million heads of cattle, respectively [14]. Chicken production also stood out in the Brazilian Amazon, rising from 55 million in 2000 to 114 million in 2019 [26].
Production of pigs and chickens’ growth projection in 2021 grew 8.7% and 7.8%, respectively. However, beef consumption was still below the level achieved by the end of 2019. The higher inflation coupled with the pandemic’s negative impact on the labor market constrained beef consumption, which was the most expensive protein when compared to the others [7].
3.1.2. Mine and Energy Characteristics
Extracting natural resources for global export is referred to as “extractivism”. The most common extraction types are the vegetable, mineral, and animal. Between 1985 and 2019, mineral extraction gained greater prominence in Brazilian Amazon states, and the area designated for Brazilian Amazon mining activity almost doubled, going from: 119.52 to 222.3 km2 [21].
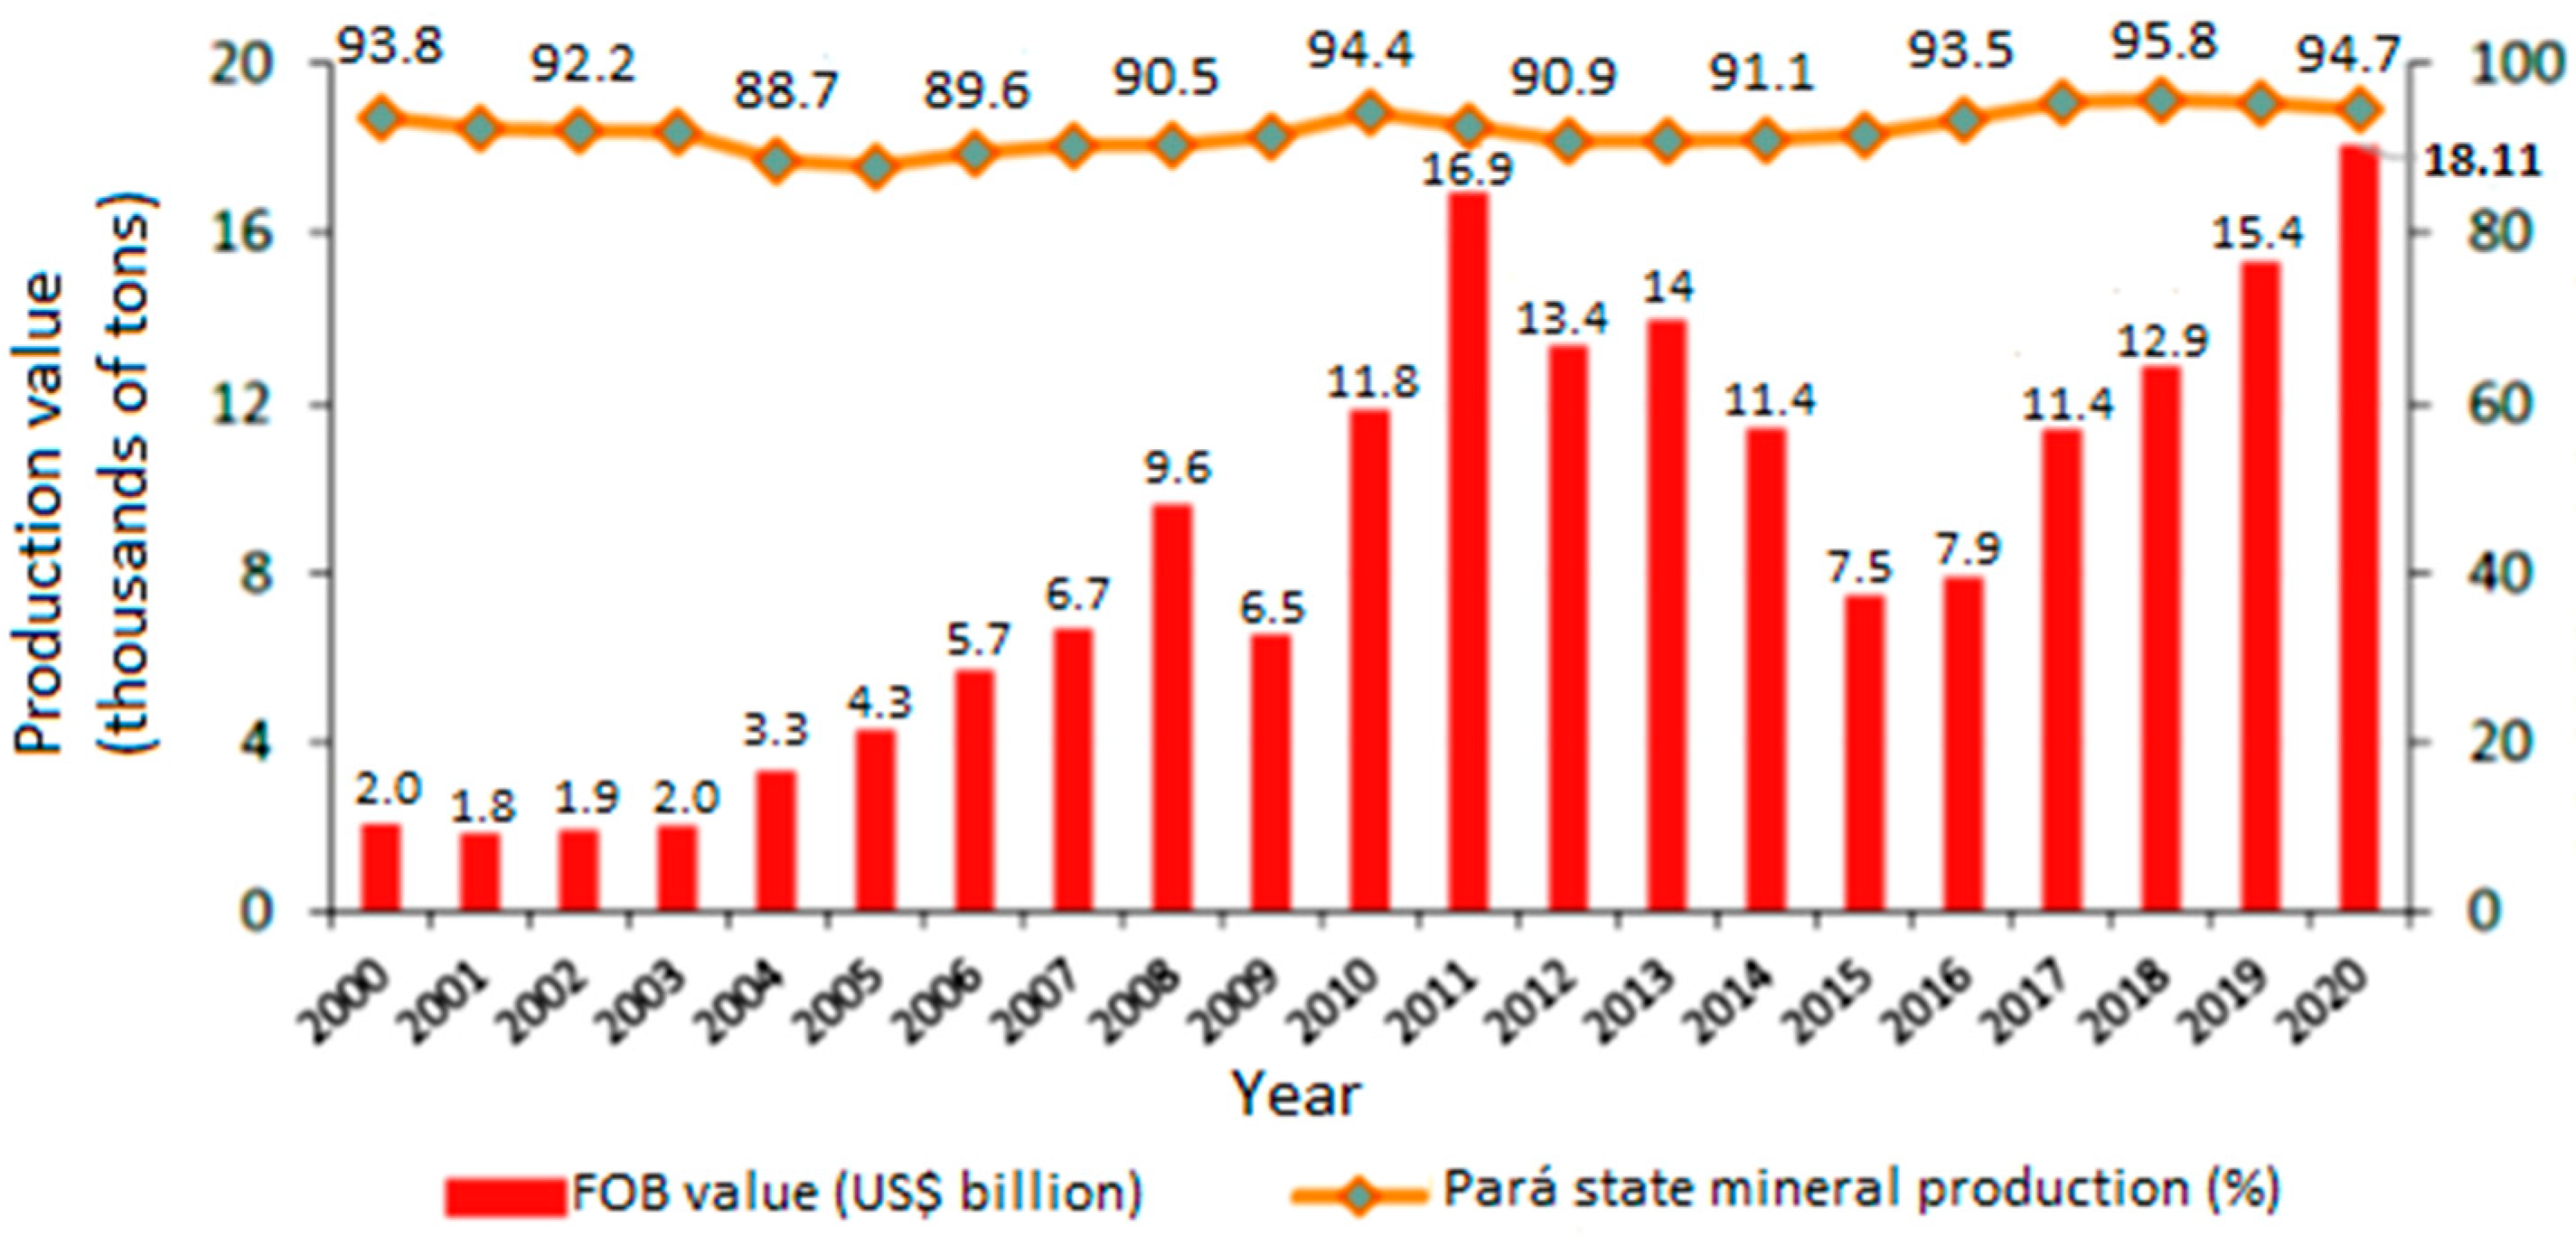
Pará is particularly notable for mineral extraction. This activity takes place in 16 municipalities across Pará, mainly for the extraction of iron ore, bauxite, kaolin, limestone, nickel, manganese, and gold. The ores exported value from the region increased ninefold between 2000 and 2020, from USD 2.1 billion in 2000 to USD 18.1 billion in 2021. Pará is the main mineral producer in the Brazilian Amazon and one of the largest in Brazil (Figure 5), contributing more than 94% of the region’s mineral exports [21].

Figure 5.
Mining industry export value in the Brazilian Amazon, participation in Pará state: 2000–2020. Adapted: [21].
In 2021, 67% of the energy generated and 62.48% of the installed power comes in Brazil from power plants powered by rivers. There are 739 hydroelectric-generating plants, 425 small hydroelectric plants, and 219 hydroelectric plants, all of which are in operation and are responsible for 109.3 gigawatts (GW) of installed capacity [34]. The Amazon has two plants among the ten largest on the planet, Belo Monte (11,233 MW) and Tucuruí (8370 MW), both of which are located in Pará.
While the Amazon has large hydroelectric plants, the Amazon region is rich in other natural sources of energy, such as biomass and solar. The Amazon region is a major biomass producer. Biomass is a renewable energy source that provides flexibility due to its wide range of applications used in the production of several fuels. The African oil palm (Elaeis guineensis) biomass stands out as an oleaginous palm species that was introduced to Brazil circa the 16th century, and the technologies for its production are mature enough to be used commercially [20].
The Amazon economy has distanced itself from the comparative advantages that could be provided by its natural resources, as its economy transfers a greater share from the federal government, industrial mining, mechanized agriculture, and industries based in the Industrial Pole of Manaus [14]. Table 9 presents the main Brazilian Amazon products exported.
Table 9.
Main Products Exported by the Brazilian Amazon 2017–2019. Source: [33].
3.1.3. Service Characteristics
The service sector encompasses activities such as goods trade, public administration, transport, education, health, and social promotion. The Brazilian service sector has very heterogeneous activities regarding the size of companies, average remuneration, and intensity of the technologies used. In recent decades, the performance of activities that make up the sector has been highlighted by its dynamism and growing participation in Brazilian economic production [35].
The Brazilian GDP in 2020 had a 4.1% drop from the previous year, representing the biggest annual decline since 1996 and interrupting three consecutive years of growth from 2017 to 2019. Among the main highlights of Brazil’s GDP in 2020, there was a drop in the services sector (−4.5%), industry (−3.5%), household consumption (−5.5%), government consumption (−4.7%), investments (−0.8%), export (−1.8%), import (−10%), and civil construction (−7%); only the agricultural sector showed growth of 2% [23].
The service sector represents about 72.8% of the Brazilian GDP and had a positive variation of 0.4% in the first quarter of 2021 after falling −4.5% in 2020, largely due to this sector being characterized by companies that depend on the presence of customers, such as bars, restaurants, and hotels, which were some of the most challenged businesses during the lockdowns resulting from the COVID-19 pandemic [23].
The industry sector had a drop of 3.5%, which interrupted two consecutive years of growth and was the most intense since 2016 when it had fallen 4.6%. The worst performance in the industry in 2020 was that of civil construction (−7%), which dropped after rallying 1.5% in 2019. The manufacturing industries for electricity (−4.3%) and gas, water, sewage, and waste management activities all saw declines (−0.4%) [23].
Household consumption in 2020 had the most intense negative variation (−5.5%) on the GDP index since 1996. The fall was mainly caused by social-distancing measures and the negative effects of the pandemic on the labor market and family services. The government consumption drop was also a record −4.7% and can be explained by the closings of schools, universities, museums, and parks throughout the year [23].
The states in the Amazon region have been highly dependent (over 80%) on the purchase of goods and services from the rest of Brazil while supplying only 2.52% to other Brazilian states; this has generally been due to the low added value of products and services exported by the Amazon states [36].
The service sector is the one that employs the most in the region, with an emphasis on trade, passenger and cargo transport services, and administrative and complementary services, such as commercial cleaning services. Trade has been one of the service sector’s main activities according to the Monthly Survey of Trade [23], and despite some decreases in sales volume in the first quarter of 2020 (−7.74%), nominal revenue grew 3.16% during the same period in the Amazon region.
According to the Monthly Survey of Services (PMS) carried out by [23], Pará State’s service sector had a 6.5% increase, which was the fifth best performance in the country, and was 26th out of the 27 states of the federation that presented positive results. The service sector in Amazonas grew the most in the first quarter of 2021, as compared to the same period in 2020, and it recorded the largest share at 51%, followed by industry at 27%, government expenditures at 15%, and agriculture with an index of 5.19%, of the total GPD for the state.
3.2. Environmental Characteristics
Brazilian Amazon deforestation has increased significantly in recent years and is sometimes justified as a “necessary evil” for agricultural production and economic development. In this section, we present the main deforestation rate indicators and greenhouse gas emissions.
The Stockholm Conference held in 1972 emphasized the importance of environmental issues and the need to relearn how to live on planet Earth while preserving it for future generations. The Brundtland Report, published in 1987, defined sustainable development as “that which meets the needs of the present without compromising the ability of future generations to meet their own needs” [29]. We performed an environmental assessment using deforestation and GHG emission indicators.
The forest cover area makes up 75% of the Brazilian Amazon, followed by the agricultural area (17%), the non-forest natural formations (5%), bodies of water (2%), and other unformed vegetation (0.2%). Since 1985, more than 721,000 km² of forest areas underwent a transition to agriculture in the region until 2019 [21]. Table 10 shows the main environmental indicators analyzed for the Brazilian Amazon.
Table 10.
Brazilian Amazon environmental indicators. Source: [21].
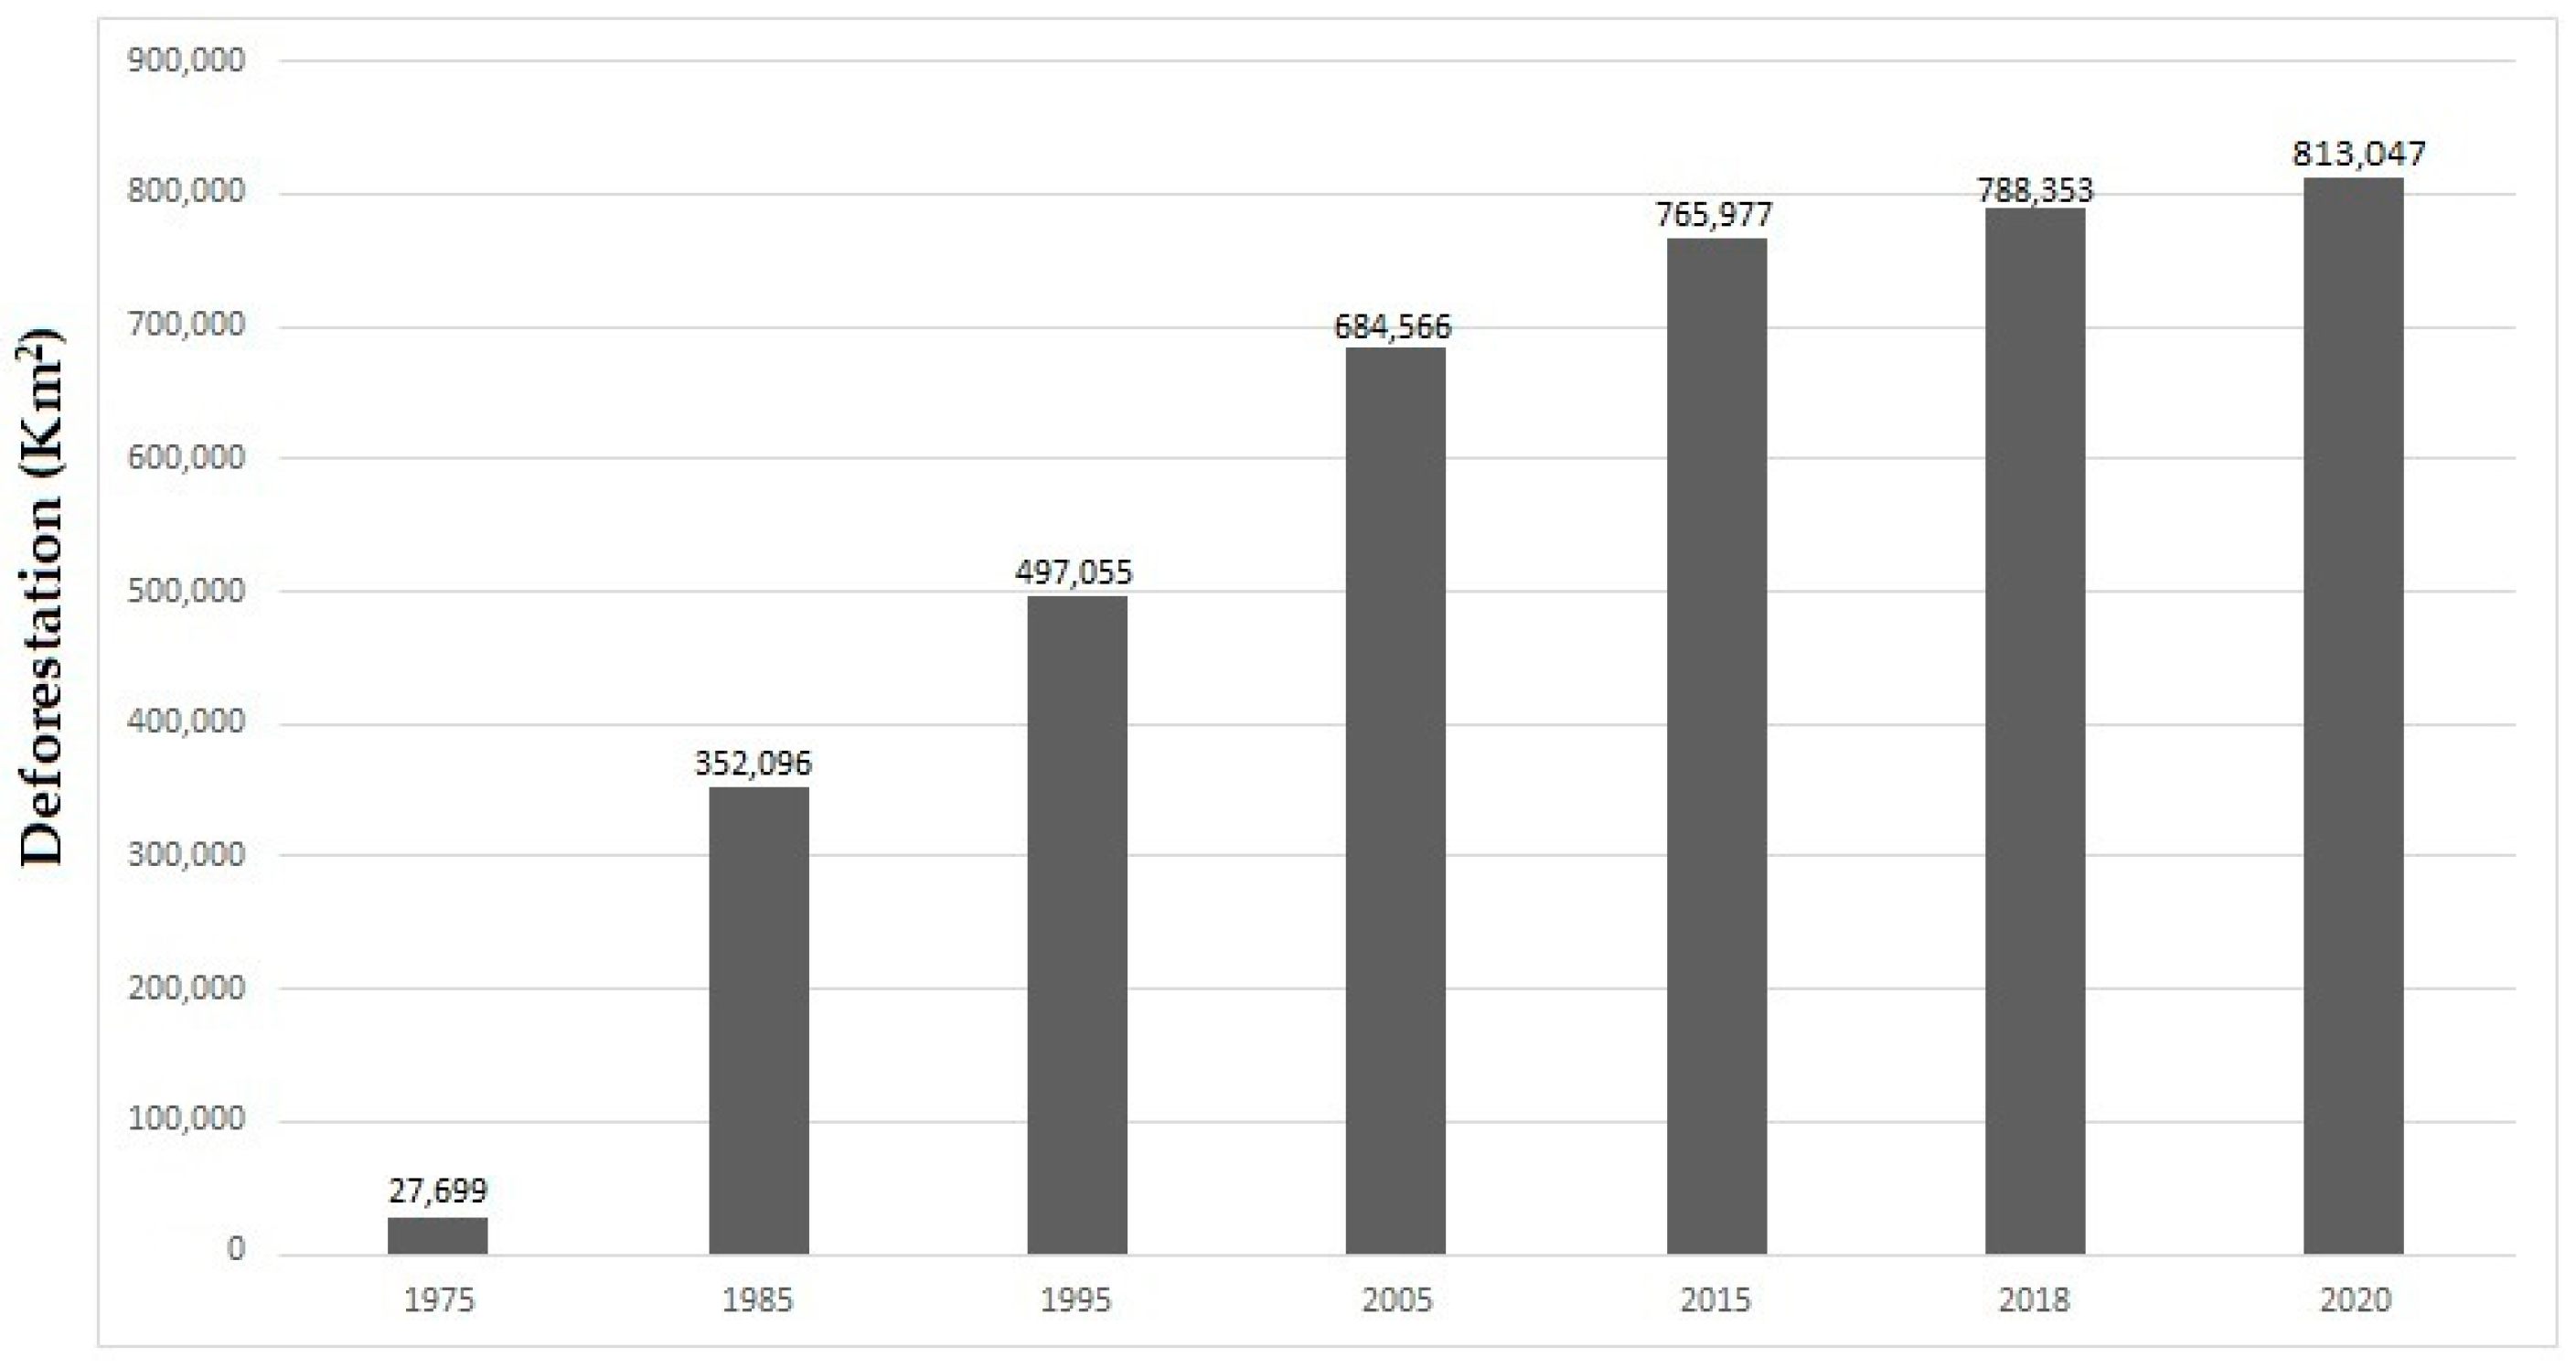
The Brazilian Amazon region’s deforestation history was linked to government actions for the occupation and development of the territory until the 1980s; during this period, deforestation reached about 300,000 km², which is equivalent to 6% of the area total. From 1980 to 2007, over 432,000 km² were deforested, corresponding in total to almost 15% of the Amazon region [37].
Deforestation reached 813,047 km² by 2020 (Figure 6), or 16% of the Brazilian Amazon total area [29]. The vegetation cover of this region is distributed between native forest (63%) and non-forest native vegetation (19%). The rest of the area (2%) is made up of the hydrographic network of rivers and lakes. When considering only the Amazon biome native forest, deforestation claimed almost 20% of the original native forest cover. The Brazilian Amazon region’s total deforestation has increased significantly in recent years, in 2019 and 2020: 10,897 km2 and 9811 km², respectively [21].
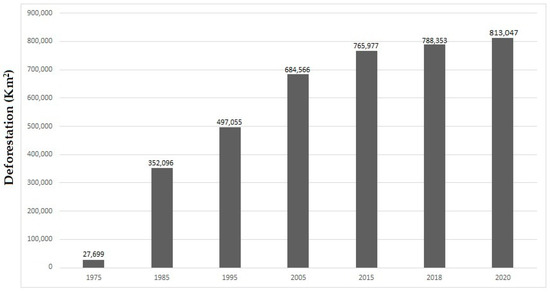
Figure 6.
Deforestation extension in the Brazilian Amazon between 1975 and 2020. Adapted: [27,29].
Pará State had the highest deforestation rate in the Brazilian Amazon, with 4536 km² in 2020. In addition, this state has led with this rate since 2006, which was the year it surpassed deforestation in Mato Grosso. In accumulated terms, Pará (276,700 km²), Mato Grosso (219,900 km²), and Maranhão (109,687 km²) were the states with the largest deforested area as of 2020 [21].
The Brazilian Amazon deforestation determinants have been the subject of much literature. The causes investigated fall under the themes of environmental and socioeconomic impacts as well as accessibility. To a greater or lesser degree, all studies consider some type of relationship between agricultural activities and deforestation. In addition to the beef demand, the expansion of grain production, especially soybeans, has also been identified as a factor that applies pressure on the agricultural frontier towards forest areas [37].
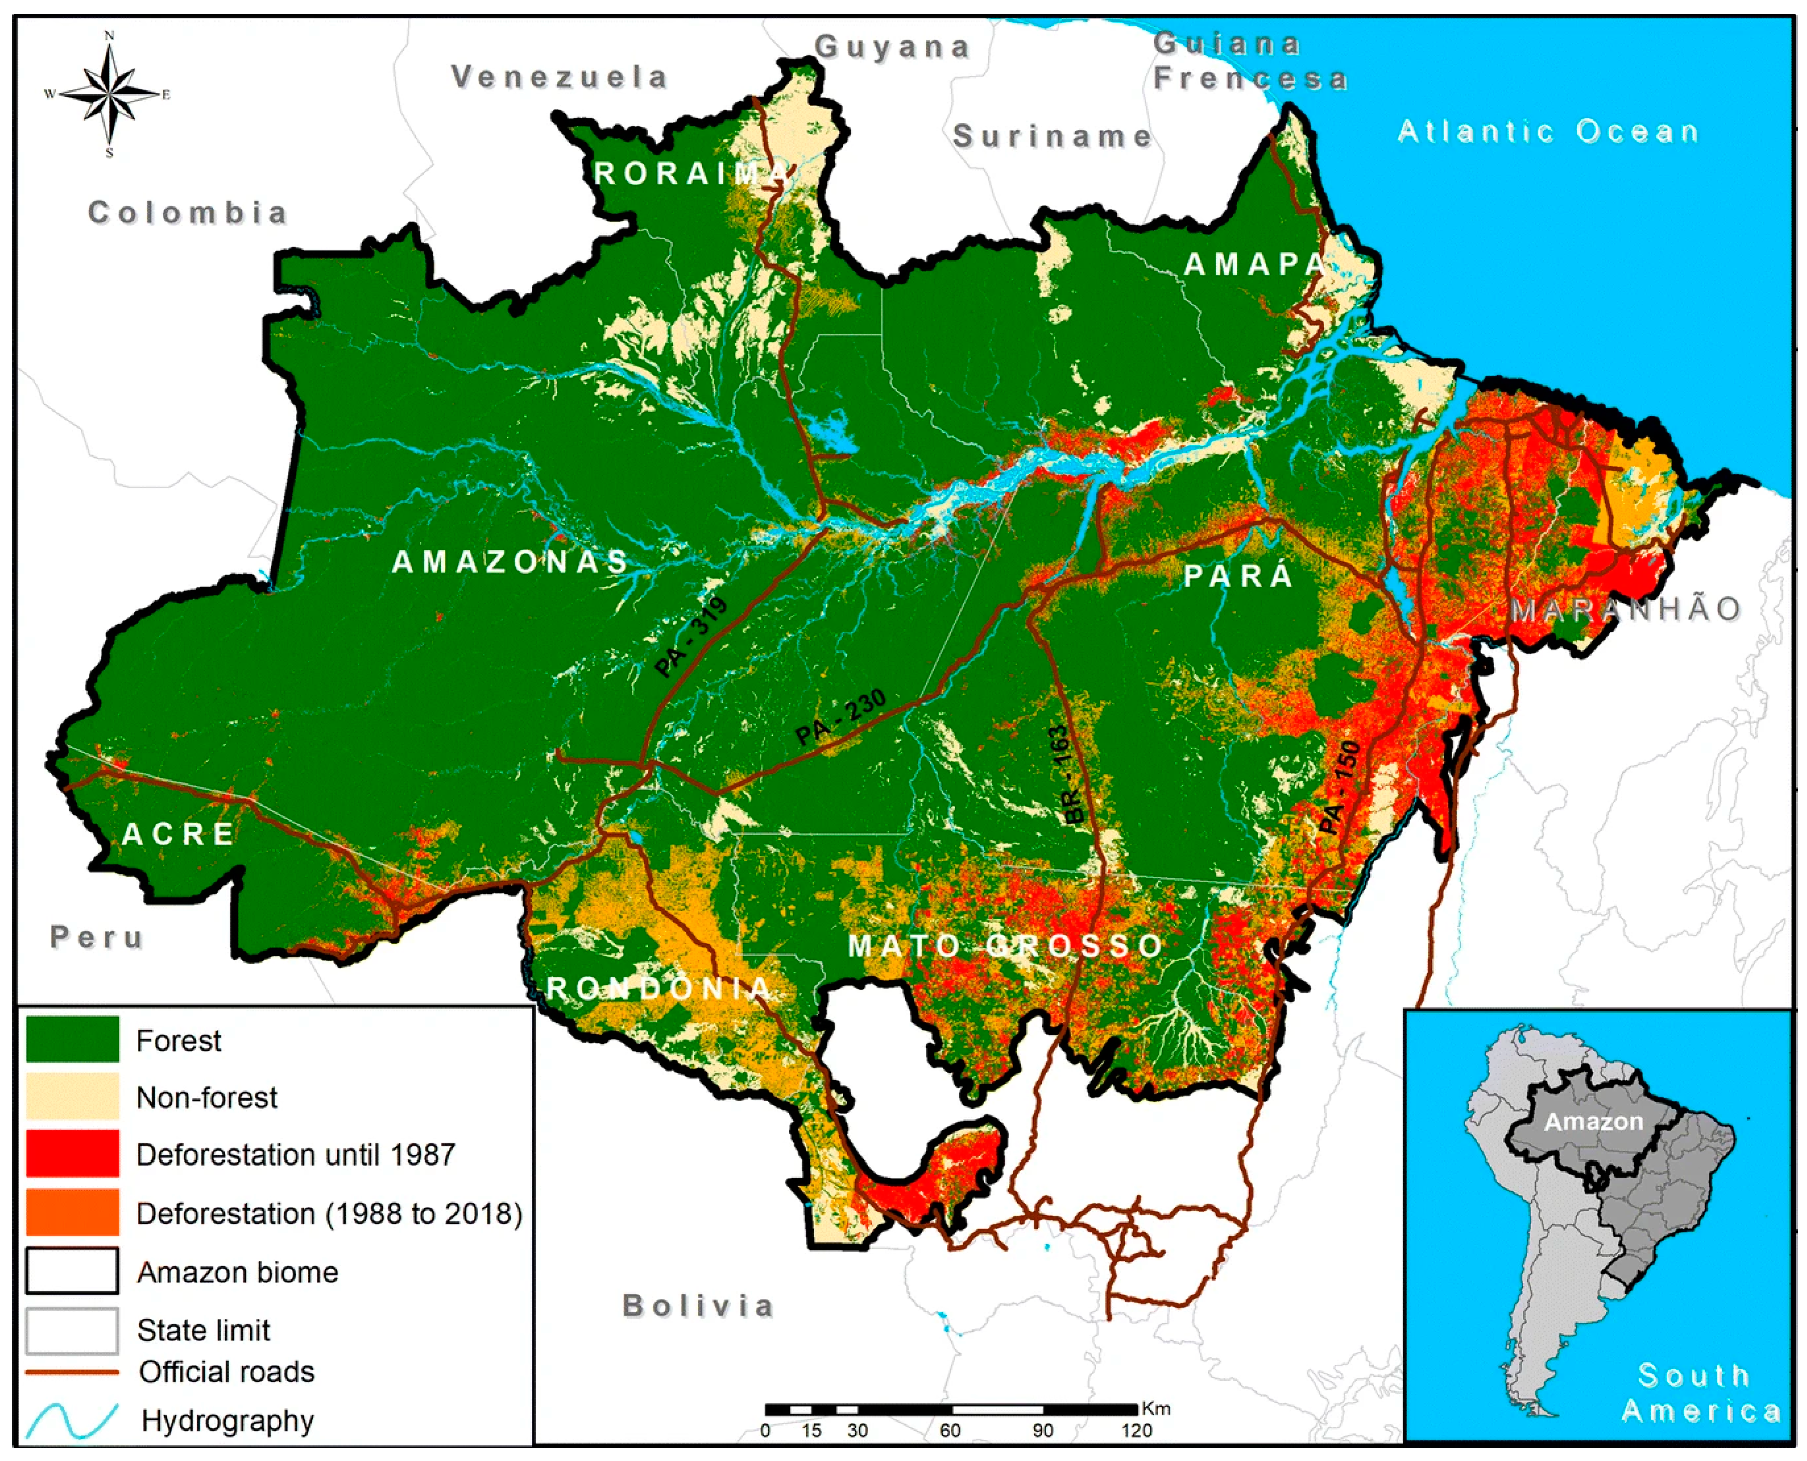
The map in Figure 7 shows forest, non-forest, and deforested areas in the Brazilian Amazon from 1987 to 2018 [27]. Areas already deforested at the dawn of 1987 are shown in red, while the yellow represents the expansion of this deforestation from 1987 to 2018.

Figure 7.
Forest, non-forest, and deforested area in the Brazilian Amazon as of 2018. The deforested area as of 1987 is also distinguished. Source: [27].
The regions with deforestation (red) and those under pressure due to recent deforestation (yellow), mainly in Mato do Grosso (Figure 7), are composed of cities that have high soybean production, as was the case of the Sorriso municipality with GDP per capita USD 17,802.34 in 2018 [20]. Its colonization began in the 1970s and is currently known as the capital of agribusiness and the largest individual soybean producer in the world.
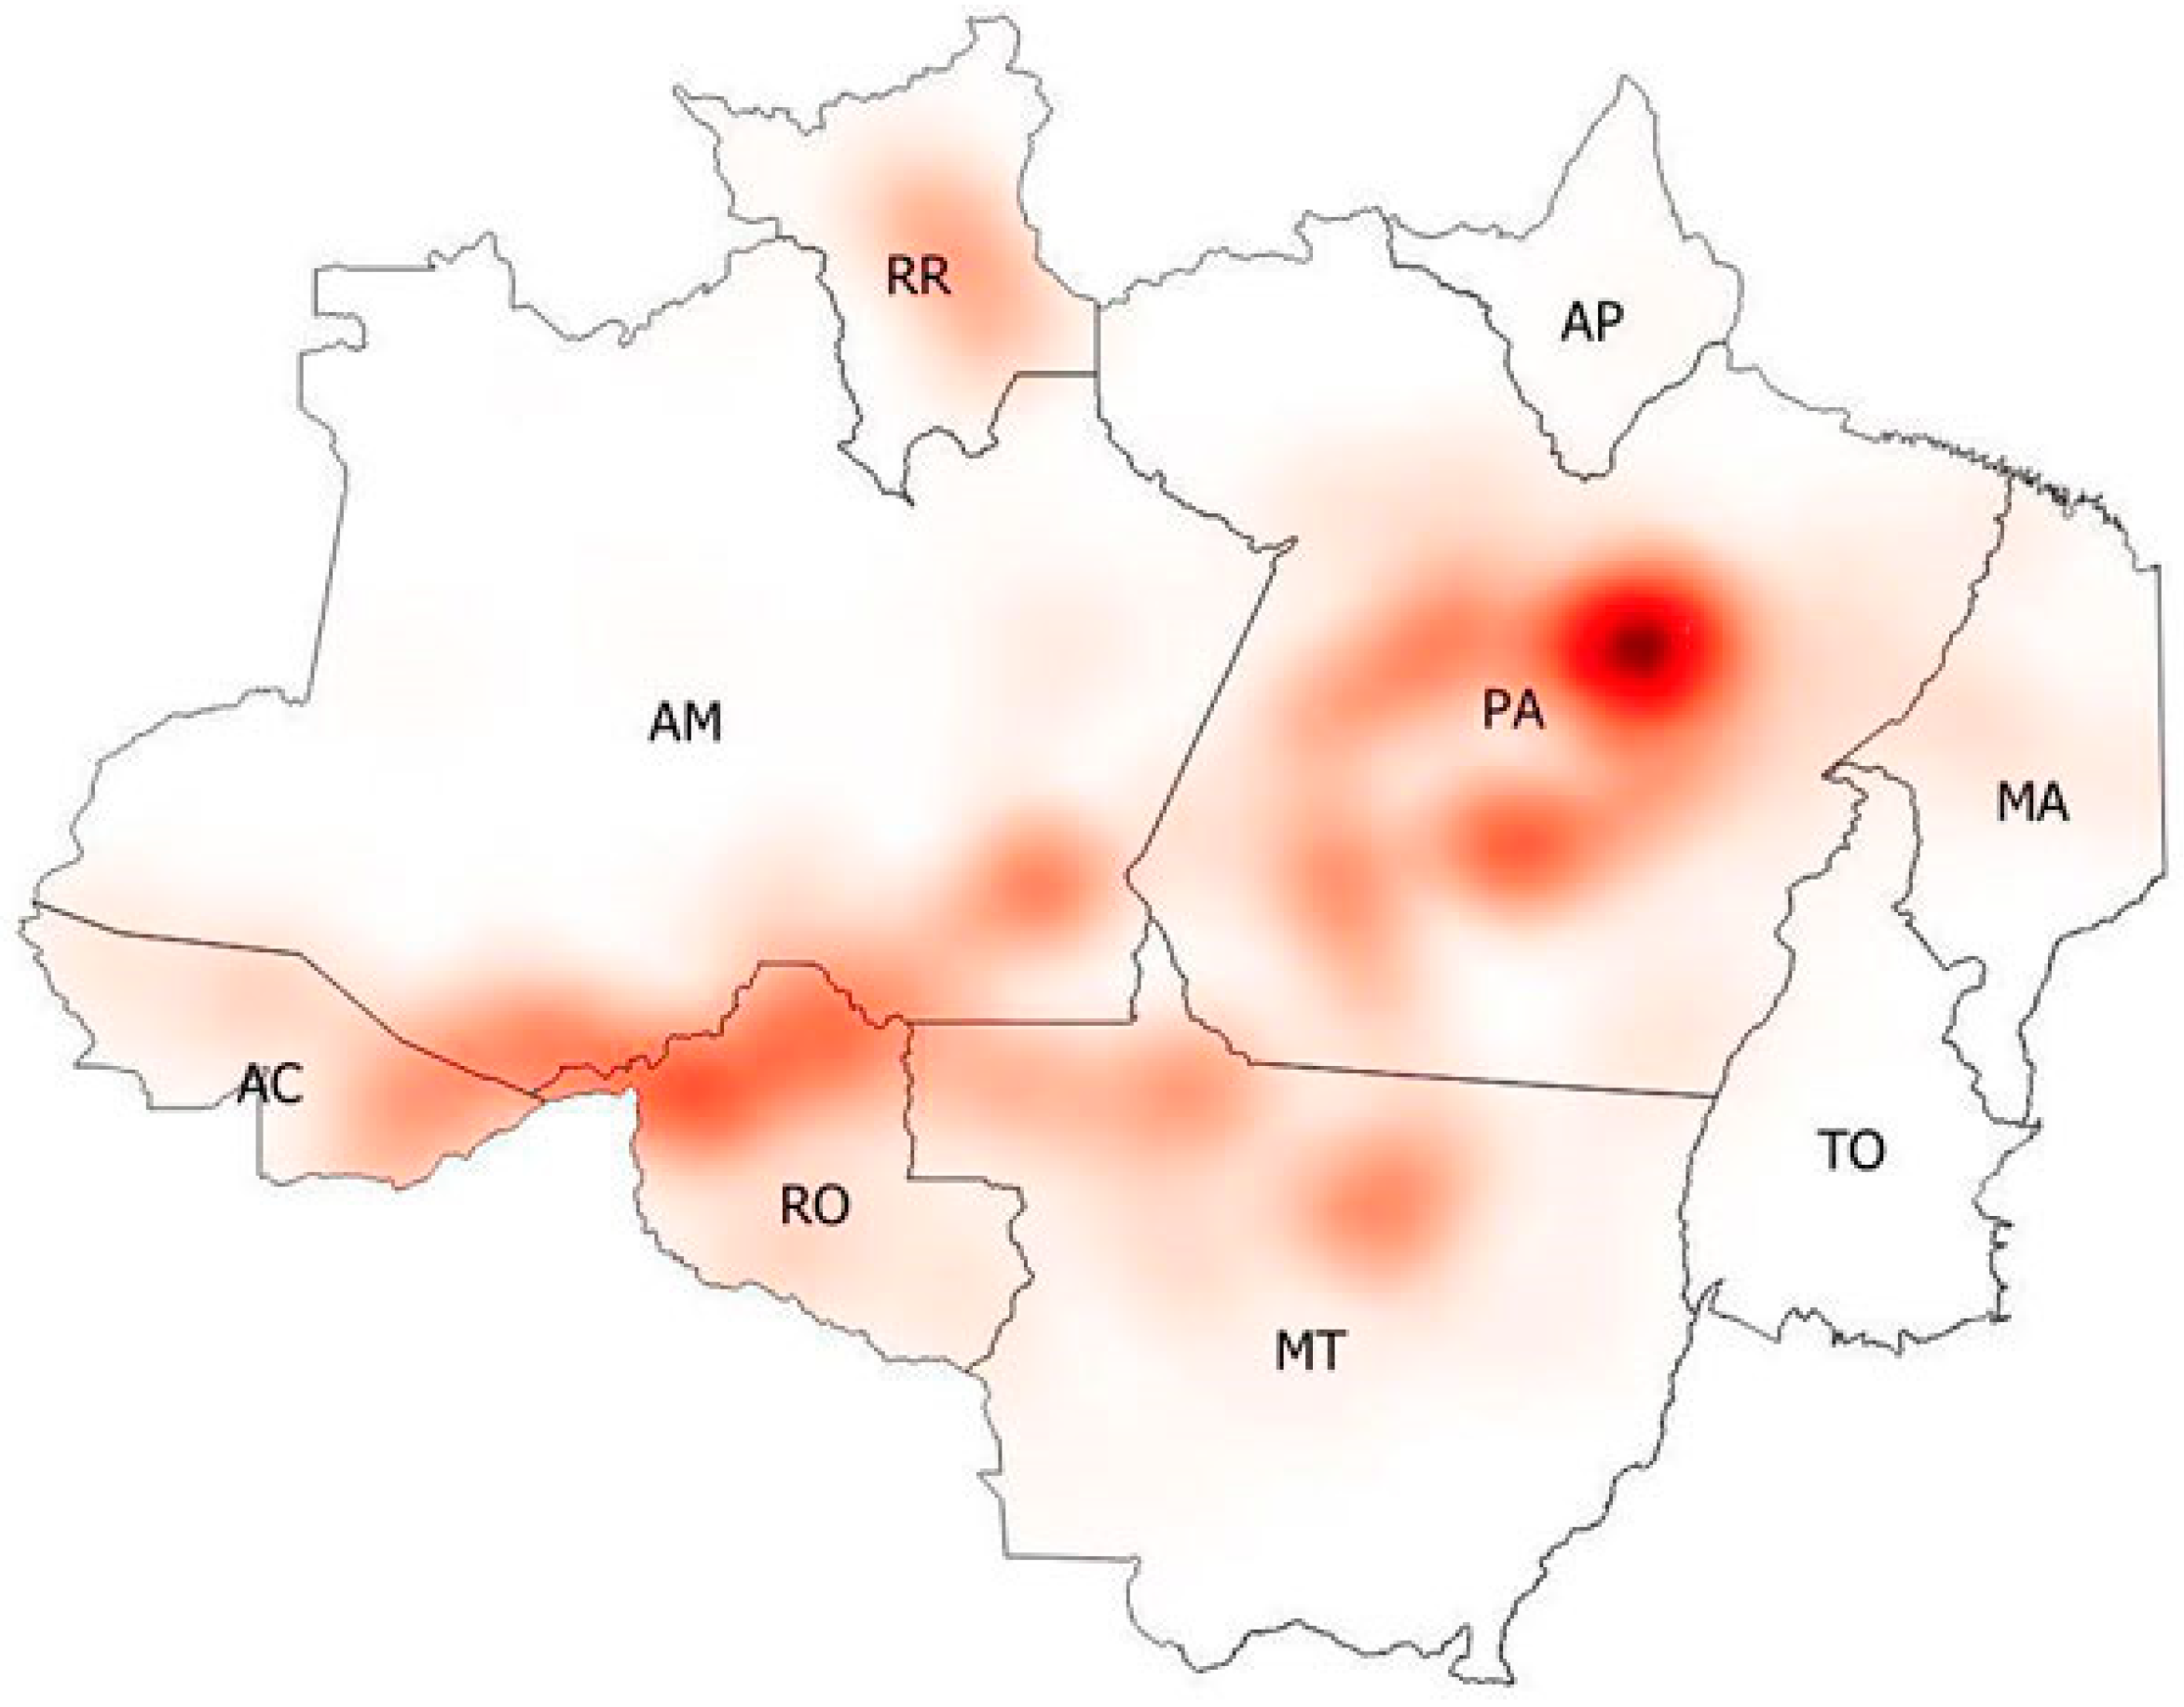
A total of 1.5 million hot spots were detected throughout the Brazilian Amazon between 2010 and 2020. Of this total, 448,897 occurred in forest areas, 334,150 in non-forest areas, and 627,916 in deforested areas [21]. The project for monitoring deforestation in the Brazilian Amazon by satellite (PRODES) used Landsat satellite images (or similar) to record and quantify deforested areas larger than 6.25 hectares, as shown in Figure 8, which presents the heat map for deforestation occurrences.

Figure 8.
Heat map of deforestation occurrences identified in PRODES 2019, in the 229 scenes that make up the Brazilian Amazon. Source: INPE (2020), PRODES (2020).
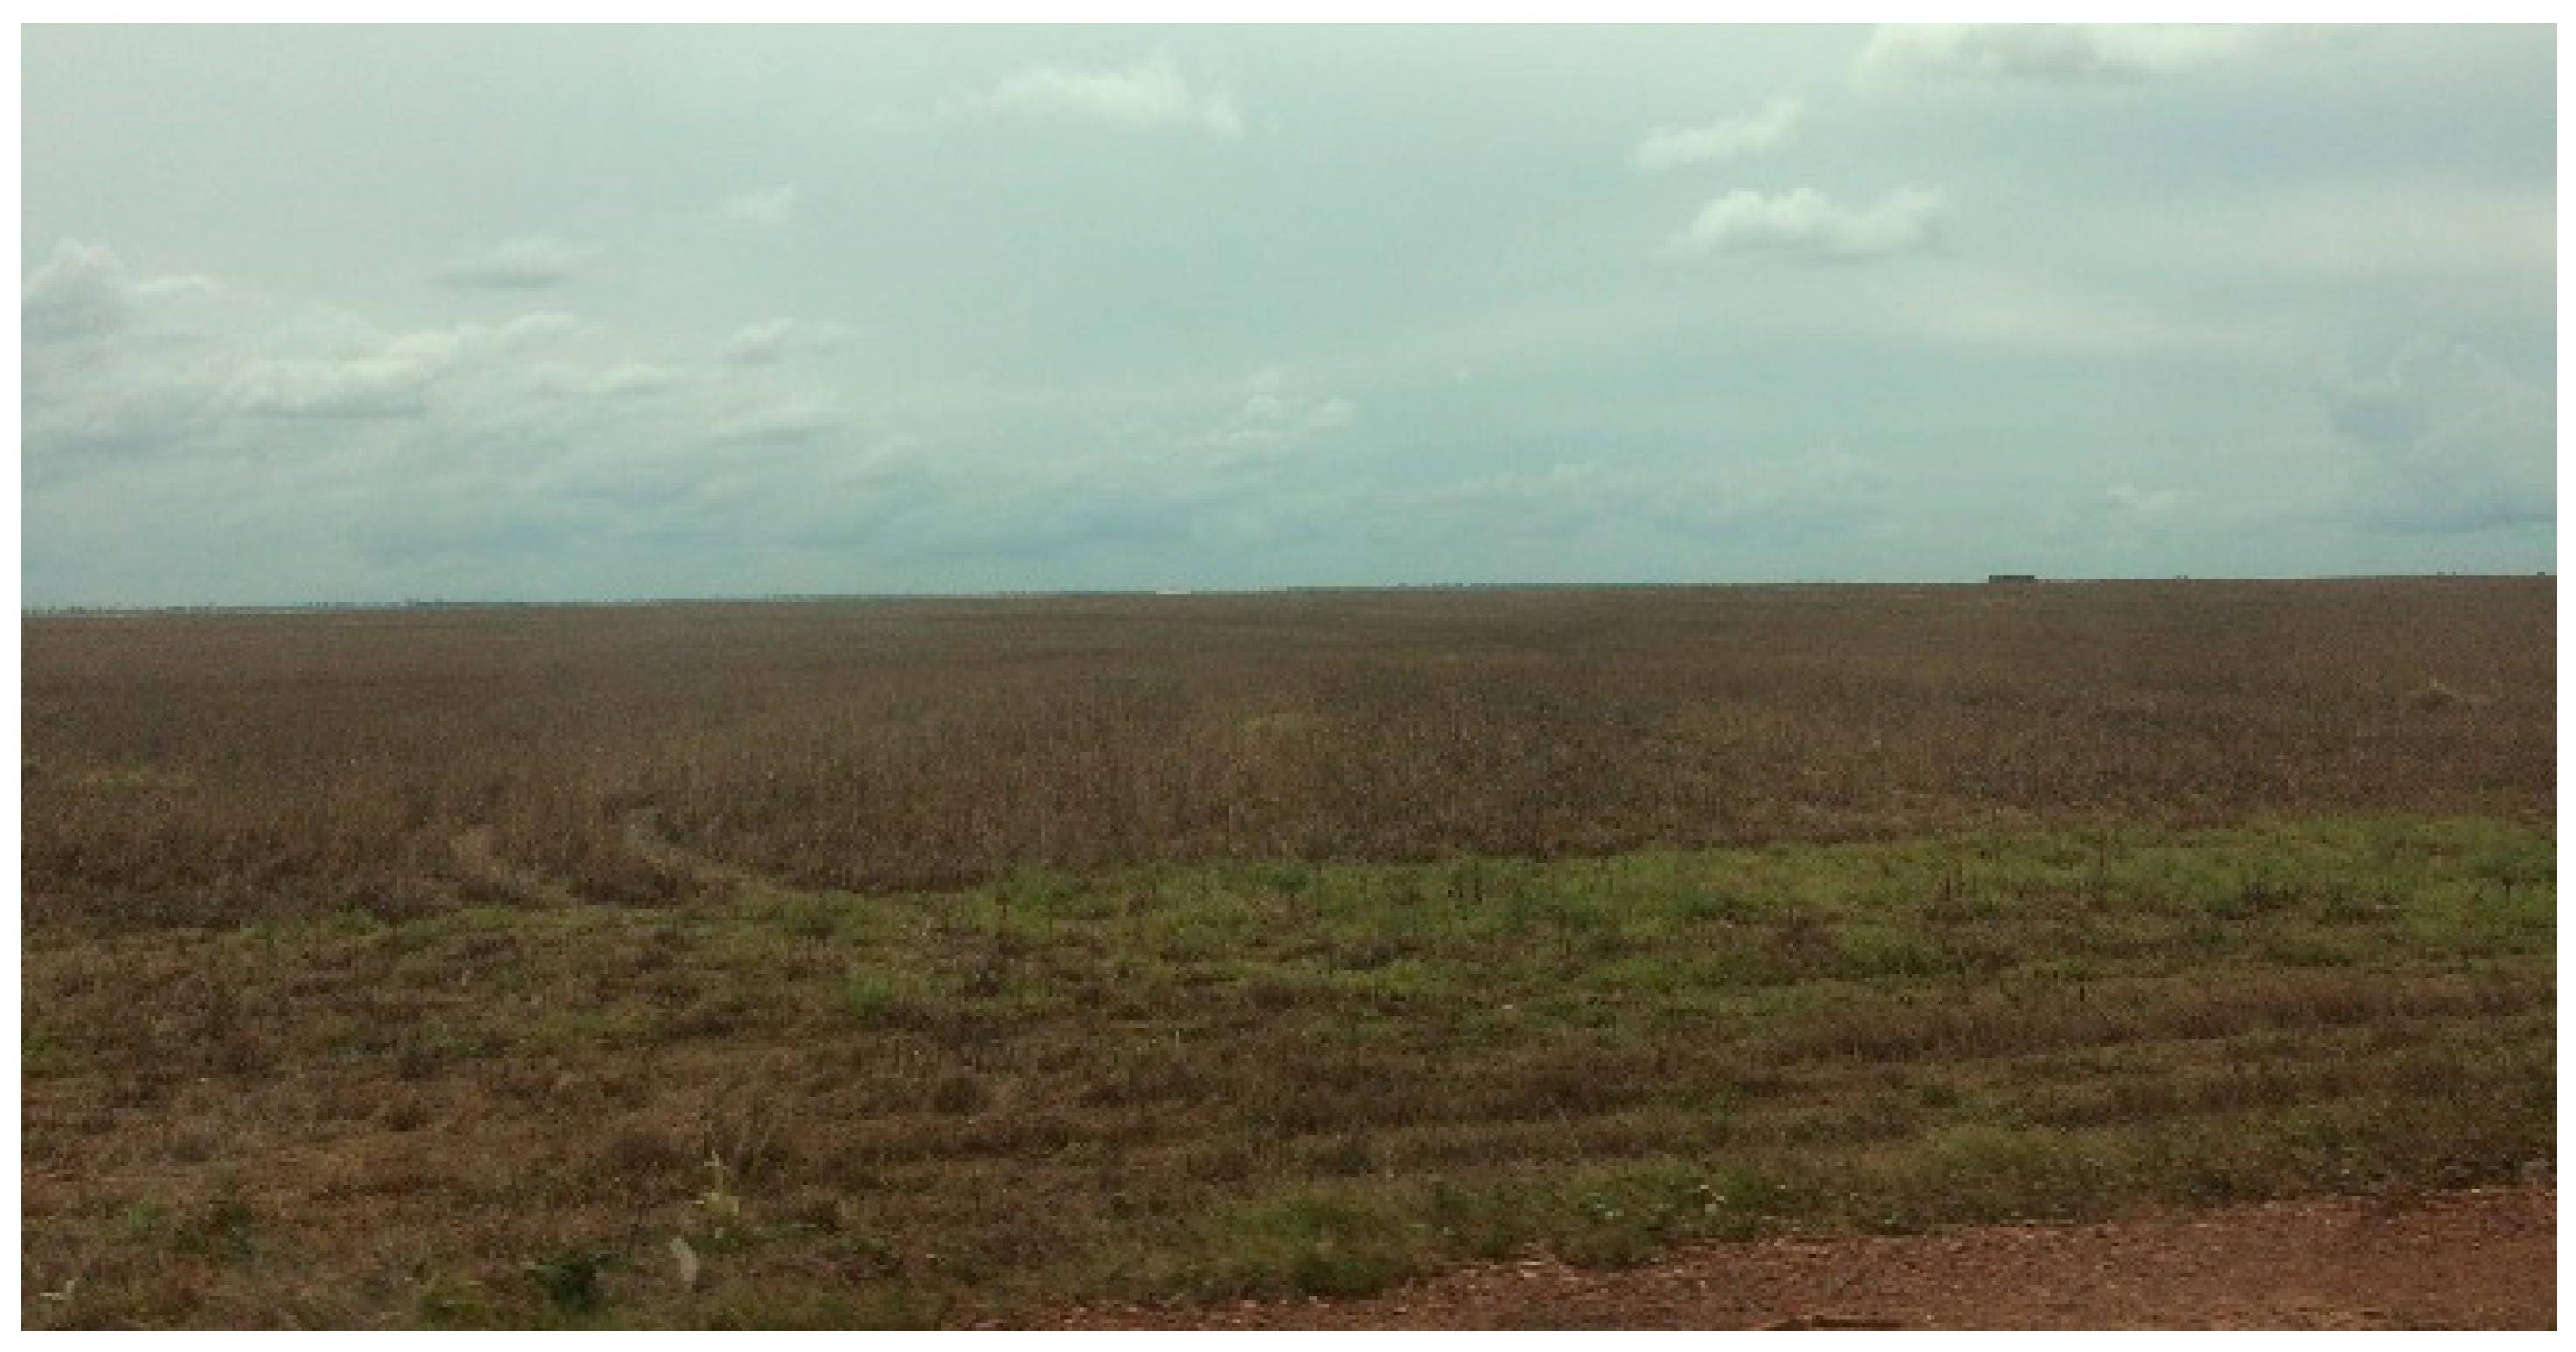
The total emissions of greenhouse gases (GHGs) reached 1.14 gigatons of CO2eq (carbon dioxide equivalent) in the Brazilian Amazon in 2019, and of these, 76% were related to land-use change (mainly deforestation and fires). Figure 9 shows photos of deforested areas destined for soybean planting along the federal highway BR-153 in January 2021.
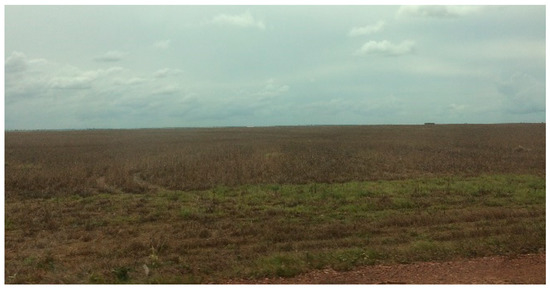
Figure 9.
Landscape change: burnt areas destined for planting soybeans along the federal highway BR-153 in January 2021. Prepared by the authors.
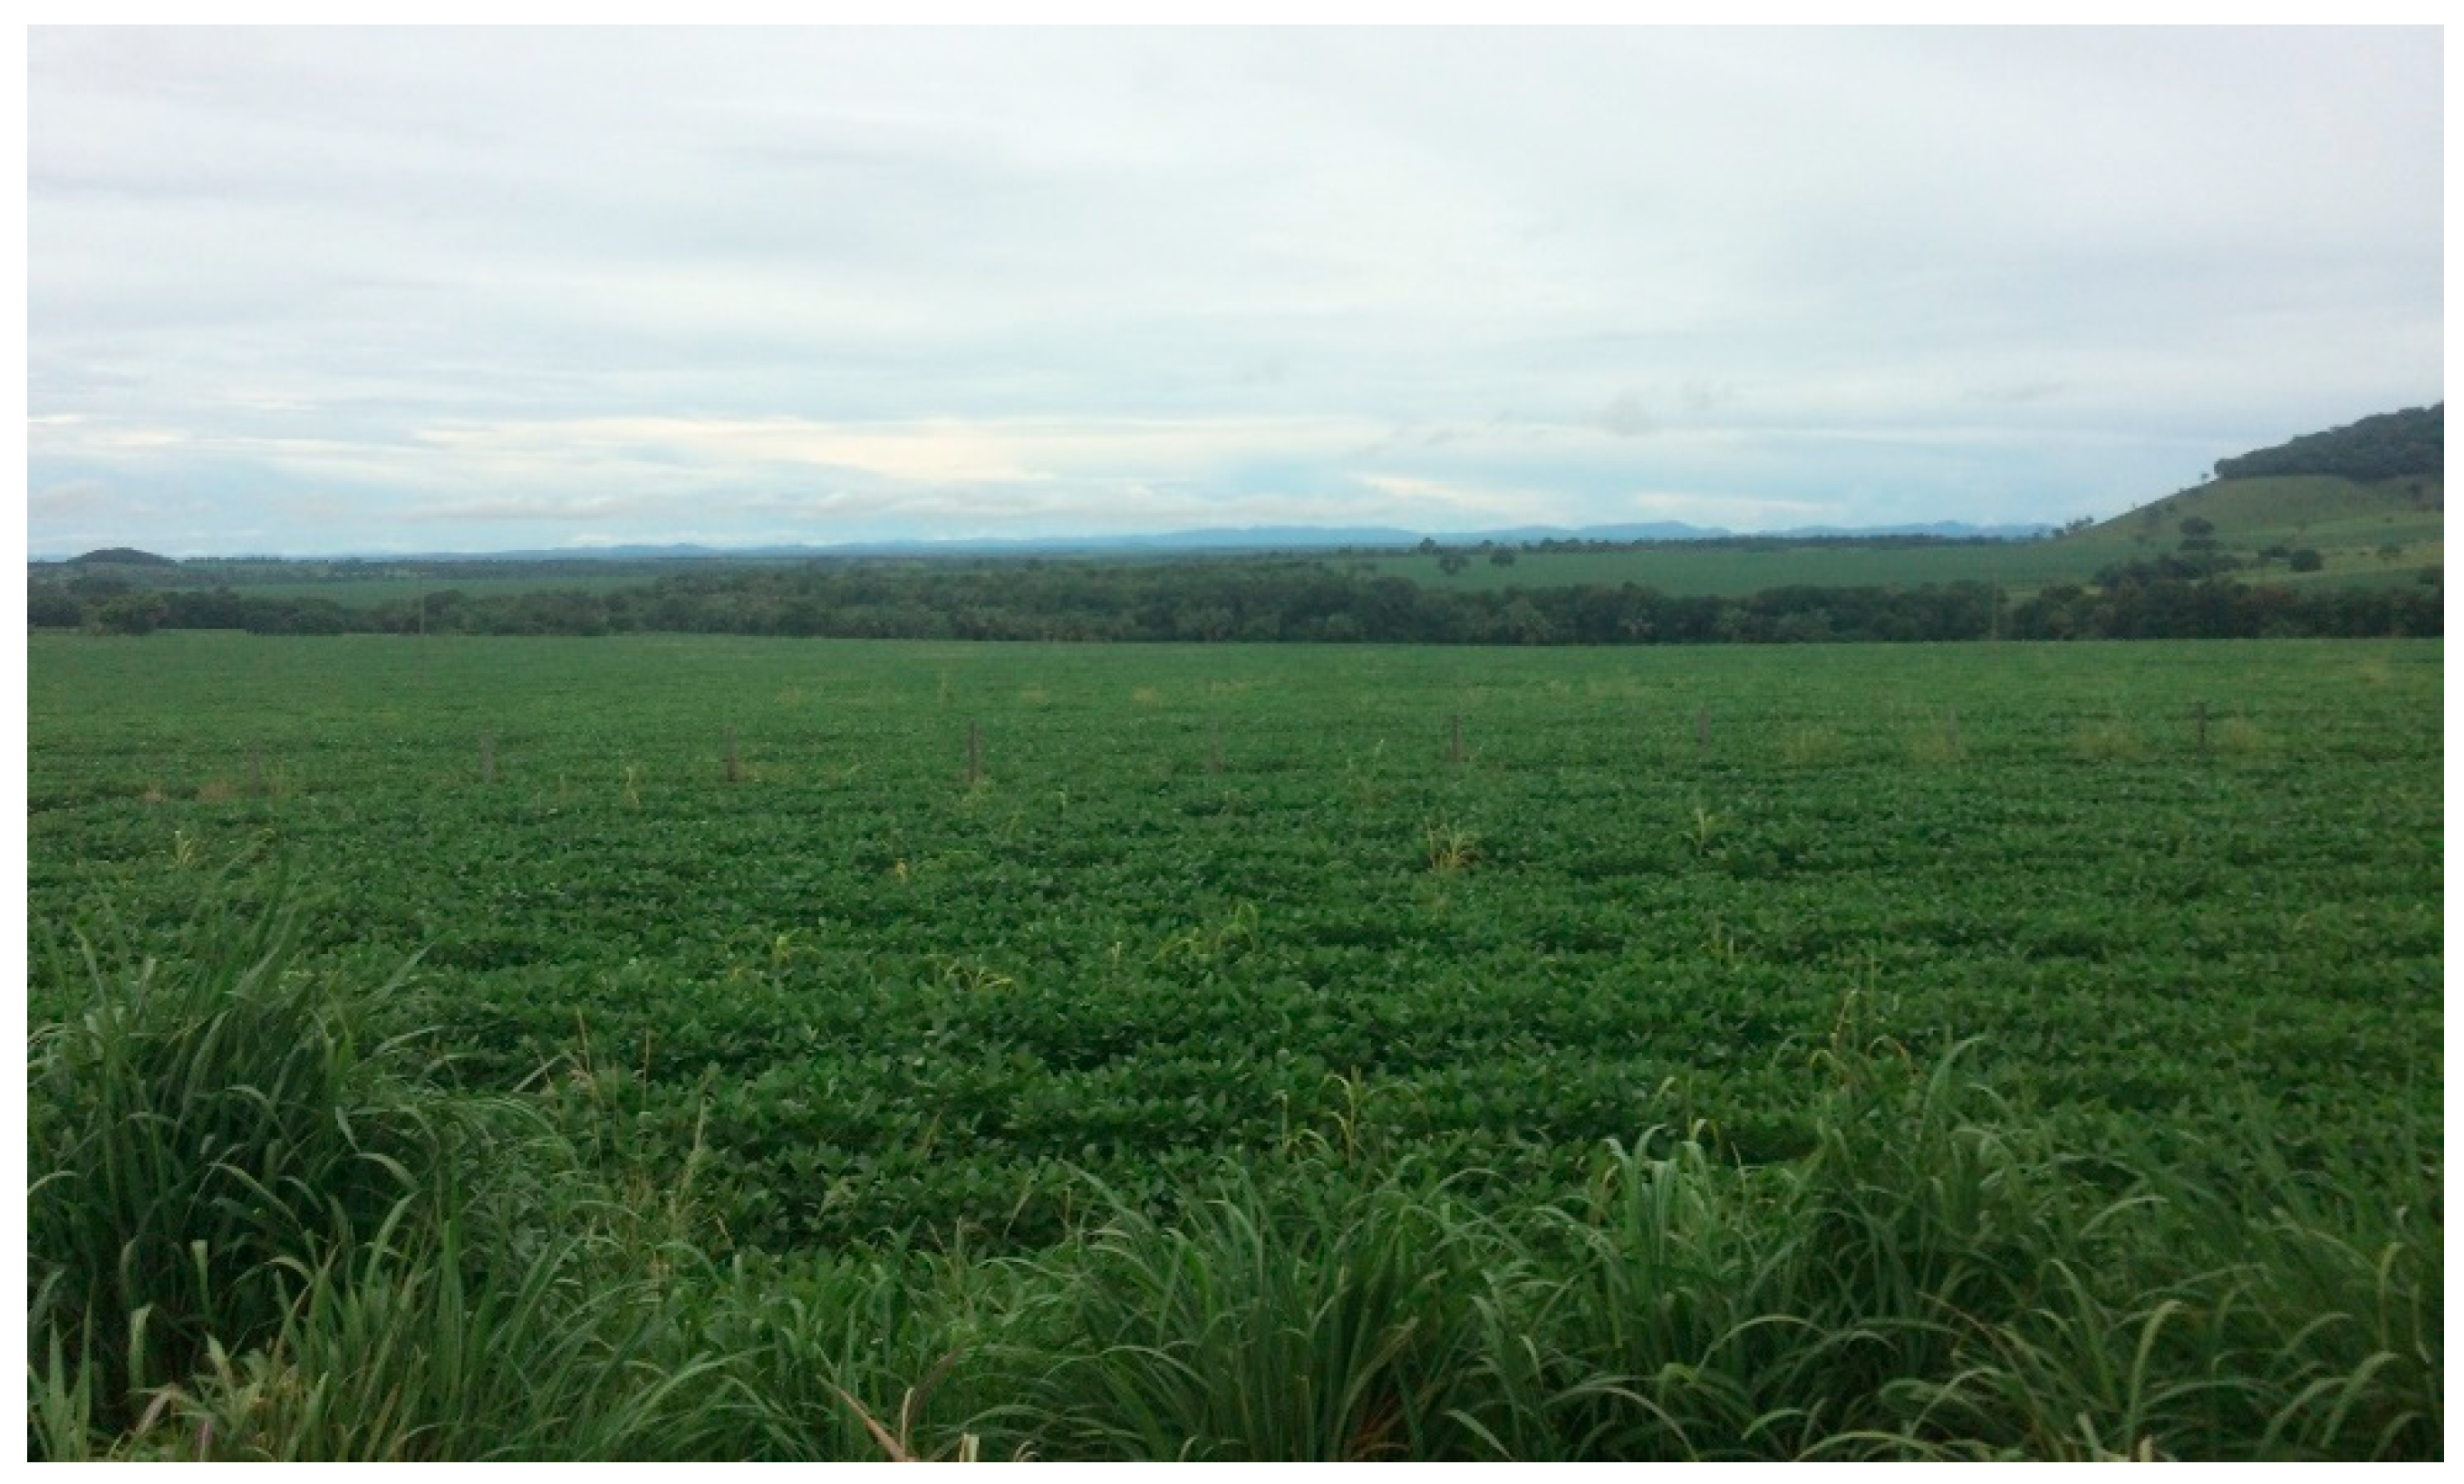
The areas that were planted with soybeans, both in the 1990s and in 2001 in the Brazilian Amazon region, was due to the conversion of “degraded (areas with a marked decrease in ideal agricultural productivity)” pastures rather than virgin areas. The Brazilian Amazon region’s soybean expansion occurred abruptly, invading areas previously dedicated to other crops and spread into virgin forests. During the 1990s, soybean production continued to expand, consolidating in the Brazilian Amazon. Mato Grosso is the country’s largest soybean producer (Table 6). Soybeans have taken the place of the Amazon’s forests and abandoned pastures, where new municipalities have started to produce grain, mainly in Rondônia, Pará, and Maranhão [9]. The soybean expansion has been changing the Brazilian Amazon landscape. Figure 10 shows a soybean plantation photo taken along BR-153 in January 2021.
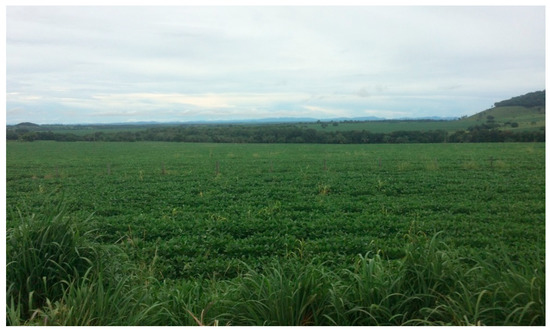
Figure 10.
Soybean plantation along BR-153 in January 2021. Prepared by the authors.
Greenhouse gases (GHGs) total emissions reached 1.14 gigatons of CO2eq in the Brazilian Amazon in 2019, almost double that of 2010 (i.e., 656.1 megatons of CO2eq). The 455.08 megatons of CO2eq were removed in the region in 2019, as can be seen in Table 11. Pará State was the largest emitter in 2019, with 400.59 megatons CO2eq, followed by Mato Grosso at 230.23 megatons CO2eq, and both states have had great prominence in agribusiness.
Table 11.
GHG emission and removal in the states of the Brazilian Amazon in 2019. Source: [21].
3.3. Social Characteristics
The pioneer fronts’ expansion towards the tropical forest caught the attention of national elites who were interested in opening new territories of resources and market opportunities. The frontier expansion movement was driven by the increased agricultural products demand for domestic markets and to meet the primary resources export basket, such as wood, ore, extractive products, and agribusiness [38].
The national geopolitical strategy for the available land use has not nullified the land ownership contradictions as a social relationship that characterizes the country. In this context, there has been two fundamental tension fields: the border areas constituted by the “pioneer front” transformation and where access to land takes place through possession; and the “expansion front”, which has been characterized by private land ownership [4].
The violence and border conflicts that advance on territorial, social, and ethnic rights have already been established in these areas, and to the detriment of the old territories’ occupation, the planning discourses have reproduced the colonial idea of demographic-void. These conflicts have defined the image of these borders as violent places with slave labor, announced political deaths, and massacres. All these violence-related facts are a result of tensions over land issues, disputes over land and resources, the pressure to evict those who had already been there, and the greed for new land through land grabbing [38].
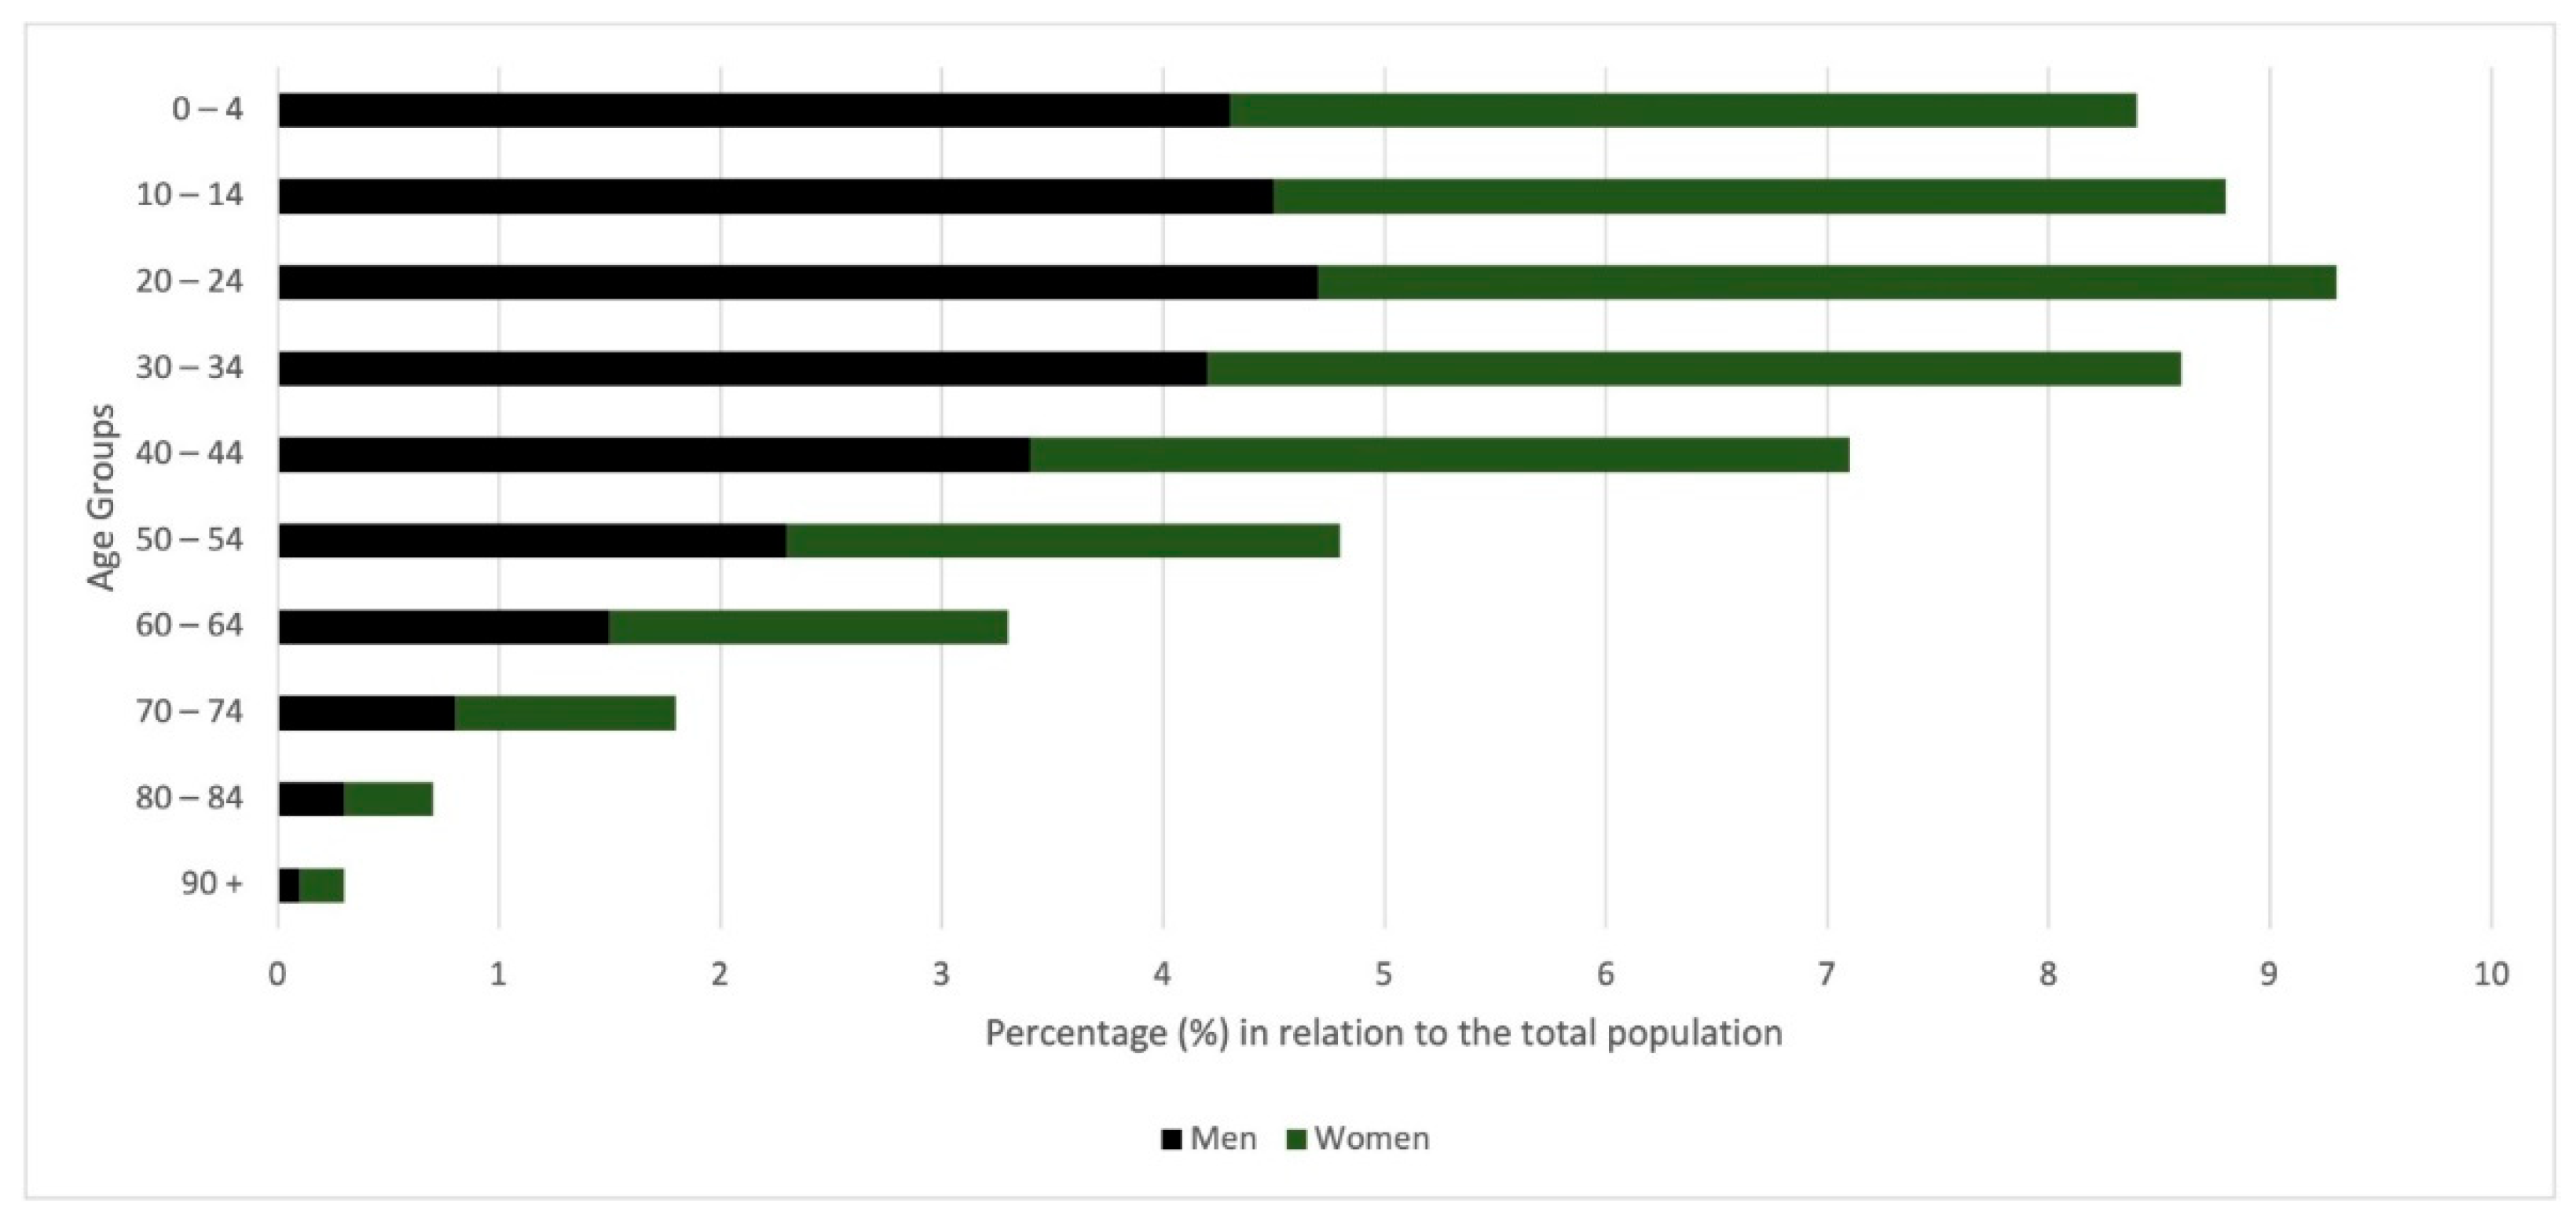
The Brazilian Amazon population, originating from the colonization process of the last decades, is still young (Figure 11), and with a demographic concentration below thirty years of age, it has more people of working age than the dependent population. The population in 2010 was predominantly brown (64.75%), white (25%), and black (8%) [21].

Figure 11.
Brazilian Amazon age pyramid by sex, 2020. Source: [21].
The region will still benefit from a demographic bonus for longer than the rest of the country due to its late demographic transition, which was the result of slower declines in fertility. With a relatively younger workforce compared to the rest of Brazil, the Brazilian Amazon had, in 2019, 57% of people between 18 and 24 years old, and 40% of those between 25 and 29 years old without any occupation. In this last age group, the occupancy rate was ten percentage points below that of the rest of Brazil [24].
The population concentration and demographic density in 2020 in the Brazilian Amazon states can be seen in Table 12. Pará State was the most populous with 8.69 million inhabitants, followed by Maranhão at 5.91 million and Amazonas at 4.2 million [21].
Table 12.
Area, population, and municipalities number in Brazilian Amazon. Source: [21].
Brazilian Amazon’s total population has been estimated at 28 million inhabitants, approximately 80% of whom reside in cities. Brazil data census showed a general trend towards urbanization in all regions of the country and revealed a trend towards urbanization since 1980, with a significant increase in urban growth rates in all states [38].
Between 2000 and 2019, there was a mismatch between the population growth rate of 9.92% (Figure 3) and the harvested area that increased from 83,961 km2 in 2000 to 224,445 km2 in 2019 (a 264.7% increase) [12]. This same period saw these populations displaced to cities due to monoculture introduction, such as soybean cultivation, through mechanization and the use of genetically enhanced fertilizers and seeds, which was in addition to the massive expansion of landholding [9].
The typical method of soybean production does not include concerns about having enough field labor and does not add value to production since it is predominantly monoculture and involves minimal labor. It is typically mechanized and modernized with genetically enhanced seeds and fertilizers in large quantities and favors land concentration [9].
This practice expels the population from the countryside, leading to an increase in rural exodus and disorderly growth in cities. Large companies occupy spaces in the countryside previously occupied by diversified and local cultures, reducing employment and the capacity to produce traditional foods, which, in the process, compromises the population’s food security. This transition has led to an increase in the displacement of small farmers due to social conflicts or due to the purchase of land, resulting in the expulsion of tenants [9].
The Brazilian Amazon offers employment and income indicators that, as a rule, have been more precarious than those in the rest of Brazil and that are particularly hostile to young workers aged 18–29. The casual employment rate is almost 20% higher than in the rest of the country. In 2019, more than half of those employed (58%) did not have a formal contract or were self-employed without contributing to social security. In the rest of Brazil, this percentage was 38% [24].
The Brazilian Amazon employs more workers in the agricultural sector than in the rest of Brazil. In 2019, it employed 17% of the employed population in the Brazilian Amazon while in the rest of Brazil, it employs only 8%. However, only 1.2% of the employed workers were involved in forestry production. Although this percentage is much higher than the 0.3% observed in the rest of the country, it was still far below the region’s potential. However, in the Brazilian Amazon agricultural and forestry production sectors, there have been more casual workers: only 16% of workers had formal contracts, as compared to a formalization rate of 47% of those employed in this activity in the rest of Brazil [24].
4. Analysis of Indicators
The indicators identified in Section 3 were variables defined to measure aspects related to social, economic, or environmental factors to guide decisions on a particular phenomenon of interest. This analysis identified possible correlations between the economic growth indicators in the Brazilian Amazon, highlighting soybean production, and environmental and social indicators. We initially built a correlation chart from the databases identified in Table 13.
Table 13.
The data sources for the Legal Amazon indicators analyzed.
The correlation chart was a cartesian graph in which each axis corresponds to the correlated variables. The dependent variable (y) lies on the vertical axis, and the abscissa axis is reserved for the independent variable (x). The ordered pairs form a point cloud. The geometric configuration of the correlation chart can be associated with a straight line (linear correlation), a curved line (curvilinear correlation), or even have the points dispersed in such a way that they do not define any linear configuration; in the latter situation, there is no correlation [31].
The assumptions of Pearson correlation are as follows: continuous variables, absence of outliers, and linearity of the relationship between the two variables. Graphically, the linearity was observed between the analyzed variables and the absence of significant outliers. Furthermore, the observed values need to be distributed normally. There are different tests to estimate the normality of data distribution. Although there are various methods for normality testing for a small sample size (n < 50), Shapiro–Wilk test has more power to detect nonnormality and this is the most popular and widely used method [39]. The Shapiro–Wilk test is a test of normality in frequentist statistics. This test will return test statistic W, which will have an associated significance value, the p-value. To say that a distribution is normal, the p-value must be greater than 0.05 [40]. The p-value and for each analyzed variable can be seen in Table 13.
Economic indicators are specific objects to be measured, such as production, prices, income, employment, and investment. The subtle relationships between them must be perceived if they are to be used to predict economic developments [41]. GDP has been widely accepted as the leading macroeconomic performance indicator. GDP per capita is a financial metric that analyzes a country’s economic output per capita and is calculated by dividing the country’s GDP by its population.
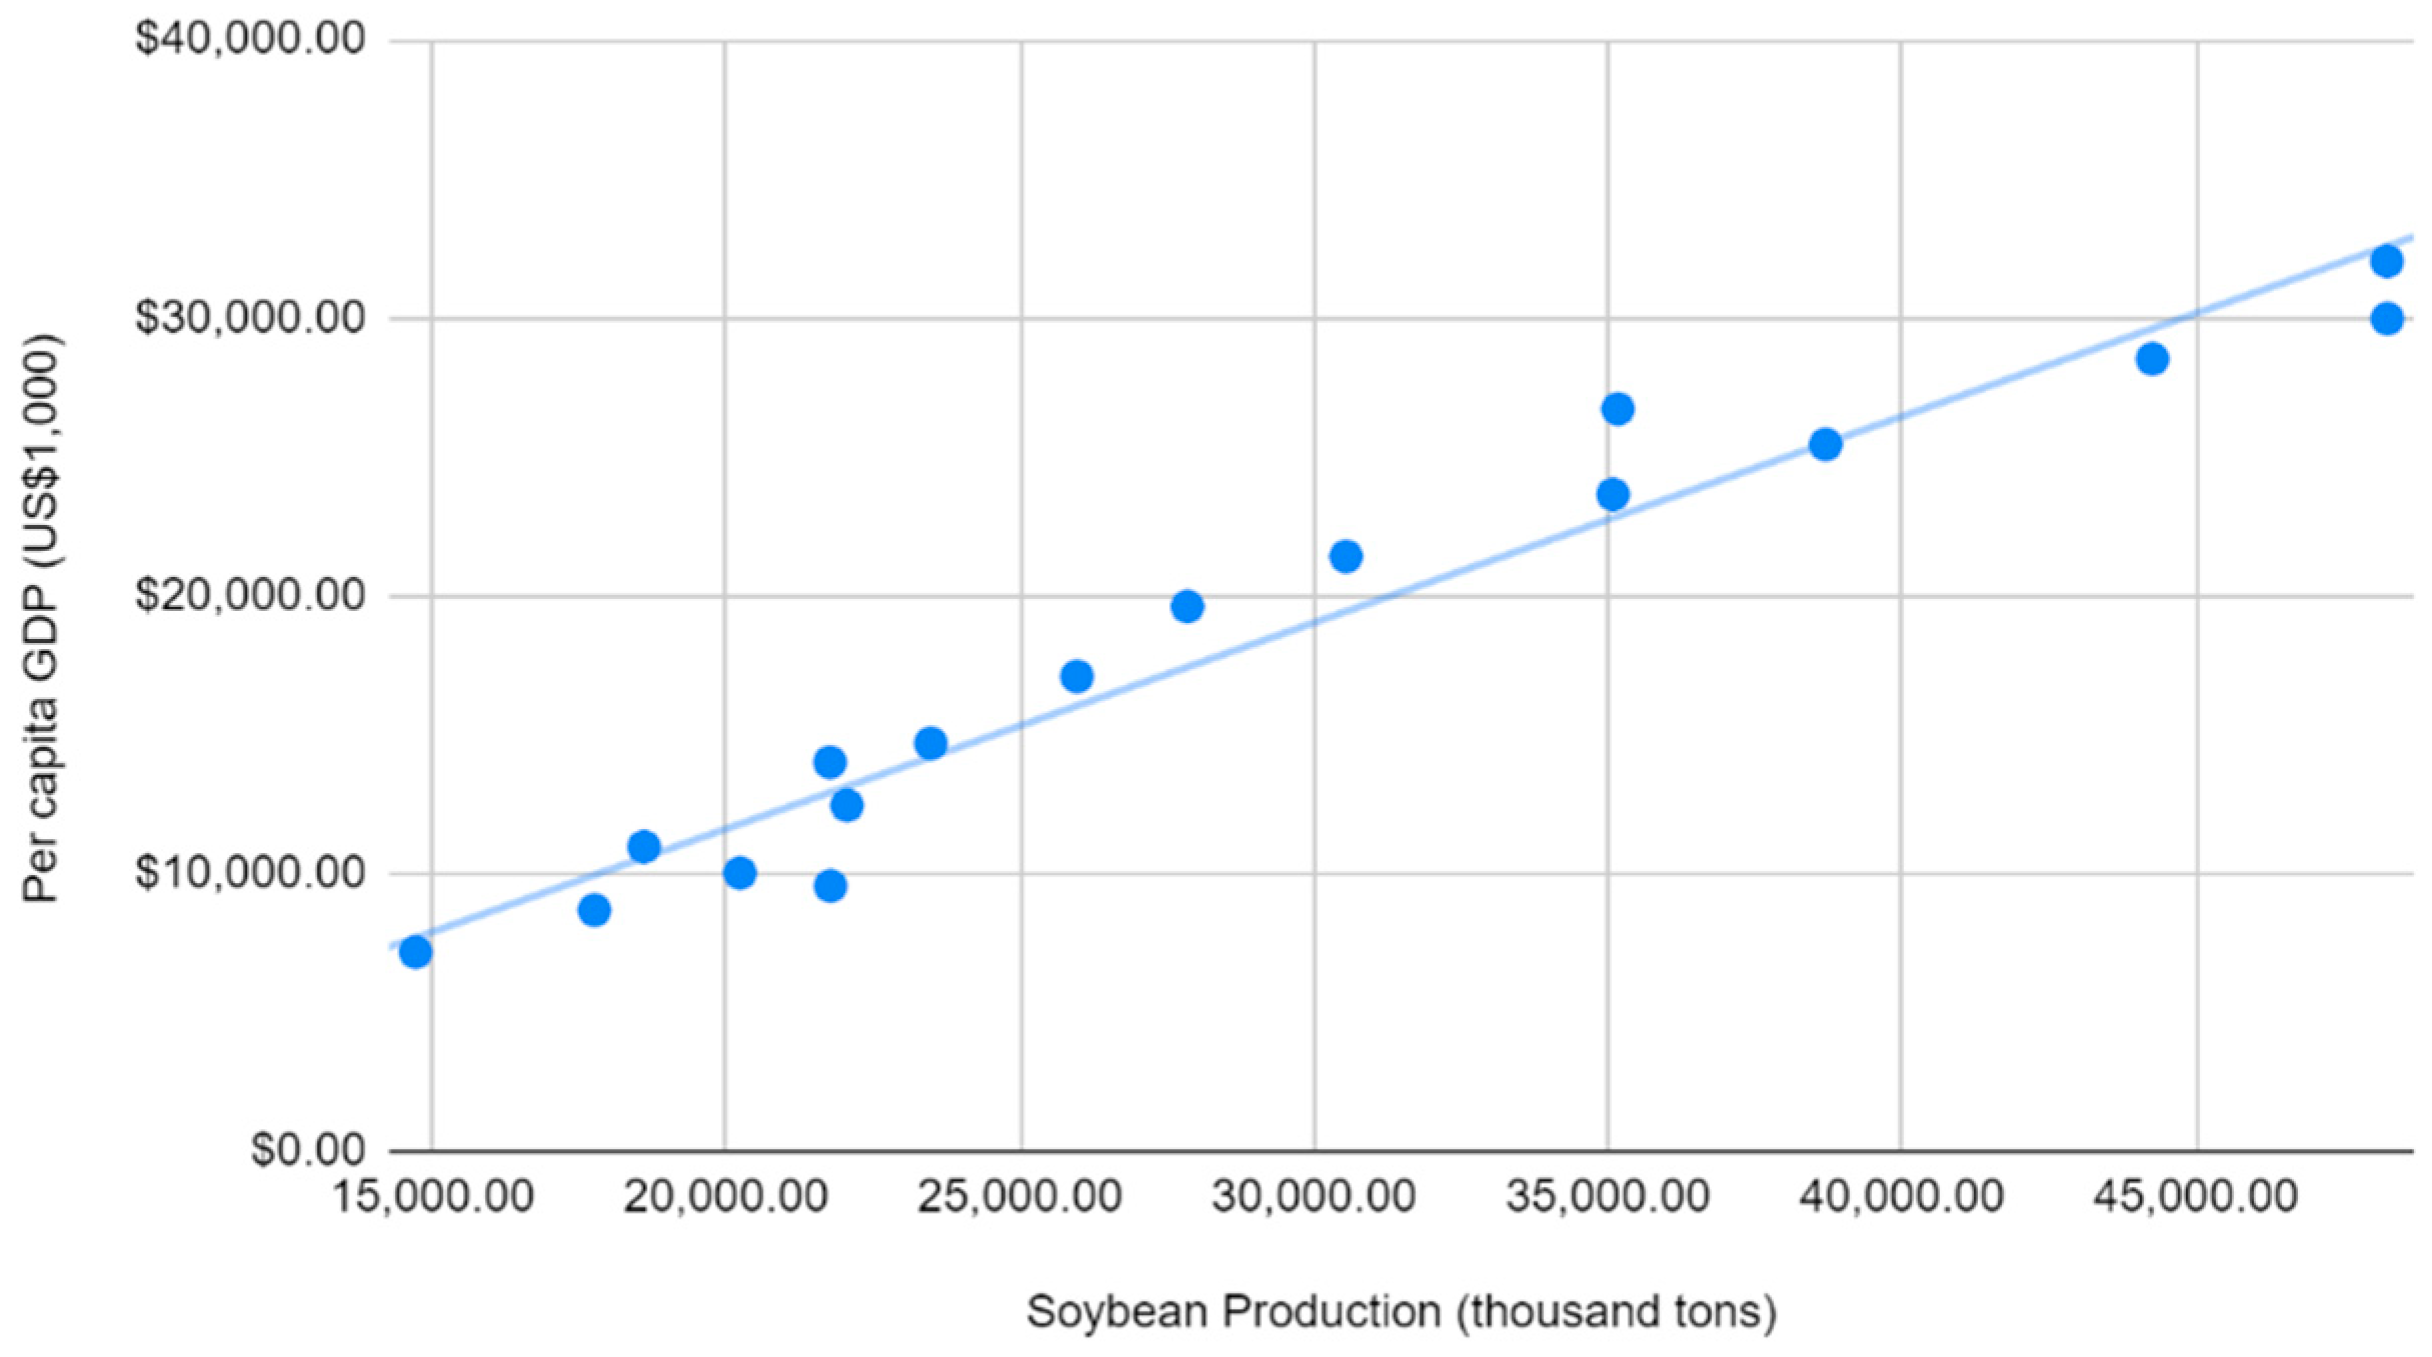
The correlation of soybean production indicators (thousand tons) and the GDP per capita (USD 1000) in the Legal Amazon between 2002 and 2018 (Figure 12) showed a strong positive correlation of r = 0.98 and a determination coefficient of = 0.951; that is, 95% of the variance in the data could be explained by the linear model. Therefore, we accepted the null hypothesis (H1) that there was a correlation between soybean production and the GDP of the Legal Amazon.

Figure 12.
Correlation chart: per capita GDP and soybean production. Prepared by the authors.
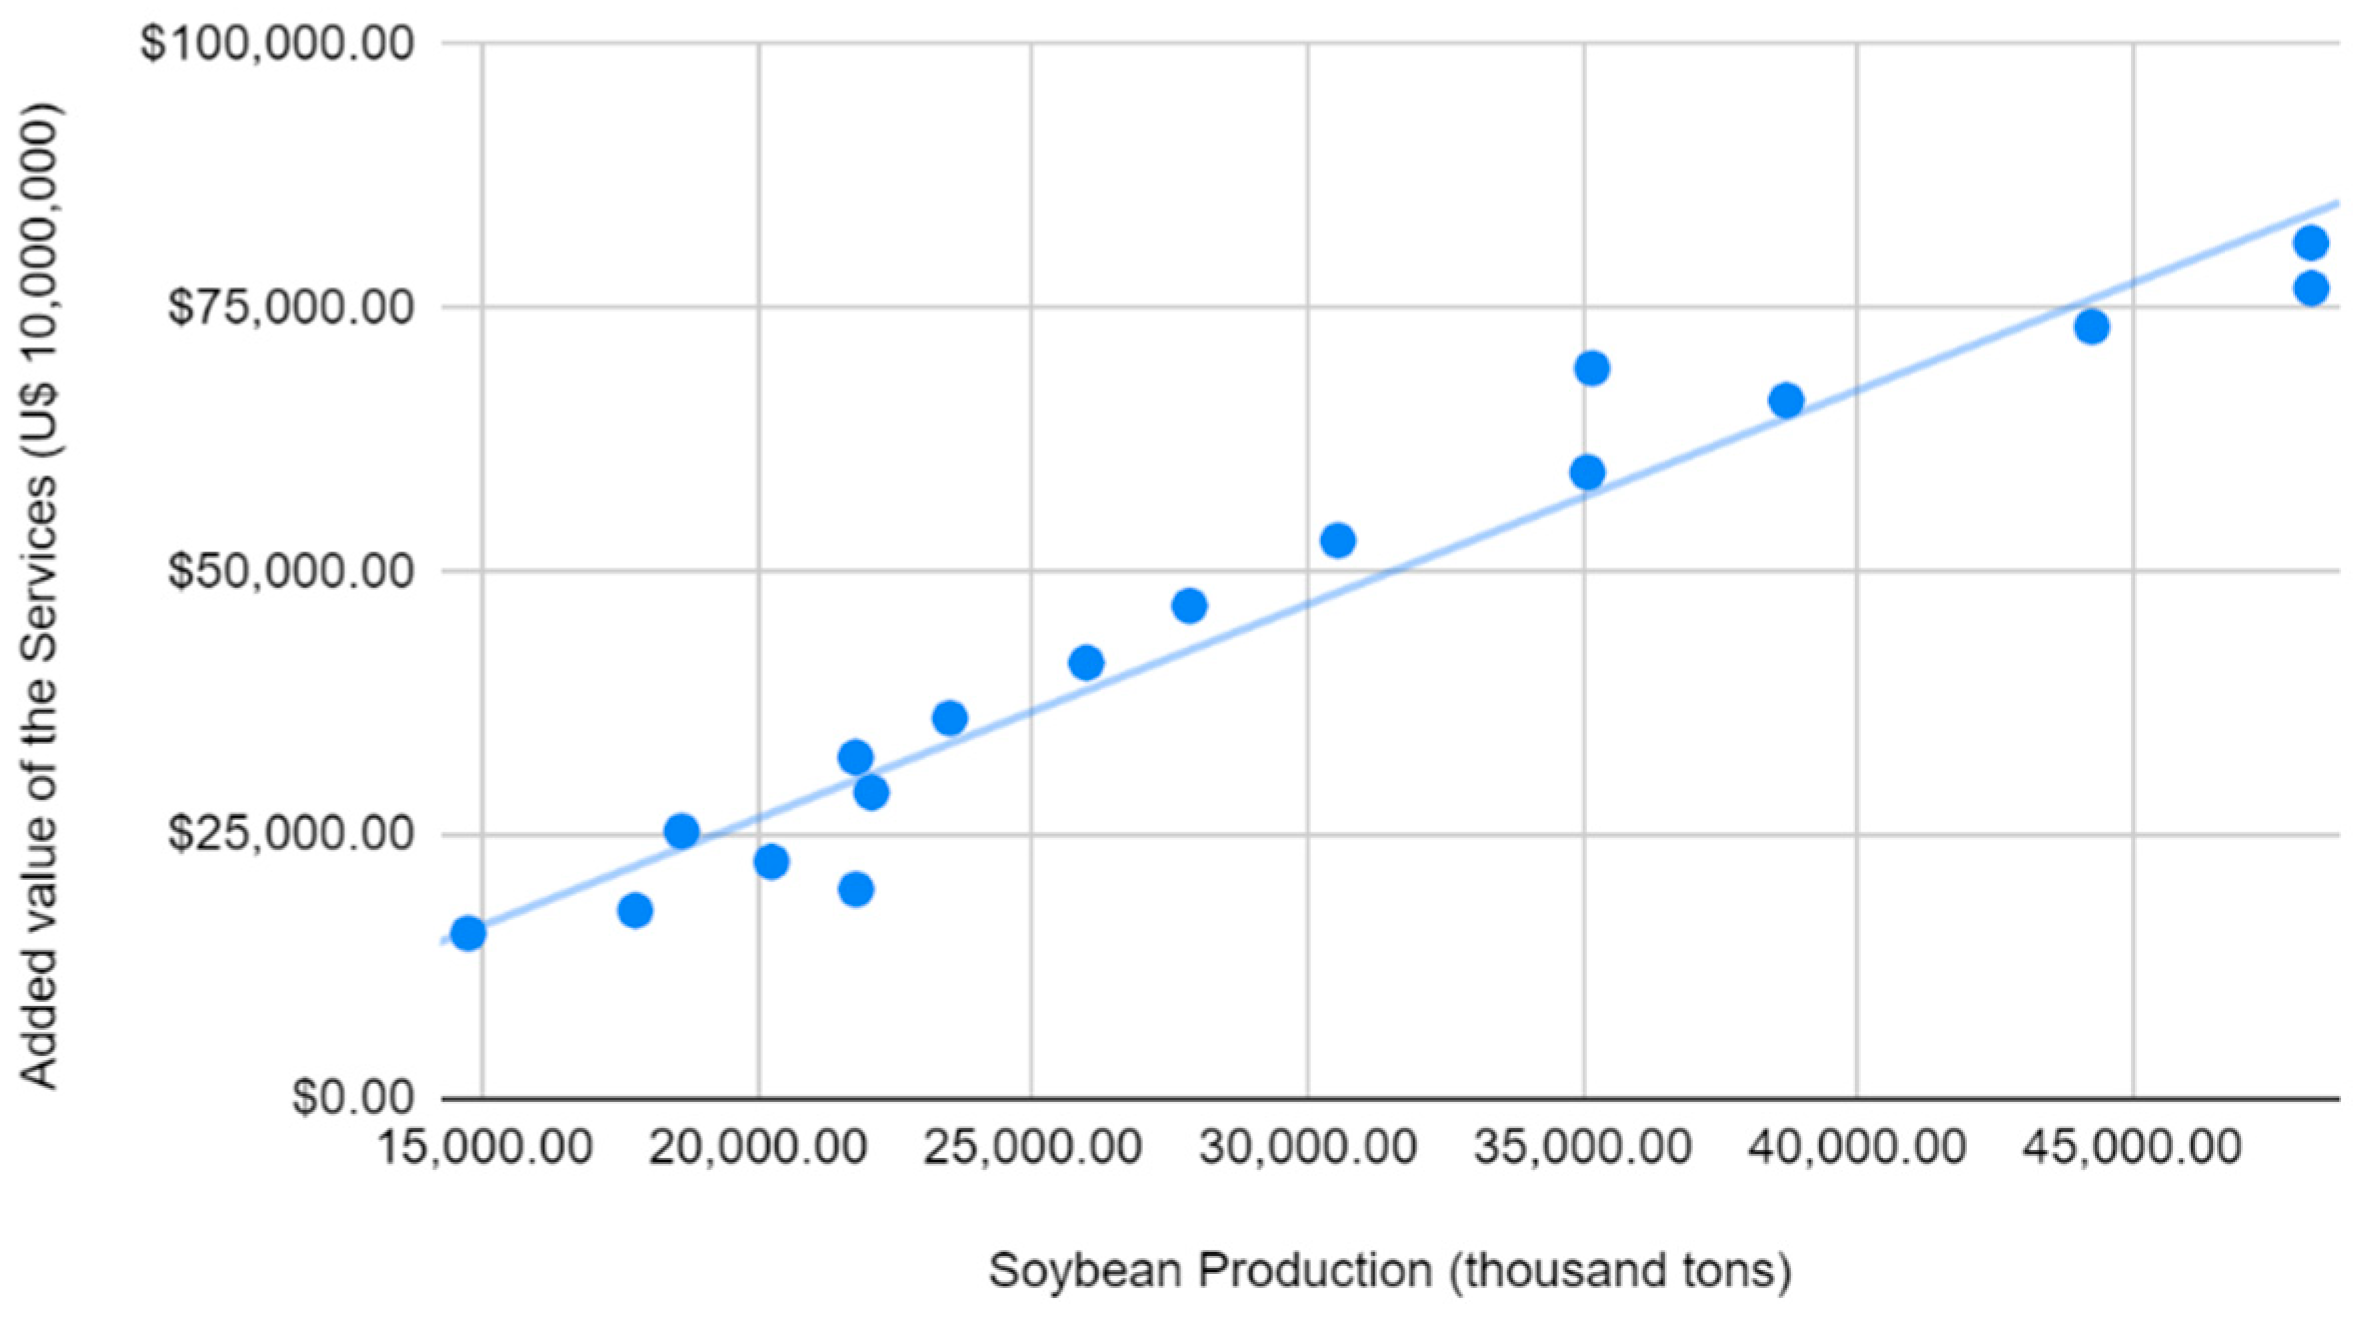
In the analysis between soybean production and the added value of the services to the GDP (the value of added services at current prices with the exceptions of except administration, defense, education, and public health and social security (Figure 13)), observed a strong positive r correlation and a coefficient of determination of = 0.947. Therefore, we accepted the null hypothesis (H1) that there was a correlation between soybean production and the added value of the services to the GDP in the Legal Amazon.
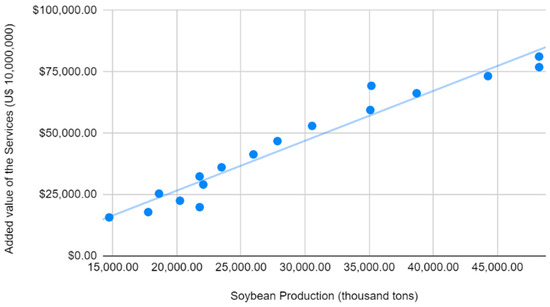
Figure 13.
Correlation chart: added value of the services to GDP and soybean production. Prepared by the authors.
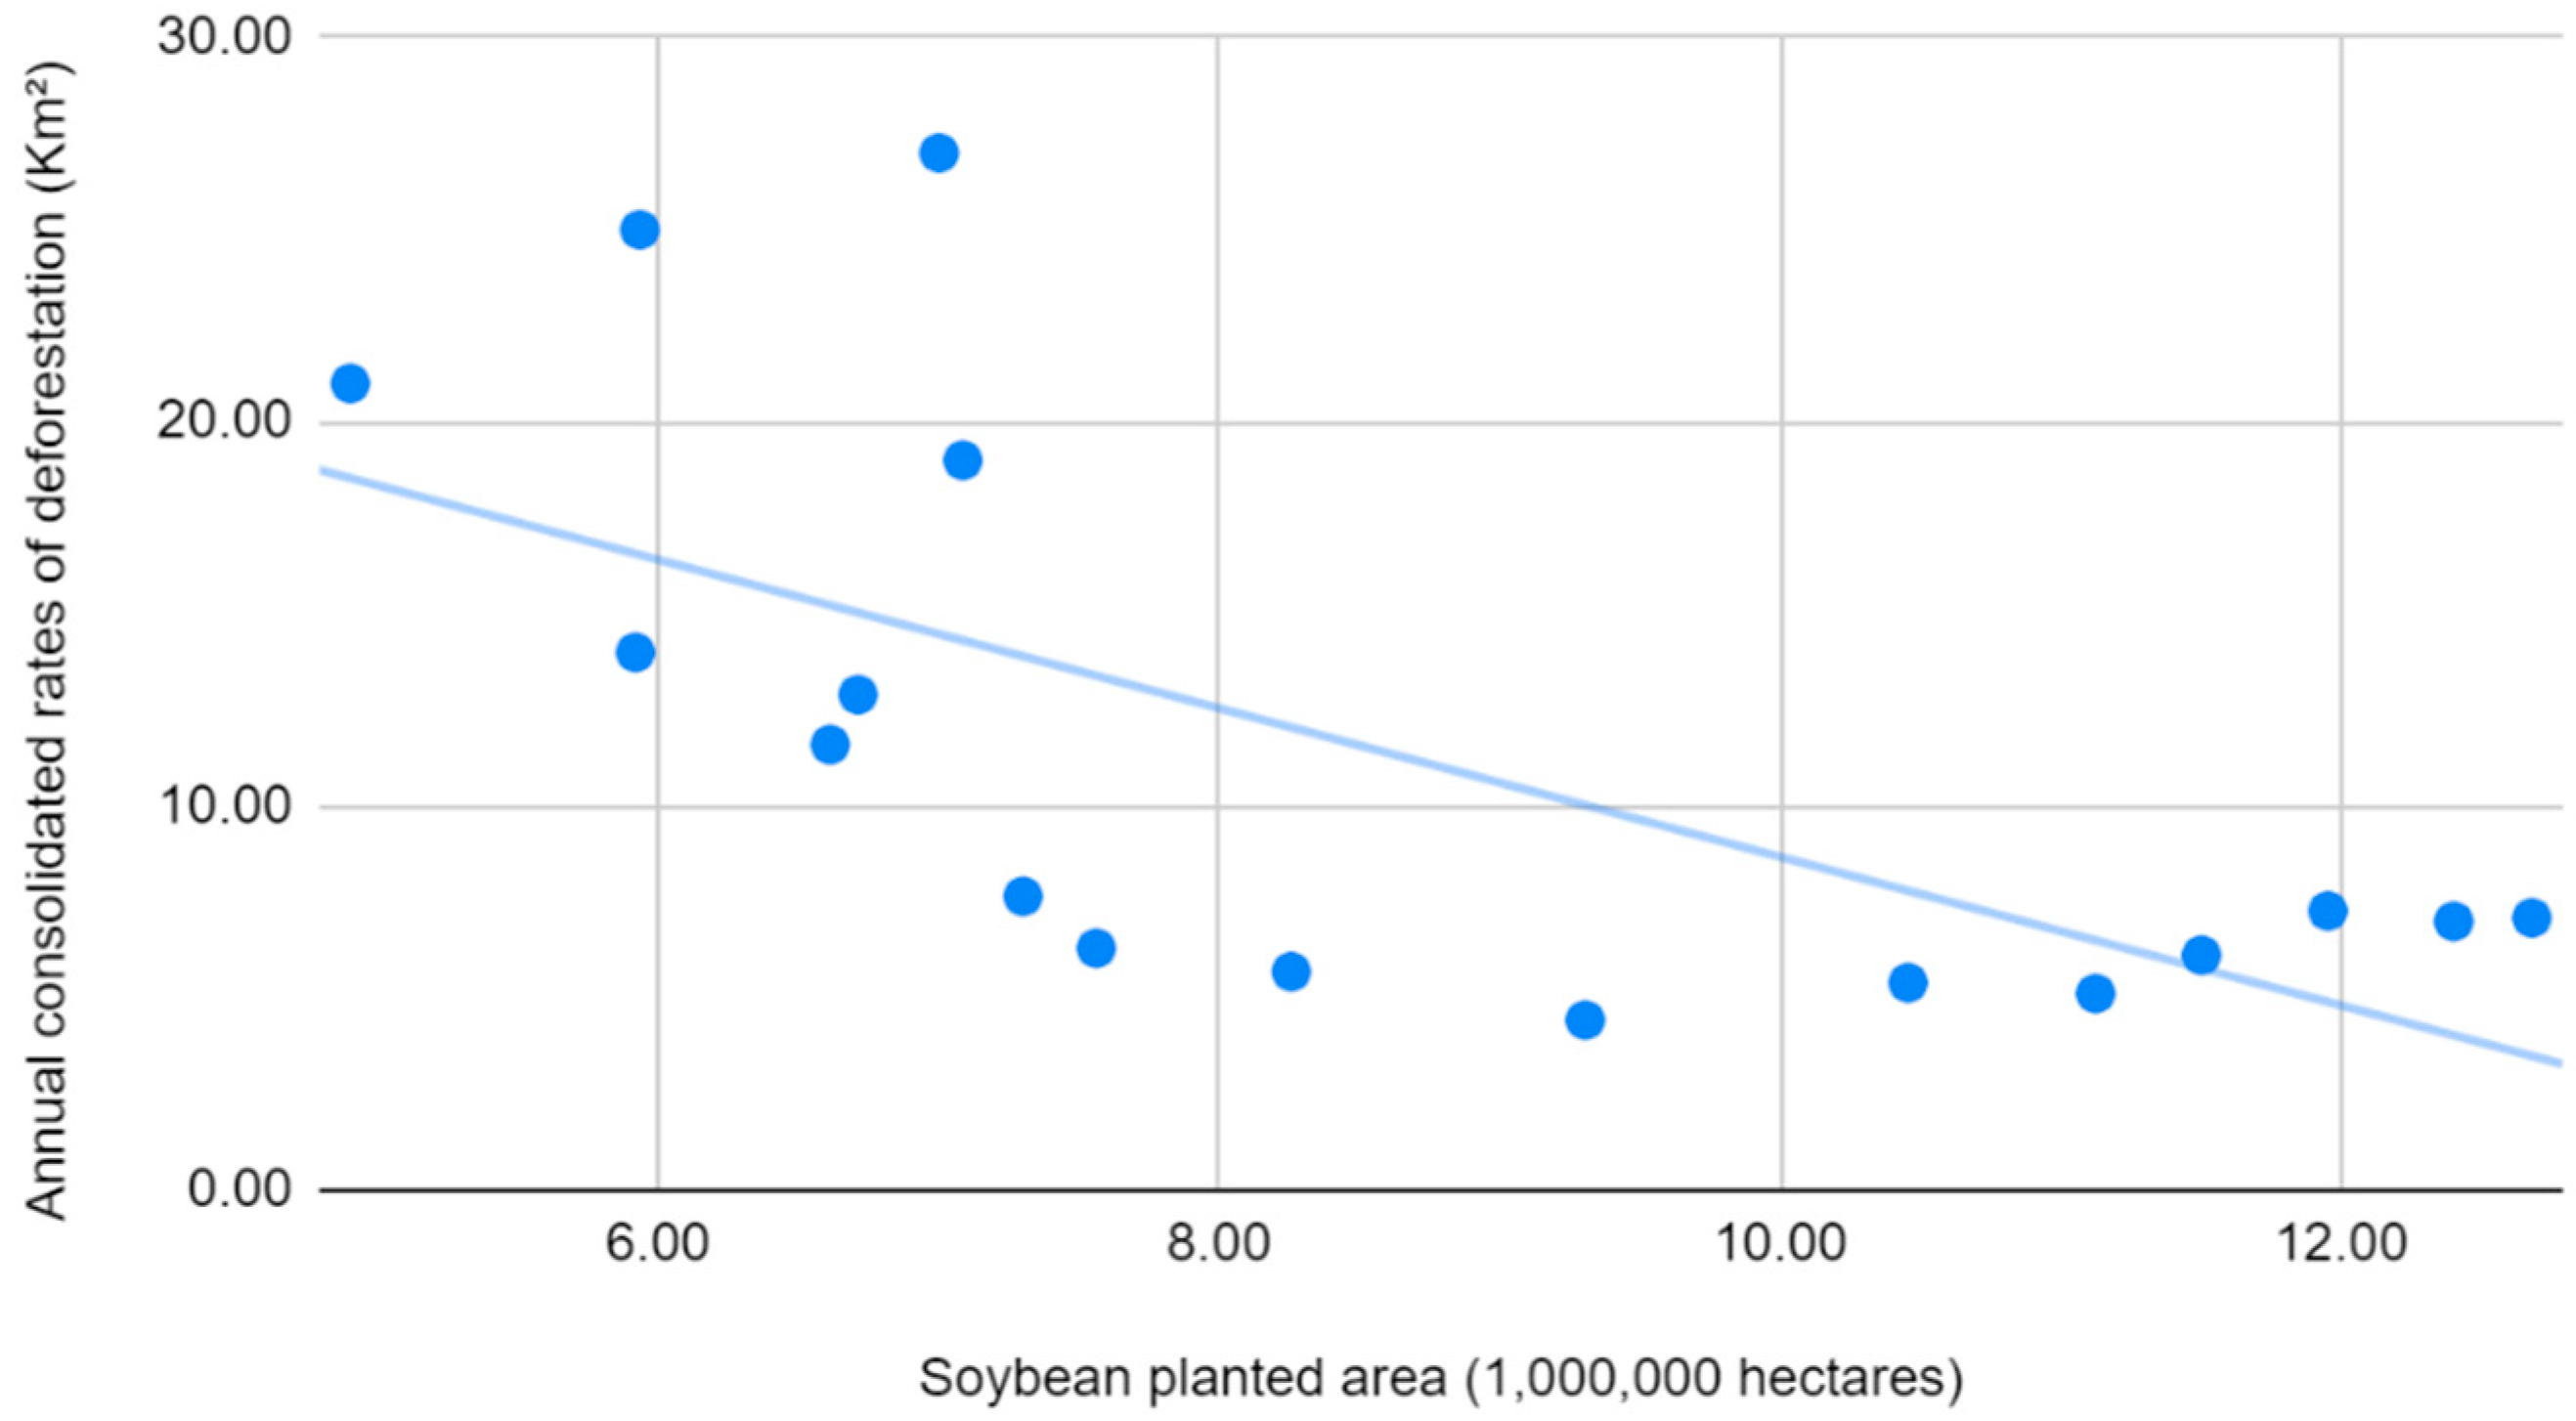
In the analysis of environmental indicators between the soybean-planted area and the consolidated annual deforestation rates (Figure 14), a negative correlation was identified of |r| = 0.67: that is, the correlation from medium to strong; however, the H1 could not be rejected given the existence of a relative negative correlation between the variables with a common coefficient of determination of = 0.45, which represented only 45% of the data variance explained by the linear model. This implied either the need for more data or other models for analysis between these indicators.

Figure 14.
Correlation chart: consolidated annual rates of deforestation and soybean planted area. Prepared by the authors.
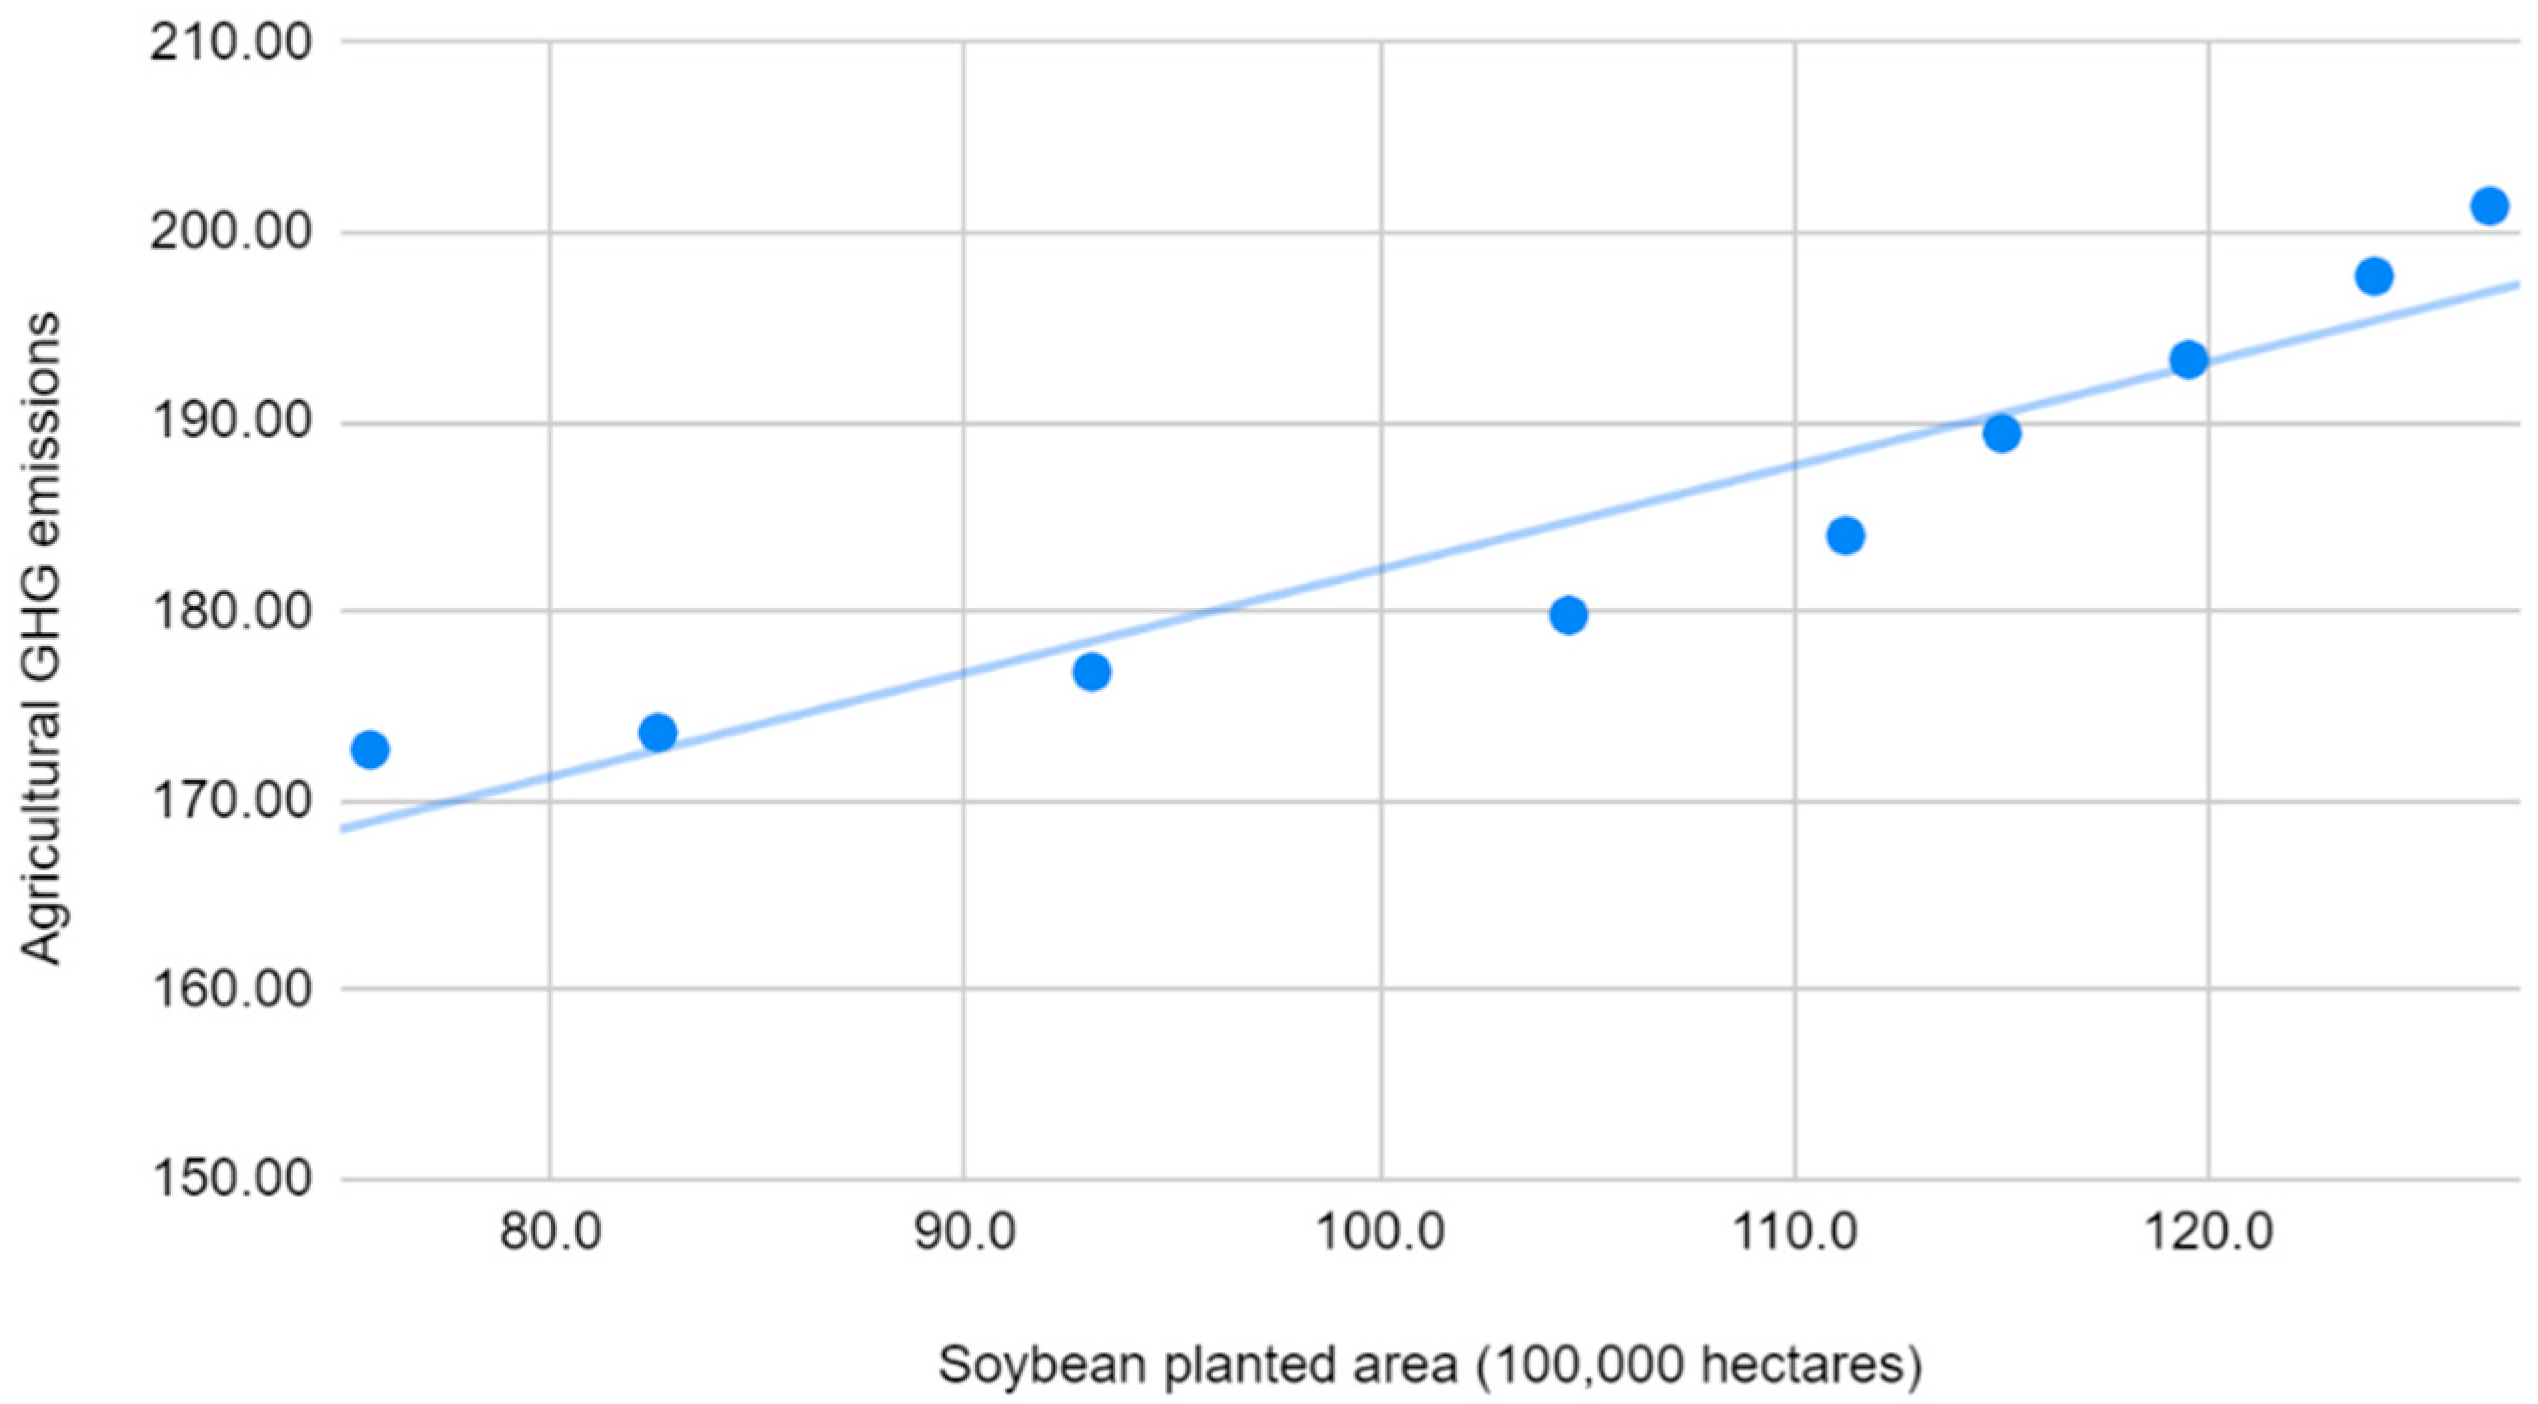
The analysis of the environmental indicators between the soybean-planted area and agricultural GHG emissions (Figure 15) showed a strong positive correlation of r = 0.95 and a determination coefficient of = 0.90; that is, 95% of the variance in the data was explained by the linear model. Therefore, we accepted the null hypothesis (H1) that there was a positive correlation between soybean production and agricultural GHG emissions in the Legal Amazon.
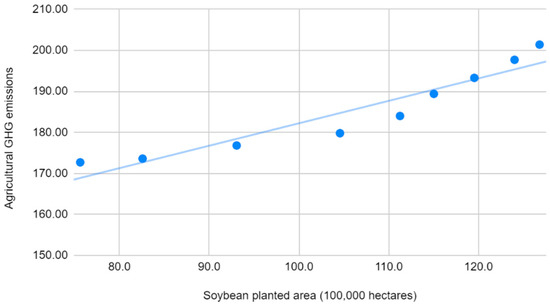
Figure 15.
Correlation chart: agricultural GHG emissions and soybean planted area. Prepared by the authors.
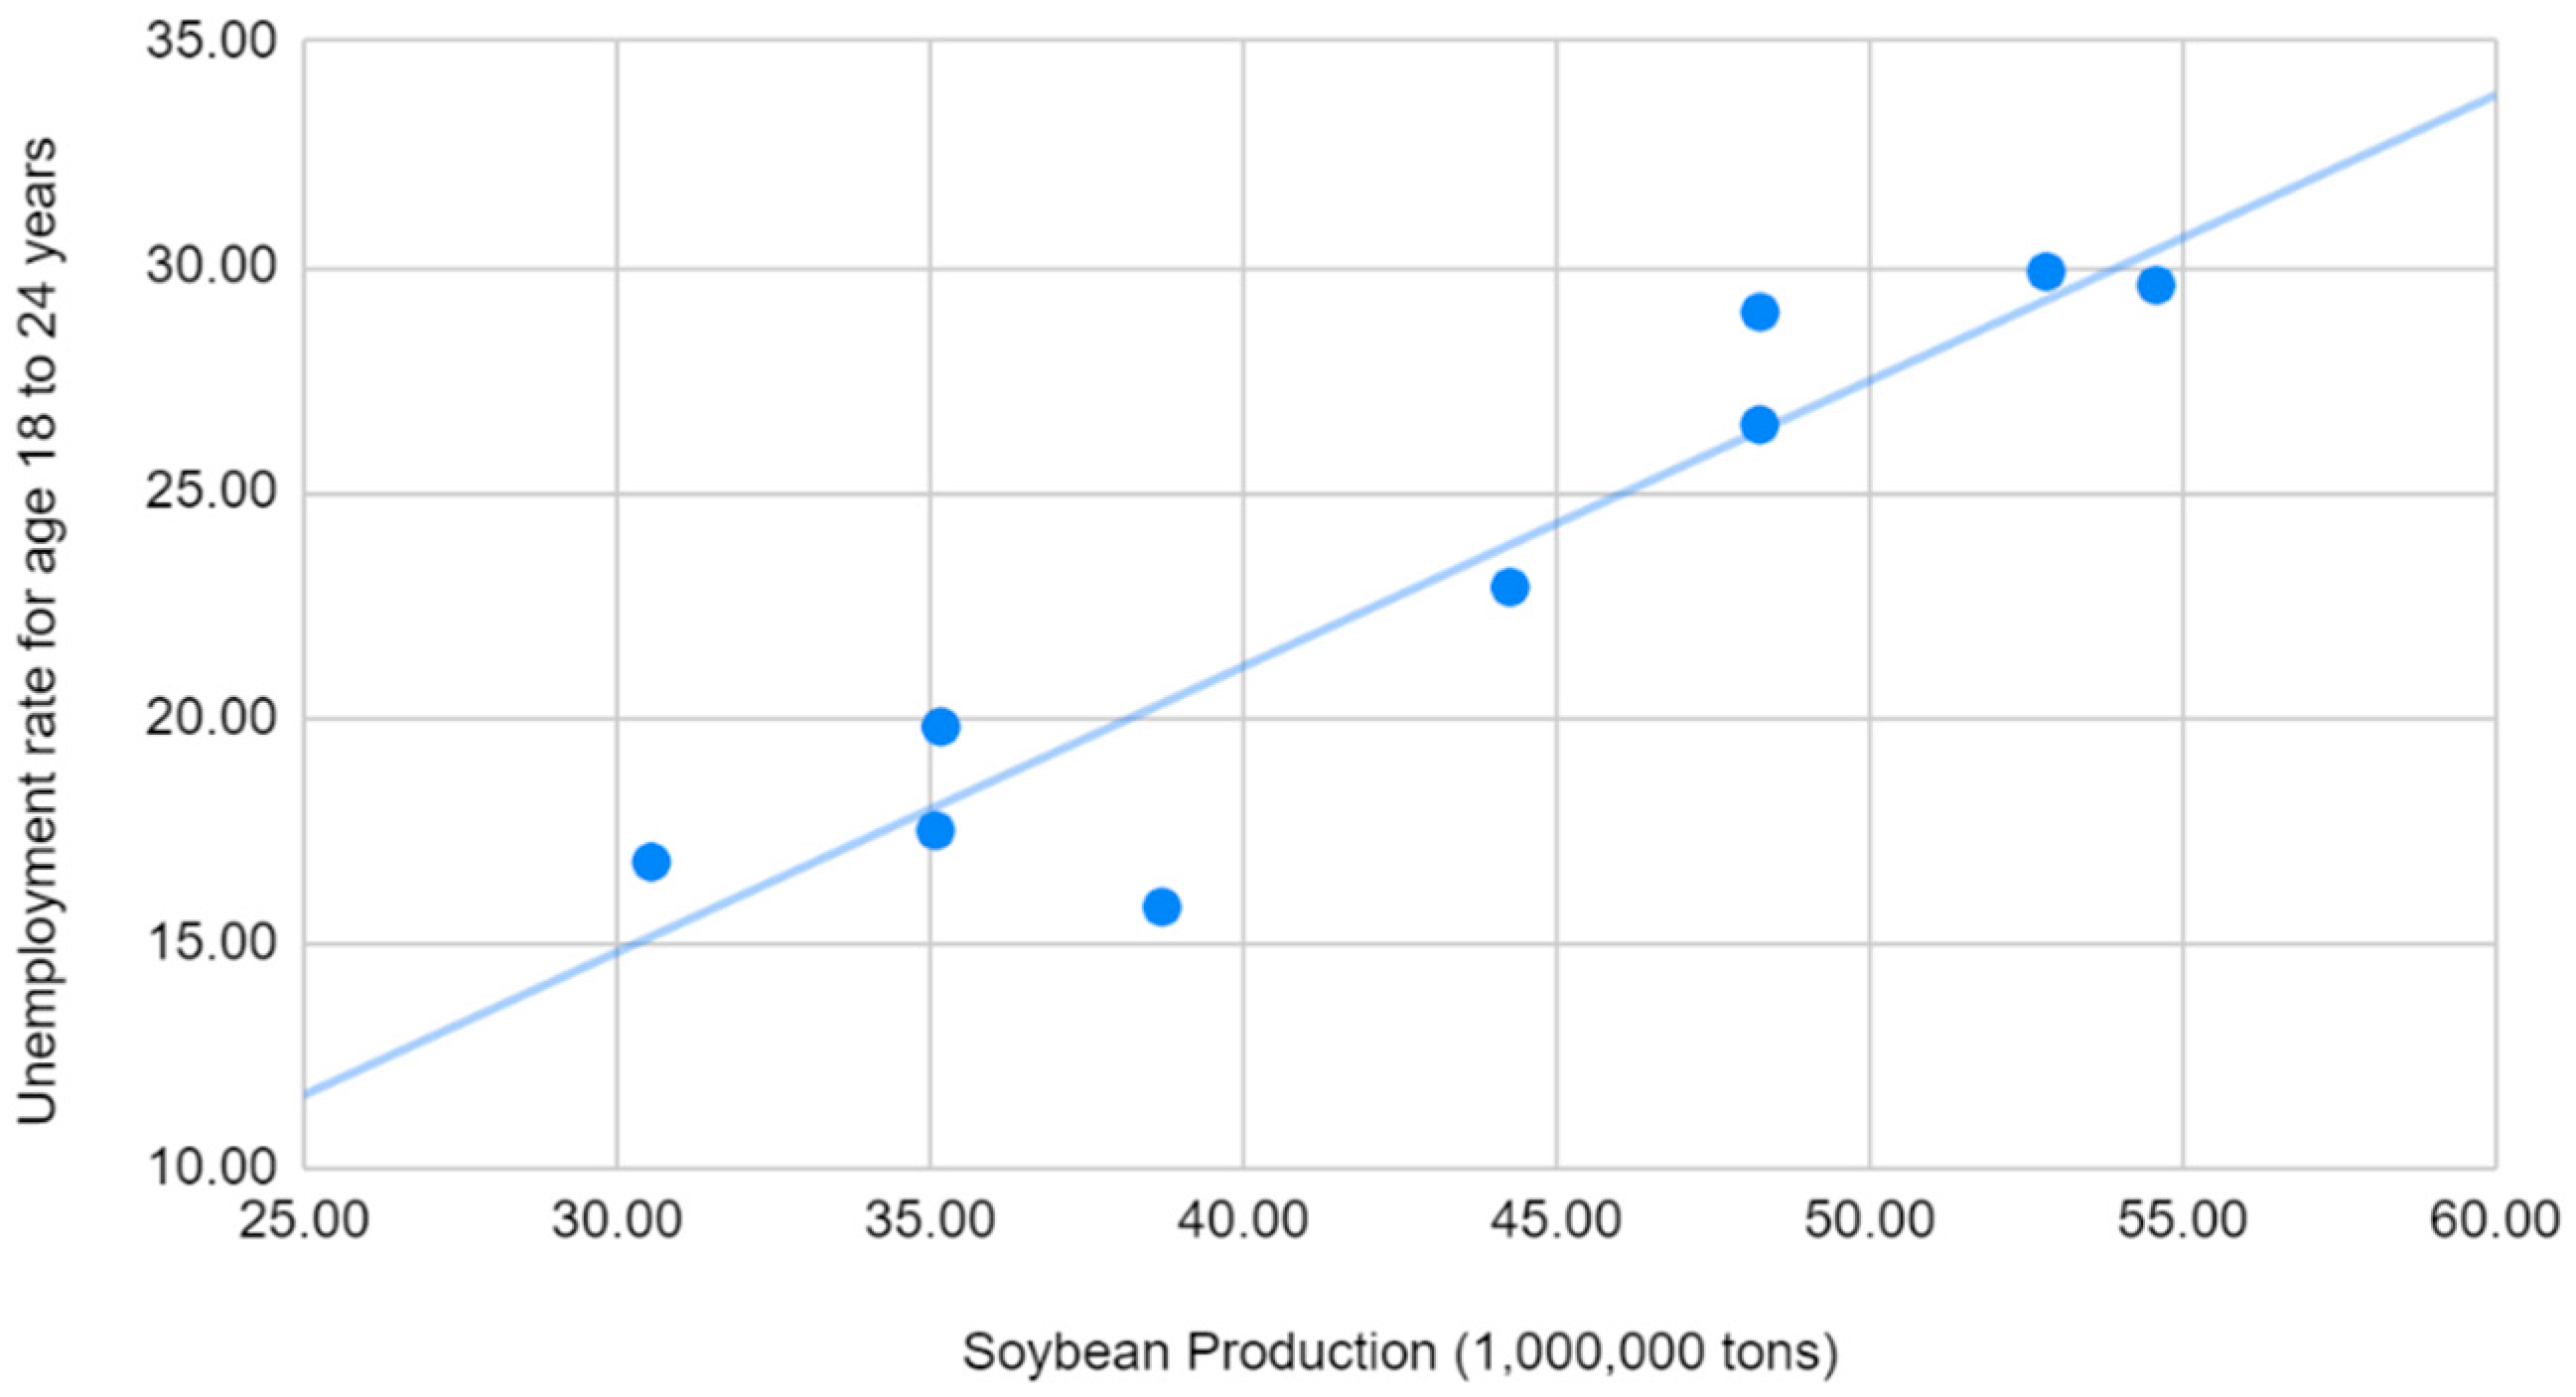
The Brazilian Amazon has a relatively young workforce, as compared to the rest of Brazil, that is concentrated between 18 and 24 years old. We considered this rate for the analysis of social indicators and soybean production (Figure 16). The correlation chart showed a strong positive correlation of r = 0.93 and a determination coefficient of = 0.87; that is, 87% of the variance in the data was explained by the linear model. The null hypothesis (H1) that there was a positive correlation between soybean production and the unemployment rate for those aged 18 to 24 years was accepted.
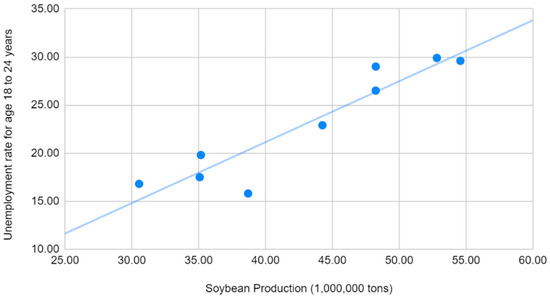
Figure 16.
Correlation chart: the unemployment rate for age 18 to24 years and soybean planted area. Prepared by the authors.
The correlation analysis compared the main soybean indicators (Production or planted area) identified in this paper with the other indicators: GDP per capita, Value of Services, Consolidated annual deforestation rates, Agricultural GHG Emissions, and Unemployment rate by age. The main results can be seen in Table 14. The correlation between the consolidated annual rates of deforestation and the planted area of soybean is not very strong, but the existence of a relative correlation between these variables can be considered. The other indicators show a strong correlation between the analyzed variables.
Table 14.
Pearson correlation coefficient of Amazon indicators.
5. Conclusions
Brazil is the largest soybean producer in the world and is expected to further increase its production in the coming years due to increased demand from importing countries such as China. The analysis of sectorial indicators showed a strong correlation between soybean production and the GDP of the Legal Amazon, indicating the importance of this commodity in the region’s economy. The analysis of the sustainability indicators showed that the negative impacts of the expansion of soybean cultivation in the Amazon were related to GHG emissions and unemployment among young adults.
The area harvested in the Brazilian Amazon increased by 264.7% over the last decade; however, little of this increase in exports translated into the Amazonian population’s quality of life. It was observed that the population’s displacement to cities was largely due to the introduction of monoculture via mechanization and the fertilizers used, in addition to the large expansion of landholding. The agribusiness sector, despite absorbing the young and abundant labor force more than the average in other states, also pushes many small farmer families and former settlers to the cities through the mass acquisition of their lands. The Amazon has known problems associated with institutional fragility, especially in terms of land conflicts, exploitation of illegal activities, and deforestation. The results showed a strong positive correlation between soybean production and the unemployment rate for those aged 18–24 years.
The environmental indicators for annual deforestation rates and soybean-planted area presented a common coefficient of determination of only R2 = 0.45; this result was consistent with [9], which suggested that there was a relationship between the two phenomena, but it was not the only one. The landscape change caused by the expansion of soybean production, among other commodities, has already had an impact on the increase in deforestation frontiers, hotspots, and GHG emissions in recent years in the Brazilian Amazon. The analysis of environmental indicators between the soybean-planted area and agricultural GHG emissions showed a strong positive correlation between soy production and agricultural GHG emissions in the Legal Amazon.
Author Contributions
Conceptualization, R.C.d.O. and R.D.d.S.e.S.; methodology, R.C.d.O.; software, R.C.d.O.; validation, R.C.d.O. and R.D.d.S.e.S.; formal analysis, R.D.d.S.e.S.; investigation, R.C.d.O.; data curation, R.C.d.O.; writing—original draft preparation, R.C.d.O.; writing—review and editing, R.C.d.O.; visualization, R.D.d.S.e.S.; supervision, R.D.d.S.e.S. All authors have read and agreed to the published version of the manuscript.
Funding
This research received no external funding.
Institutional Review Board Statement
Exclude this statement the study did not involve humans or animals.
Informed Consent Statement
Not applicable.
Data Availability Statement
Publicly archived datasets analyzed: Per capita GDP and The unemployment rate for age, https://www.ibge.gov.br/estatisticas/economicas/contas-nacionais/9088-produto-interno-bruto-dos-municipios.html?=&t=resultados&utm_source=landing&utm_medium=explica&utm_campaign=pib, https://www.ibge.gov.br/estatisticas/economicas/contas-nacionais/9054-contas-regionais-do-brasil.html?=&t=downloads, https://sidra.ibge.gov.br/home/pms/brasil, accessed on 20 August 2021; Soybean Production and Soybean planted area, https://www.conab.gov.br/info-agro/safras, https://censos.ibge.gov.br/agro/2017/templates/censo_agro/resultadosagro/agricultura.html, accessed on 20 August 2021; Consolidated annual rates of deforestation, https://previsia.org/, http://inpe-em.ccst.inpe.br/, http://alerta.mapbiomas.org/, accessed on 20 August 2021; Agricultural GHG emissions, http://seeg.eco.br/, https://www.climatewatchdata.org/ghg-emissions?breakBy=regions-PER_CAPITA&end_year=2018®ions=WORLD%2CQAT%2CUSA%2CARE&start_year=1990, accessed on 20 August 2021.
Conflicts of Interest
The authors declare no conflict of interest.
References
- SÁ, D.M.; Silva, A.F.C. The Brazilian Amazon, the world’s breadbasket: Science, agriculture and ecology at the agronomic institute of the north in the 1940s and 1950s. Rev. De História 2019, 178. [Google Scholar] [CrossRef]
- FIESP. Safra Mundial de Soja 2021/22—2o Levantamento do USDA. June 2021. Available online: https://www.fiesp.com.br/tag/fiesp/ (accessed on 20 August 2021).
- Sousa, F. Amazônia: Uma Terra sem Homens para Homens Sem-Terra. 2019. Available online: https://ferdinandodesousa.com/2019/10/11/amazonia-uma-terra-sem-homens-para-homens-sem-terra/ (accessed on 20 August 2021).
- Costa, F.A. O Planejamento do desenvolvimento regional na Amazônia: Pressupostos conceituais para uma nova institucionalidade. Amaz. Ciência E Desenvolv. 2005, 1, 181–196. [Google Scholar]
- Brandão, J.C.; Vogt, C.M. Os efeitos macroeconômicos do superciclo de commodities e a influência da china na economia brasileira. Rev. Tempo do Mundo 2021, 283–317. [Google Scholar] [CrossRef]
- Kreter, A.C.; Pastre, R.; Souza Júnior, J.R.; Comércio Exterior do Agronegócio. IPEA, Carta de Conjuntura no 52, Nota de Conjuntura 7, Trimestre de 2021. Available online: https://www.ipea.gov.br/portal/images/stories/PDFs/conjuntura/210812_cc_52_nota_11_setor_externo_agro.pdf (accessed on 30 August 2021).
- Garcia, P.M.; Servo, F.; Souza Júnior, J.R. Agropecuária: Projeção do Valor Adicionado do Setor Agropecuário Para 2021. IPEA, Carta de Conjuntura no 52, nota de Conjuntura 30, Trimestre de 2021. Available online: https://www.ipea.gov.br/portal/images/stories/PDFs/conjuntura/210825_nota_18_pib_agora.pdf (accessed on 30 August 2021).
- Rajão, R.; Soares-Filho, B.; Nunes, F.; Börner, J.; Machado, L.; Assis, D.; Oliveira, A.; Pinto, L.; Ribeiro, V.; Rausch, L.; et al. The rotten apples of Brazil’s agribusiness. Science 2020, 369, 246–248. [Google Scholar] [CrossRef] [PubMed]
- Domingues, M.S.; Bermann, C. O arco de desflorestamento na Amazônia: Da pecuária à soja. Ambient. Soc. 2012, 15, 1–22. [Google Scholar] [CrossRef]
- Piras, S.; Wesz, V.; Ghinoi, S. Soy Expansion, Environment, and Human Development: An Analysis across Brazilian Municipalities. Sustainability 2021, 13, 7246. [Google Scholar] [CrossRef]
- ISO/TS 21929-1:2011. Sustainability in Building Construction—Sustainability Indicators—Part 1: Framework for the Development of Indicators and a Core Set of Indicators for Buildings. Available online: https://www.iso.org/standard/46599.html (accessed on 10 August 2021).
- WCED. World Commission on Environment and Development. Oxford Paperbacks, 1987. Available online: https://sustainabledevelopment.un.org/content/documents/5987our-common-future.pdf (accessed on 10 August 2021).
- Allen, R. How to Save the World; Barnes and Noble: Totowa, NJ, USA, 1980. [Google Scholar]
- Fernández-Sánchez, G.; Rodríguez-López, F. A methodology to identify sustainability indicators in construction project management—Application to infrastructure projects in Spain. Ecol. Indic. 2010, 10, 1193–1201. [Google Scholar] [CrossRef]
- Shen, L.-Y.; Ochoa, J.J.; Shah, M.N.; Zhang, X. The application of urban sustainability indicators—A comparison between various practices. Habitat Int. 2011, 35, 17–29. [Google Scholar] [CrossRef]
- Asmelash, A.G.; Kumar, S. Assessing progress of tourism sustainability: Developing and validating sustainability indicators. Tour. Manag. 2018, 71, 67–83. [Google Scholar] [CrossRef]
- Mori, K.; Christodoulou, A. Review of sustainability indices and indicators: Towards a new City Sustainability Index (CSI). Environ. Impact Assess. Rev. 2012, 32, 94–106. [Google Scholar] [CrossRef]
- Tanguay, G.A.; Rajaonson, J.; Lefebvre, J.-F.; Lanoie, P. Measuring the sustainability of cities: An analysis of the use of local indicators. Ecol. Indic. 2010, 10, 407–418. [Google Scholar] [CrossRef]
- European Commission. Targeted Summary of the European Sustainable Cities Report for Local Authorities. 1996. Available online: http://aei.pitt.edu/38664/ (accessed on 20 August 2021).
- De Oliveira, R.C.; Silva, R.D.D.S.E.; Tostes, M.E.D.L. A methodology for analysis of cogeneration projects using oil palm biomass wastes as an energy source in the Amazon. DYNA 2015, 82, 105–112. [Google Scholar] [CrossRef]
- Santos, D.; Salomão, R.; Veríssimo, A. Fatos da Amazônia 2021. Amazônia 2030, March 2021. Available online: https://amazonia2030.org.br/fatos-da-amazonia-2021/ (accessed on 10 August 2021).
- CONAB. Safras. 2021. Available online: https://www.conab.gov.br/info-agro/safras (accessed on 1 August 2021).
- IBGE. Produto Interno Bruto—PIB. 2021. Available online: https://www.ibge.gov.br/explica/pib.php (accessed on 30 July 2021).
- MAPA. Indicadores Gerais Agrostat. 2021. Available online: https://indicadores.agricultura.gov.br/agrostat/index.htm (accessed on 30 July 2021).
- Alfenas, F.; Cavalcanti, F.; Gonzaga, G. Mercado de Trabalho na Amazônia Brasileira uma Análise Comparativa com o Resto do Brasil. Belém: Projeto Amazônia 2030, 2020. Available online: https://amazonia2030.org.br/mercado-de-trabalho-na-amazonia-legal-uma-analise-comparativa-com-o-resto-do-brasil/ (accessed on 30 August 2021).
- IBGE. Amazônia Brasileira. 2021. Available online: https://www.ibge.gov.br/geociencias/cartas-e-mapas/mapas-regionais/15819-amazonia-legal.html?=&t=downloads (accessed on 30 July 2021).
- Da Cruz, D.C.; Benayas, J.M.R.; Ferreira, G.; Santos, S.R.; Schwartz, G. An overview of forest loss and restoration in the Brazilian Amazon. New For. 2020, 52, 1–16. [Google Scholar] [CrossRef] [Green Version]
- Gomes, C.V.A. Ciclos econômicos do extrativismo na Amazônia na visão dos viajantes naturalistas. Bol. Mus. Para. Emílio Goeldi. Ciênc. Hum. 2018, 13, 129–146. [Google Scholar] [CrossRef] [Green Version]
- INPE. Monitoramento do Desmatamento da Floresta Amazônica Brasileira por Satélite. PRODES-Amazônia, 2020. Available online: http://www.obt.inpe.br/OBT/assuntos/programas/amazonia/prodes (accessed on 30 July 2021).
- SEEG. Sistema de Estimativas de Emissões e Remoções de Gases de Efeito Estufa. 2021. Available online: https://seeg.eco.br/ (accessed on 20 July 2021).
- Larson, R.; Farber, B. Estatística Aplicada; Pearson Prentice Hall: São Paulo, Brazil, 2010. [Google Scholar]
- IMAZON. Instituto do Homem e Meio Ambiente da Amazônia. Available online: https://imazon.org.br/ (accessed on 20 July 2021).
- Coslovsky, S. Oportunidades para Exportação de Produtos Compatíveis com a Floresta na Amazônia Brasilei-ra. Amazônia 2030, April 2021. Available online: https://amazonia2030.org.br/wp-content/uploads/2021/04/AMZ2030-Oportunidades-para-Exportacao-de-Produtos-Compativeis-com-a-Floresta-na-Amazonia-Brasileira-1-2.pdf (accessed on 30 August 2021).
- SIGA and ANEEL. Carga e Geração e Histórico da Operação/ONS. March 2021. Available online: https://bit.ly/3cPPeYs (accessed on 30 August 2021).
- IBGE. Brasil em Síntese. 2014. Available online: https://brasilemsintese.ibge.gov.br/servicos.html (accessed on 30 August 2021).
- Martha Júnior, G.; Contini, E.; Navarro, Z. Caracterização da Amazônia Brasileira e Macrotendências do Ambiente Externo. Embrapa Estudos e Capacitação, 2011. Available online: https://www.embrapa.br/busca-de-publicacoes/-/publicacao/907075/caracterizacao-da-amazonia-legal-e-macrotendencias-do-ambiente-externo (accessed on 10 July 2021).
- De Oliveira, R.C.; Almeida, E.; Freguglia, R.D.S.; Barreto, R. Desmatamento e crescimento econômico no Brasil: Uma análise da curva de Kuznets ambiental para a Amazônia legal. Rev. Econ. Sociol. Rural. 2011, 49, 709–739. [Google Scholar] [CrossRef]
- Universidade Federal do Pará. Coleção Formação Regional da Amazônia; NAEA, UFPA: Belém, Brazil, 2015. [Google Scholar]
- Gupta, A.; Mishra, P.; Pandey, C.M.; Singh, U.; Sahu, C.; Keshri, A. Descriptive statistics and normality tests for statistical data. Ann. Card. Anaesth. 2019, 22, 67–72. [Google Scholar] [CrossRef] [PubMed]
- Yap, B.W.; Sim, C.H. Comparisons of various types of normality tests. J. Stat. Comput. Simul. 2011, 81, 2141–2155. [Google Scholar] [CrossRef]
- Moore, G.H. The Analysis of Economic Indicators. Sci. Am. 1975, 232, 17–23. [Google Scholar] [CrossRef]
Publisher’s Note: MDPI stays neutral with regard to jurisdictional claims in published maps and institutional affiliations. |
© 2021 by the authors. Licensee MDPI, Basel, Switzerland. This article is an open access article distributed under the terms and conditions of the Creative Commons Attribution (CC BY) license (https://creativecommons.org/licenses/by/4.0/).