
Comprehensive Vulnerability Assessment of Urban Areas Using an Integration of Fuzzy Logic Functions: Case Study of Nasiriyah City in South Iraq


Abstract
:1. Introduction
2. Vulnerability Indicators
2.1. Environment Domain
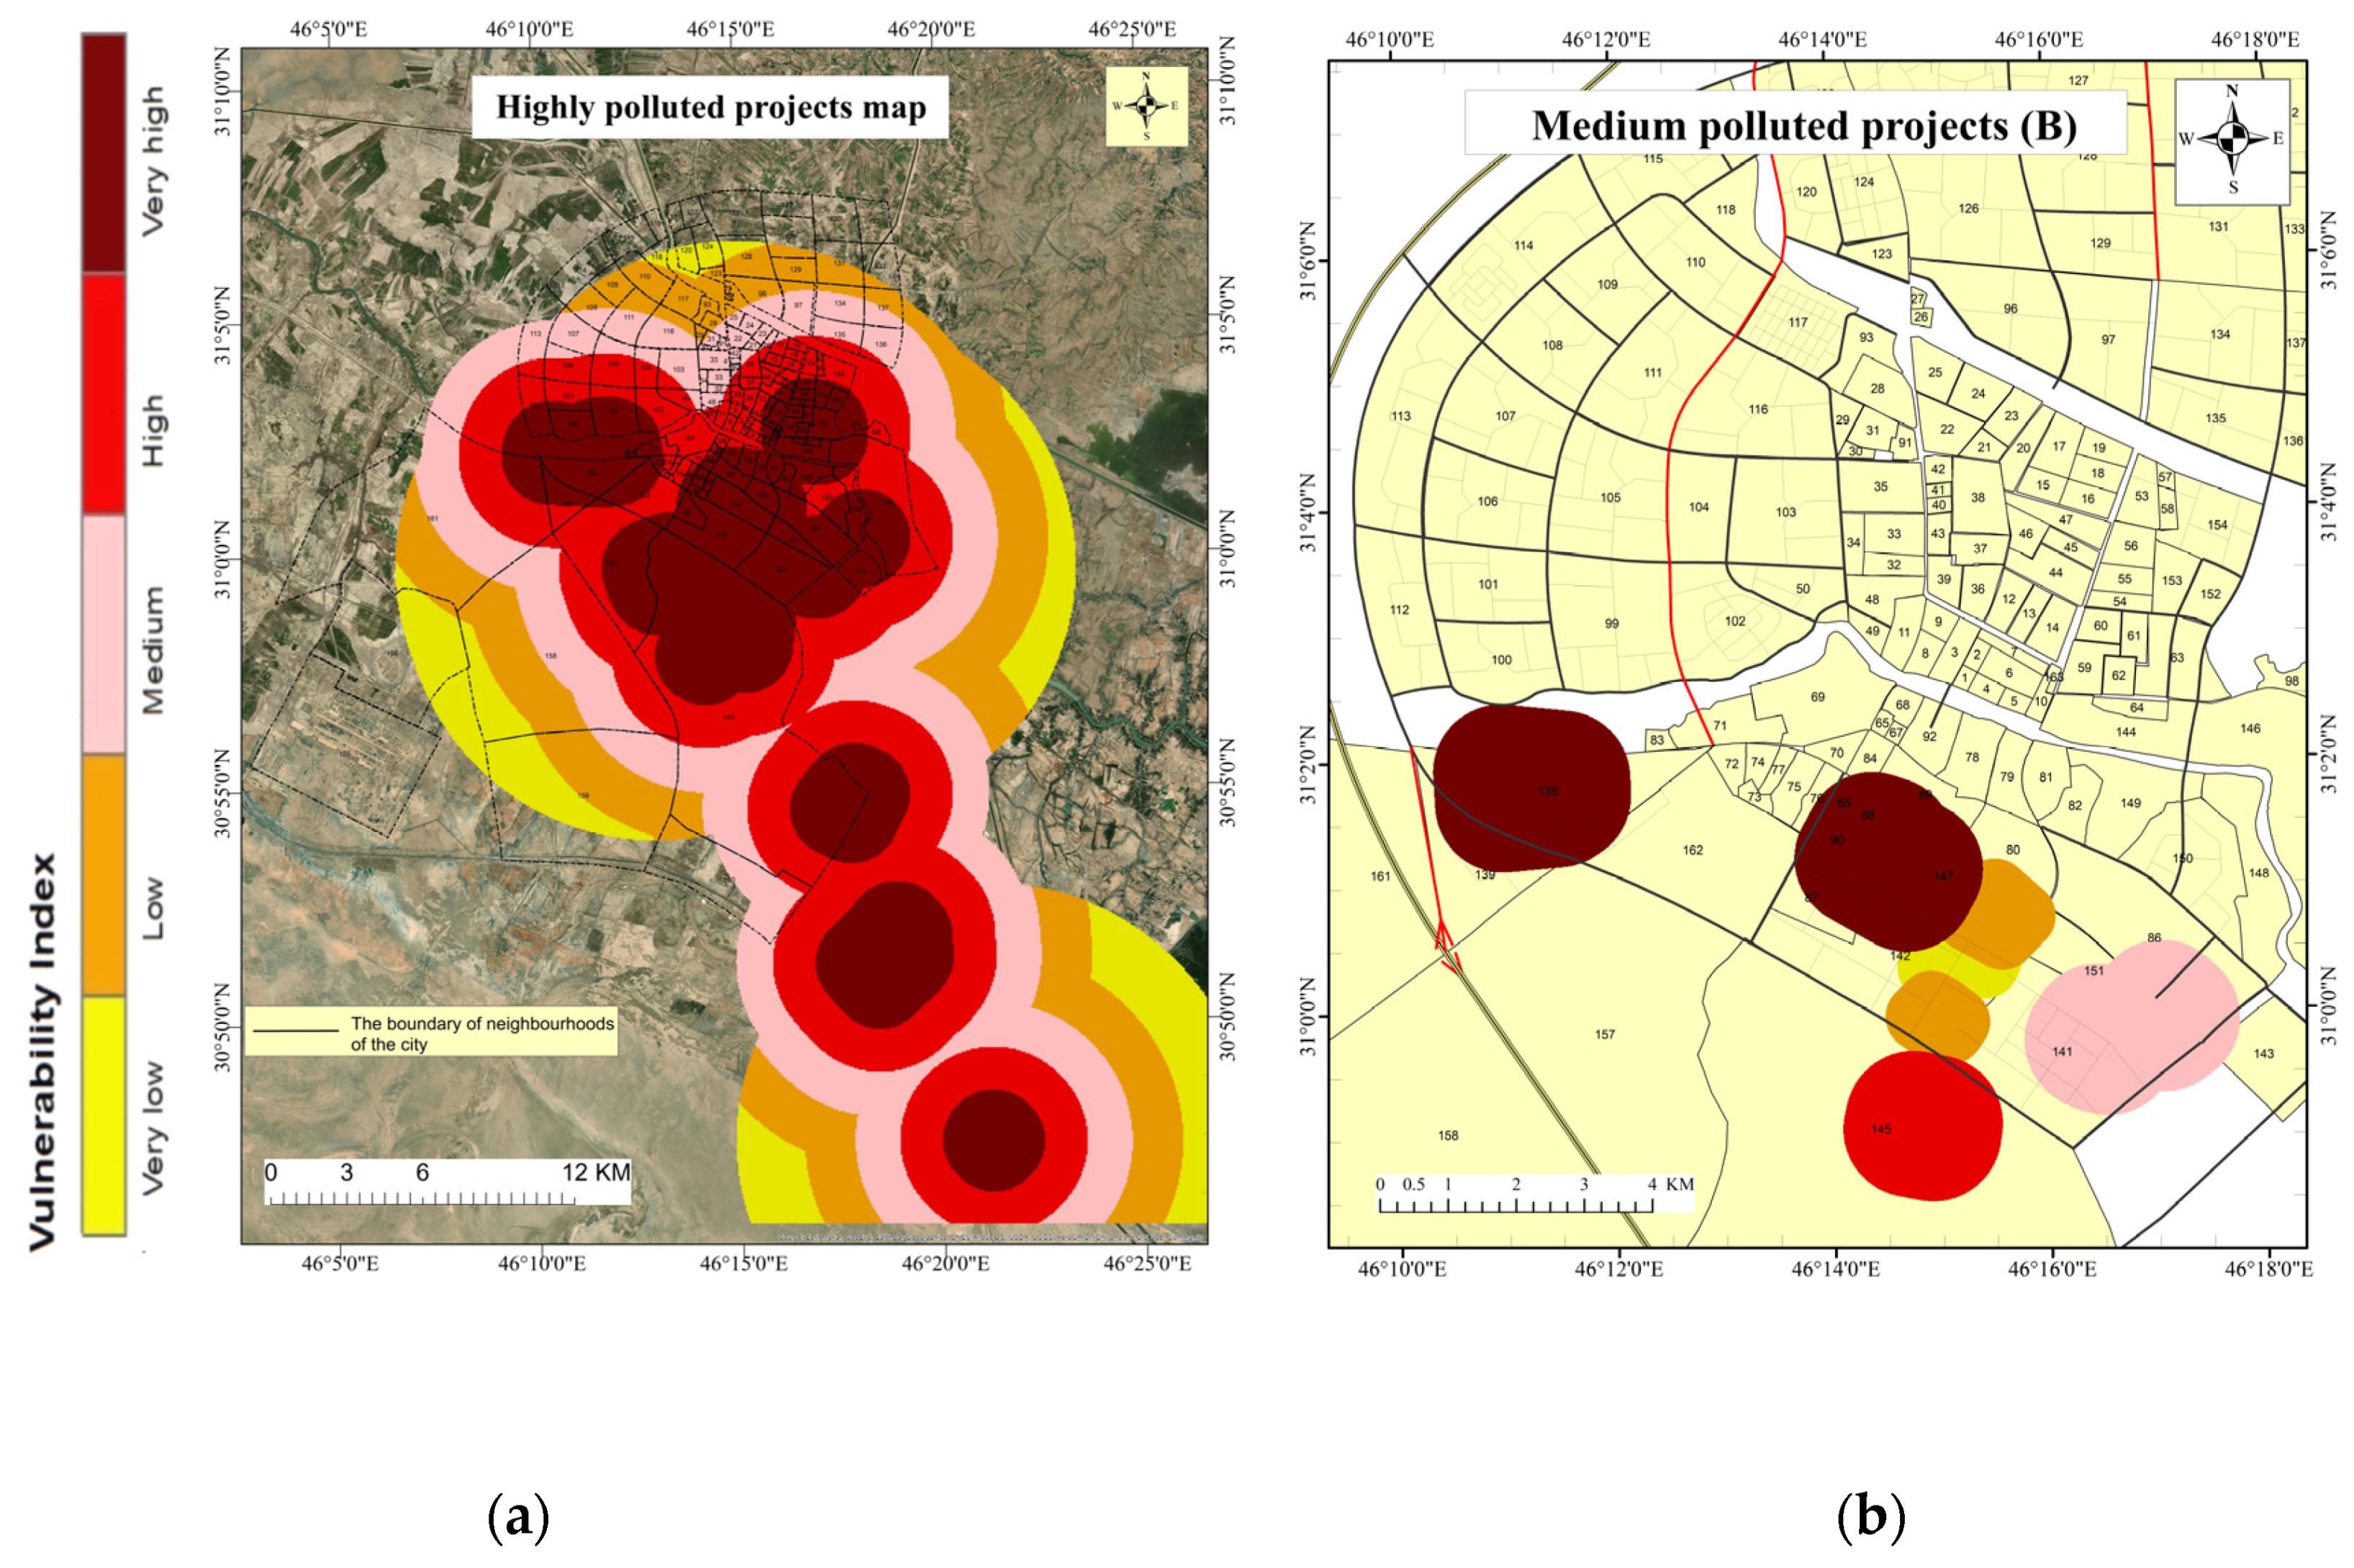
2.1.1. Class A: High-Polluting Projects
2.1.2. Class B: Moderately Polluting Projects
2.1.3. Class C: Low-Polluting Projects
2.1.4. Effects of Weapons and War
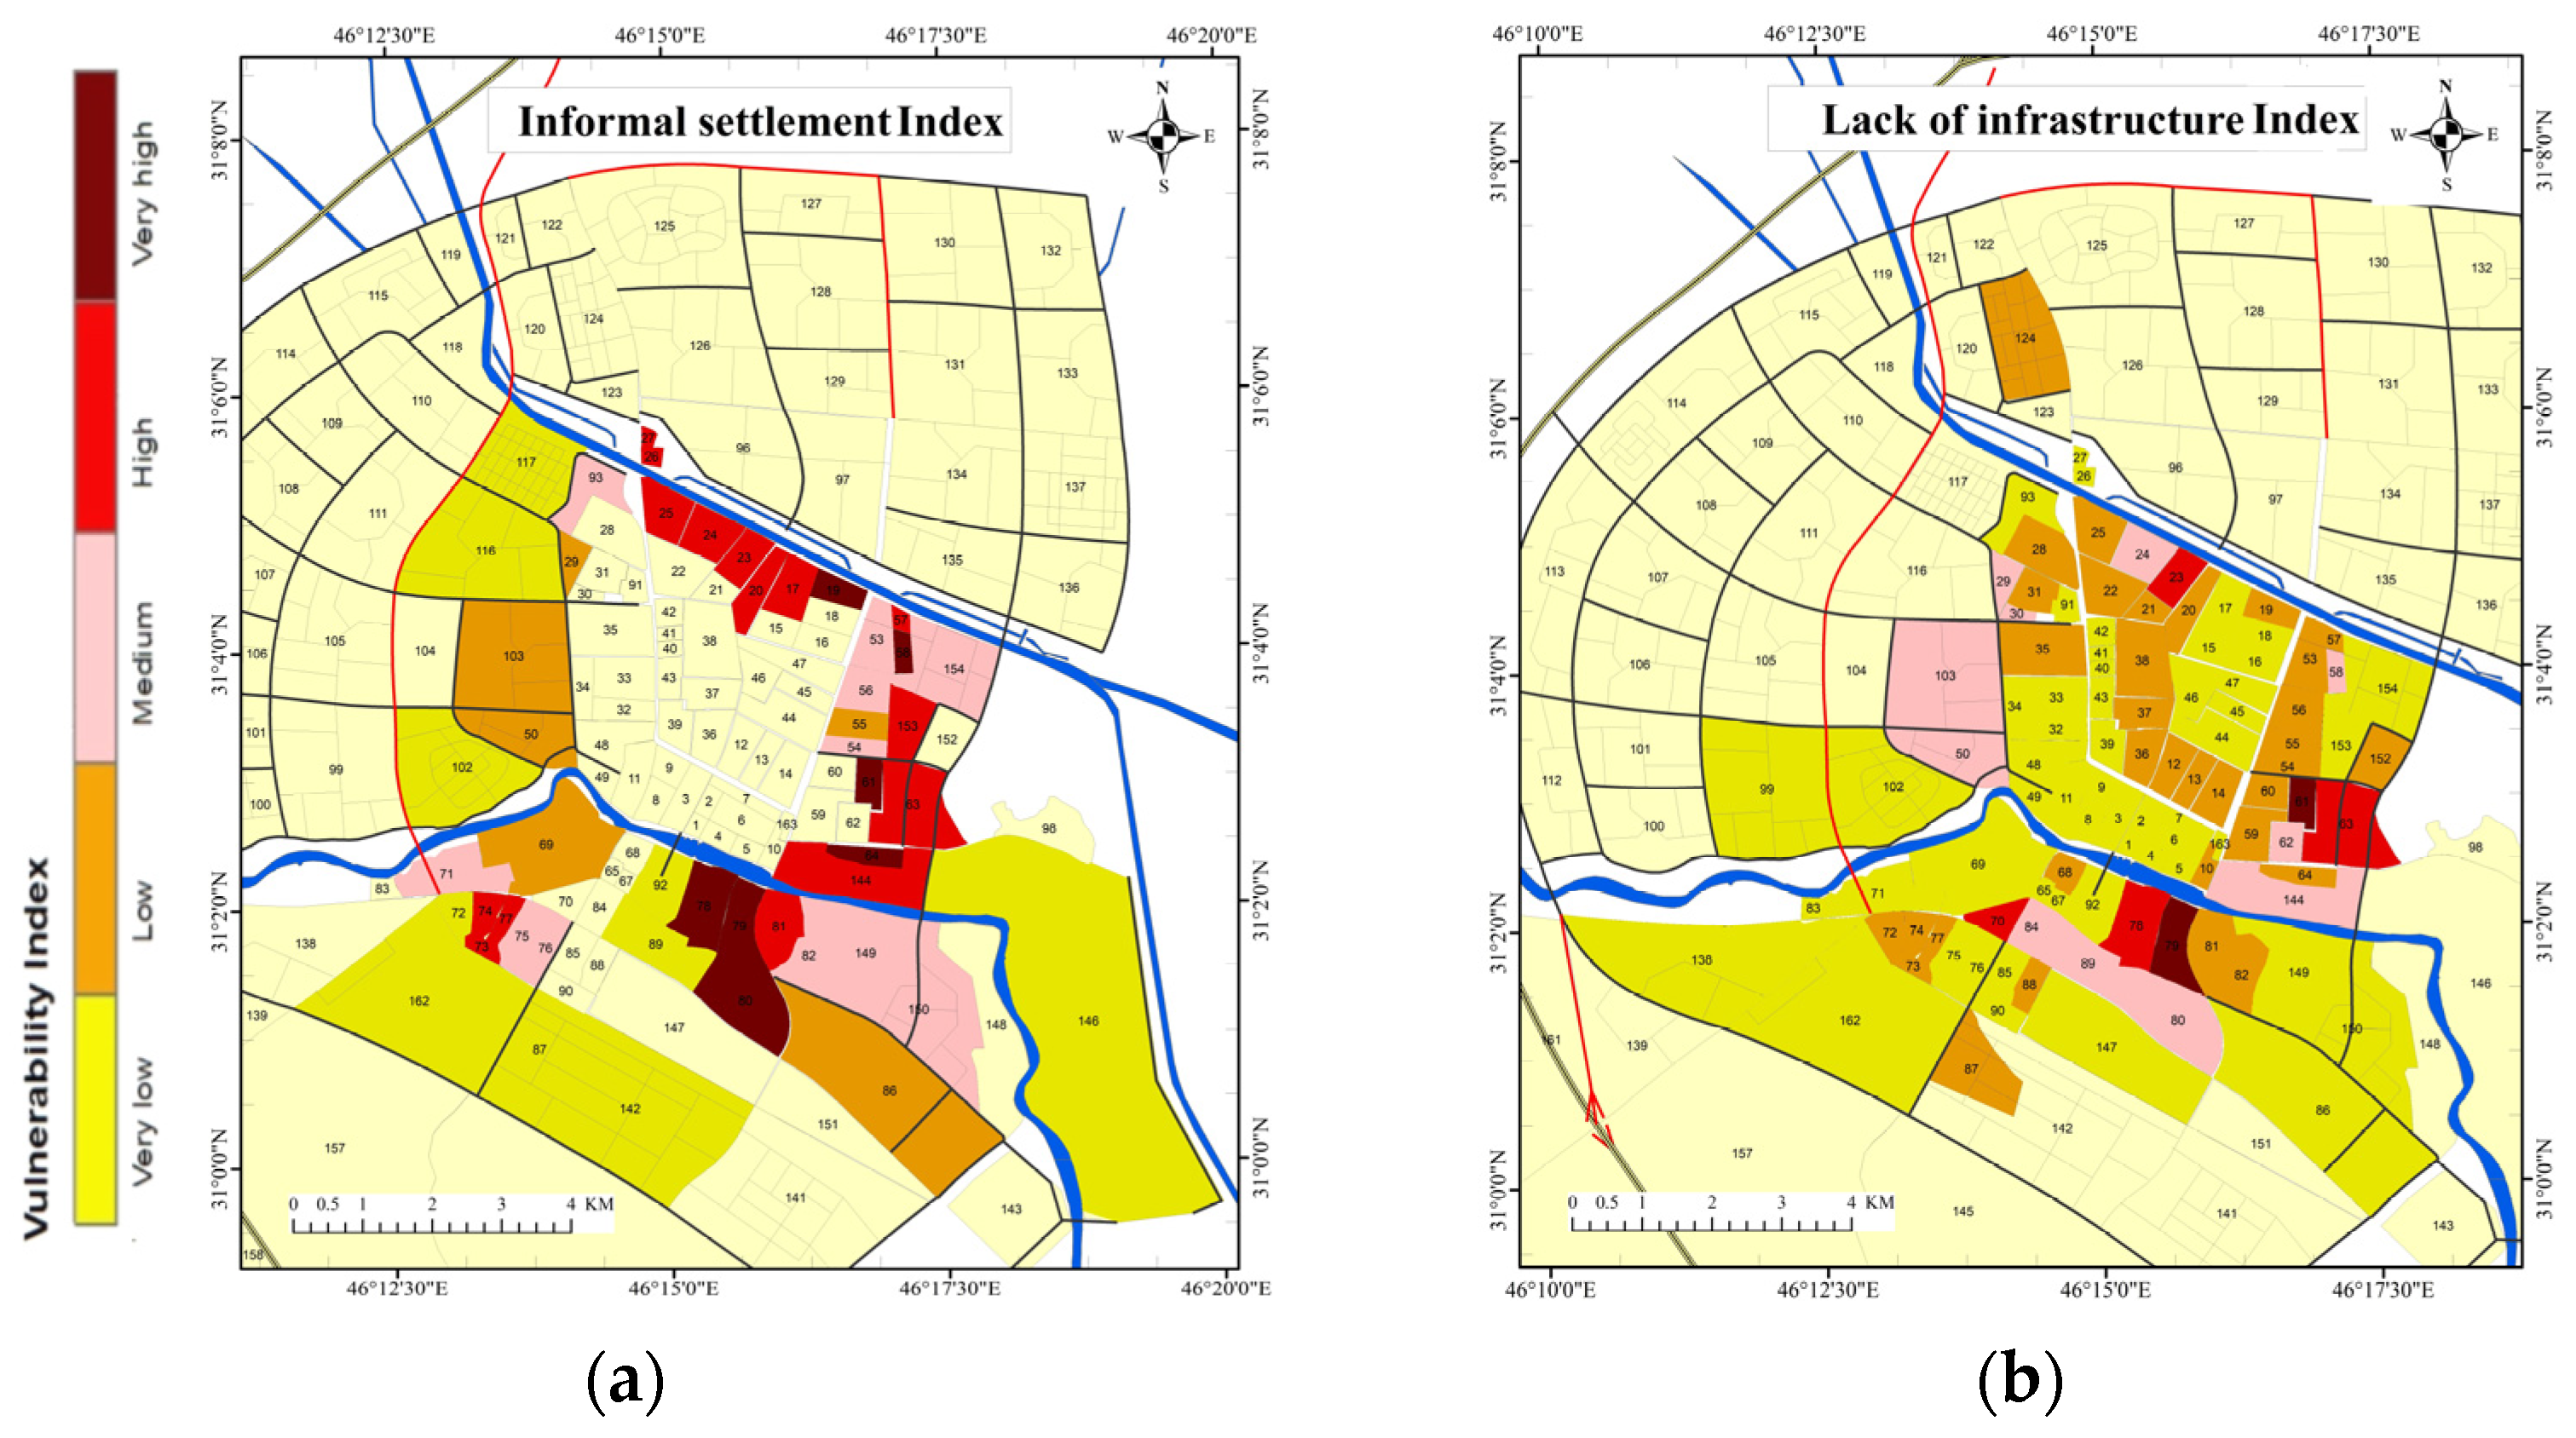
2.2. Building Domain
2.3. Urban Domain
2.4. Social Domain
3. Method
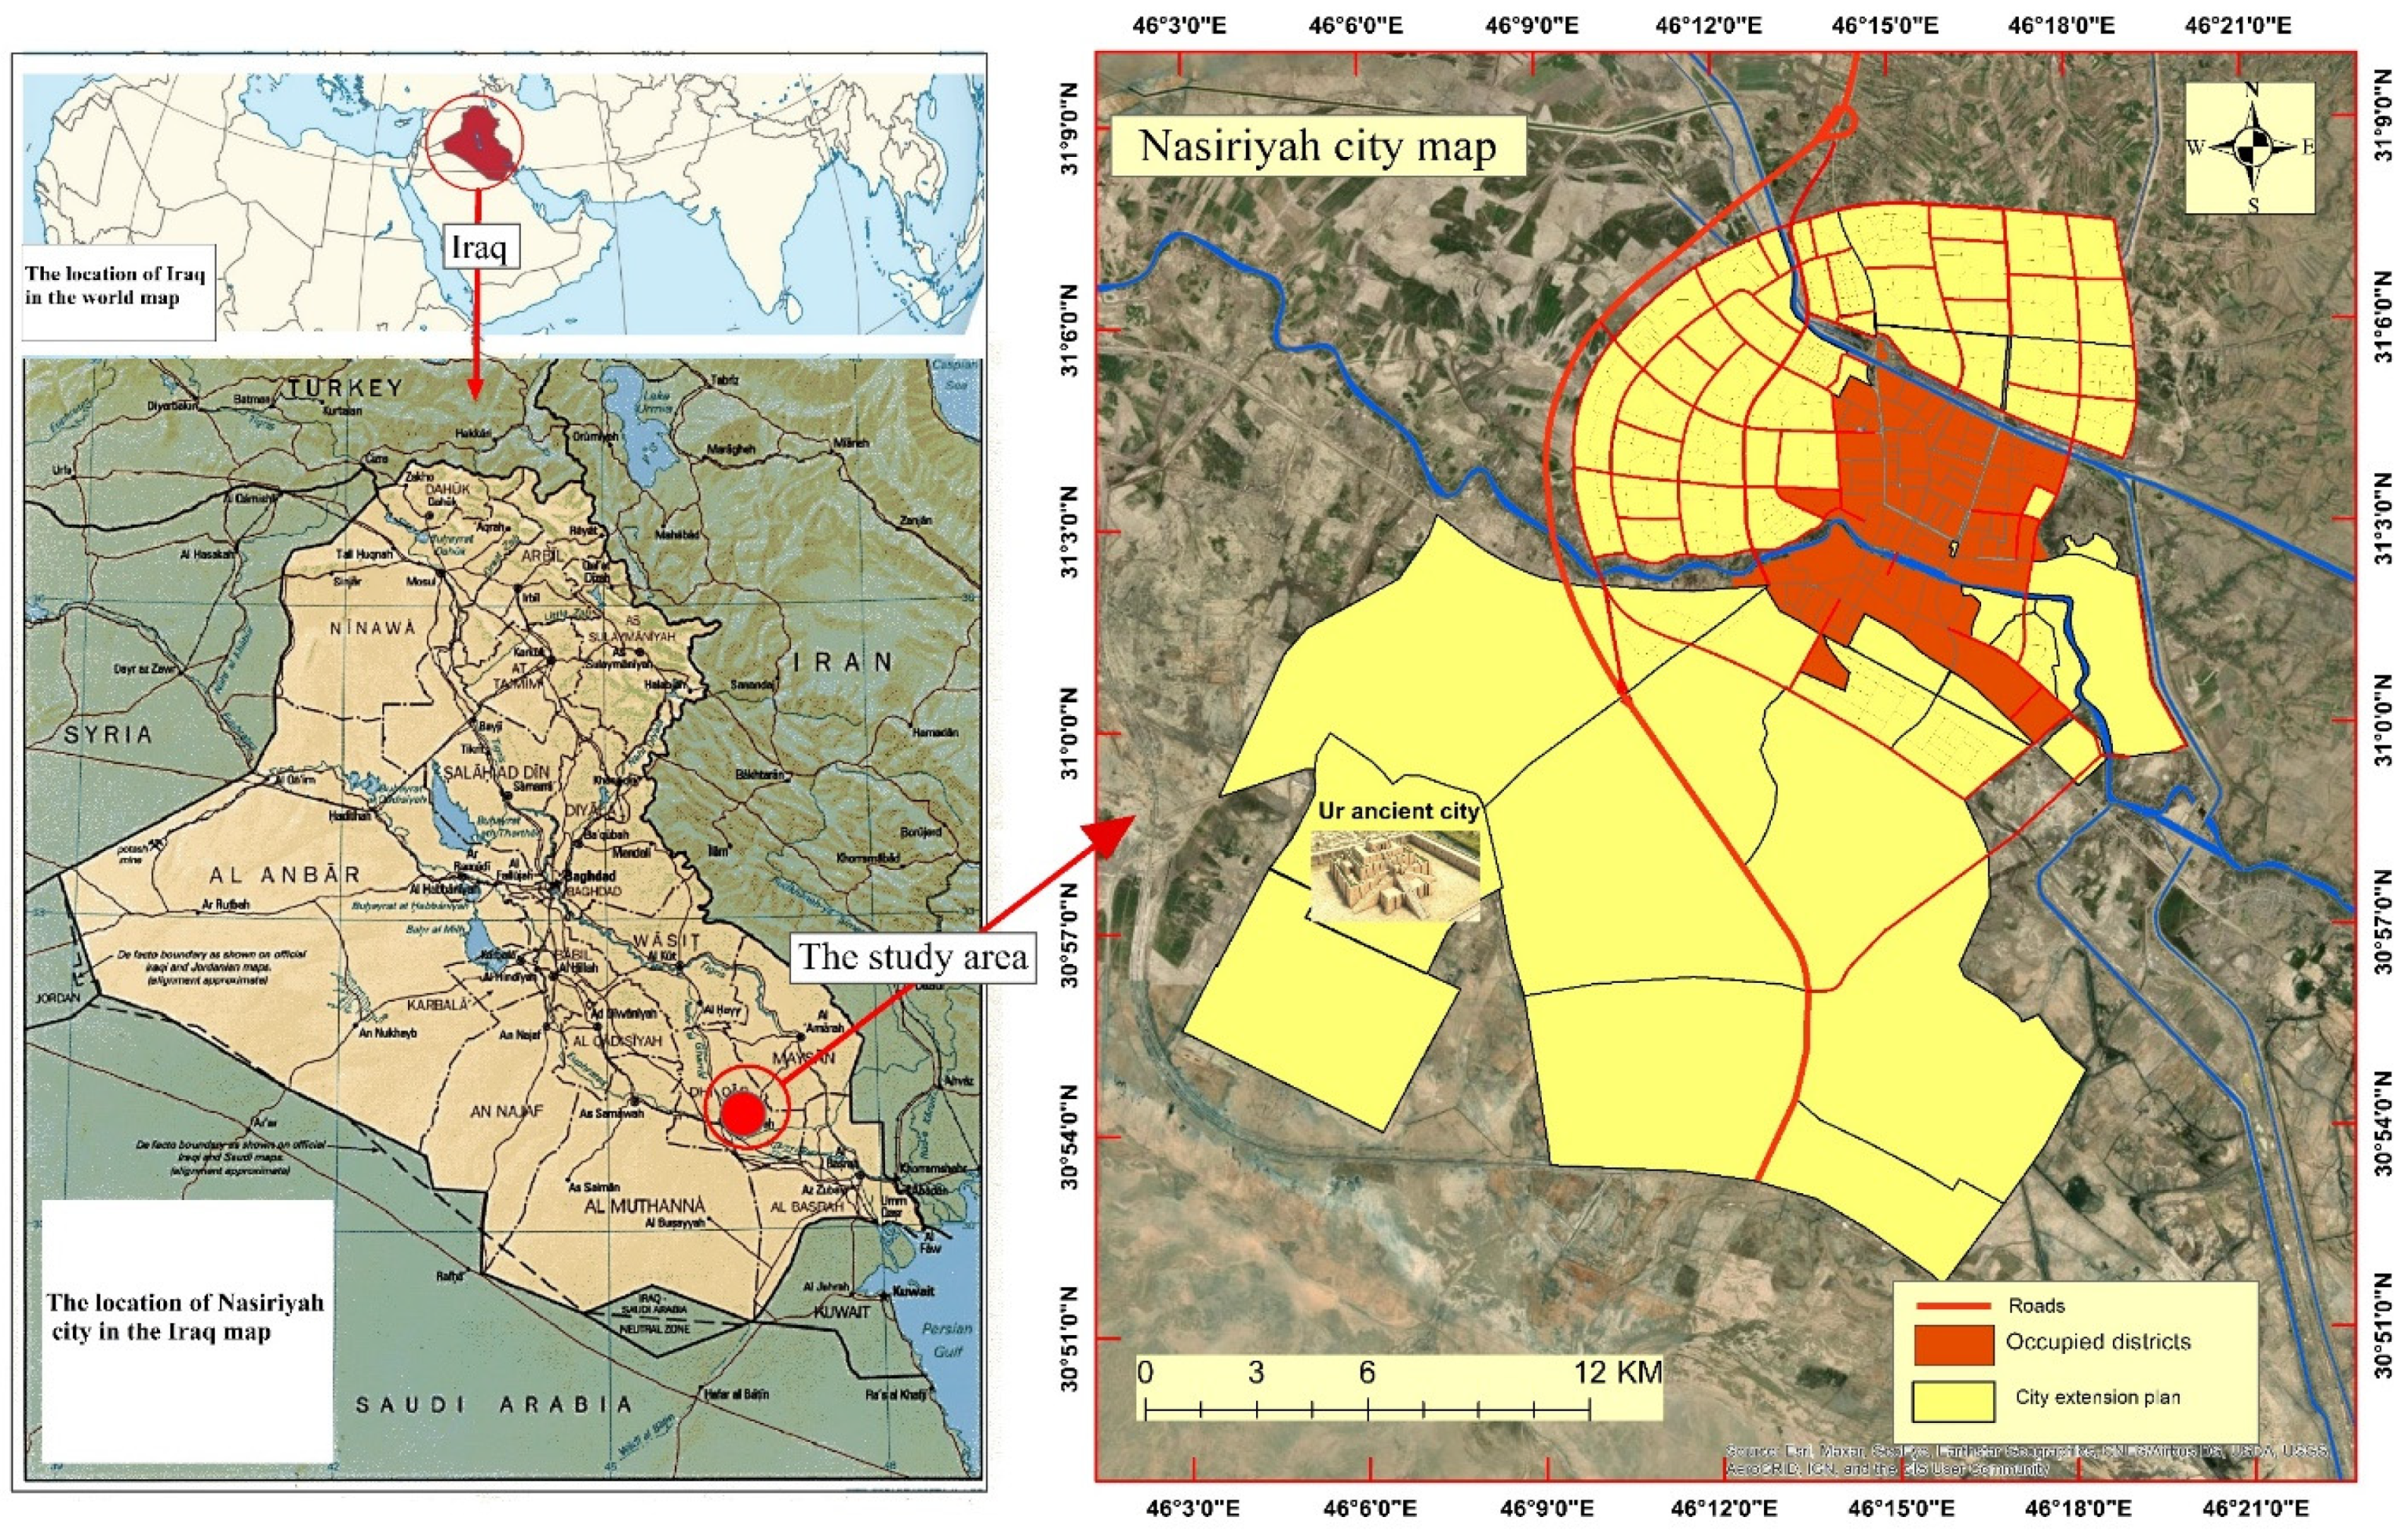
3.1. Study Area
3.2. Data Collection
3.3. GIS Database Design and Management

3.4. Delphi Technique
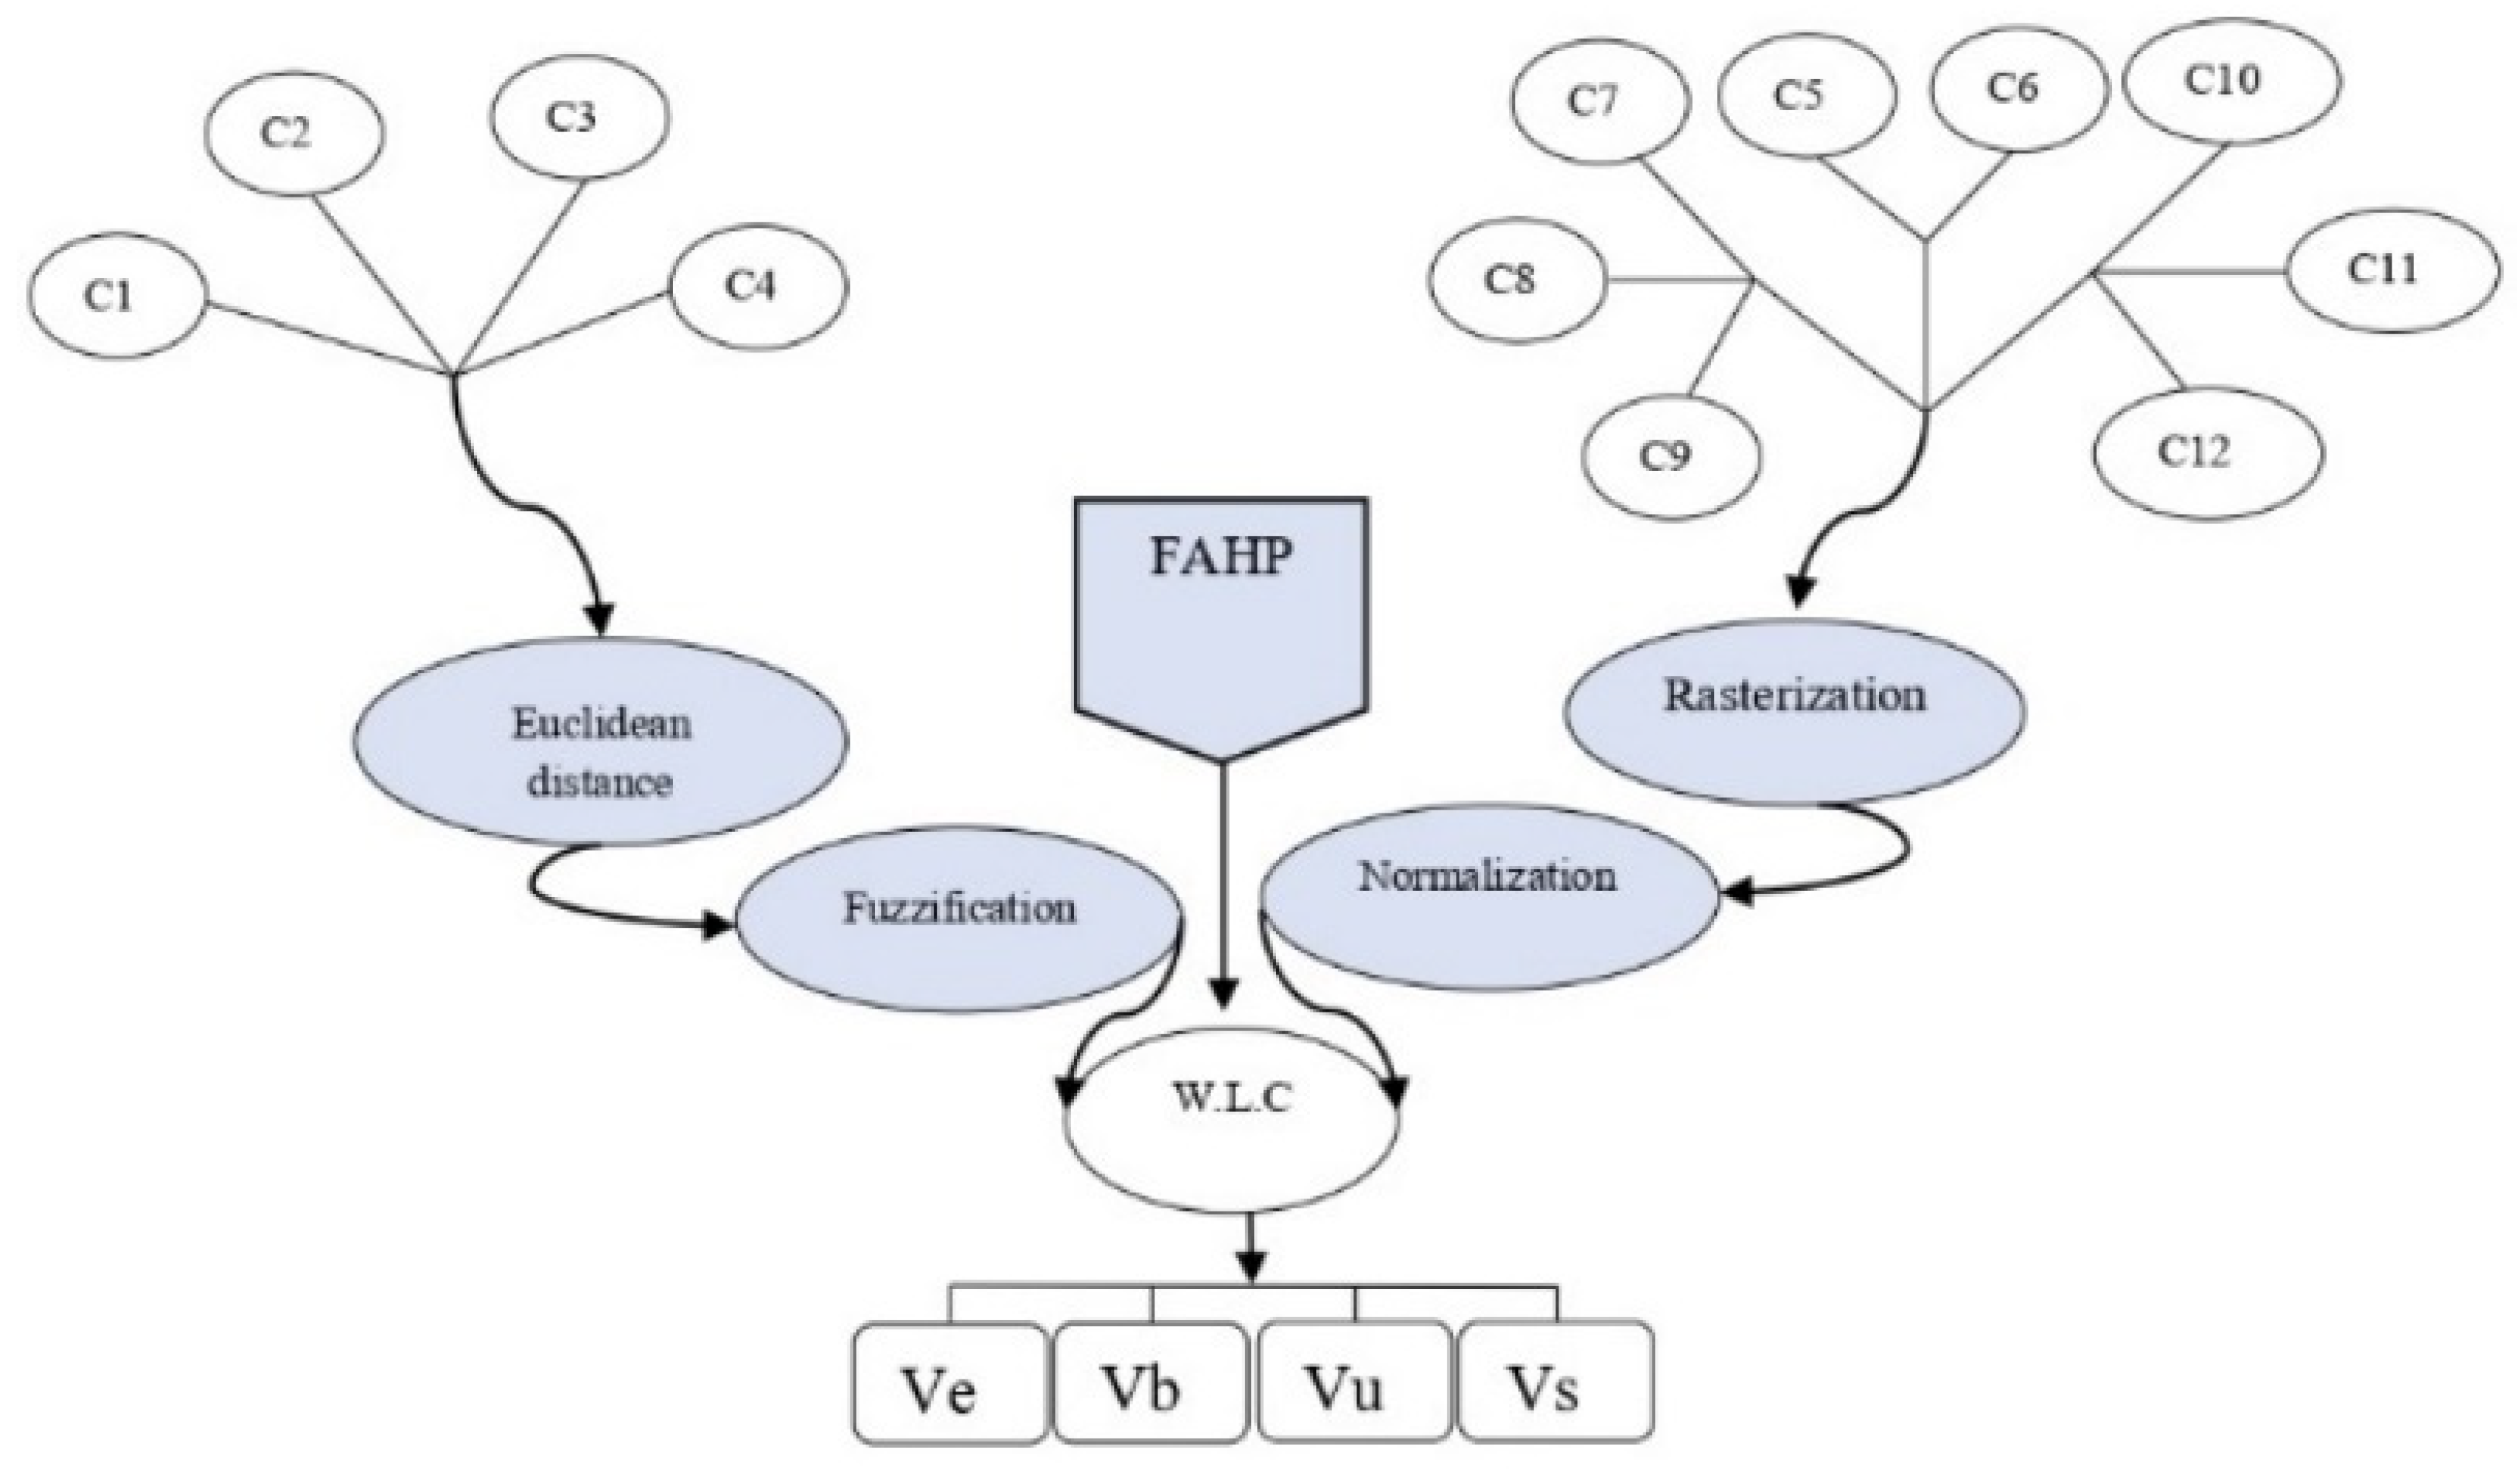
3.5. Spatial Analysis Processes
3.5.1. Spatial Analysis of Continuous Data
- Euclidean distance function
- 2.
- Fuzzification
3.5.2. Methods for Processing and Analysing Discrete Data
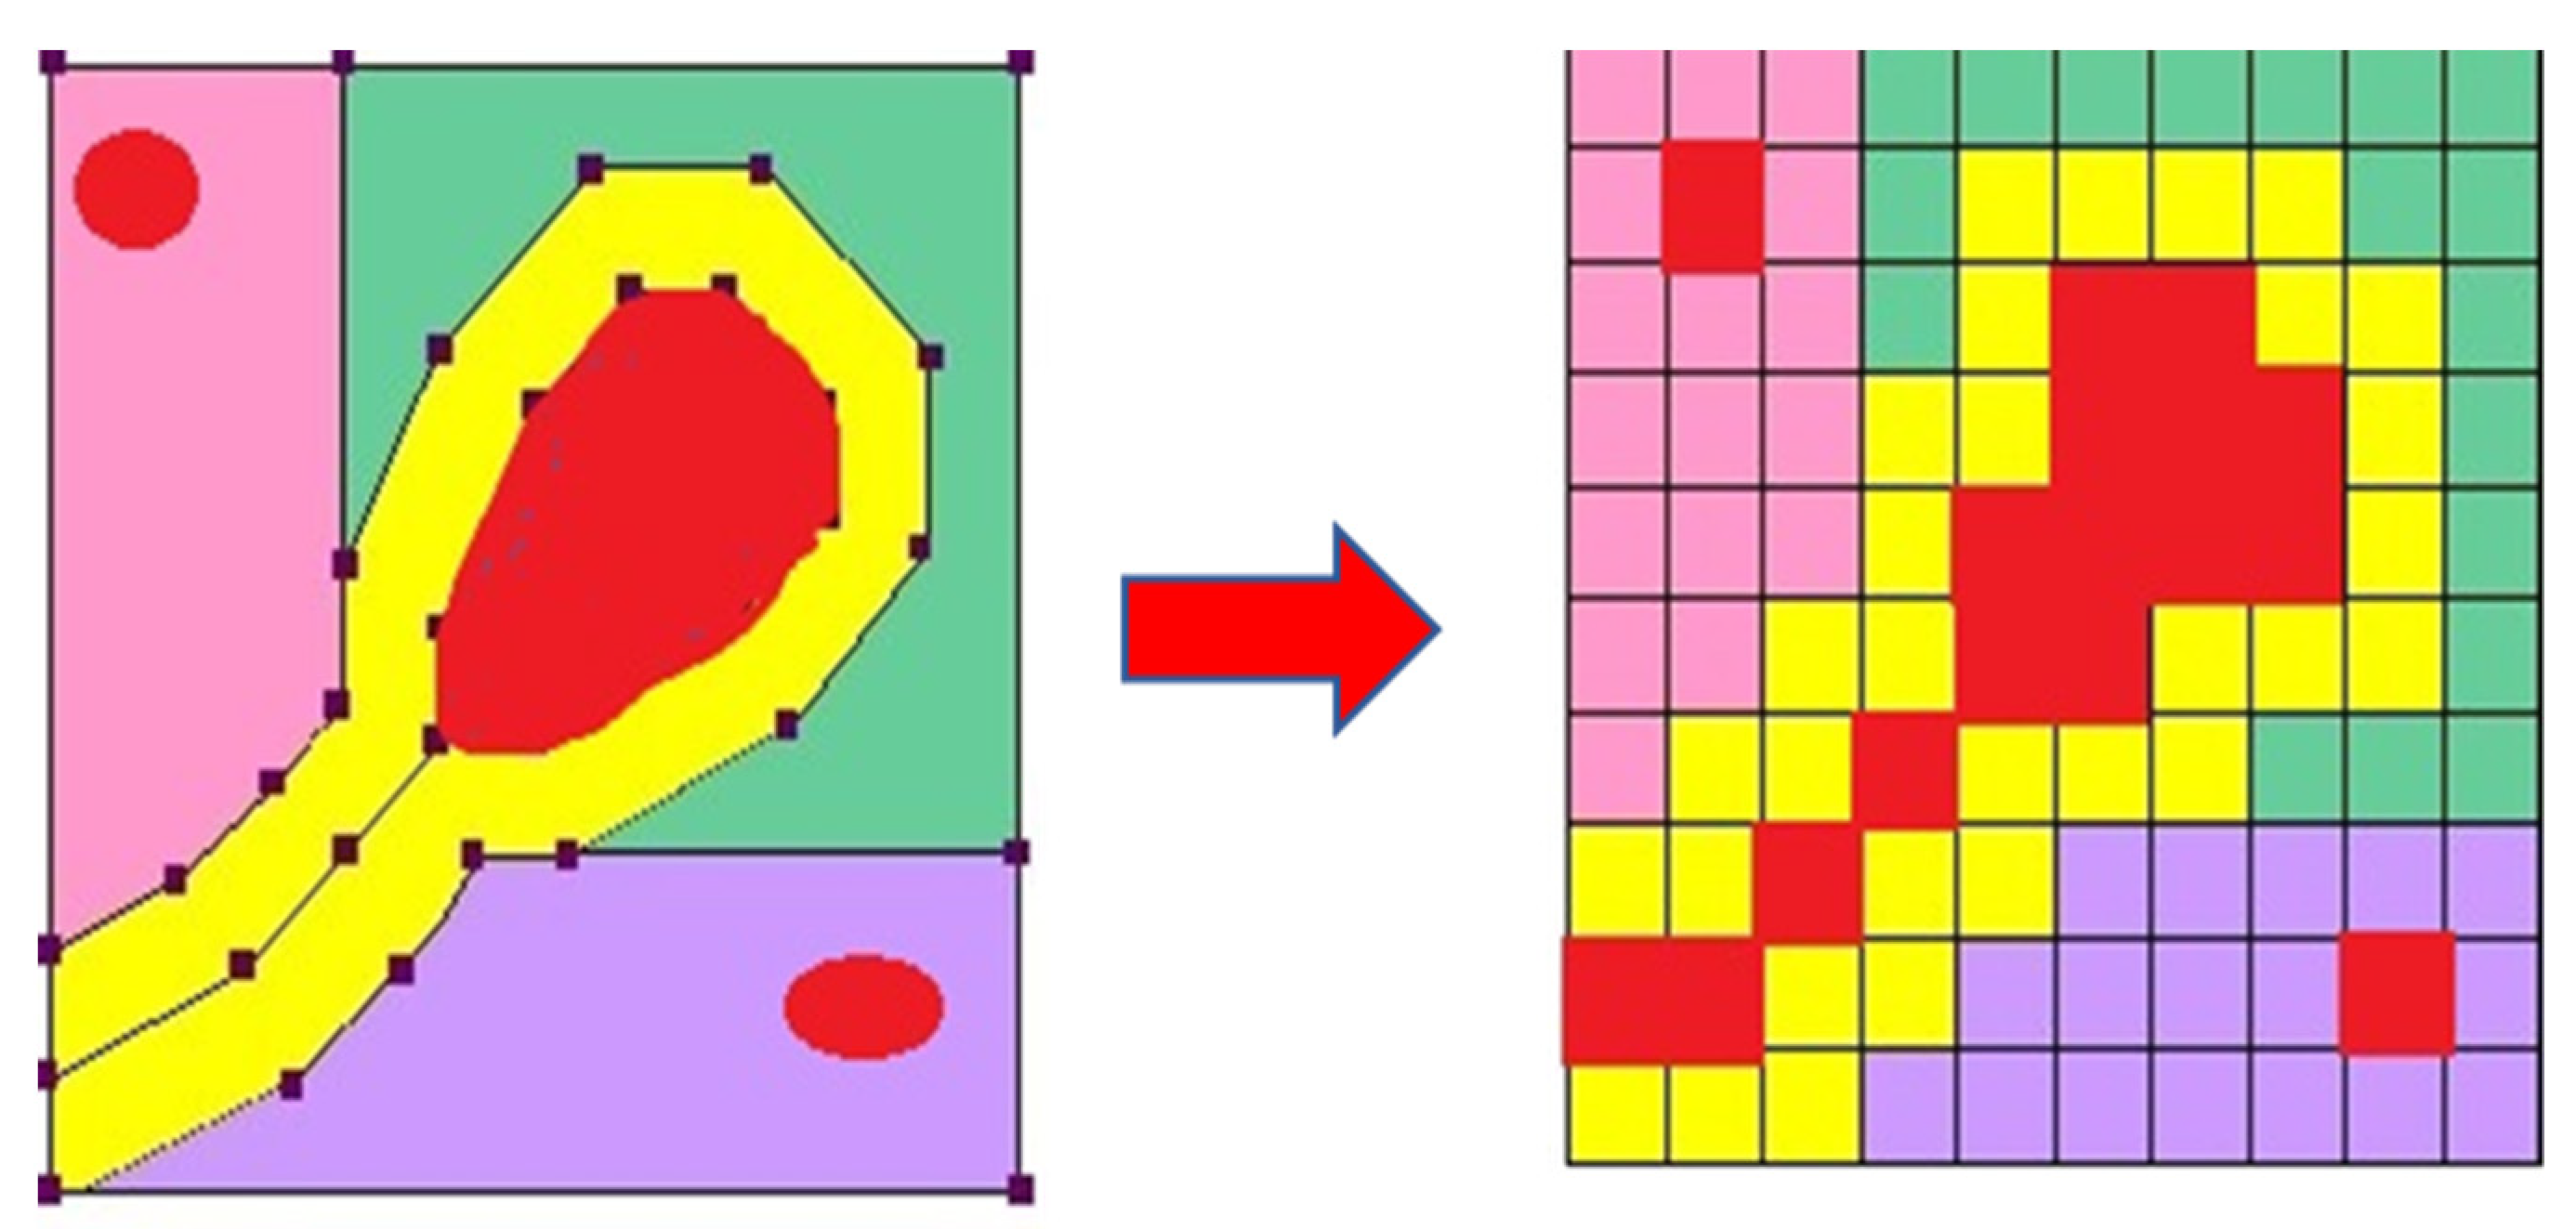
- Rasterisation
- 2.
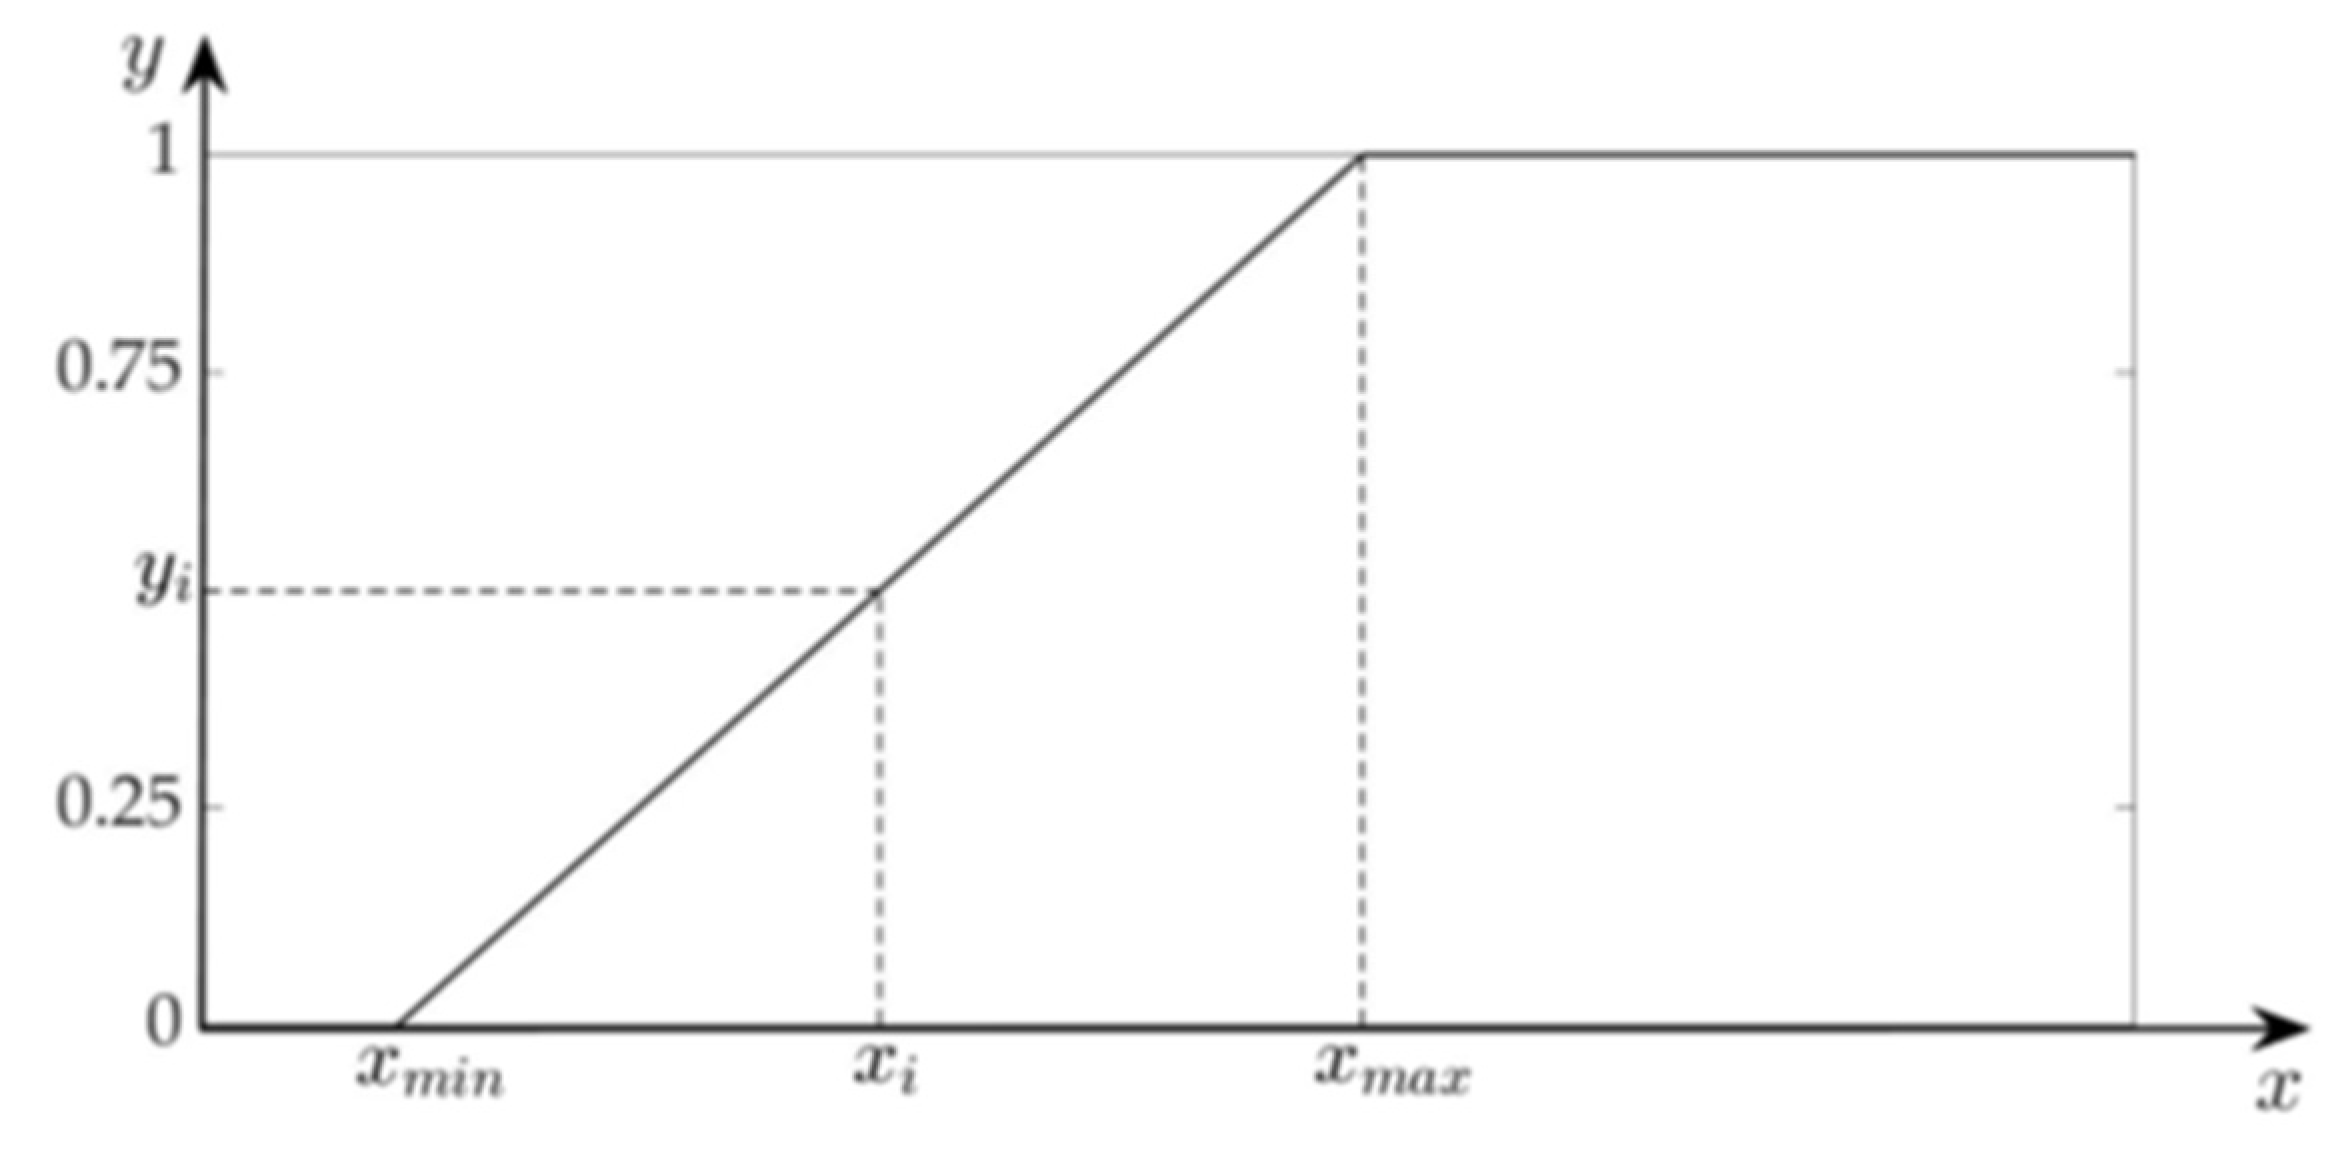
- Normalisation
3.6. AHP and FL
- Creating a pairwise comparison matrix. A pairwise comparison matrix was prepared based on the questionnaire survey results. Nine experts compared the relevant criteria with vulnerability indicators. The related weights of these criteria based on AHP were computed. To examine the consistency grade between the weighted values of various parameters, CR was calculated using the three formals (5)–(7). The results showed that the CR values were less than 0.1; thus, the pairwise comparison matrices were suitable.where (aij) is a pairwise comparison matrix element, and (wi) is the weight value of each parameter.
- 2.
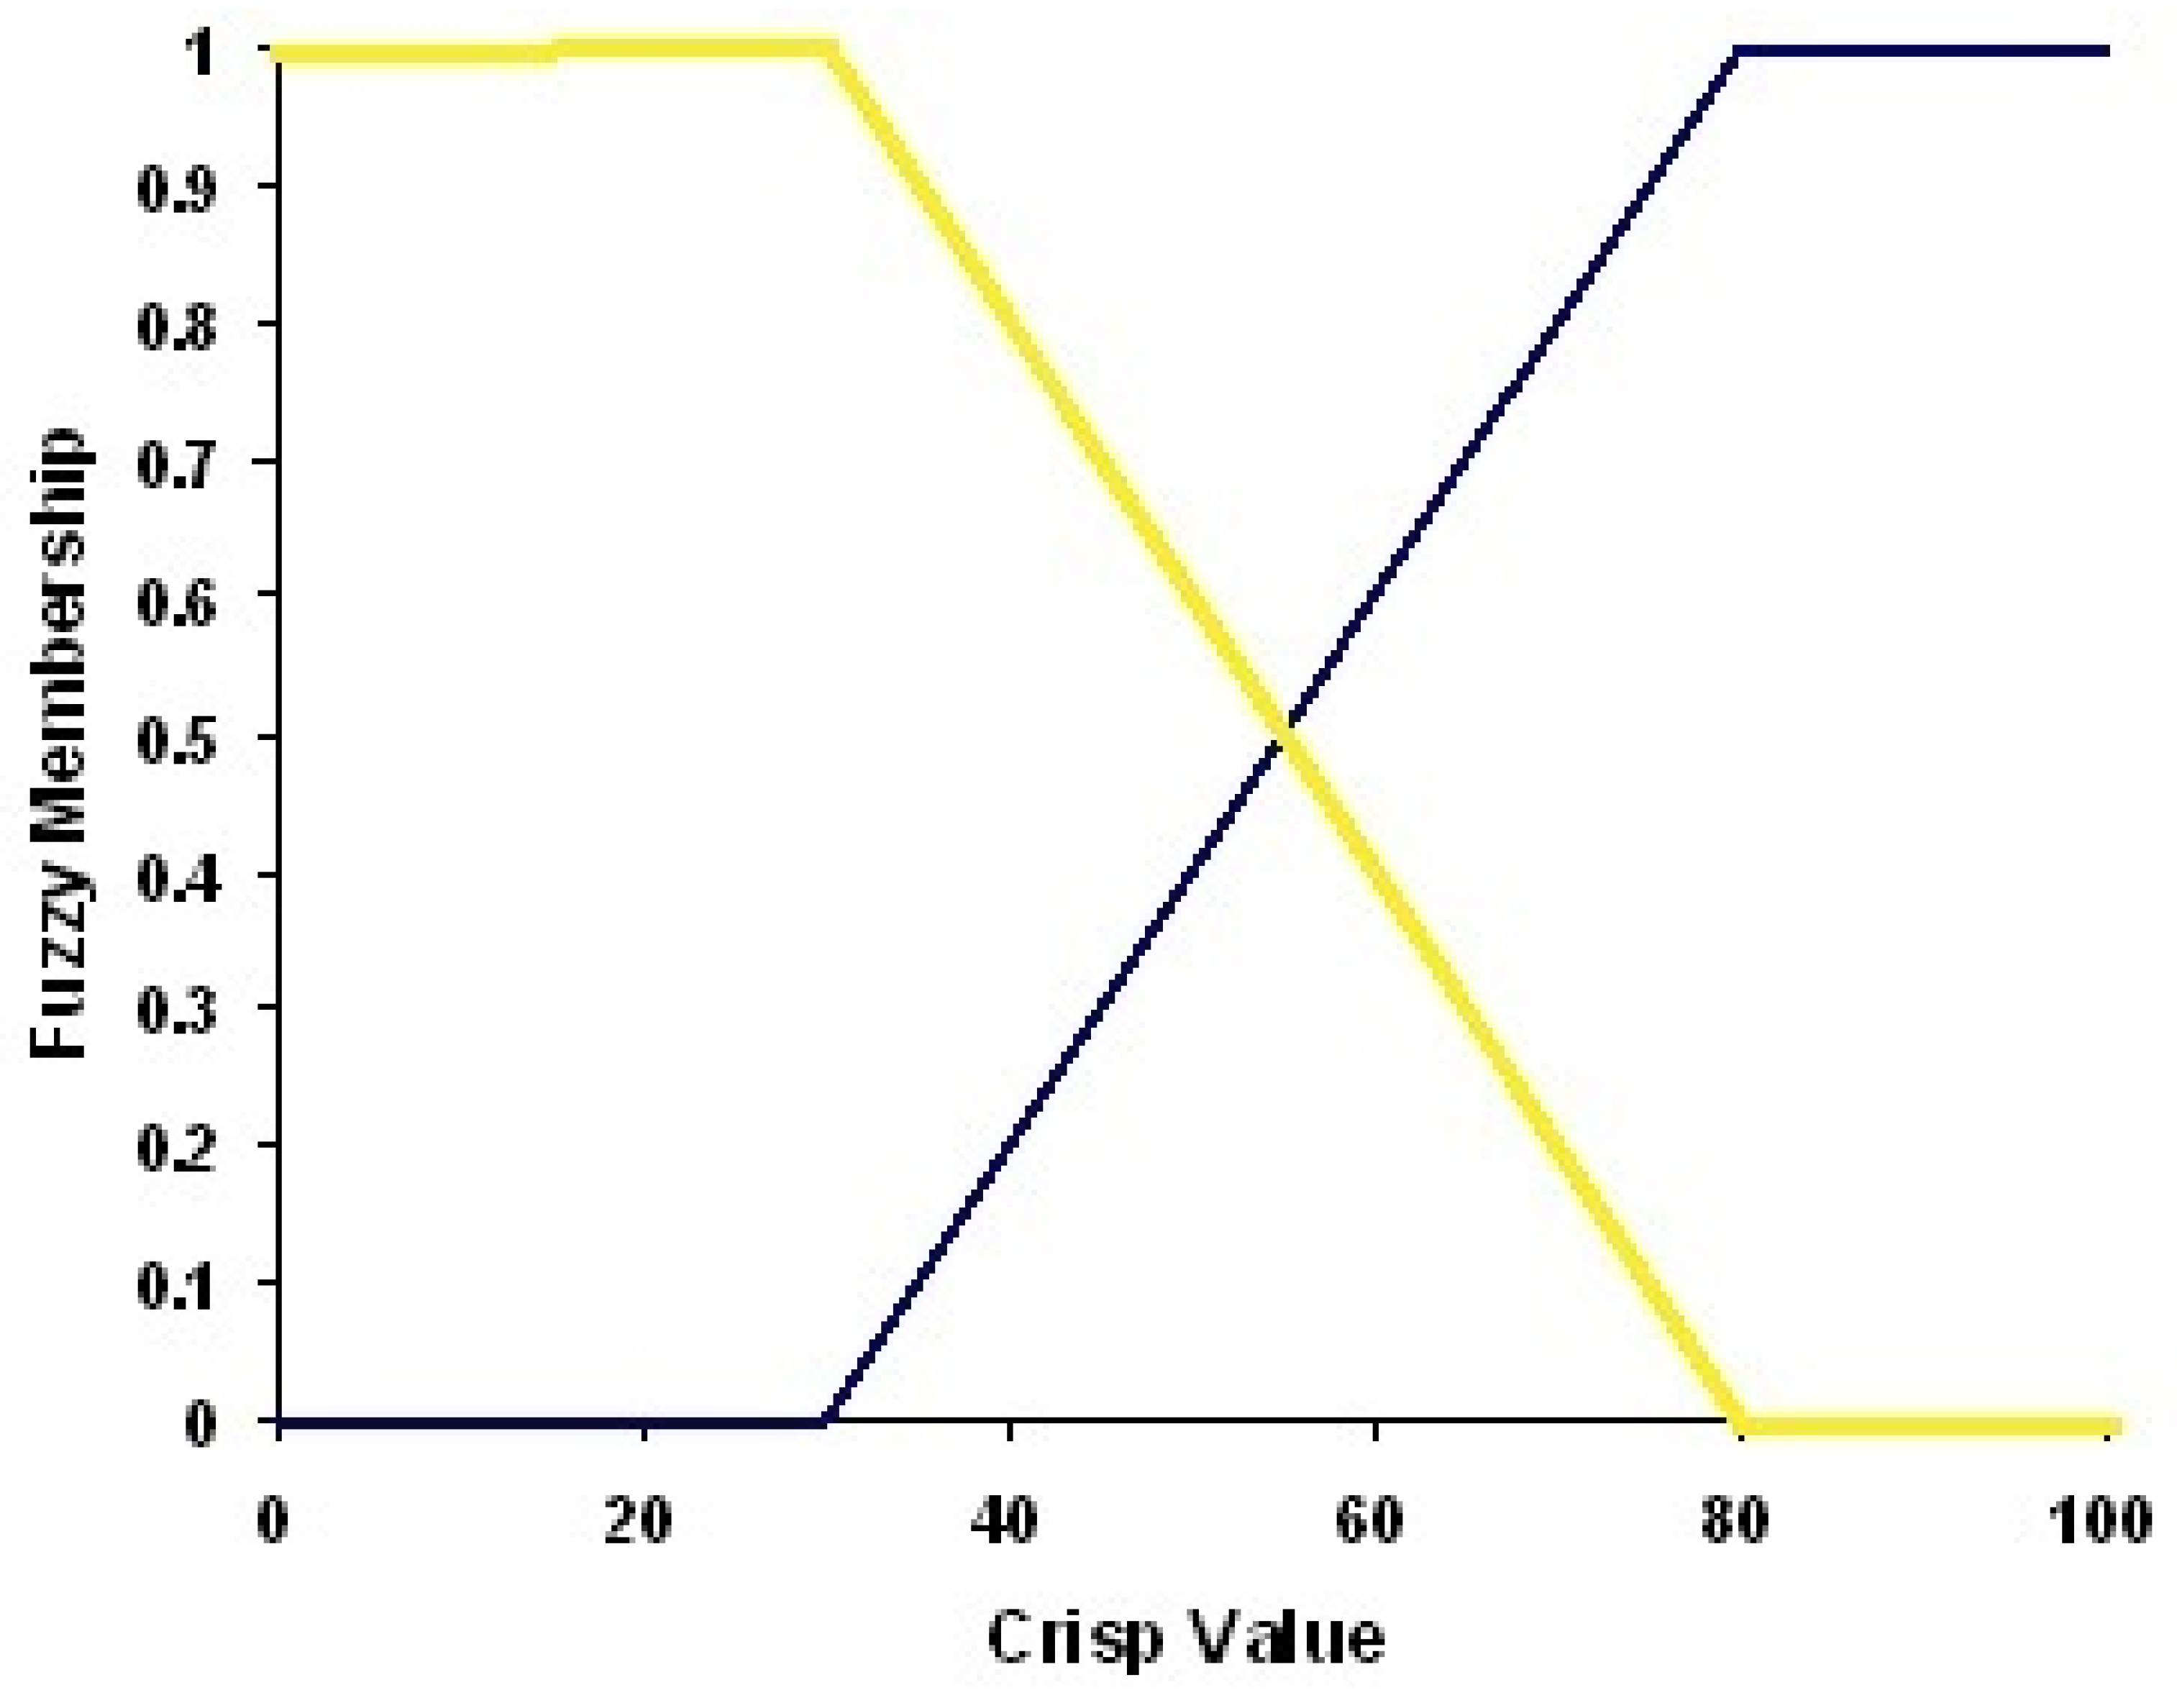
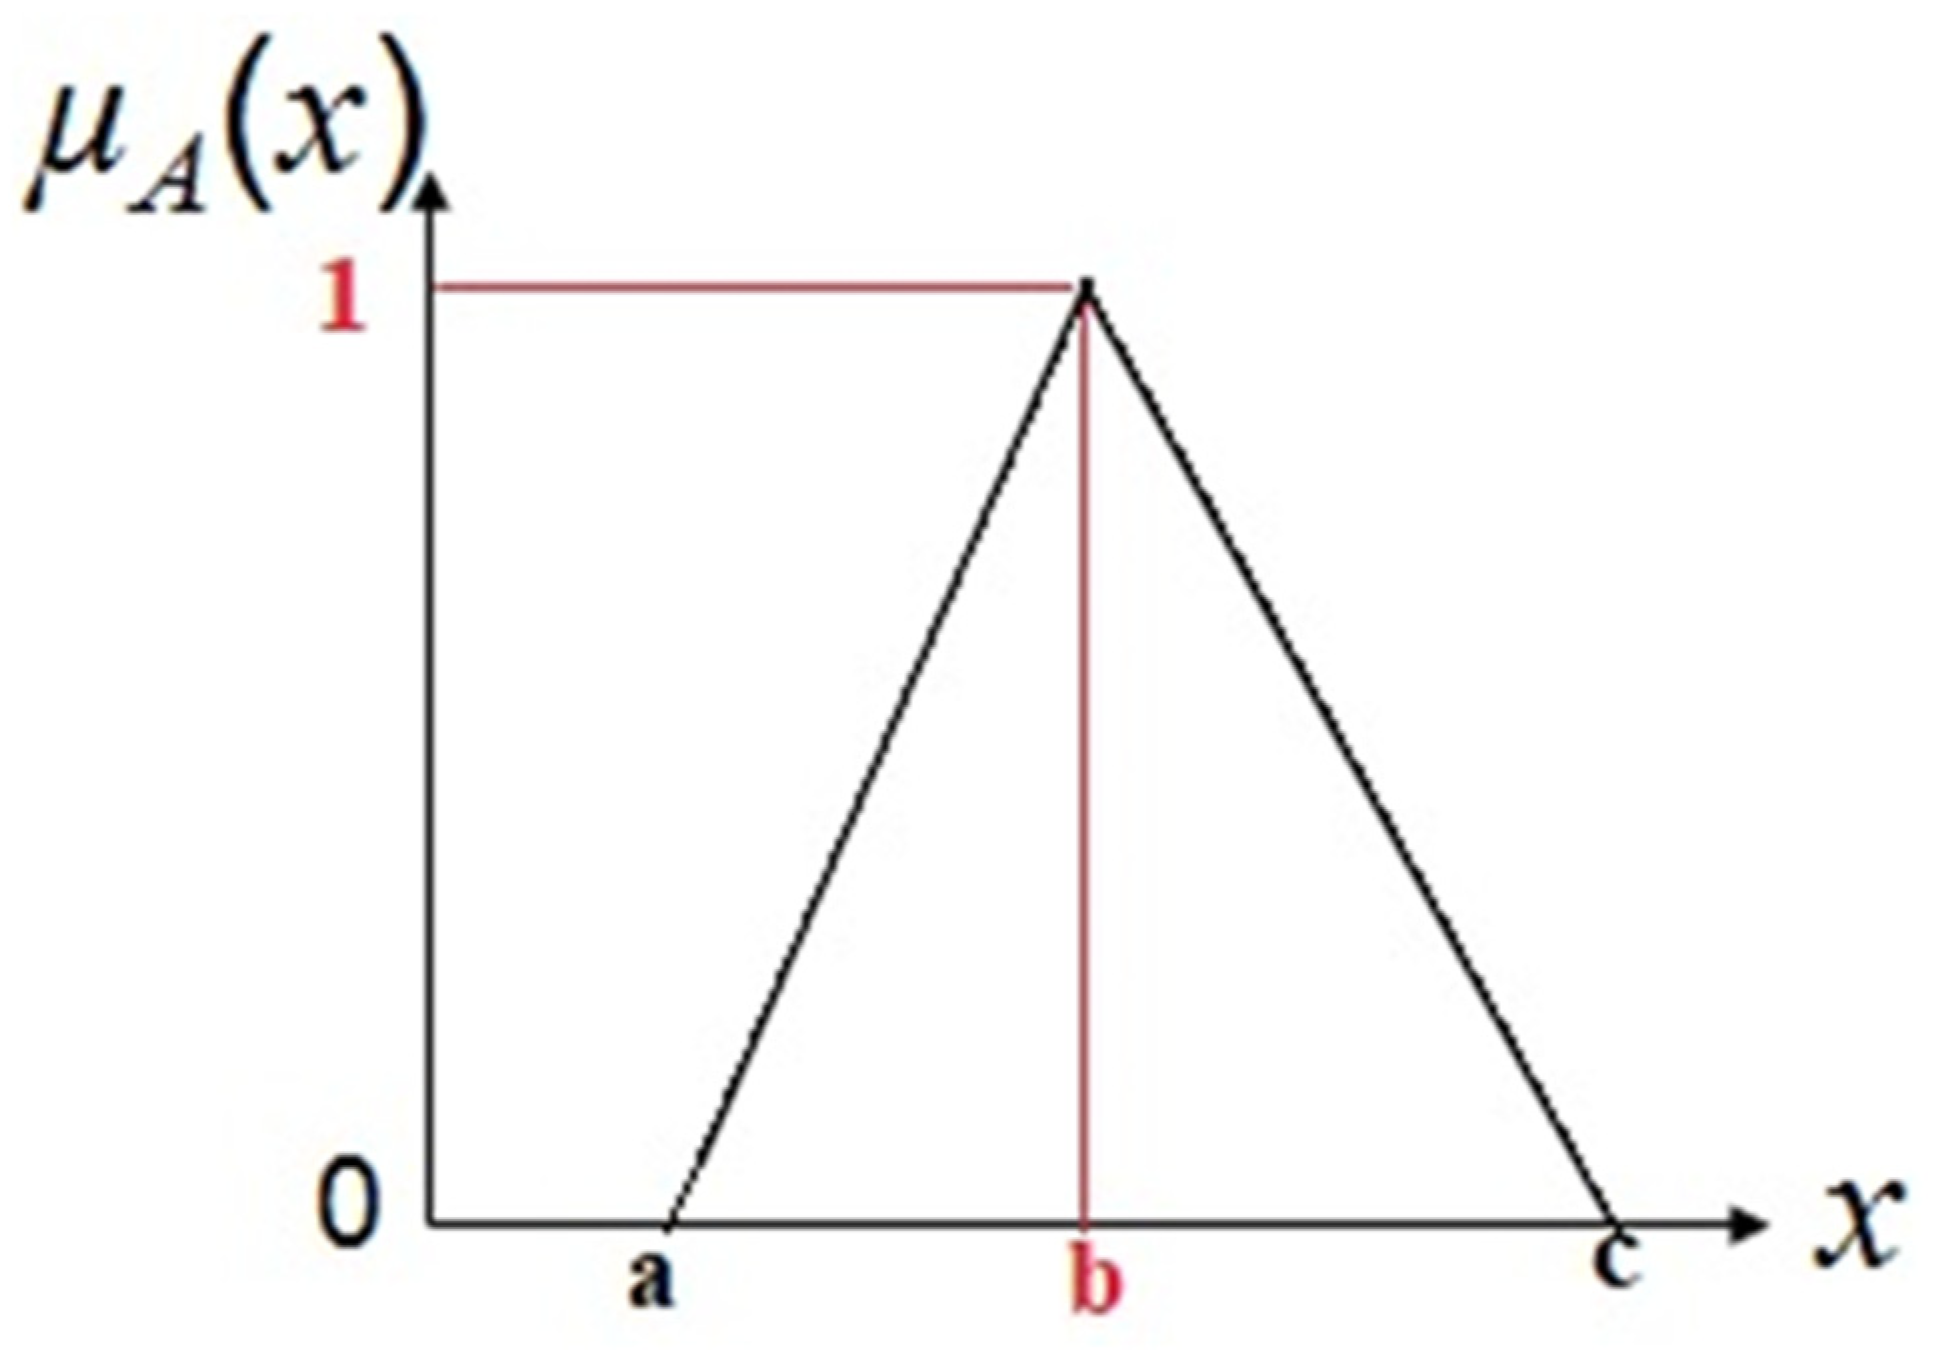
- The comparative importance hierarchy values are crisp in AHP. Thus, crisp values were transformed into fuzzy numbers in this step based on the triangular fuzzy membership equation, i.e., Formula (8). Fuzzy value is described by three determinations {a, b, c}, as illustrated in Figure 8.
- 3.
- In this step, the fuzzy geometric mean value () of every criterion was calculated using Formula (9).
- 4.
- The fourth step was the determination of the fuzzy comparative weight of each criterion, as follows:where (ij) is a fuzzy comparison matrix of dimension i to criterion j.
- 5.
- Determining the weights of the crisp values using the centre of area (COA) method based on Formula (11).
- 6.
- The final step was the standardisation of the relative weights (wi) by applying Formula (12), and lastly, collecting the final weight (Wni). Table 6 provides the results.
3.7. WLC
3.8. Final Fuzzy Map
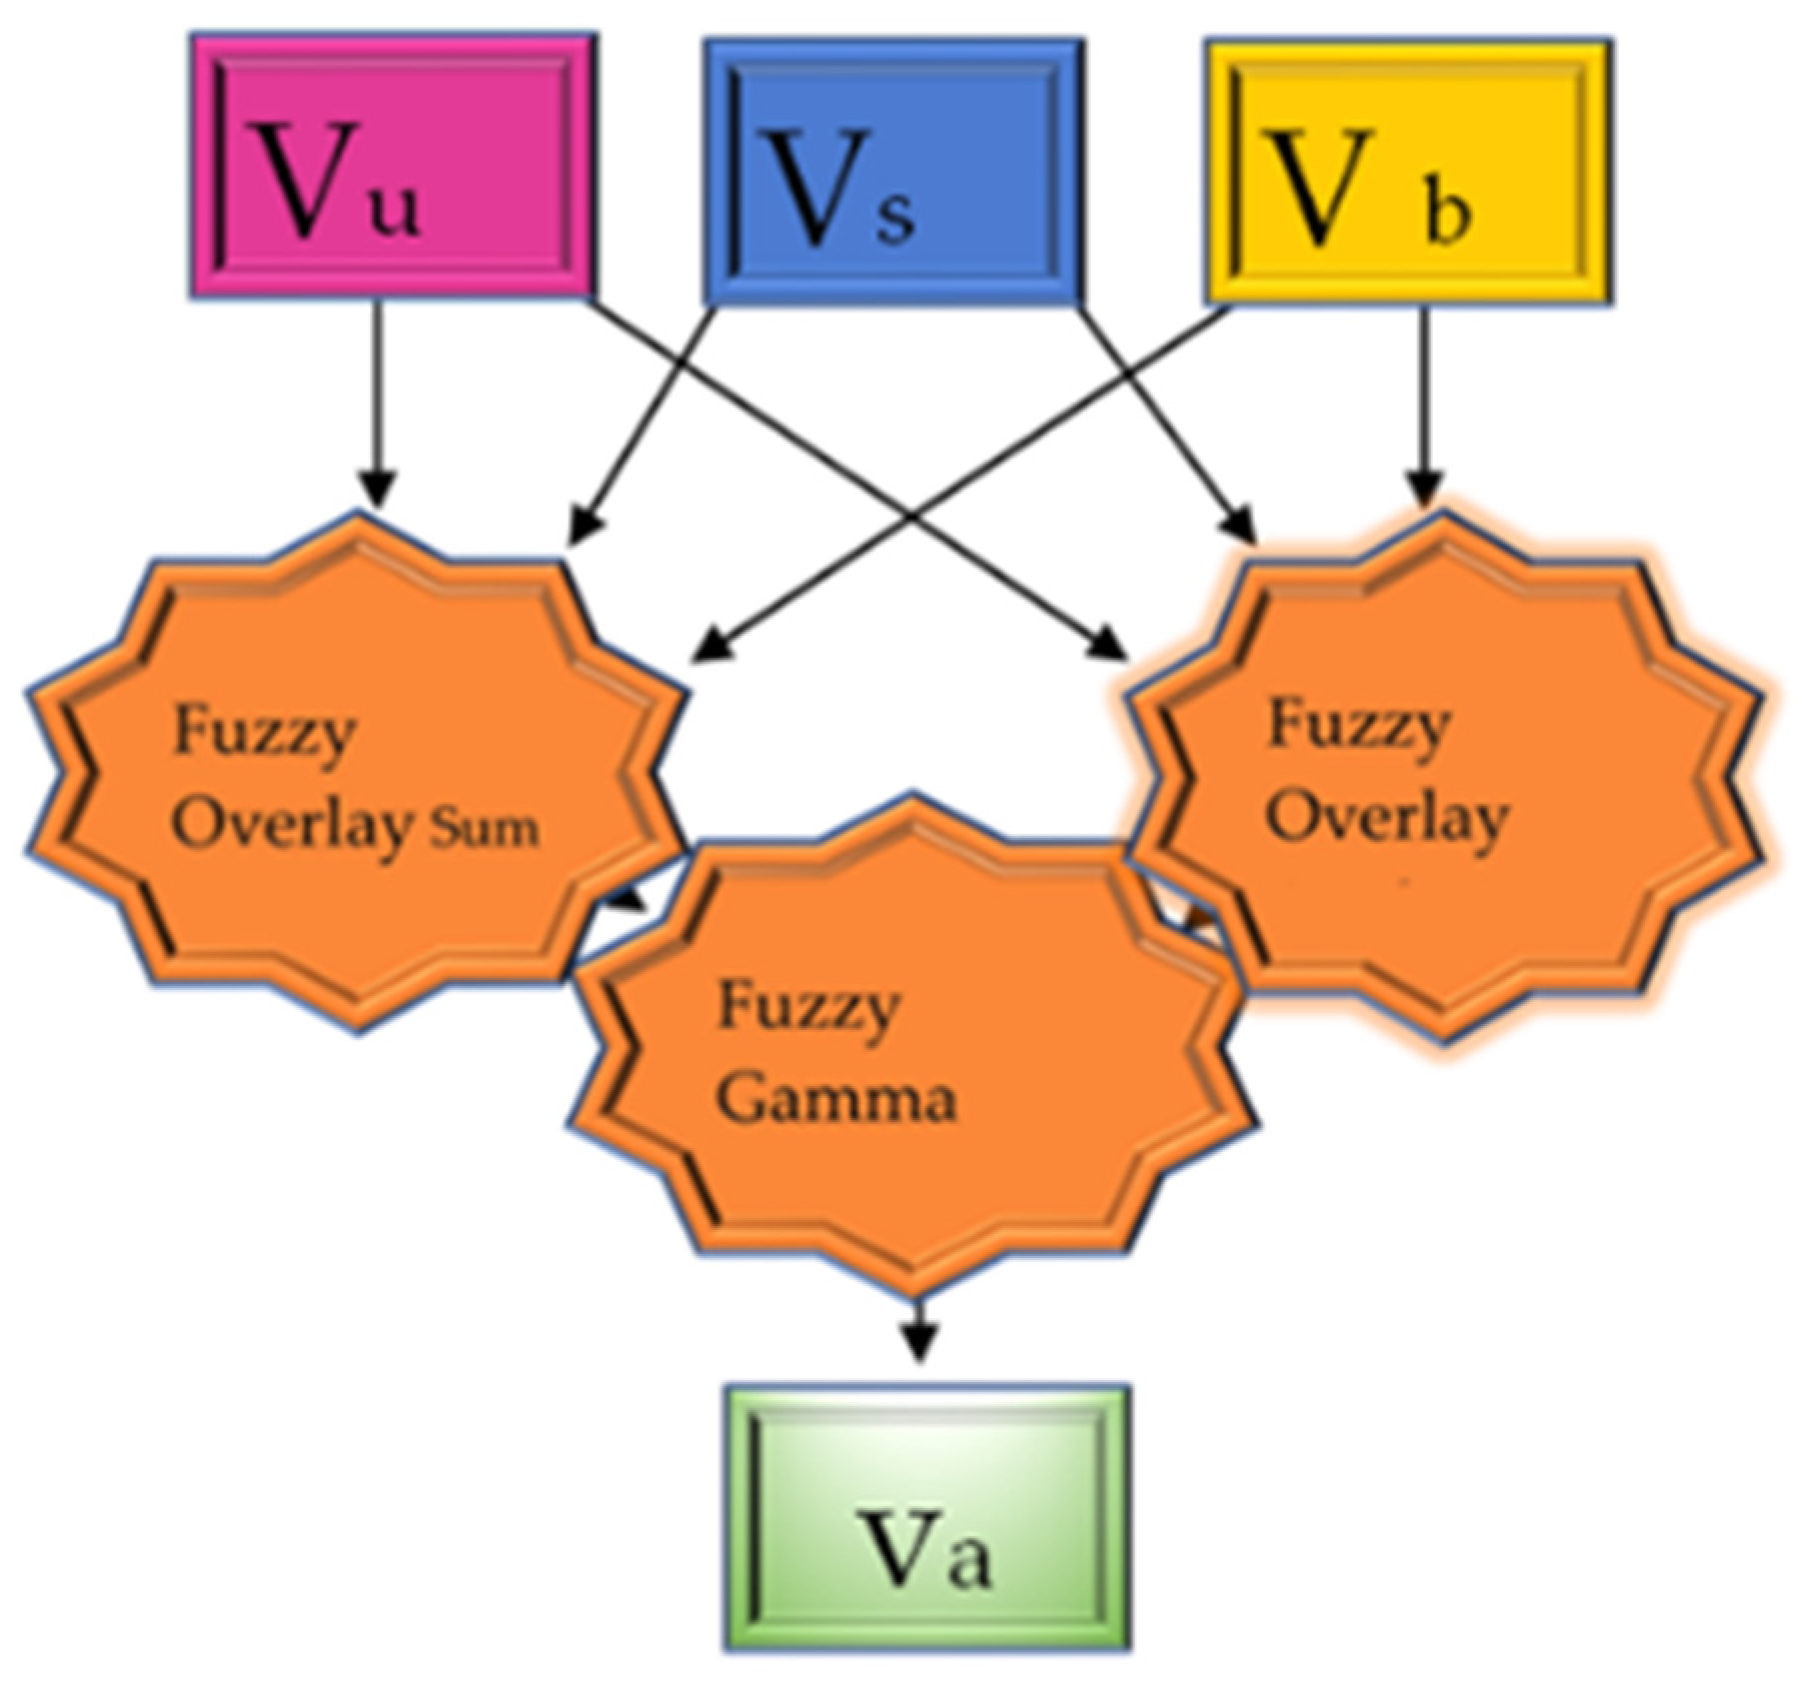
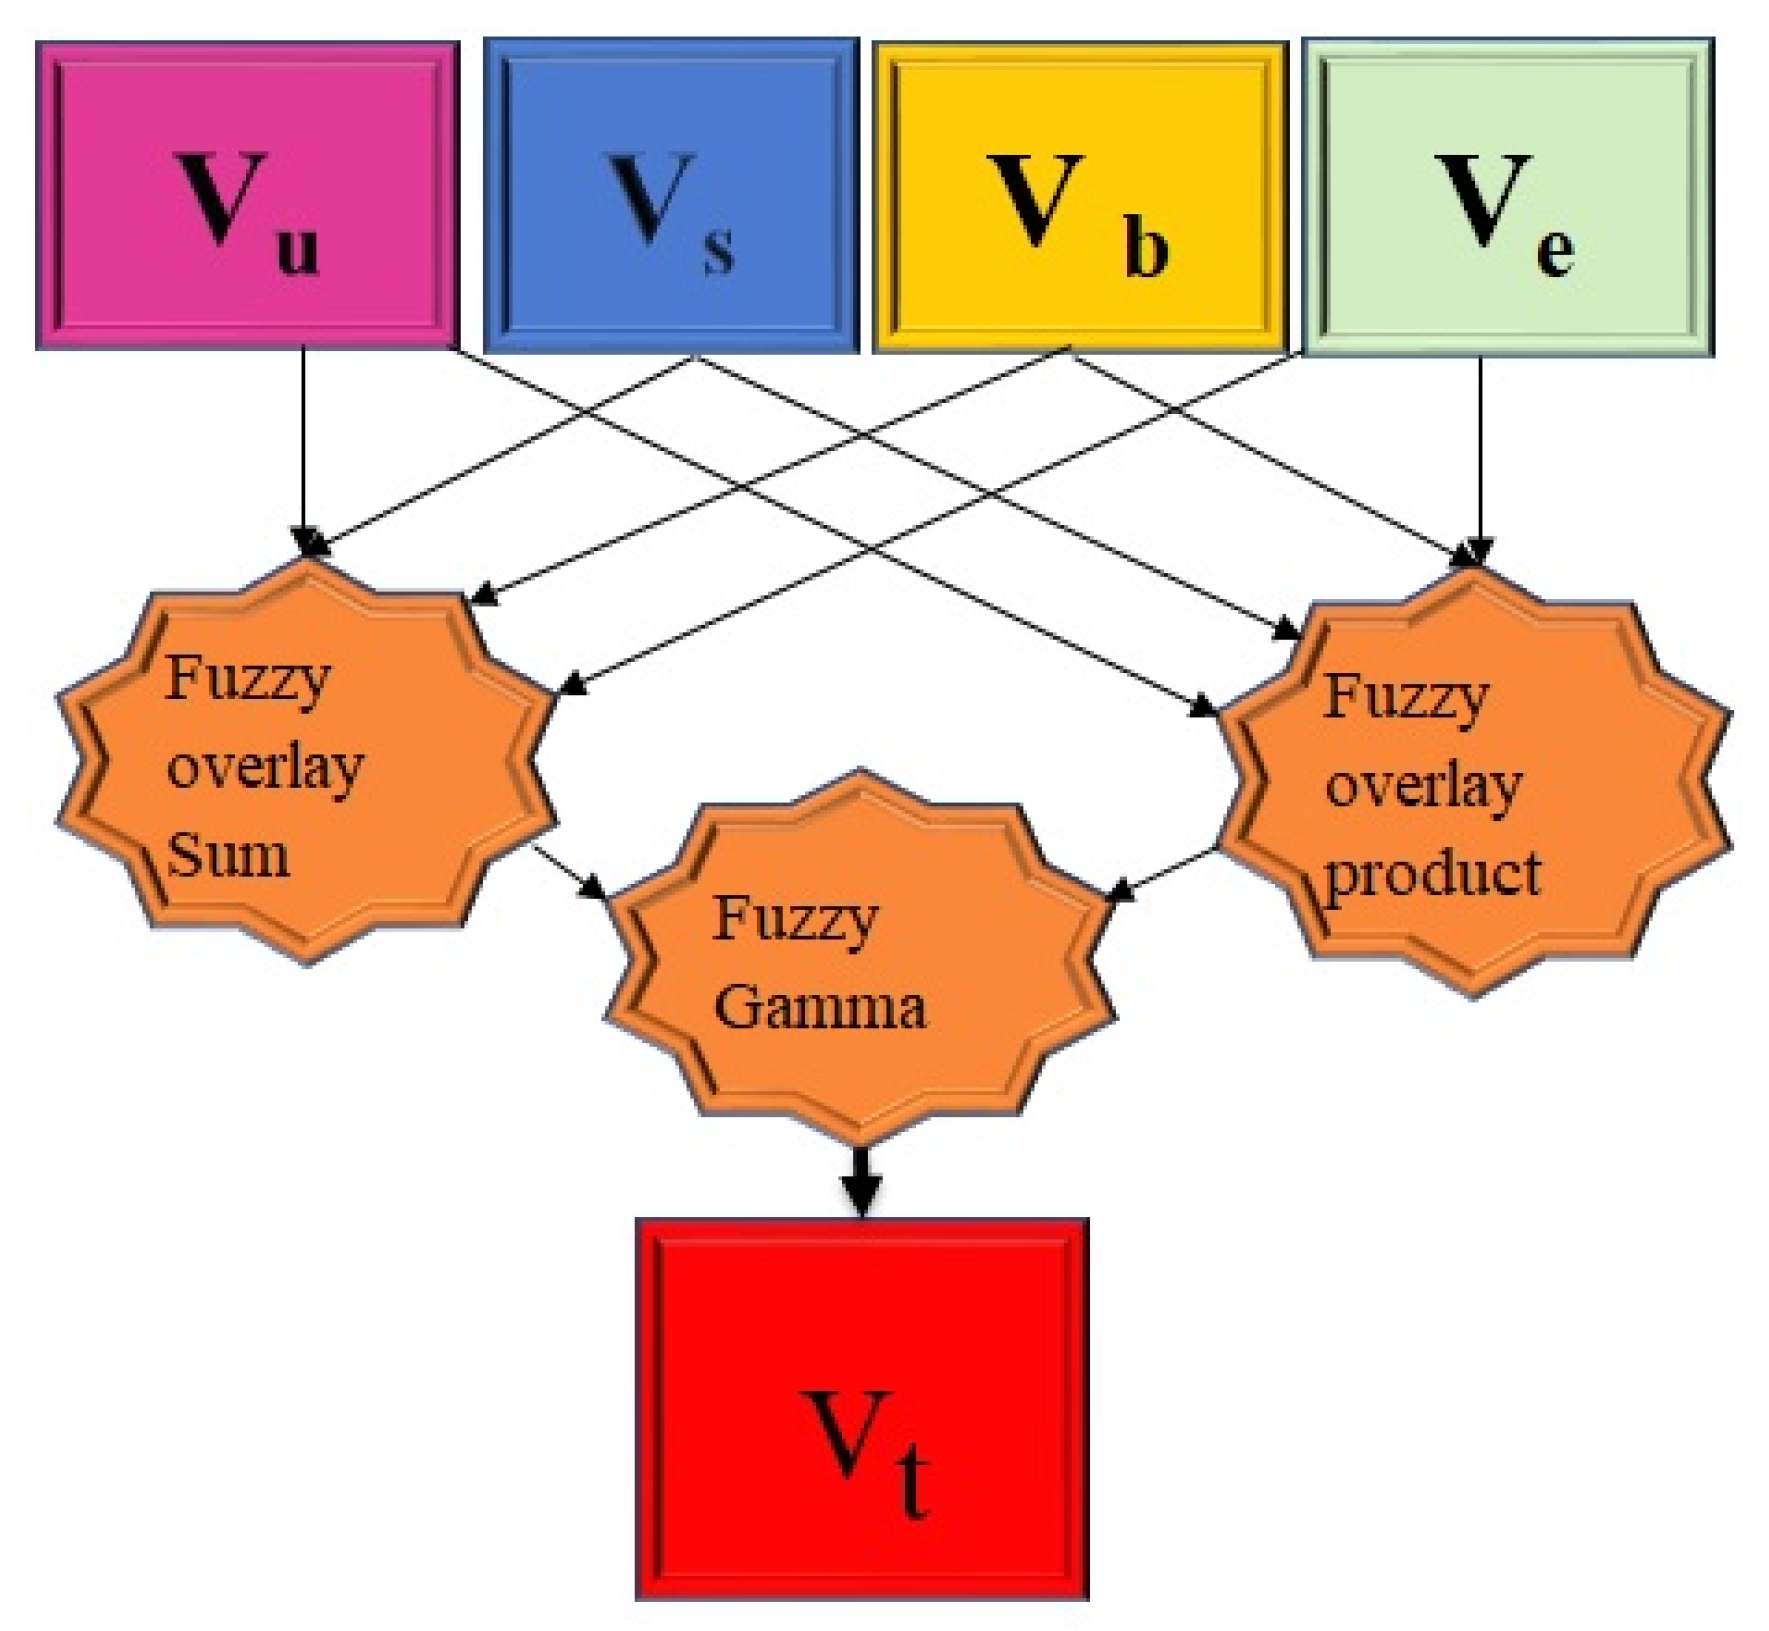
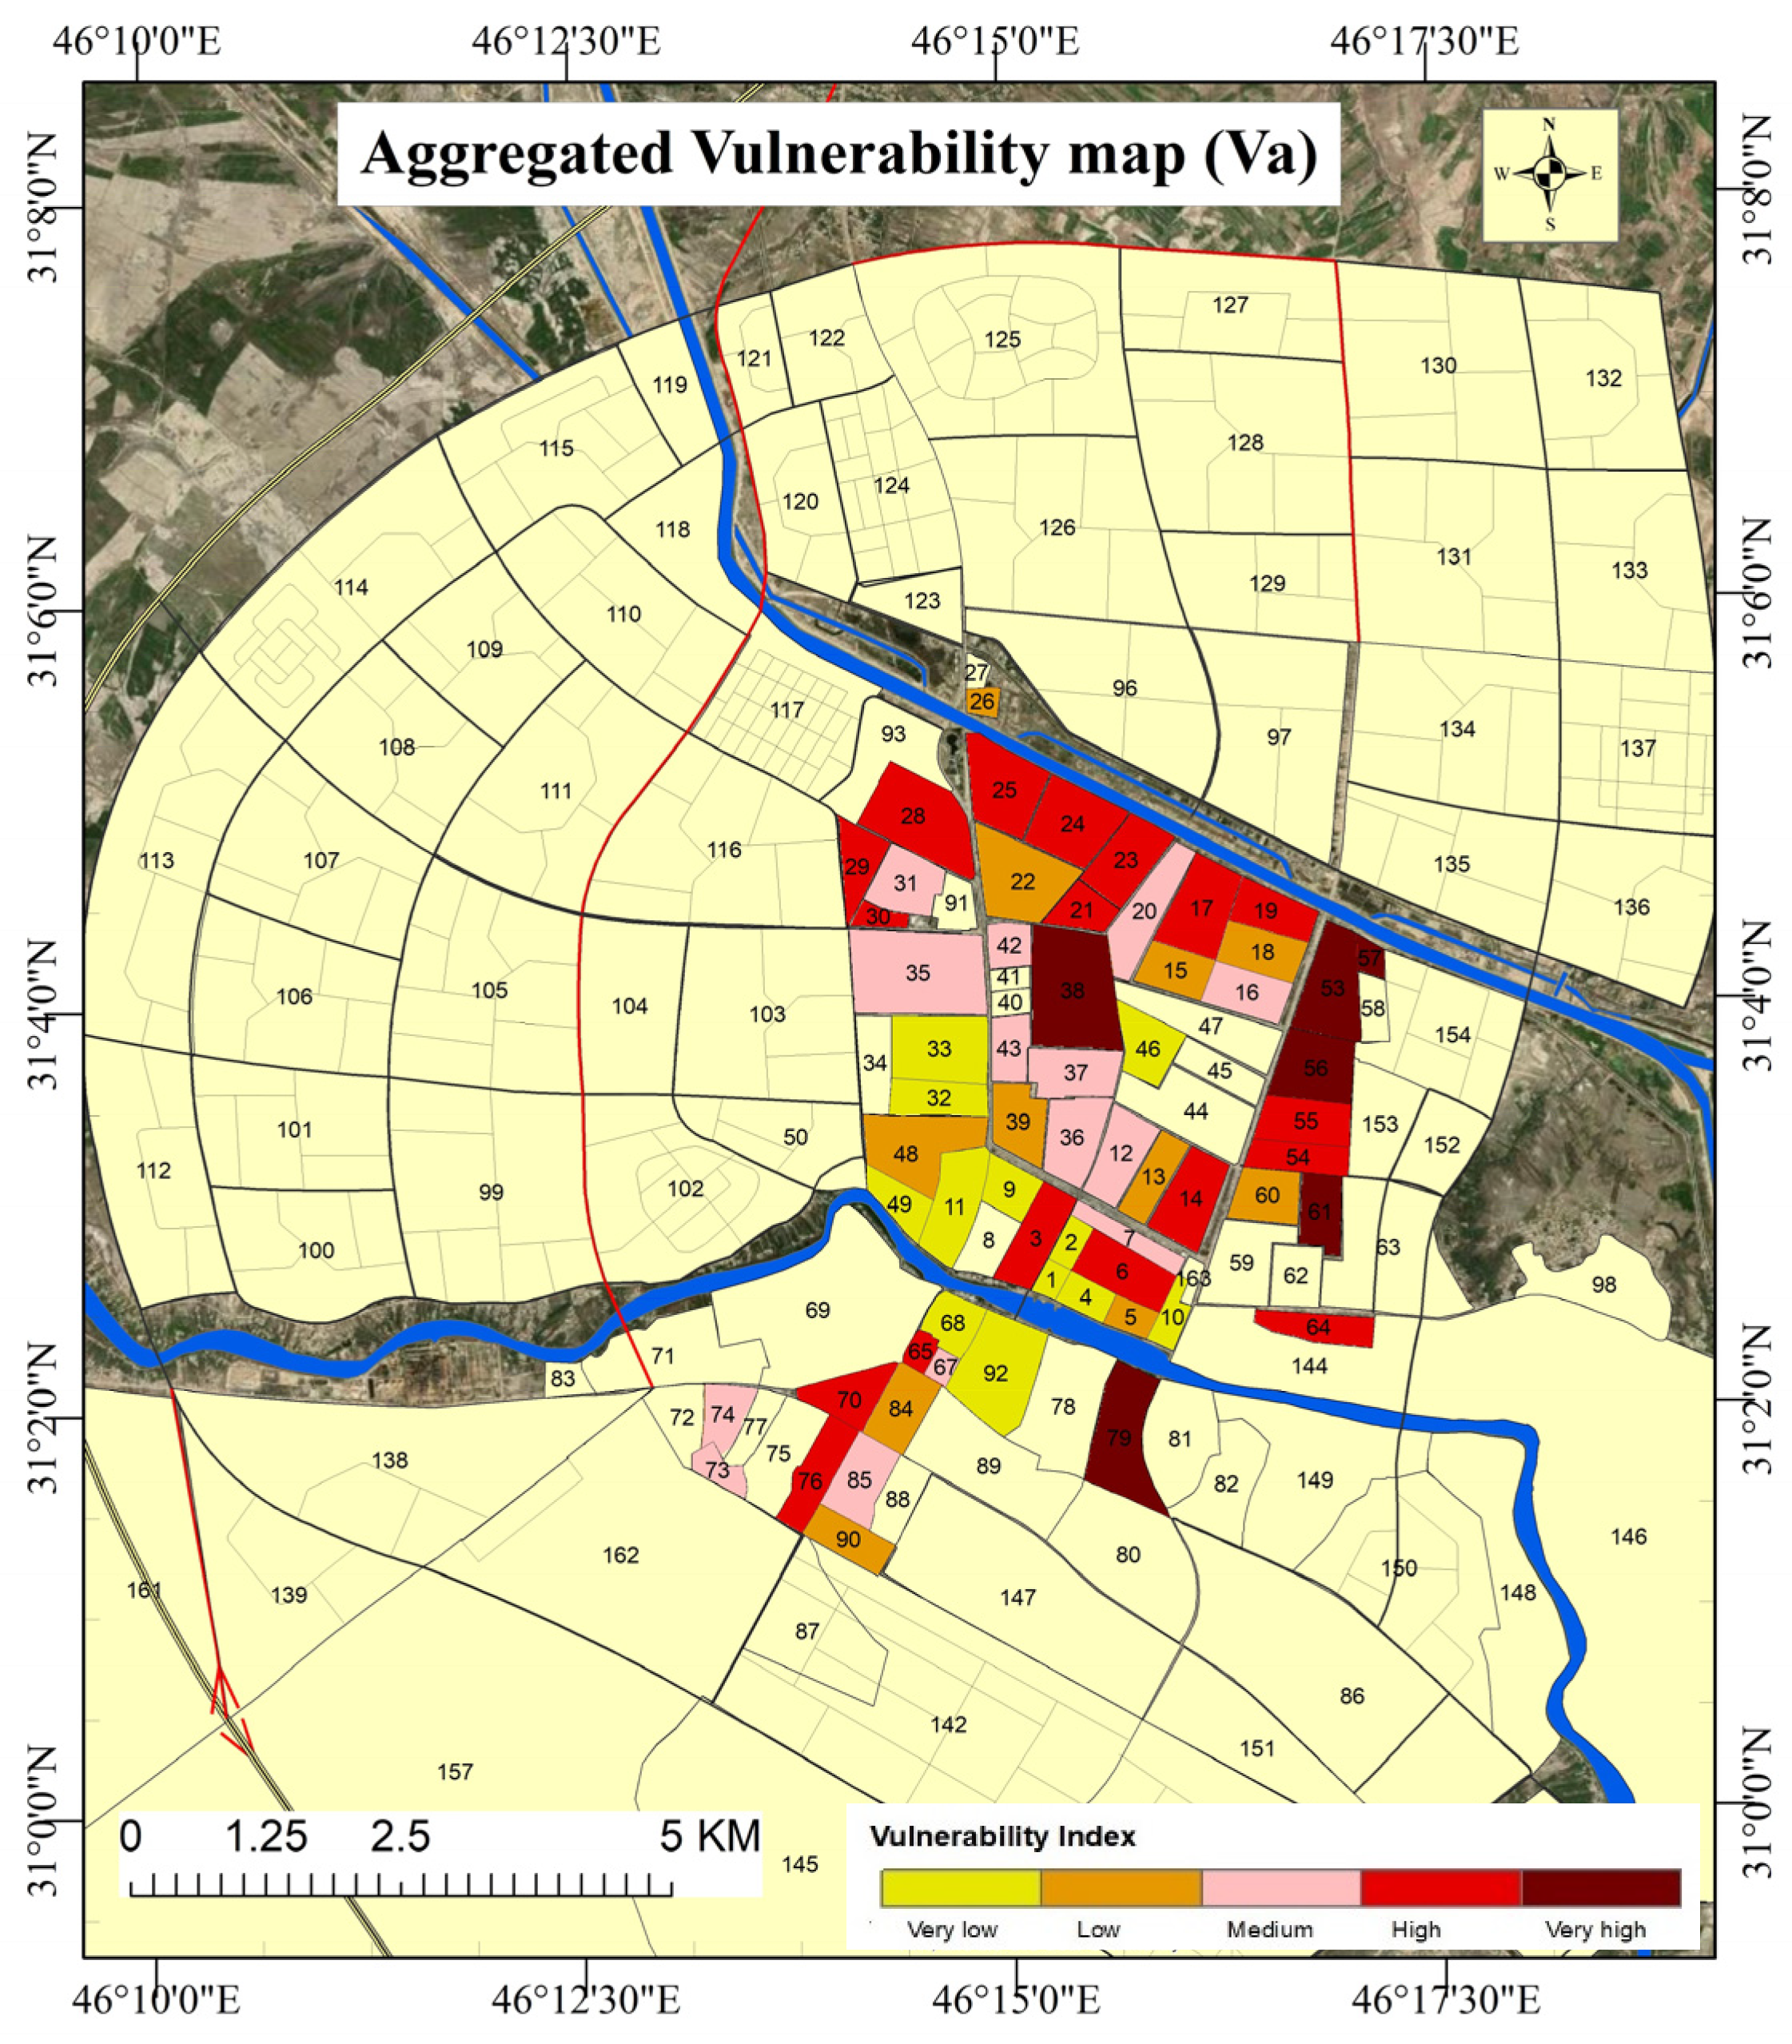
3.8.1. Aggregated Vulnerability (Va)
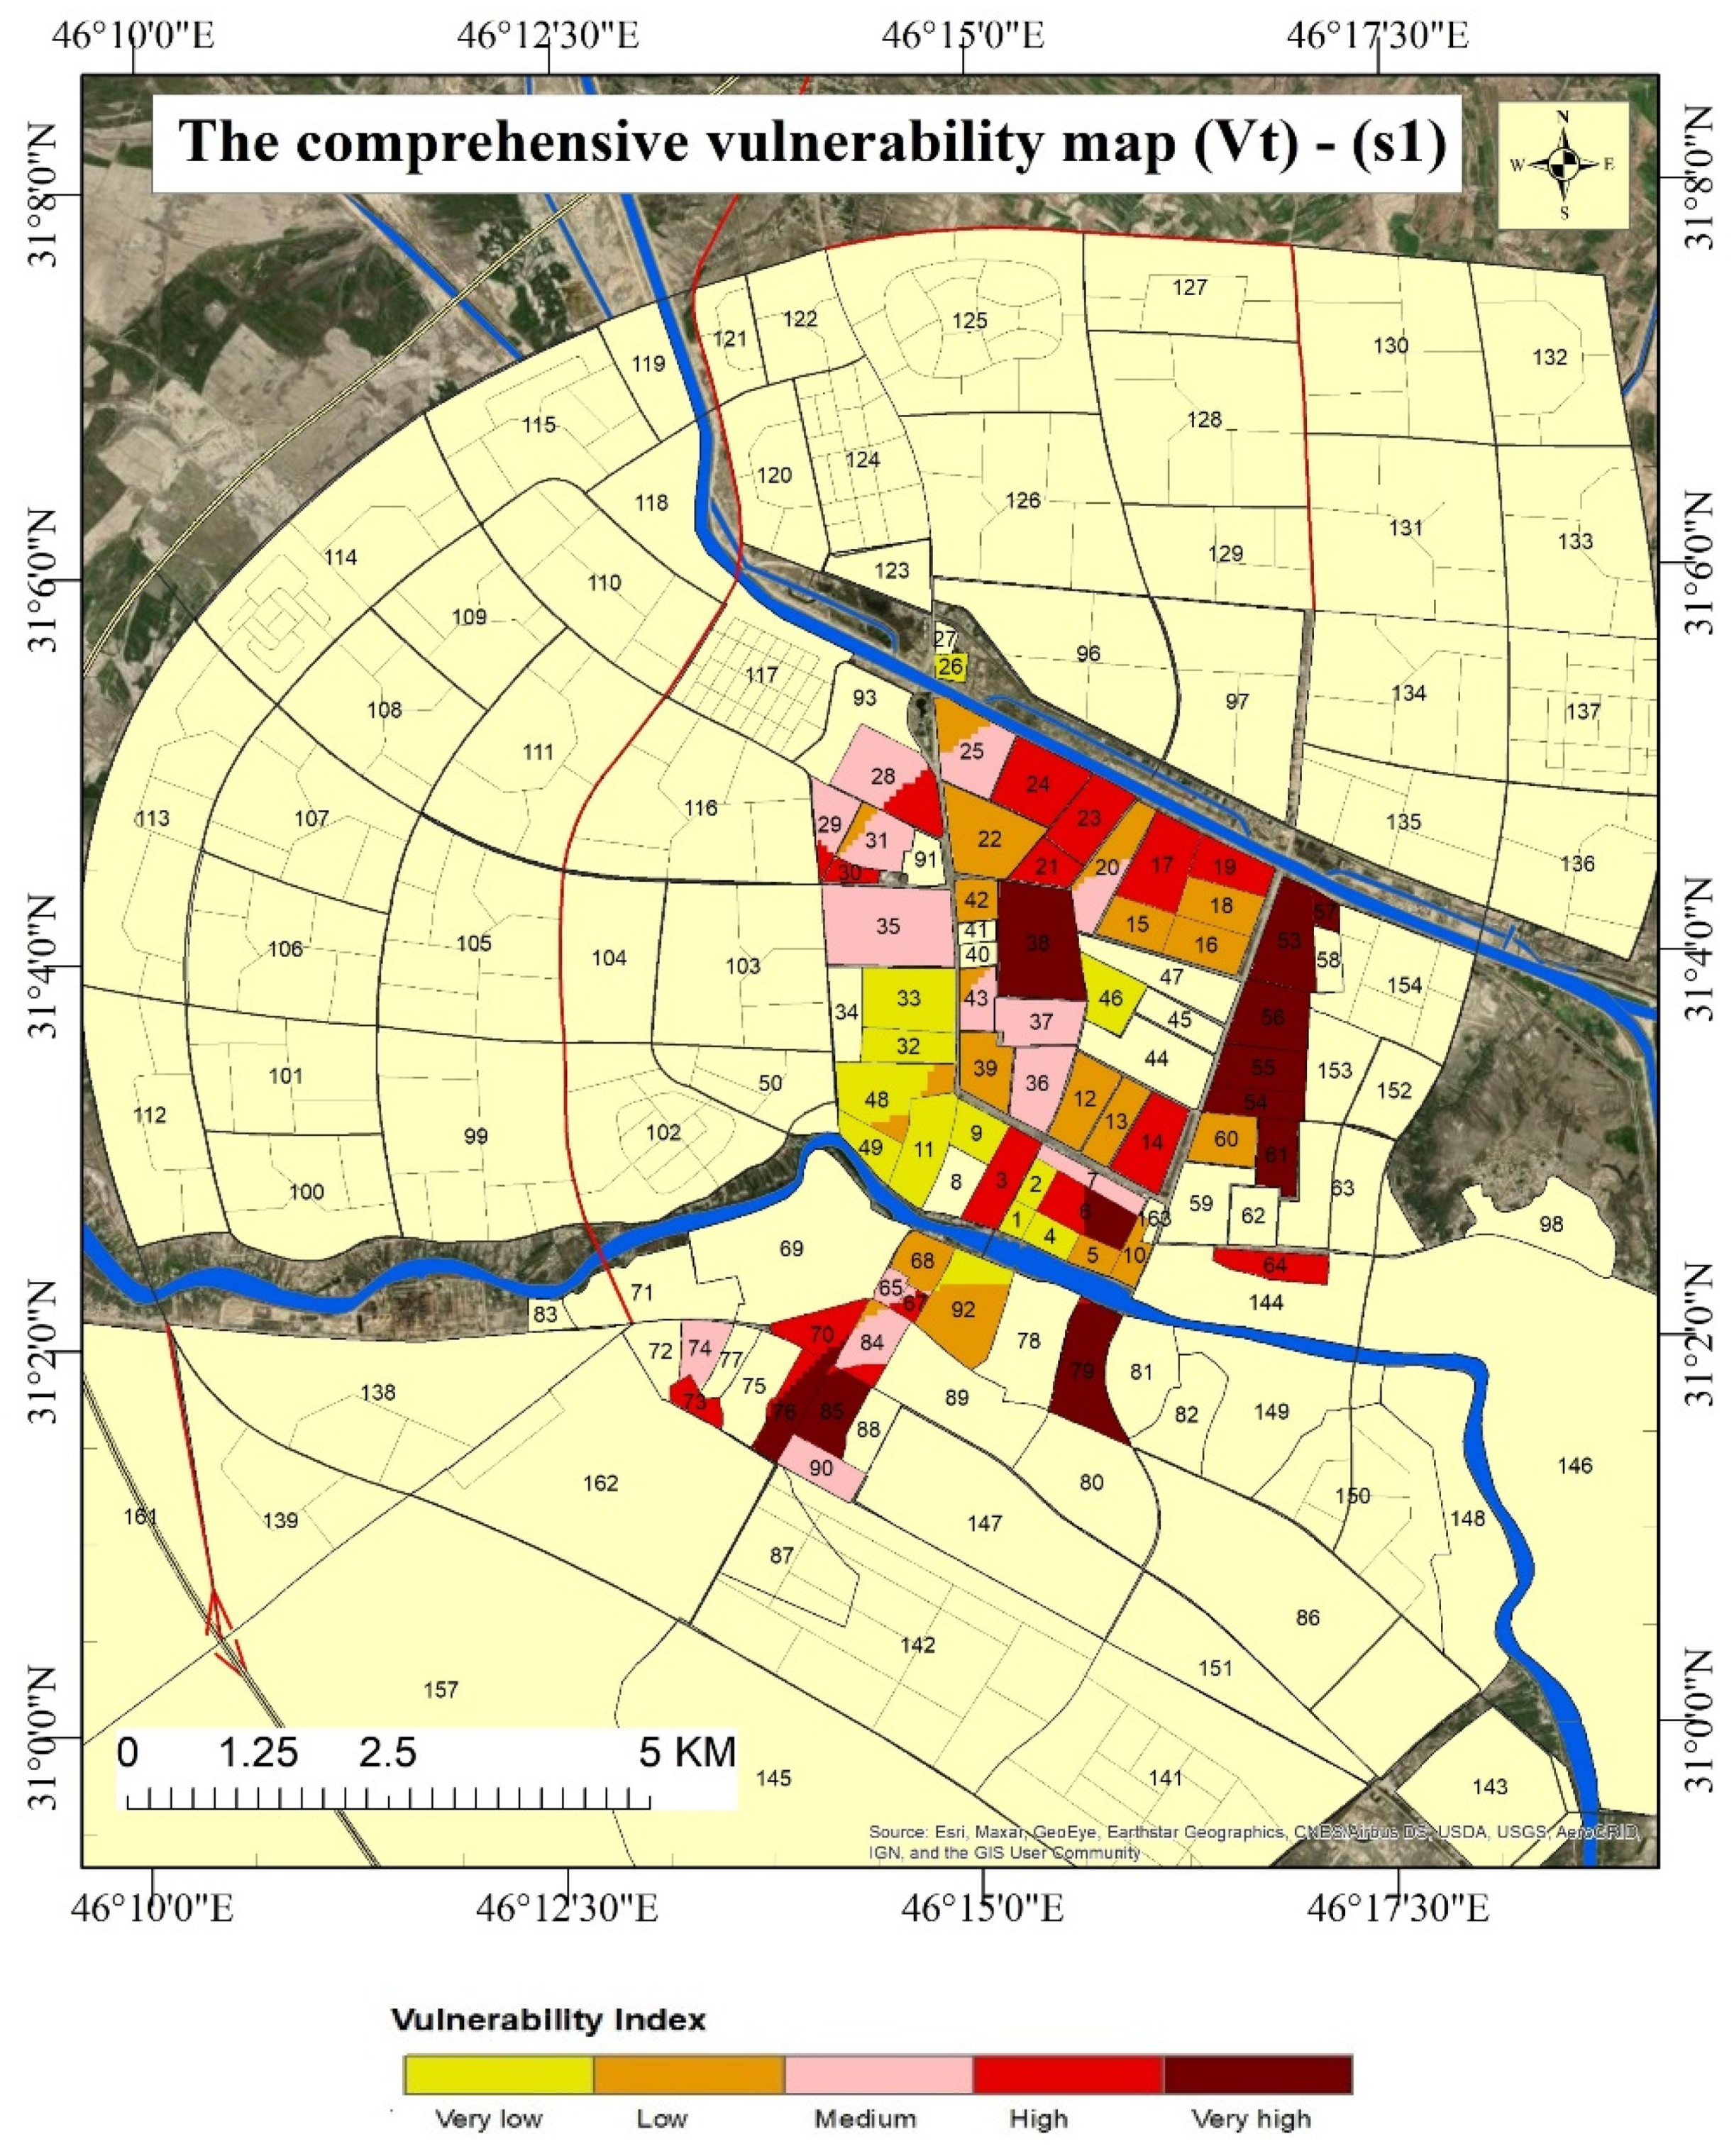
3.8.2. Comprehensive Vulnerability Maps (Vt)
3.9. Jenks Optimisation Method
4. Results
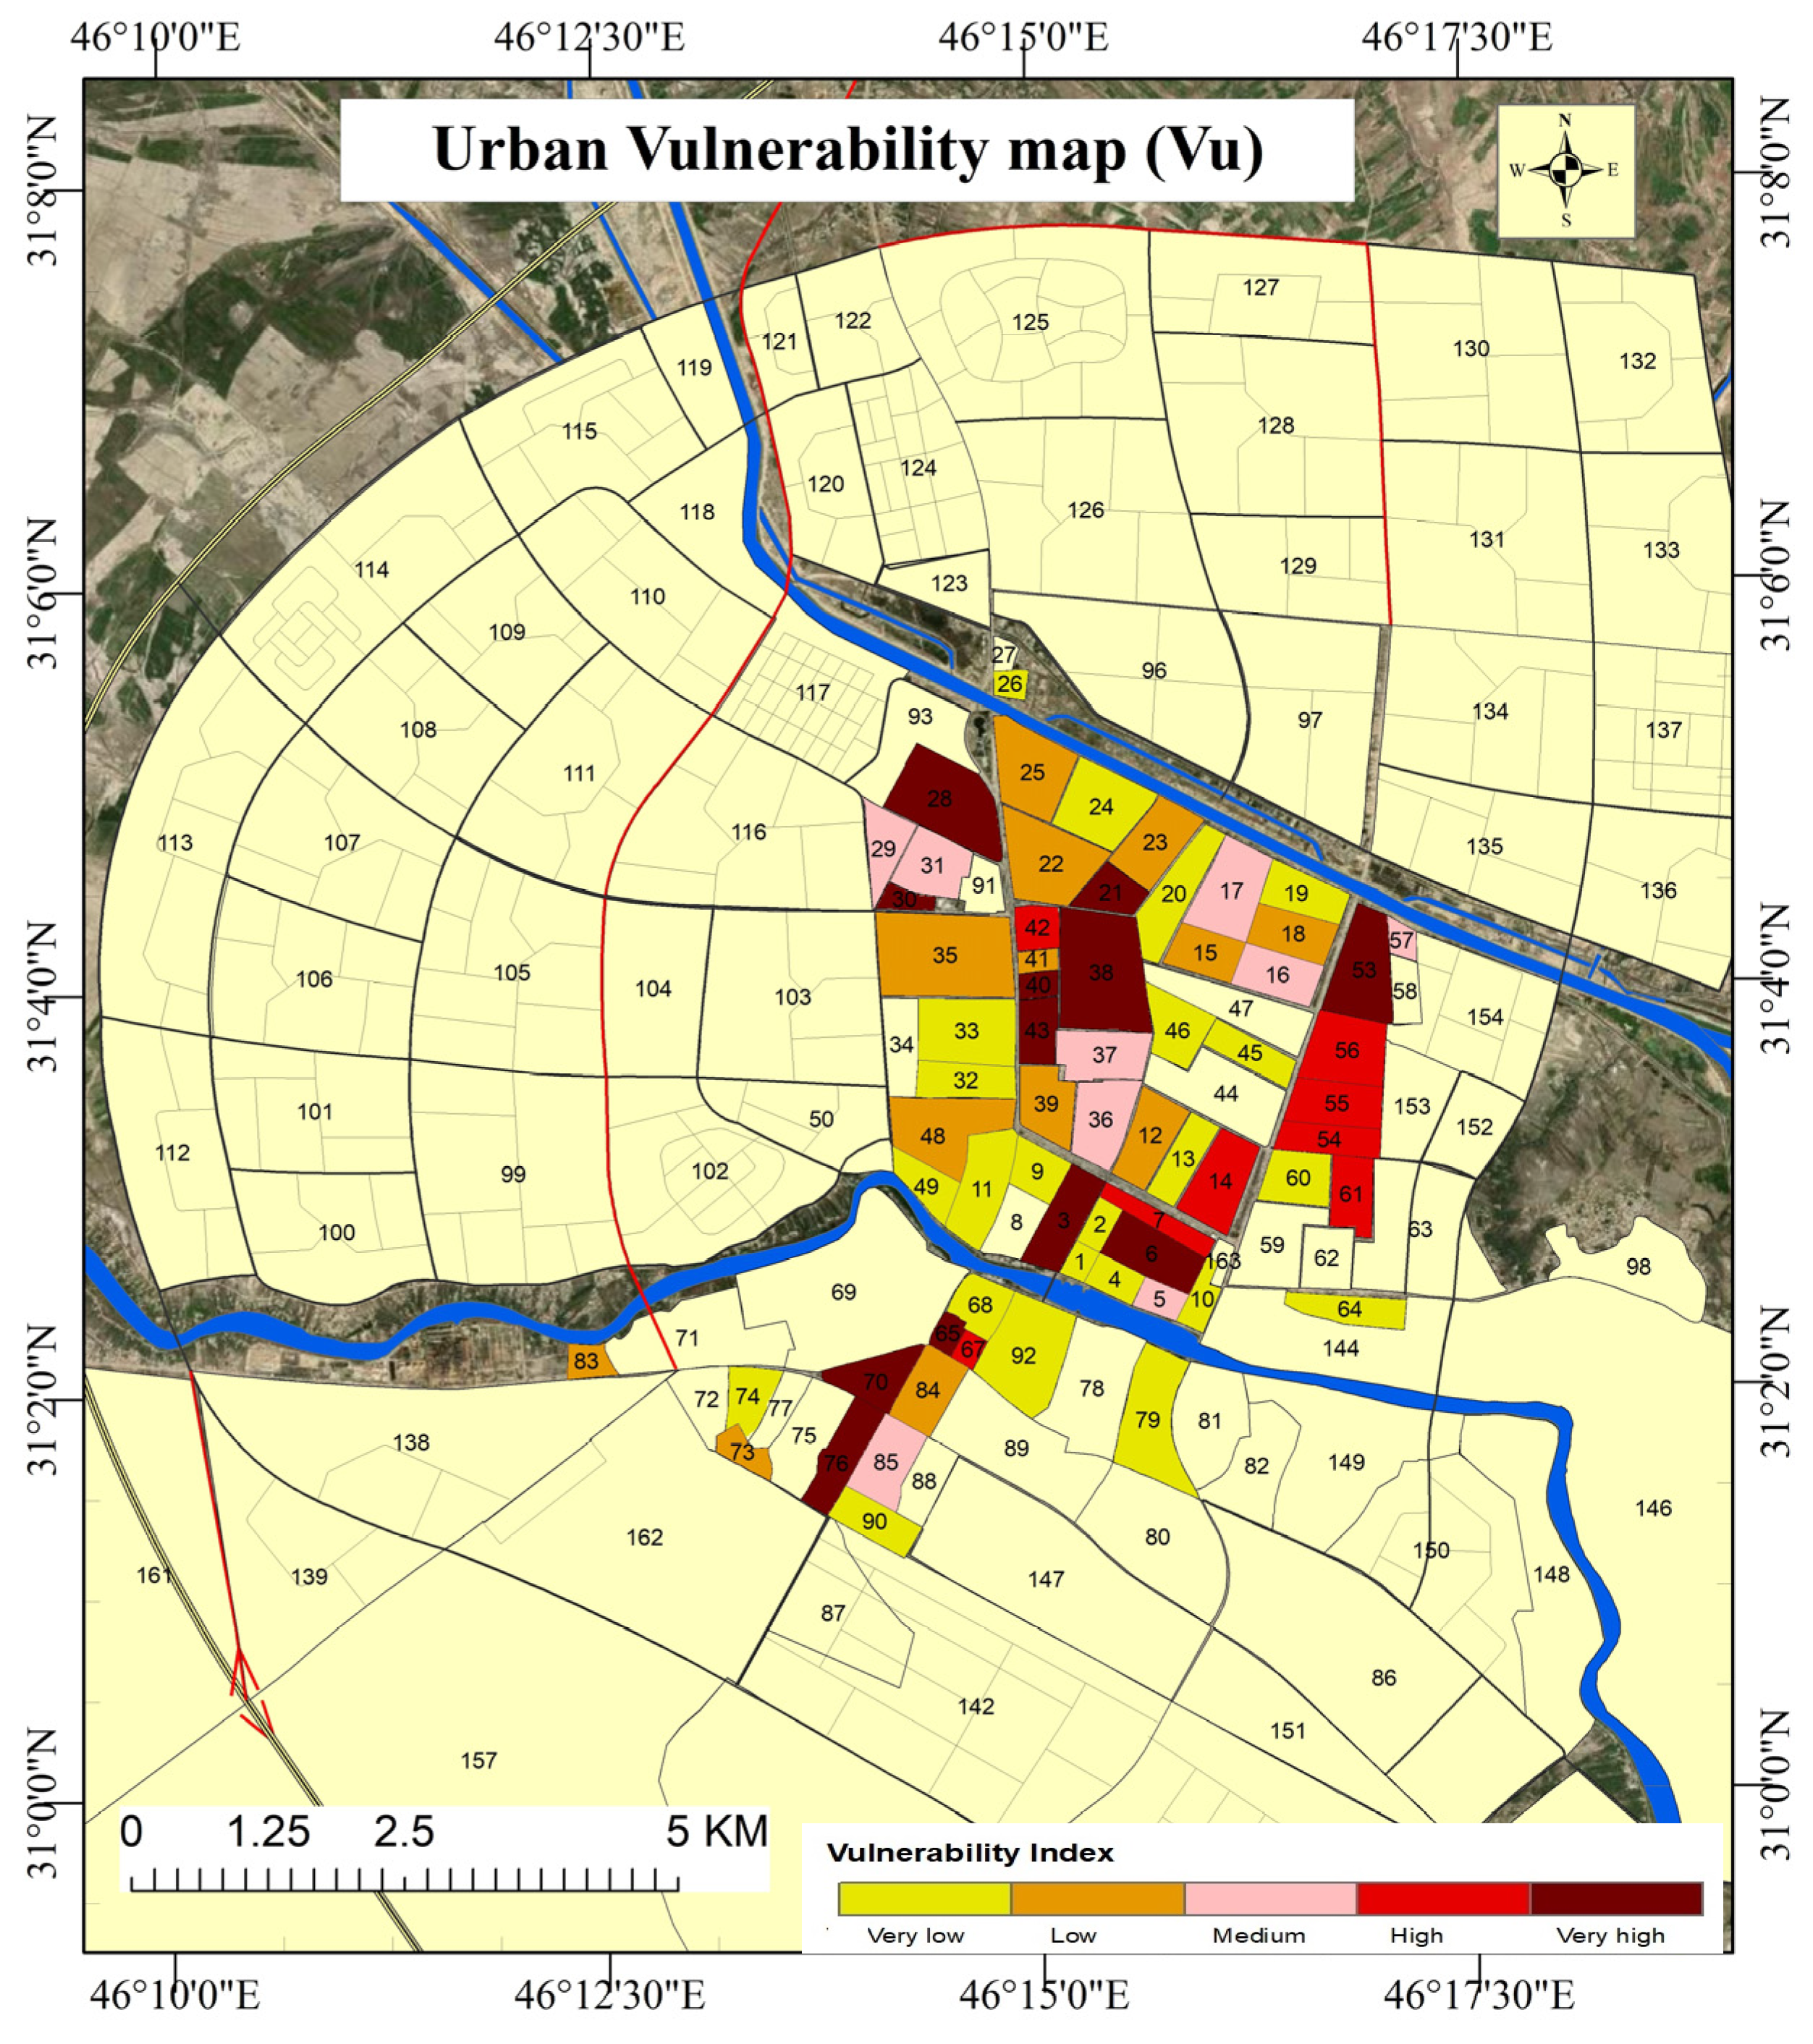
4.1. Urban Vulnerability Map
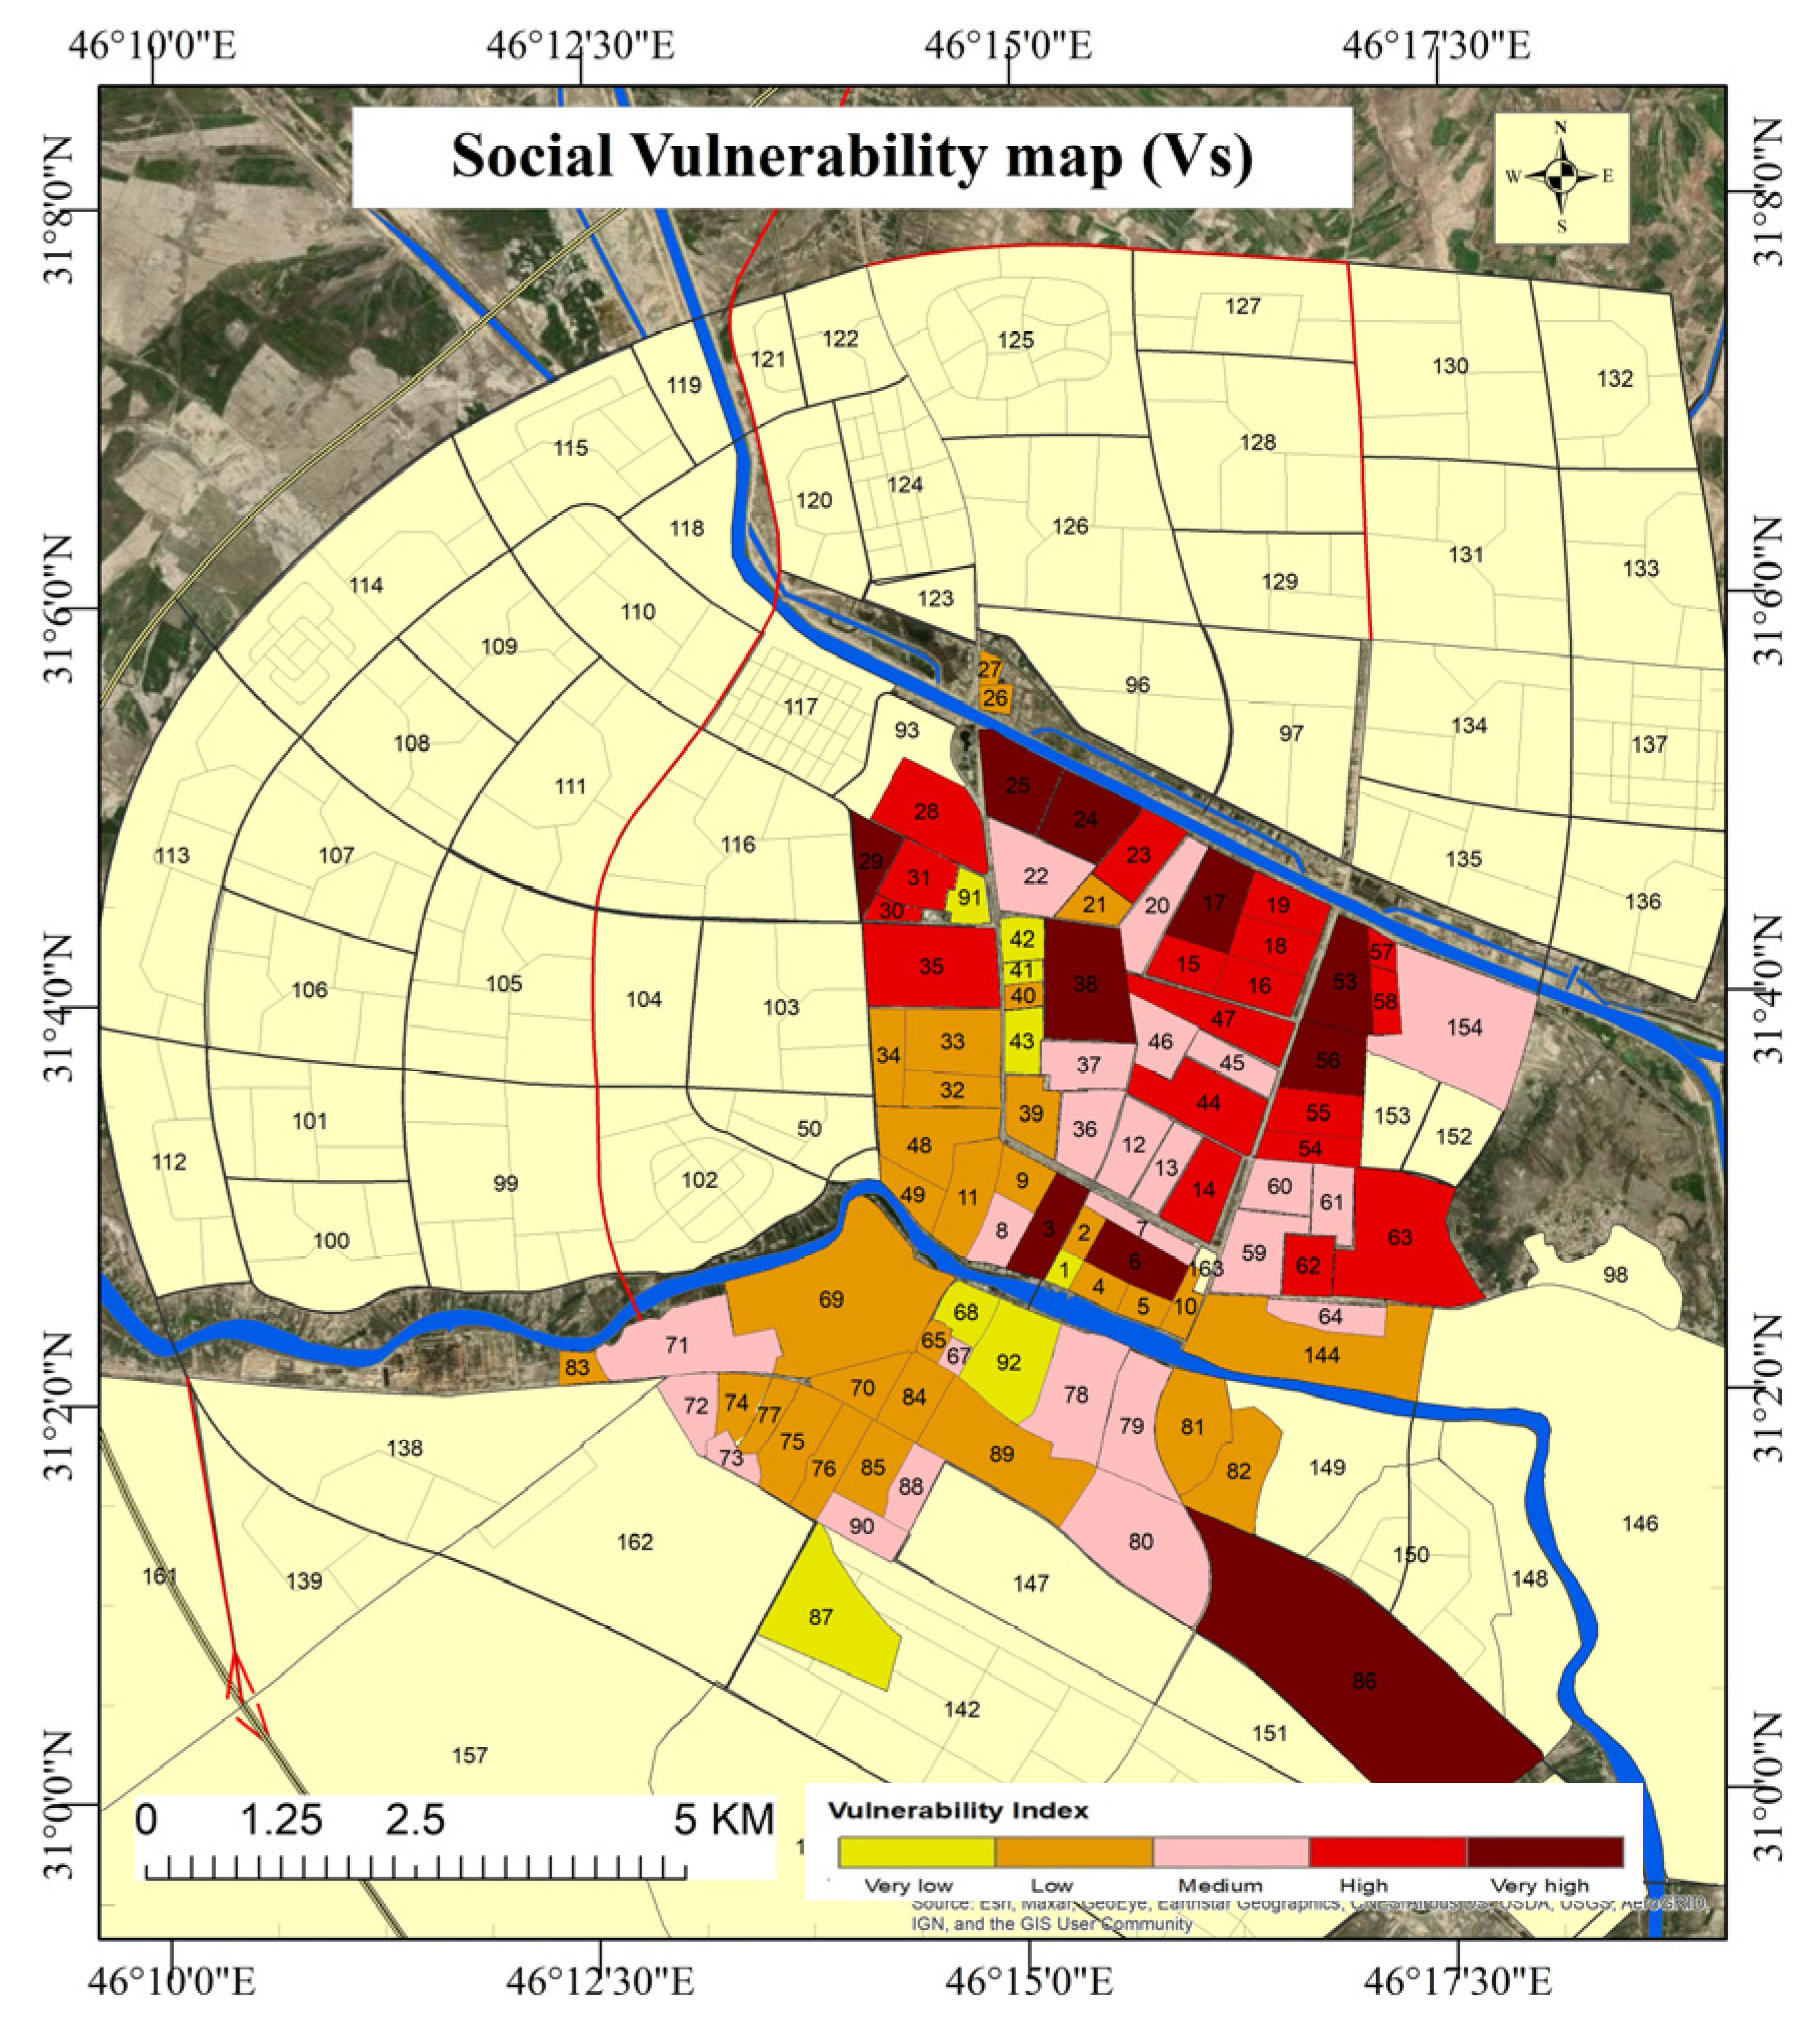
4.2. Social Vulnerability Map
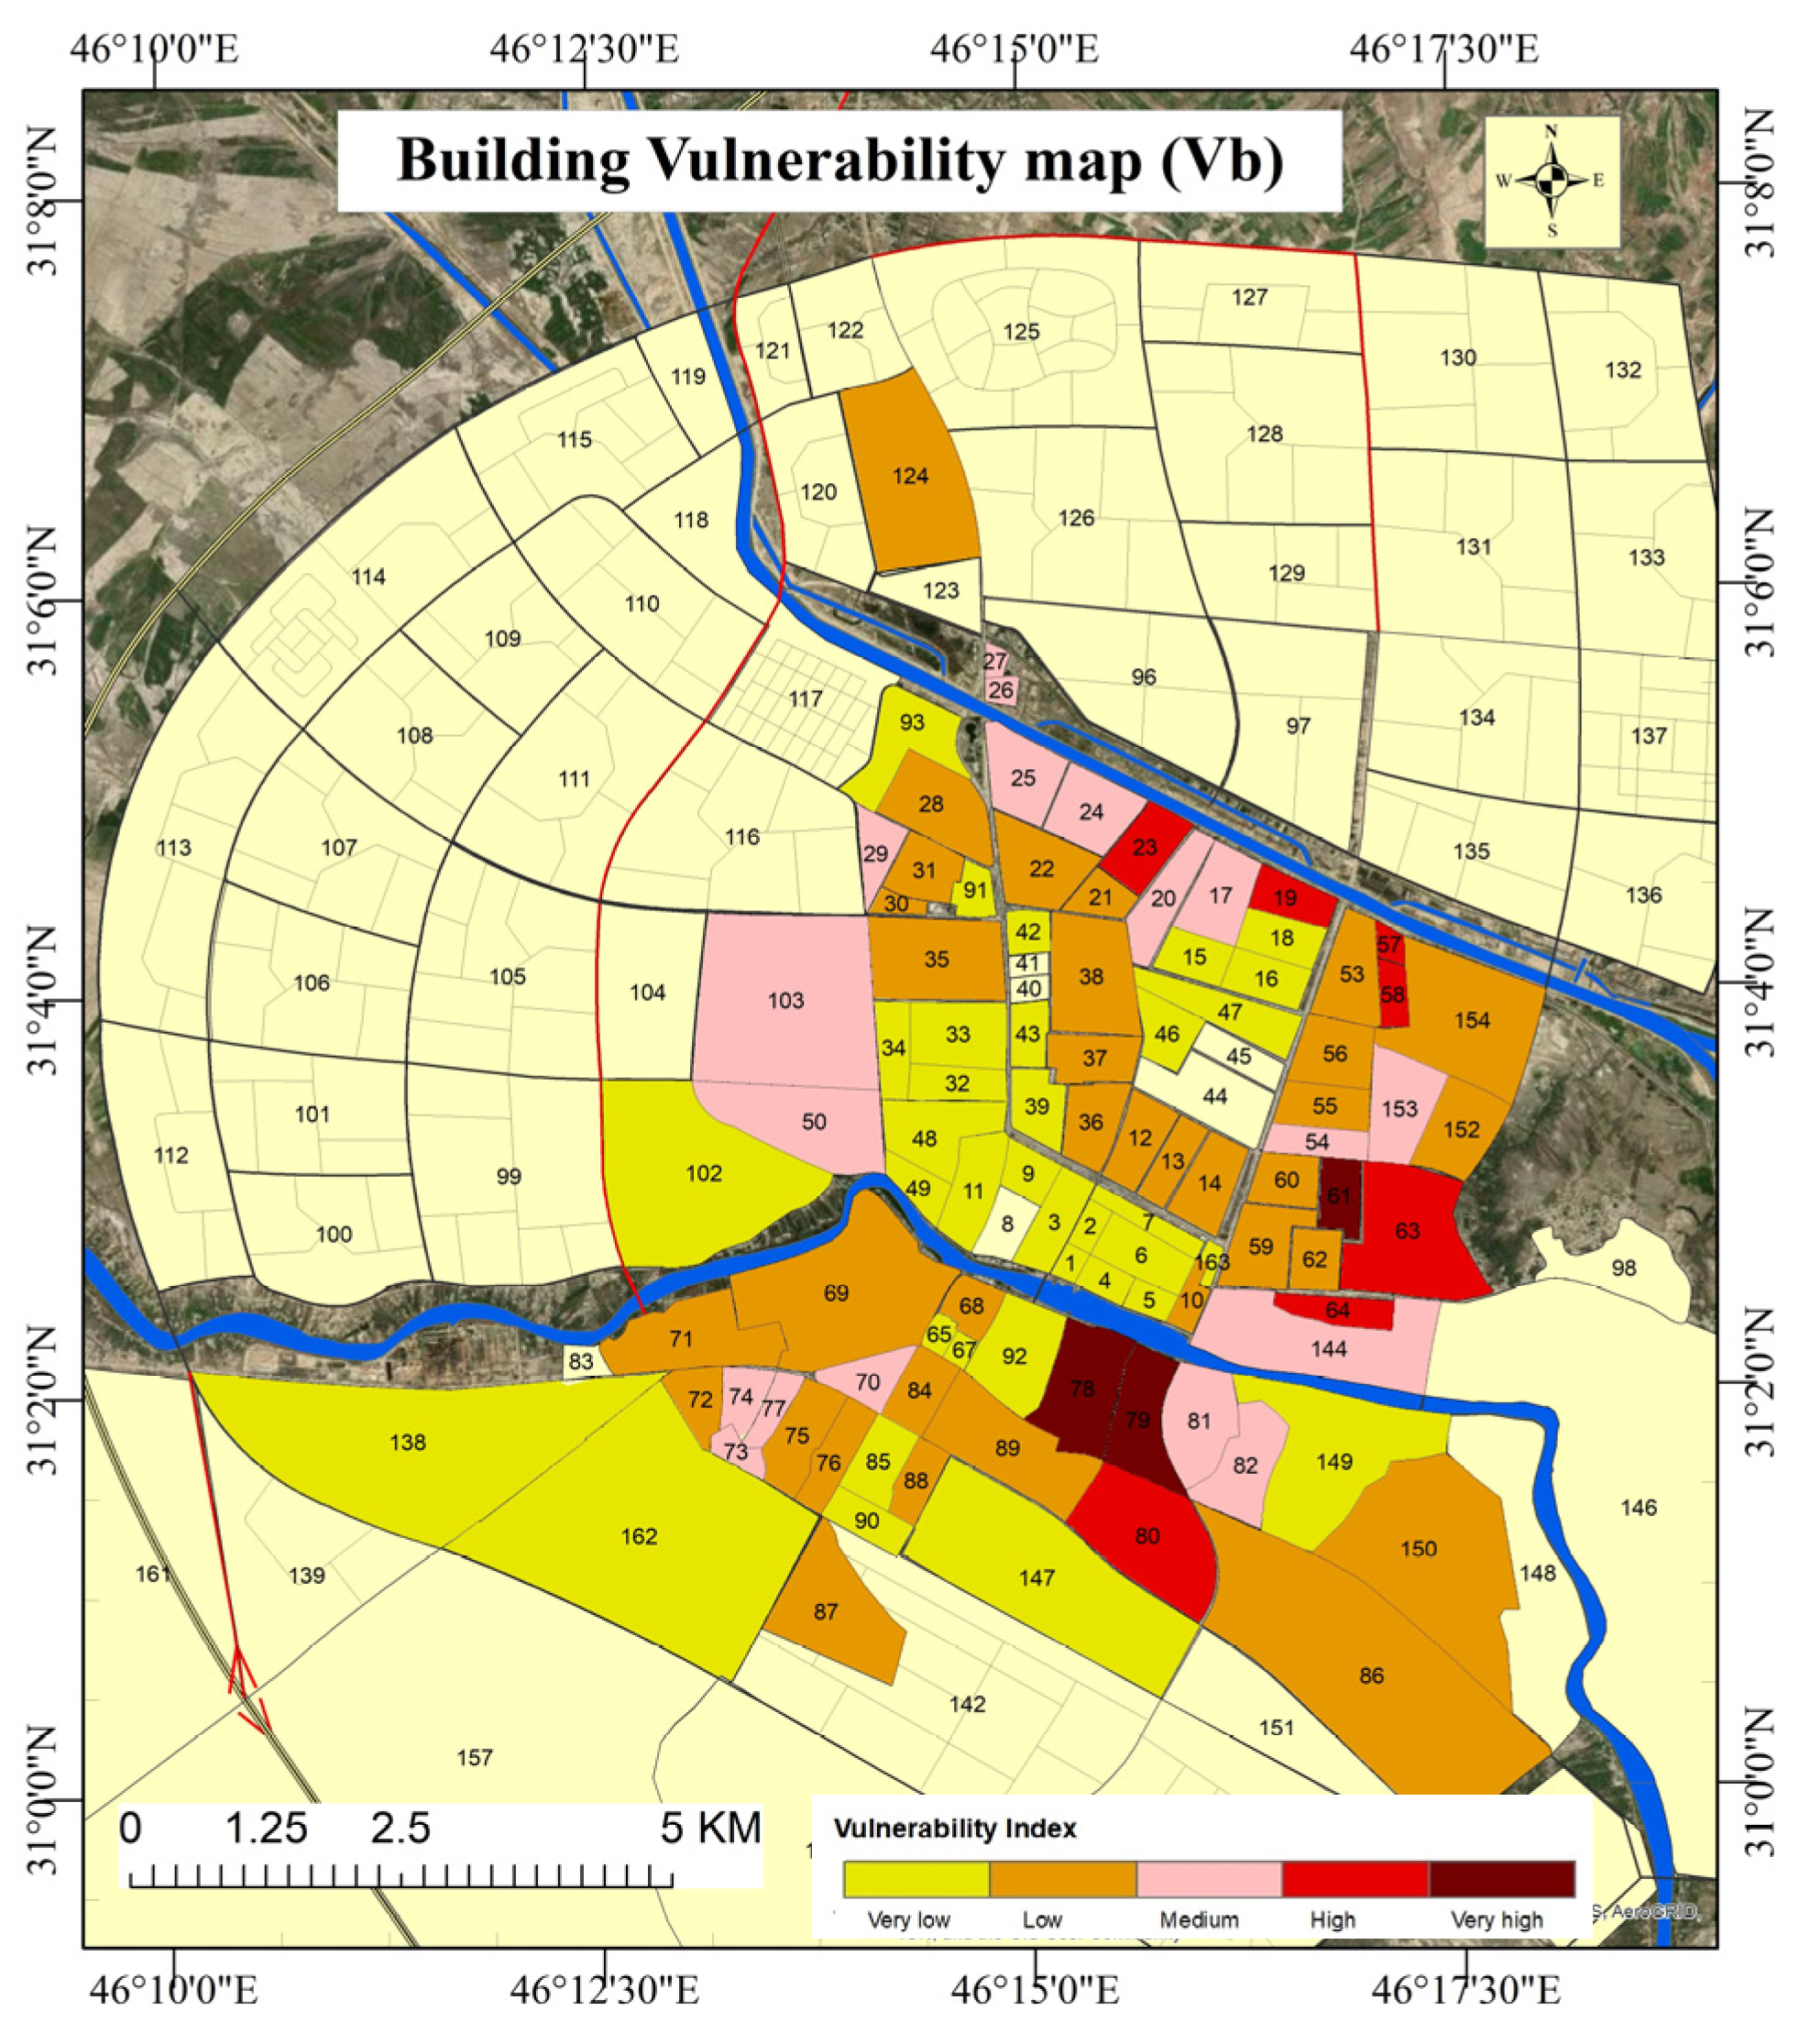
4.3. Building the Vulnerability Map
4.4. Aggregated Vulnerability Map
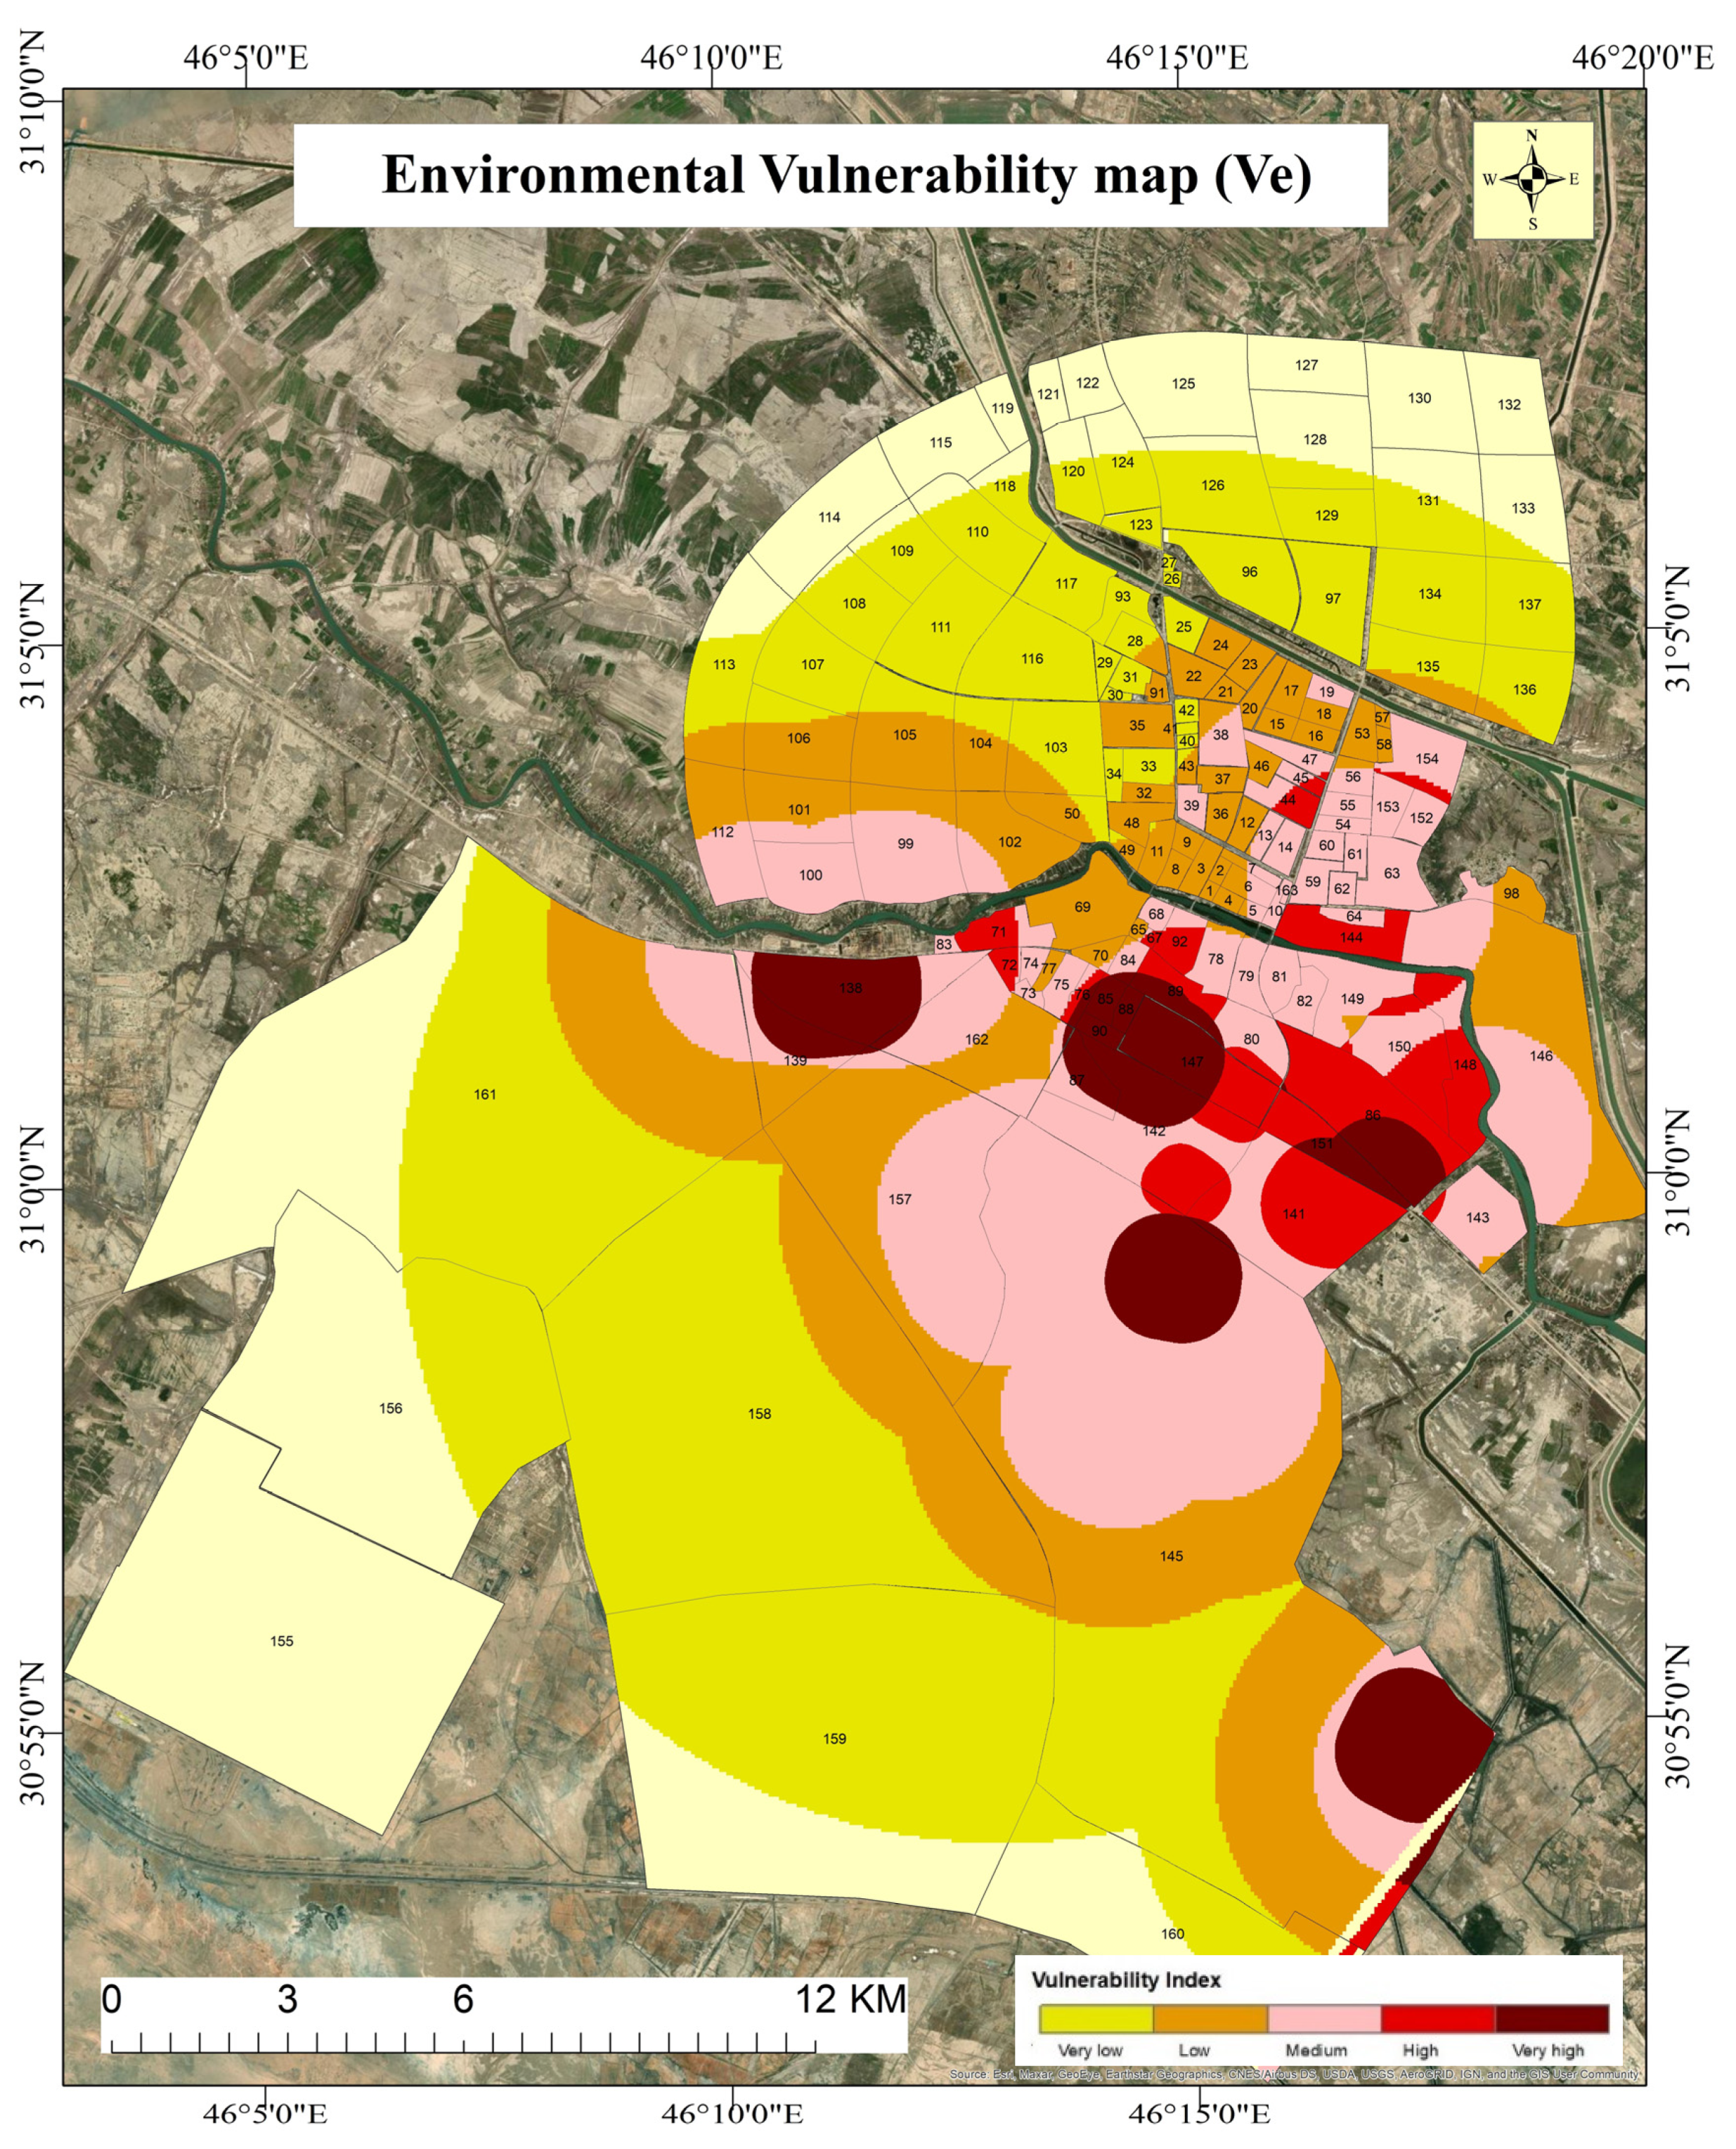
4.5. Environmental Vulnerability Map (Ve)
4.6. Comprehensive Vulnerability Map
4.7. Validation
4.7.1. Using Machine Learning (ML)
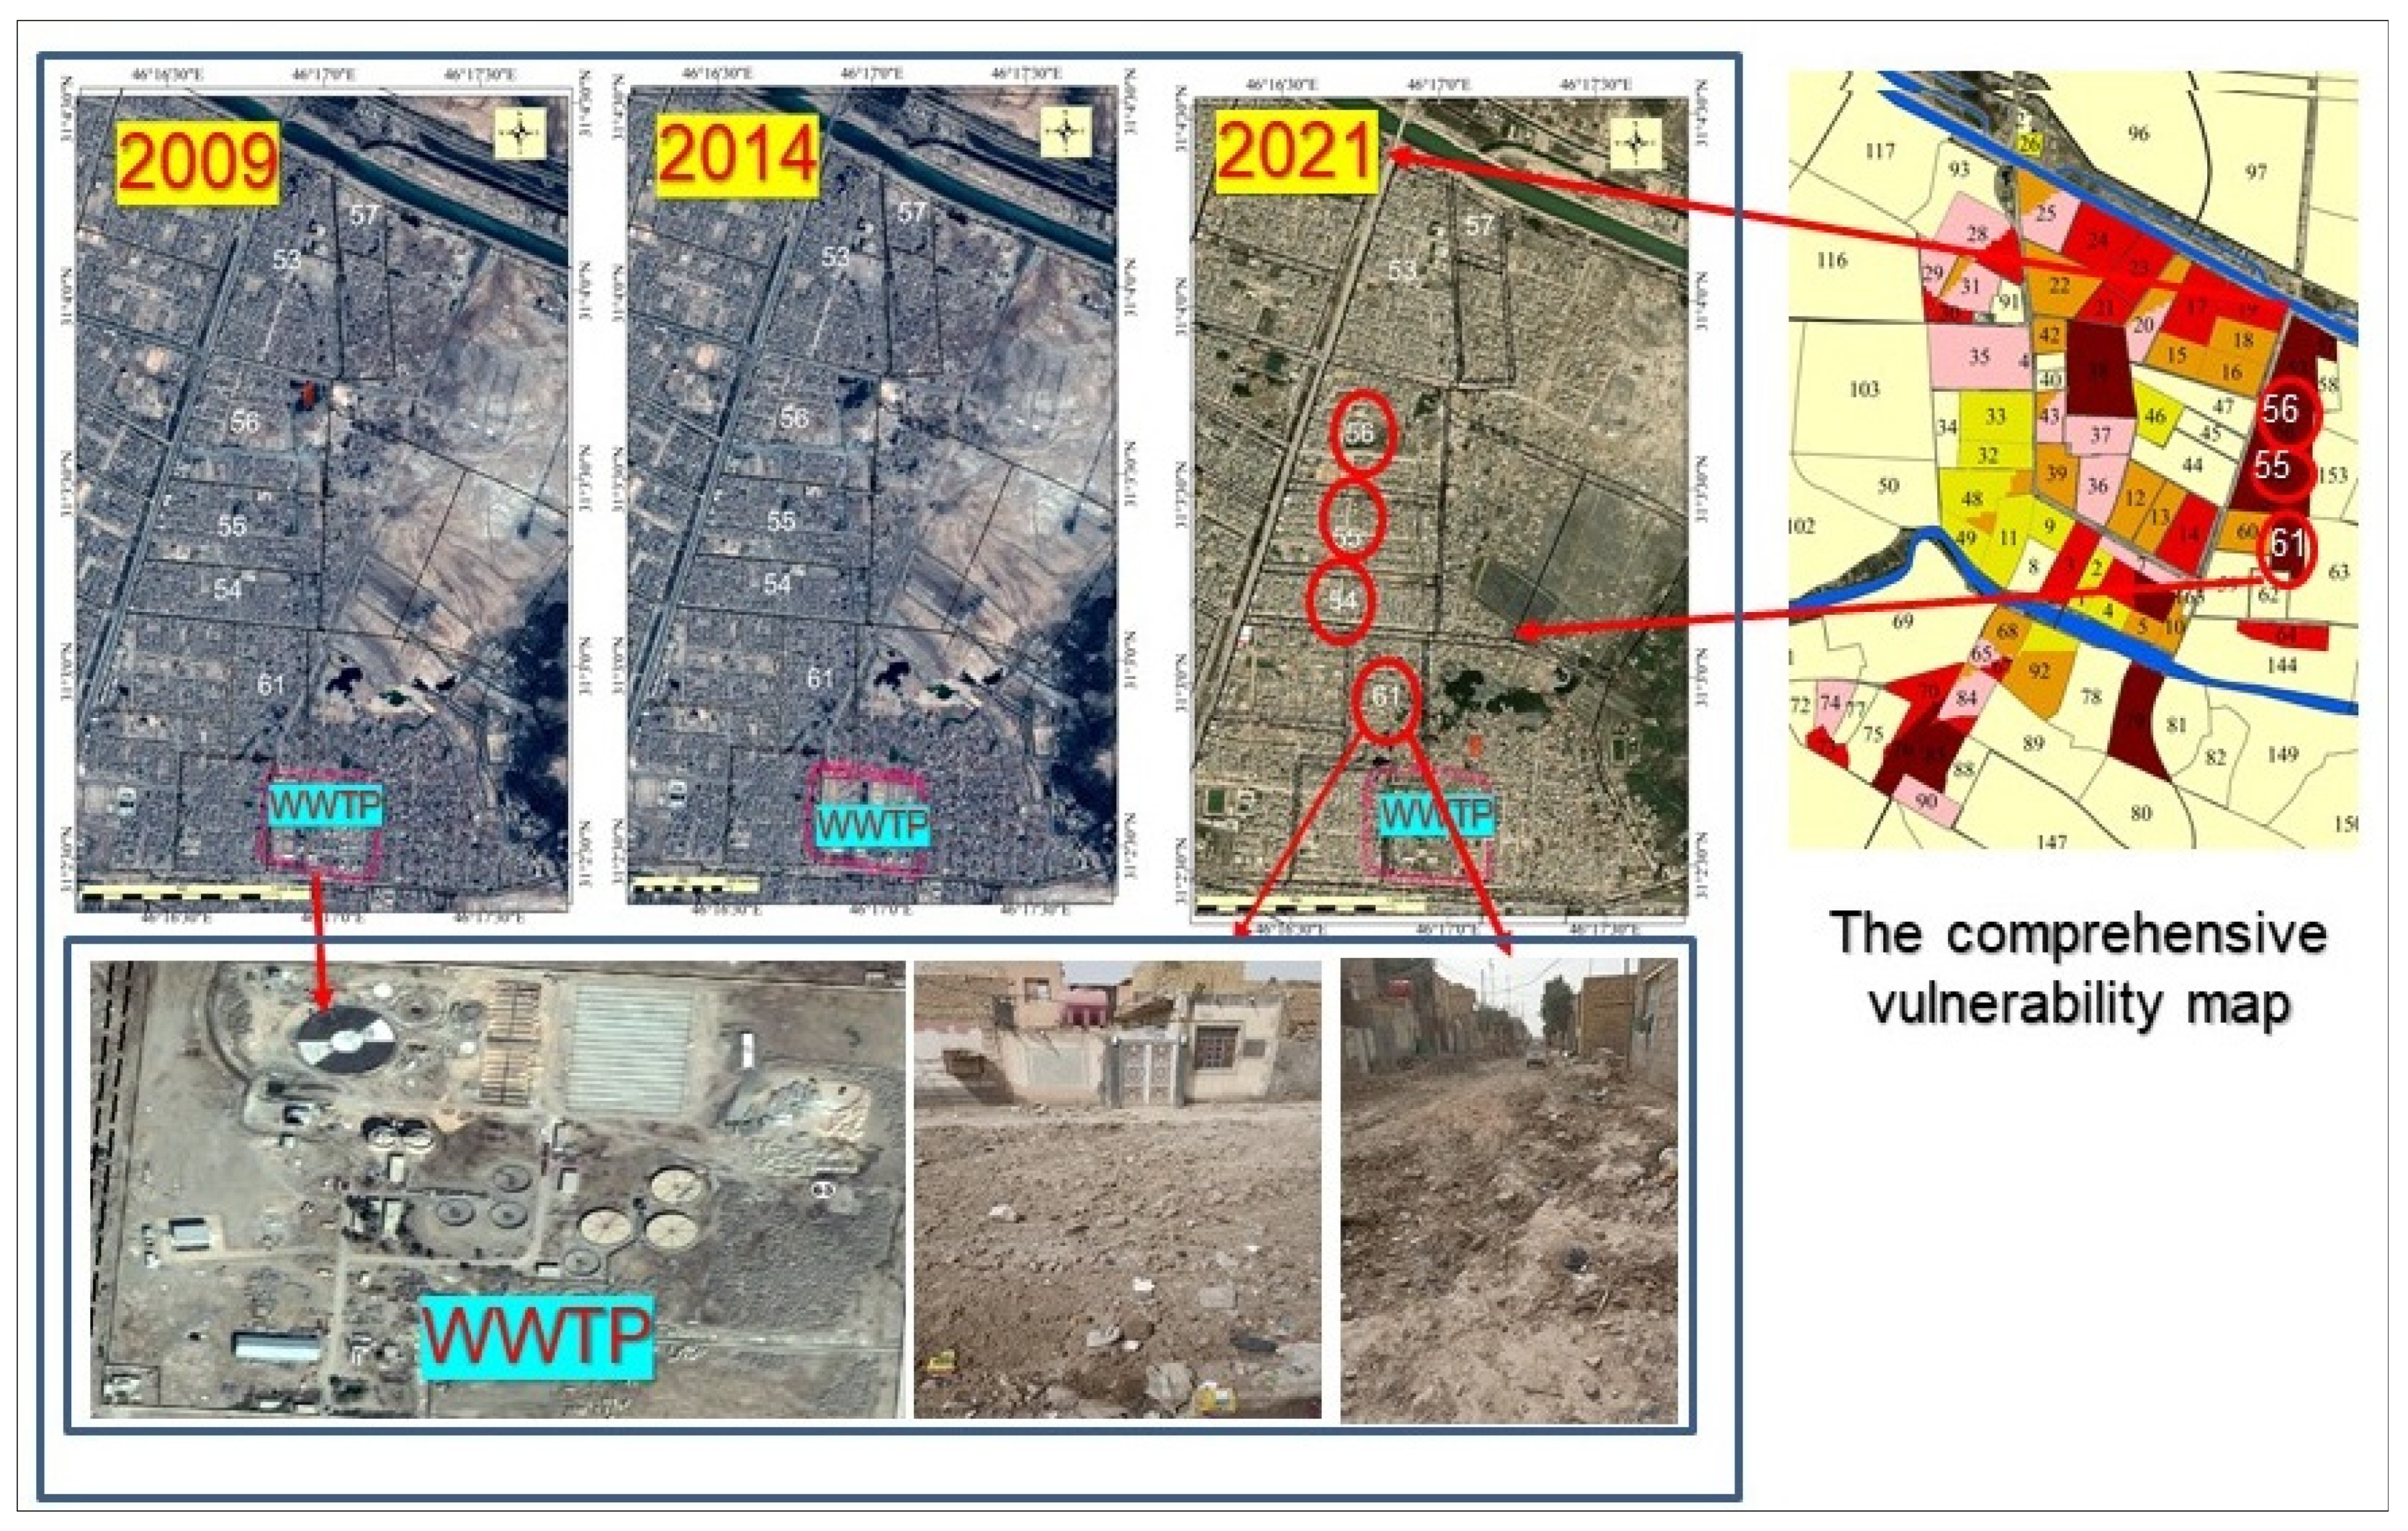
4.7.2. Spatial Analysis Validation
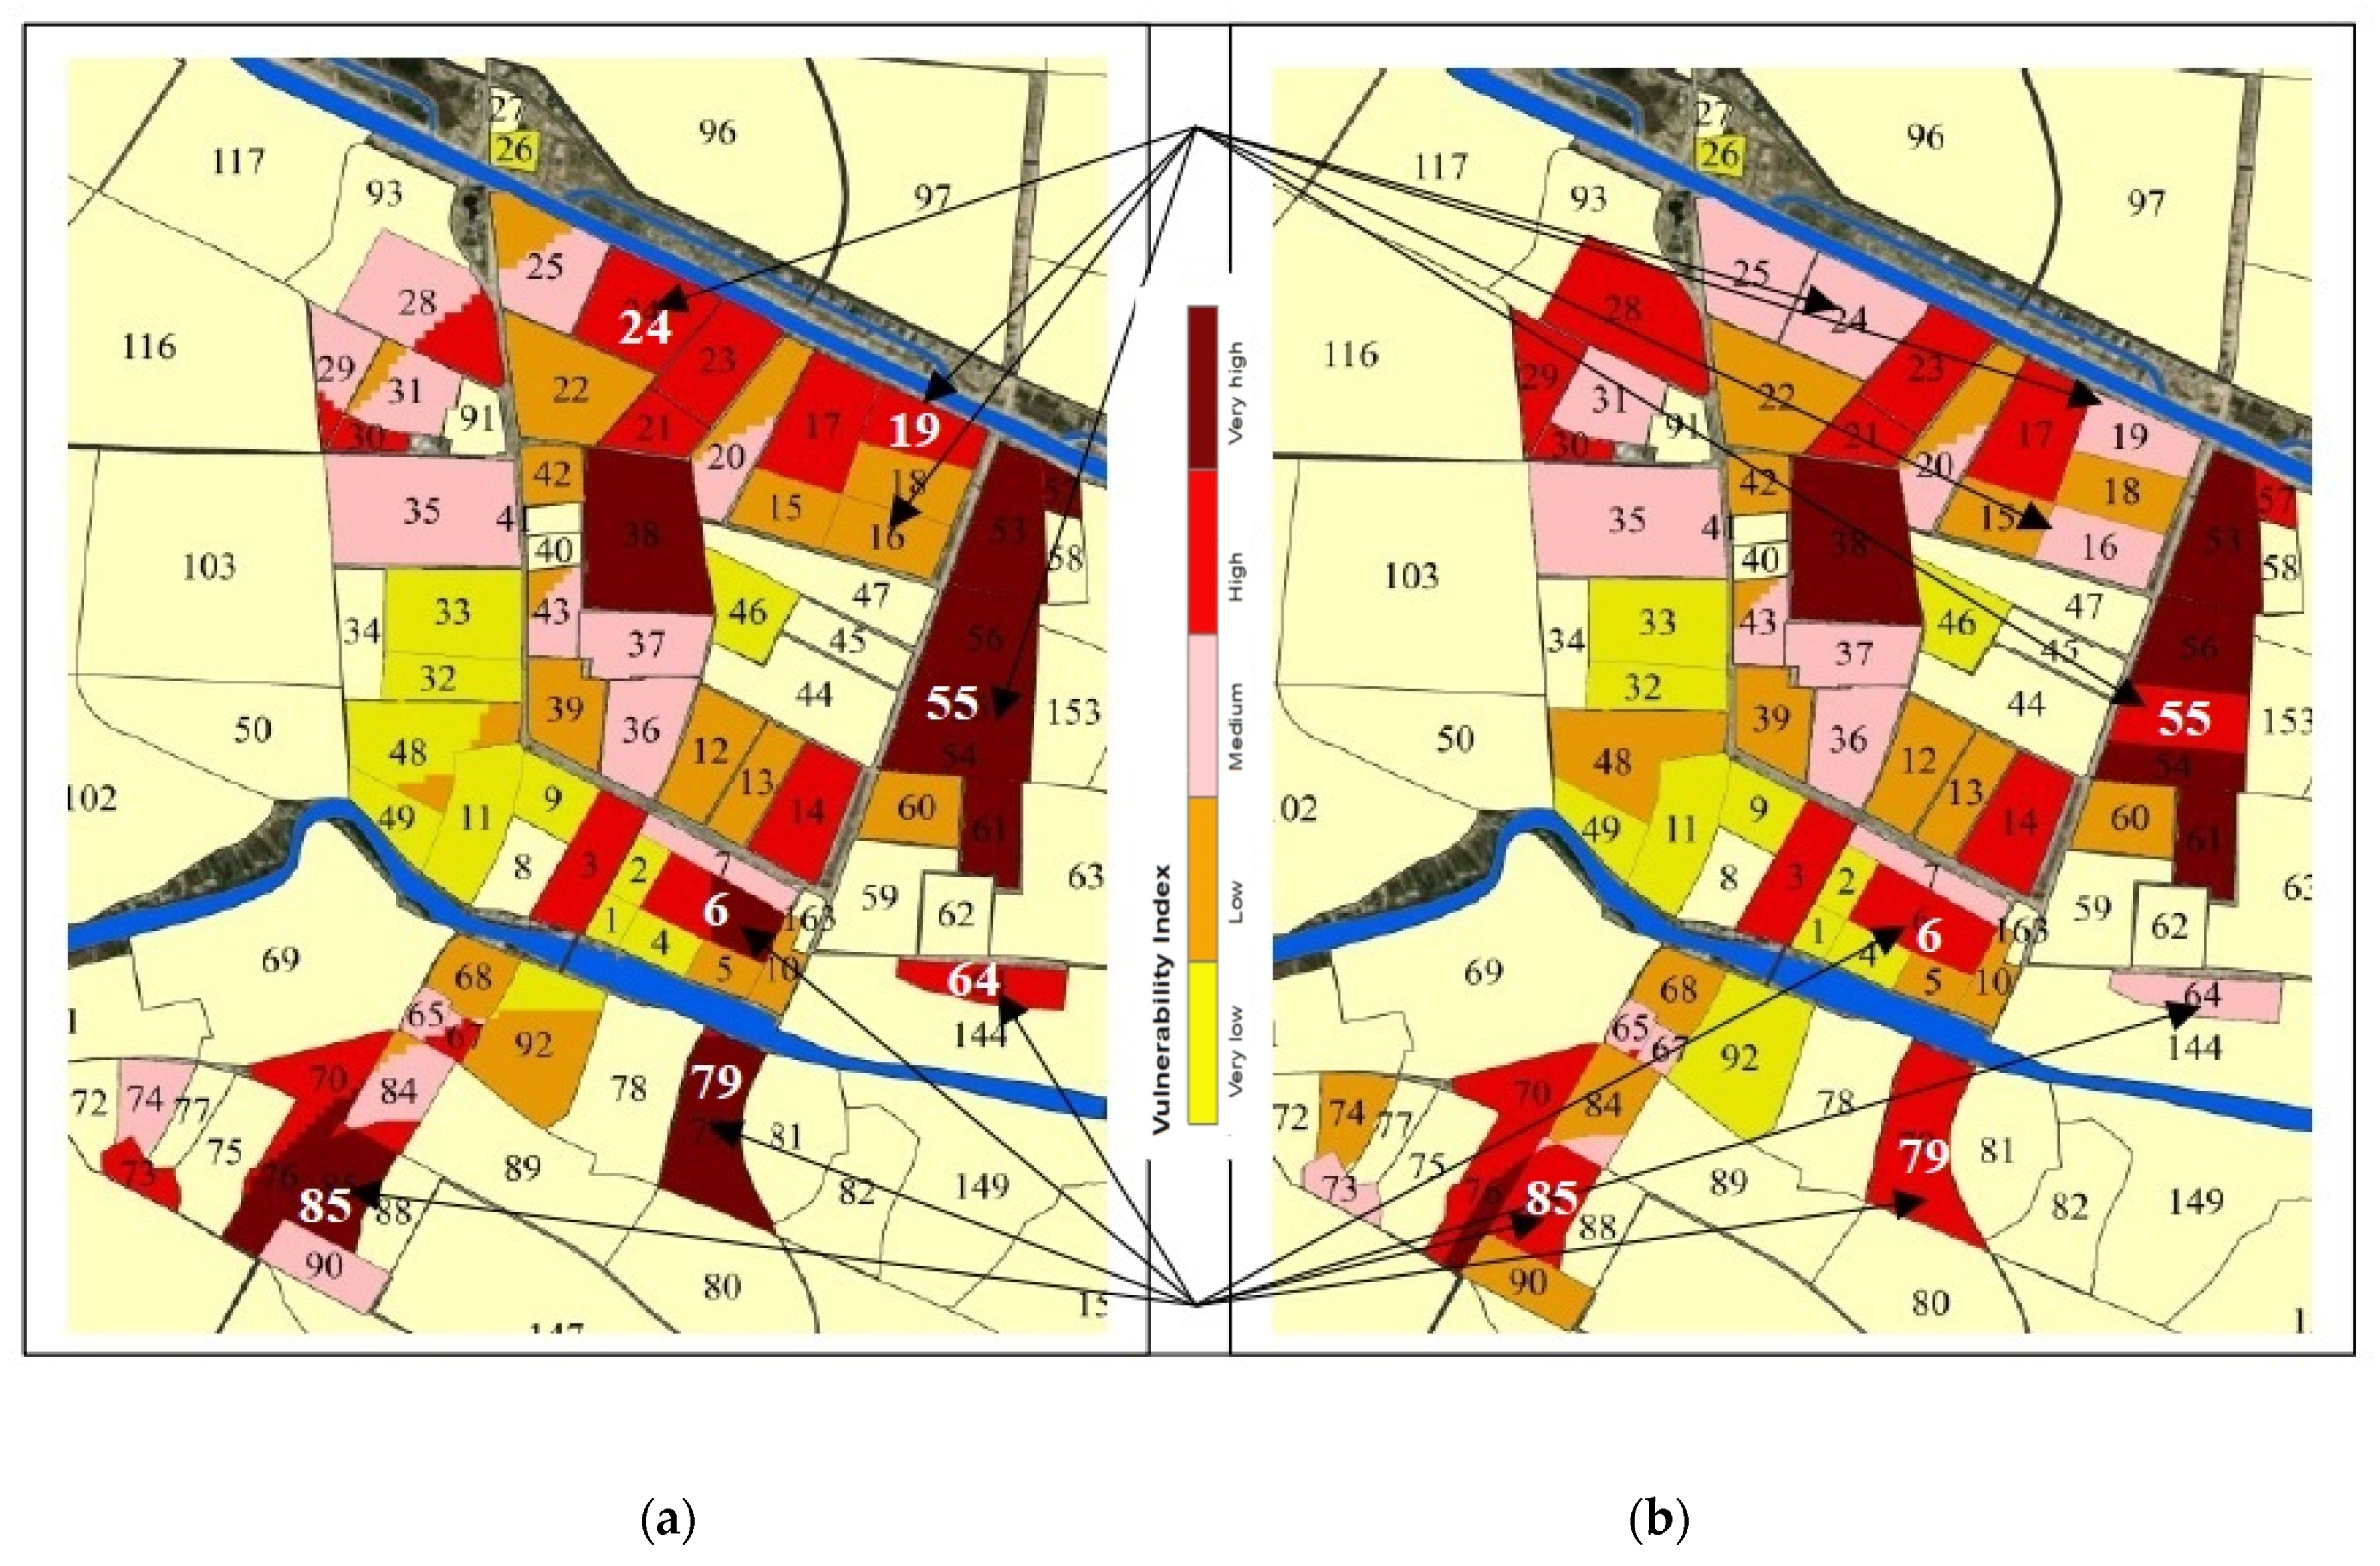
4.7.3. Sensitivity Analysis
5. Discussion
6. Conclusions
Author Contributions
Funding
Institutional Review Board Statement
Informed Consent Statement
Data Availability Statement
Conflicts of Interest
Appendix A

| Neighbourhood Code | Name | Neighbourhood Code | Name |
|---|---|---|---|
| 1 | Aljamaa | 46 | Alaskary_3 |
| 2 | Sawage | 47 | Alhasan |
| 3 | Alseray | 48 | Bashaeer |
| 4 | Syaf | 49 | Rasool_1 |
| 5 | Sabeah | 50 | Rasool_2-3 |
| 6 | Alsharqyah_1 | 53 | Feda_2 |
| 7 | Alsharqyah_2 | 54 | Alamen dakhaly_1 |
| 8 | AbuJada_1 | 55 | Alamen dakhaly_2 |
| 9 | AbuJada_2 | 56 | Alamen dakhaly_3 |
| 10 | Alarooba | 57 | Karama_1 |
| 11 | AladaraAlmahalyah | 58 | Karama_2 |
| 12 | Alsalhyah_1 | 59 | Tadahayh_1 |
| 13 | Alsalhyah_2 | 60 | Tadahayh_2 |
| 14 | Alsalhyah_3 | 61 | Tadahayh_3 |
| 15 | Shuhada_1 | 62 | Zahra |
| 16 | Shuhada_2 | 63 | Beqaa |
| 17 | Shuhada_3 | 64 | Khadrah |
| 18 | Shuhada_4 | 65 | old askan_1 |
| 19 | Shuhada_5 | 67 | Old askan_3 |
| 20 | Rafedeen | 68 | old askan_4 |
| 21 | Arido_1 | 69 | Mutanazah |
| 22 | Arido_2 | 70 | Zauyah_Bs |
| 23 | Arido_3 | 71 | Alaarja |
| 24 | Arido_4 | 72 | Mansuryah_1 |
| 25 | Arido_5 | 73 | Mansuryah_2 |
| 26 | Ind_n_1 | 74 | Mansuryah_3 |
| 27 | Ind_n_2 | 75 | Thura_1 |
| 28 | Sader_1 | 76 | Thura_2 |
| 29 | Sader_2 | 77 | Thura_3 |
| 30 | Sader_3 | 78 | Zaaylat |
| 31 | Sader_4 | 79 | Zaaylat_2 |
| 32 | Ur_1 | 80 | Zaaylat_3 |
| 33 | Ur_2 | 81 | Samood_fayth |
| 34 | Ur_3 | 82 | Samood_2 |
| 35 | Ur_4 | 84 | Shaalah |
| 36 | Sumer_1 | 85 | Sakak |
| 37 | Sumer_2 | 86 | Alaskan_Sanay |
| 38 | Sumer_3 | 87 | Alhbush |
| 39 | Sumer_4 | 88 | Alamarat |
| 40 | Almulmeen_1 | 89 | Shmukh |
| 41 | Almulmeen_2 | 90 | Kanzawy |
| 42 | Almulmeen_3 | 91 | Sader ccomplex |
| 43 | Almulmeen_4 | 92 | University complex |
| 44 | Alaskary_1 | 144 | Khatra-2 |
| 45 | Alaskary_2 |
References
- Rossell, J. Mapping of the Flood Distribution in an Urban Environment: The Case of Palma (Mallorca, Spain) in the First Two Decades of the 21st Century. Earth 2021, 24, 960–971. [Google Scholar] [CrossRef]
- Hanine, M.; Boutkhoum, O.; Barakaz, F.E.; Lachgar, M.; Assad, N. An Intuitionistic Fuzzy Approach for Smart City Development Evaluation for Developing Countries: Moroccan Context. Mathematics 2021, 9, 2668. [Google Scholar] [CrossRef]
- Islam, M.A.S.; Hossain, M.E.; Majed, N. Assessment of Physicochemical Properties and Comparative Pollution Status of the Dhaleshwari River in Bangladesh. Earth 2021, 2, 696–714. [Google Scholar] [CrossRef]
- Olorunfemi, I.E.; Fasinmirin, J.T.; Olufayo, A.A.; Komolafe, A.A. GIS and Remote Sensing-Based Analysis of the Impacts of Land use/Land Cover Change (LULCC) on the Environmental Sustainability of Ekiti State, Southwestern Nigeria; Springer: Berlin/Heidelberg, Germany, 2020; Volume 22, ISBN 0123456789. [Google Scholar]
- Lai, Y. Urban Intelligence for Planetary Health. Earth 2021, 2, 972–979. [Google Scholar] [CrossRef]
- Lyu, H.M.; Wu, Y.X.; Shen, J.S.; Zhou, A.N. Assessment of social-economic risk of Chinese dual land use system using fuzzy AHP. Sustainability 2018, 10, 2451. [Google Scholar] [CrossRef] [Green Version]
- Gerundo, R.; Marra, A.; De Salvatore, V. Construction of a composite vulnerability index to map peripheralization risk in urban and metropolitan areas. Sustainability 2020, 12, 4641. [Google Scholar] [CrossRef]
- Office, D.M.; Pradesh, A. Landslide Science and Practice; Springer: Berlin/Heidelberg, Germany, 2013. [Google Scholar] [CrossRef]
- Rönkkö, E.; Herneoja, A. Working across boundaries in urban land use and services planning—building public sector capabilities for digitalisation. Smart Cities 2021, 4, 767–782. [Google Scholar] [CrossRef]
- Thornton, L.E.; Schroers, R.-D.; Lamb, K.E.; Daniel, M.; Ball, K.; Chaix, B.; Kestens, Y.; Best, K.; Oostenbach, L.; Coffee, N.T. Operationalising the 20-minute neighbourhood. Int. J. Behav. Nutr. Phys. Act. 2022, 19, 15. [Google Scholar] [CrossRef]
- Jorgenson, A.K.; Clark, B.; Givens, J.E. The environmental impacts of militarization in comparative perspective: An overlooked relationship. Nat. Cult. 2012, 7, 314–337. [Google Scholar] [CrossRef]
- Hadeel, A.S.; Jabbar, M.T.; Chen, X. Application of remote sensing and GIS to the study of land use/cover change and urbanization expansion in Basrah province, Southern Iraq. Geo-Spatial Inf. Sci. 2009, 12, 135–141. [Google Scholar] [CrossRef]
- Durakovic, A. Medical effects of a transuranic “dirty bomb”. Mil. Med. 2017, 182, e1591–e1595. [Google Scholar] [CrossRef] [PubMed] [Green Version]
- Adel, M.; Biswajeet, S.; Mojaddadi, H.; Jung, R.H. Land Use Feature Extraction and Sprawl Development Prediction from Quickbird Satellite Imagery Using Dempster-Shafer and Land Transformation Model. Korean J. Remote Sens. 2020, 36, 15–27. [Google Scholar]
- Daniel, S.; Doran, M.A. GeoSmartCity: Geomatics contribution to the Smart City. In Proceedings of the 14th Annual International Conference on Digital Government Research, Quebec City, QC, Canada, 17–20 June 2013; pp. 65–71. [Google Scholar] [CrossRef] [Green Version]
- Stokes, E.C.; Seto, K.C. Characterizing and measuring urban landscapes for sustainability. Environ. Res. Lett. 2019, 14, 45002. [Google Scholar] [CrossRef]
- Fernández-García, M.; Navarro, C.J.; Gómez-Ramirez, I. Evaluating territorial targets of european integrated urban policy. The URBAN and URBANA initiatives in Spain (1994–2013). Land 2021, 10, 956. [Google Scholar] [CrossRef]
- Vinci, G.; Maddaloni, L.; Mancini, L.; Prencipe, S.A.; Ruggeri, M.; Tiradritti, M. The Health of the Water Planet: Challenges and Opportunities in the Mediterranean Area. An Overview. Earth 2021, 2, 894–919. [Google Scholar] [CrossRef]
- Akubia, J.E.K.; Ahmed, A.; Bruns, A. Assessing how land-cover change associated with urbanisation affects ecological sustainability in the greater Accra metropolitan area, Ghana. Land 2020, 9, 182. [Google Scholar] [CrossRef]
- Ruá, M.J.; Huedo, P.; Cordani, L.; Cabeza, M.; Saez, B.; Agost-Felip, R. Strategies of urban regeneration in vulnerable areas: A case study in Castellón, Spain. WIT Trans. Ecol. Environ. 2019, 238, 481–492. [Google Scholar] [CrossRef] [Green Version]
- Hall, J.; Azad Hossain, A.K.M. Mapping urbanization and evaluating its possible impacts on streamwater quality in Chattanooga, Tennessee, using GIS and remote sensing. Sustainability 2020, 12, 1980. [Google Scholar] [CrossRef] [Green Version]
- Hambling, T.; Weinstein, P.; Slaney, D. A review of frameworks for developing environmental health indicators for climate change and health. Int. J. Environ. Res. Public Health 2011, 8, 2854–2875. [Google Scholar] [CrossRef]
- Abascal, A.; Rothwell, N.; Shonowo, A.; Thomson, D.R.; Elias, P.; Elsey, H.; Yeboah, G.; Kuffer, M. “Domains of deprivation framework” for mapping slums, informal settlements, and other deprived areas in LMICs to improve urban planning and policy: A scoping review. Comput. Environ. Urban Syst. 2022, 93, 101770. [Google Scholar] [CrossRef]
- Malekmohammadi, B.; Jahanishakib, F. Vulnerability assessment of wetland landscape ecosystem services using driver-pressure-state-impact-response (DPSIR) model. Ecol. Indic. 2017, 82, 293–303. [Google Scholar] [CrossRef]
- Papathoma-Köhle, M.; Cristofari, G.; Wenk, M.; Fuchs, S. The importance of indicator weights for vulnerability indices and implications for decision making in disaster management. Int. J. Disaster Risk Reduct. 2019, 36, 101103. [Google Scholar] [CrossRef]
- Ministry of Housing Communities and Local Government. National Statistics English Indices of Deprivation 2019. Available online: https://www.gov.uk/government/statistics/english-indices-of-deprivation-2019 (accessed on 20 January 2021).
- Lynch, A.J.; Mosbah, S.M. Improving local measures of sustainability: A study of built-environment indicators in the United States. JCIT 2017, 60, 301–313. [Google Scholar] [CrossRef]
- Hazell, E. Disaggregating Ecosystem Benefits: An Integrated Environmental-Deprivation Index. Sustainability 2020, 12, 7589. [Google Scholar] [CrossRef]
- Ge, Y.; Yang, G.; Chen, Y.; Dou, W. Examining Social Vulnerability and Inequality: A Joint Analysis through a Connectivity Lens in the Urban Agglomerations of China. Sustainability 2019, 11, 1042. [Google Scholar] [CrossRef] [Green Version]
- Ruá, M.J.; Huedo, P.; Cabeza, M.; Saez, B.; Agost-Felip, R. A model to prioritise sustainable urban regeneration in vulnerable areas using SWOT and CAME methodologies. Neth. J. Hous. Built Environ. 2021, 36, 1603–1627. [Google Scholar] [CrossRef]
- Gerundo, R.; Nesticò, A.; Marra, A.; Carotenuto, M. Peripheralization Risk Mitigation: A Decision Support Model to Evaluate Urban Regeneration Programs Effectiveness. Sustainability 2020, 12, 8024. [Google Scholar] [CrossRef]
- Thornton, J.A.; Harding, W.R.; Slawski, T.M.; Lin, H. Monitoring and Evaluation: The Foundation for Lake and Reservoir Management. Earth 2022, 3, 115–124. [Google Scholar] [CrossRef]
- Li, J.; Ouyang, X.; Zhu, X. Land space simulation of urban agglomerations from the perspective of the symbiosis of urban development and ecological protection: A case study of Changsha-Zhuzhou-Xiangtan urban agglomeration. Ecol. Indic. 2021, 126, 107669. [Google Scholar] [CrossRef]
- Josimović, B.D.; Cvjetić, A.; Manić, B. Strategic Environmental Assessment in the Application of Preventive Protection for Wind Farm Noise—Case Study: Maestrale Ring Wind Farm. Energies 2021, 14, 6174. [Google Scholar] [CrossRef]
- George, S.L.; Kantamaneni, K.; V, R.A.; Prasad, K.A.; Shekhar, S.; Panneer, S.; Rice, L.; Balasubramani, K. A Multi-Data Geospatial Approach for Understanding Flood Risk in the Coastal Plains of Tamil Nadu, India. Earth 2022, 3, 383–400. [Google Scholar] [CrossRef]
- Assumma, V.; Bottero, M.; De Angelis, E.; Lourenço, J.M.; Monaco, R.; Soares, A.J. A decision support system for territorial resilience assessment and planning: An application to the Douro Valley (Portugal). Sci. Total Environ. 2021, 756, 143806. [Google Scholar] [CrossRef]
- Ferretti, V. Framing territorial regeneration decisions: Purpose, perspective and scope. Land Use Policy 2021, 102, 105279. [Google Scholar] [CrossRef]
- Billaud, O.; Soubeyrand, M.; Luque, S.; Lenormand, M. Comprehensive decision-strategy space exploration for efficient territorial planning strategies. Comput. Environ. Urban Syst. 2020, 83, 101516. [Google Scholar] [CrossRef]
- Ghorbanzadeh, O.; Feizizadeh, B.; Blaschke, T. Multi-criteria risk evaluation by integrating an analytical network process approach into GIS-based sensitivity and uncertainty analyses. Geomatics Nat. Hazards Risk 2018, 9, 127–151. [Google Scholar] [CrossRef] [Green Version]
- Hanoon, S.K.; Abdullah, A.F.; Shafri, H.Z.M.; Wayayok, A. Using scenario modelling for adapting to urbanization and water scarcity: Towards a sustainable city in semi-arid areas. Period. Eng. Nat. Sci. (PEN) 2021, 10, 518–532. [Google Scholar] [CrossRef]
- Diaz-Balteiro, L.; González-Pachón, J.; Romero, C. Measuring systems sustainability with multi-criteria methods: A critical review. Eur. J. Oper. Res. 2017, 258, 607–616. [Google Scholar] [CrossRef]
- Zolfaghary, P.; Zakerinia, M.; Kazemi, H. A model for the use of urban treated wastewater in agriculture using multiple criteria decision making (MCDM) and geographic information system (GIS). Agric. Water Manag. 2021, 243, 106490. [Google Scholar] [CrossRef]
- Malakar, S. Geospatial modelling of COVID-19 vulnerability using an integrated fuzzy MCDM approach: A case study of West Bengal, India. Model. Earth Syst. Environ. 2021, 2021, 1–14. [Google Scholar] [CrossRef]
- Caprioli, C.; Bottero, M. Addressing complex challenges in transformations and planning: A fuzzy spatial multicriteria analysis for identifying suitable locations for urban infrastructures. Land Use Policy 2021, 102, 105147. [Google Scholar] [CrossRef]
- Perera, K.; Tateishi, R.; Akihiko, K.; Herath, S. A Combined Approach of Remote Sensing, GIS, and Social Media to Create and Disseminate Bushfire Warning Contents to Rural Australia. Earth 2021, 2, 715–730. [Google Scholar] [CrossRef]
- Türk, E.; Zwick, P.D. Optimization of land use decisions using binary integer programming: The case of Hillsborough County, Florida, USA. J. Environ. Manag. 2019, 235, 240–249. [Google Scholar] [CrossRef] [PubMed]
- Parsian, S.; Amani, M.; Moghimi, A.; Ghorbanian, A.; Mahdavi, S. Flood hazard mapping using fuzzy logic, analytical hierarchy process, and multi-source geospatial datasets. Remote Sens. 2021, 13, 4761. [Google Scholar] [CrossRef]
- Alwan, I.A.; Aziz, N.A.; Hamoodi, M.N. Potential water harvesting sites identification using spatial multi-criteria evaluation in Maysan Province, Iraq. ISPRS Int. J. Geo-Inf. 2020, 9, 235. [Google Scholar] [CrossRef]
- Baalousha, H.M.; Tawabini, B.; Seers, T.D. Fuzzy or non-fuzzy? A comparison between fuzzy logic-based vulnerability mapping and DRASTIC approach using a numerical model. a case study from qatar. Water 2021, 13, 1288. [Google Scholar] [CrossRef]
- Sema, H.V.; Guru, B.; Veerappan, R. Fuzzy gamma operator model for preparing landslide susceptibility zonation mapping in parts of Kohima Town, Nagaland, India. Model. Earth Syst. Environ. 2017, 3, 499–514. [Google Scholar] [CrossRef]
- Bianchini, S.; Solari, L.; Del Soldato, M.; Raspini, F.; Montalti, R.; Ciampalini, A.; Casagli, N. Ground Subsidence Susceptibility (GSS) mapping in Grosseto plain (Tuscany, Italy) based on satellite InSAR data using frequency ratio and fuzzy logic. Remote Sens. 2019, 11, 2015. [Google Scholar] [CrossRef] [Green Version]
- Mallick, J.; Talukdar, S.; Kahla, N.B.; Ahmed, M.; Alsubih, M.; Almesfer, M.K.; Islam, A.R.M.T. A novel hybrid model for developing groundwater potentiality model using high resolution digital elevation model (DEM) derived factors. Water 2021, 13, 2632. [Google Scholar] [CrossRef]
- Sekandari, M.; Beiranvand Pour, A. Fuzzy Logic Modeling for Integrating the Thematic Layers Derived from Remote Sensing Imagery: A Mineral Exploration Technique. Environ. Sci. Proc. 2021, 6, 8. [Google Scholar] [CrossRef]
- Vučić, N.; Cetl, V.; Šantek, D.; Mađer, M. Importance of Official Geodata in Disaster Risk Management—Case Study of Croatia. Earth 2021, 2, 943–959. [Google Scholar] [CrossRef]
- United Nations. Report on the World Social Situation, 2003: Social Vulnerability: Sources and Challenges; United Nations Publications: New York, NY, USA, 2003; ISBN 92-1-130231-5. [Google Scholar]
- Huedo, P.; Ruá, M.J.; Florez-Perez, L.; Agost-Felip, R. Inclusion of gender views for the evaluation and mitigation of urban vulnerability: A case study in castellón. Sustainability 2021, 13, 10062. [Google Scholar] [CrossRef]
- Garcia-almirall, P. Residential Vulnerability of Barcelona: Methodology Integrating Multi-Criteria Evaluation Systems and Geographic Information Systems. Sustainability 2021, 13, 13659. [Google Scholar] [CrossRef]
- Galderisi, A.; Limongi, G. A comprehensive assessment of exposure and vulnerabilities in multi-hazard urban environments: A key tool for risk-informed planning strategies. Sustainability 2021, 13, 9055. [Google Scholar] [CrossRef]
- Kang, Y.; Kim, K.; Jung, J.; Son, S.; Kim, E.J. How vulnerable are urban regeneration sites to climate change in Busan, South Korea? Sustainability 2020, 12, 4032. [Google Scholar] [CrossRef]
- Pasi, R.; Viavattene, C.; La Loggia, G.; Musco, F. Assessing urban system vulnerabilities to flooding to improve resilience and adaptation in spatial planning. Green Energy Technol. 2018, 79–94. [Google Scholar] [CrossRef] [Green Version]
- Motalebi Damuchali, A.; Guo, H. Evaluation of odour properties, their relationships, and impact of an oil refinery plant on the surrounding environment using field measurements. Atmos. Environ. 2020, 230, 117480. [Google Scholar] [CrossRef]
- Mahdi, N.N.; Abed, H.T.; Sadik, N.J. The Discriminant Analysis in the Evaluation of Cancers Diseases in Iraq. Int. J. Adv. Sci. Eng. Inf. Technol. 2020, 10, 2170–2176. [Google Scholar] [CrossRef]
- Birchard, K. Does Iraq’s depleted uranium pose a health risk? Lancet 1998, 351, 657. [Google Scholar] [CrossRef]
- Wang, Y.; Von Gunten, K.; Bartova, B.; Meisser, N.; Astner, M.; Burger, M.; Bernier-Latmani, R. Products of in Situ Corrosion of Depleted Uranium Ammunition in Bosnia and Herzegovina Soils. Environ. Sci. Technol. 2016, 50, 12266–12274. [Google Scholar] [CrossRef] [PubMed] [Green Version]
- Faa, A.; Gerosa, C.; Fanni, D.; Floris, G.; Eyken, P.V.; Lachowicz, J.I.; Nurchi, V.M. Depleted Uranium and Human Health. Curr. Med. Chem. 2017, 25, 49–64. [Google Scholar] [CrossRef]
- Al-Ansari, N.; Knutsson, S.; Pusch, R. The environmental implications of depleted uranium in Iraq and the principles of isolating it. WIT Trans. Ecol. Environ. 2014, 180, 367–375. [Google Scholar] [CrossRef] [Green Version]
- Toque, C.; Milodowski, A.E.; Baker, A.C. The corrosion of depleted uranium in terrestrial and marine environments. J. Environ. Radioact. 2014, 128, 97–105. [Google Scholar] [CrossRef] [PubMed]
- Savabieasfahani, M.; Basher Ahamadani, F.; Mahdavi Damghani, A. Living near an active U.S. military base in Iraq is associated with significantly higher hair thorium and increased likelihood of congenital anomalies in infants and children. Environ. Pollut. 2020, 256, 113070. [Google Scholar] [CrossRef] [PubMed]
- Shewale, S.V. Low Dose Nerve Agent Sarin Causes Dilated Cardiomyopathy and Autonomic Imbalance in Mice. Ph.D. Thesis, Wright State University, Dayton, OH, USA, 2011. [Google Scholar]
- Gray, G.C.; Smith, T.C.; Knoke, J.D.; Heller, J.M. The postwar hospitalization experience of Gulf War veterans possibly exposed to chemical munitions destruction at Khamisiyah, Iraq. Am. J. Epidemiol. 1999, 150, 532–540. [Google Scholar] [CrossRef] [PubMed] [Green Version]
- Ribeiro, D.F.; Saito, S.M.; Célia dos Santos Alvalá, R. Disaster vulnerability analysis of small towns in Brazil. Int. J. Disaster Risk Reduct. 2022, 68, 102726. [Google Scholar] [CrossRef]
- Nassar, D.M.; Elsayed, H.G. From Informal Settlements to sustainable communities. Alex. Eng. J. 2018, 57, 2367–2376. [Google Scholar] [CrossRef]
- Mouratidis, K.; Yiannakou, A. COVID-19 and urban planning: Built environment, health, and well-being in Greek cities before and during the pandemic. Cities 2022, 121, 103491. [Google Scholar] [CrossRef] [PubMed]
- Goto, E.A.; Suarez, A.M.; Ye, H. Spatial analysis of social vulnerability in São Paulo city, Brazil. Appl. Geogr. 2022, 140, 102653. [Google Scholar] [CrossRef]
- Guan, W.; Liu, Q.; Dong, C. Risk assessment method for industrial accident consequences and human vulnerability in urban areas. J. Loss Prev. Process Ind. 2022, 76, 104745. [Google Scholar] [CrossRef]
- Sarker, M.S.H. Assessing levels of migrant-friendliness in the context of vulnerability to climate variability, change and environmental hazard: A comparison of two different-sized cities. Int. J. Disaster Risk Reduct. 2022, 68, 102525. [Google Scholar] [CrossRef]
- Olivero, M.A.; Bertolino, A.; Dominguez-Mayo, F.J.; Matteucci, I.; Escalona, M.J. A Delphi Study to Recognize and Assess Systems of Systems Vulnerabilities. Inf. Softw. Technol. 2022, 146, 106874. [Google Scholar] [CrossRef]
- Zadeh, L. Zadeh_FuzzySetTheory_1965.pdf. Inf. Control 1965, 8, 338–353. [Google Scholar] [CrossRef] [Green Version]
- Carver, S.J. Integrating multi-criteria evaluation with geographical information systems. Int. J. Geogr. Inf. Syst. 1991, 5, 321–339. [Google Scholar] [CrossRef] [Green Version]
- Wind, Y.; Saaty, T.L. Marketing Applications of the Analytic Hierarchy Process. Manag. Sci. 1980, 26, 641–658. [Google Scholar] [CrossRef]
- He, M.X.; An, X. Information security risk assessment based on analytic hierarchy process. Indones. J. Electr. Eng. Comput. Sci. 2016, 1, 656–664. [Google Scholar] [CrossRef]
- Abu-Bakr, H.A.E.A. Groundwater vulnerability assessment in different types of aquifers. Agric. Water Manag. 2020, 240, 106275. [Google Scholar] [CrossRef]
- Haki, Z.; Akyürek, Z.; Düzgün, Ş. Assessment of Social Vulnerability Using Geographic Information Systems: Pendik, Istanbul Case Study. Master’s Thesis, Middle East Technical University, Ankara, Turkey, 2004; pp. 413–423. [Google Scholar]
- Chen, J.; Yang, S.; Li, H.; Zhang, B.; Lv, J. Research on geographical environment unit division based on the method of natural breaks (Jenks). Int. Arch. Photogramm. Remote Sens. Spat. Inf. Sci. ISPRS Arch. 2013, 40, 47–50. [Google Scholar] [CrossRef] [Green Version]
- Osaragi, T. Classification Methods for Spatial Data Representation. UCL-Centre Adv. Spat. Anal. Pap. Ser. 2002, 44, 1–19. [Google Scholar]
- Alkhodari, M.; Jelinek, H.F.; Saleem, S.; Hadjileontiadis, L.J.; Khandoker, A.H. Revisiting Left Ventricular Ejection Fraction Levels: A Circadian Heart Rate Variability-Based Approach. IEEE Access 2021, 9, 130111–130126. [Google Scholar] [CrossRef]
- Chen, Y.; Santosa, A.E.; Yi, A.M.; Sharma, A.; Sharma, A.; Lo, D. A Machine Learning Approach for Vulnerability Curation. In Proceedings of the 17th International Conference on Mining Software Repositories, Seoul, Korea, 29–30 June 2020; pp. 32–42. [Google Scholar] [CrossRef]
- Ko, Y. How to use negative class information for Naive Bayes classification. Inf. Process. Manag. 2017, 53, 1255–1268. [Google Scholar] [CrossRef]
- David, S.; Saeb, A.; Rubeaan, K. Al Comparative Analysis of Data Mining Tools and Classification Techniques using WEKA in Medical Bioinformatics. Comput. Eng. Intell. 2013, 4, 28–39. Available online: http://iiste.org/Journals/index.php/CEIS/article/view/9348 (accessed on 1 February 2021).
- McHugh, M.L. Interrater reliability: The kappa statistic. Biochemia medica. Biochem. Medica 2012, 22, 276–282. [Google Scholar] [CrossRef]
- Gitinavard, H.; Mousavi, S.M.; Vahdani, B. Soft computing based on hierarchical evaluation approach and criteria interdependencies for energy decision-making problems: A case study. Energy 2017, 118, 556–577. [Google Scholar] [CrossRef]
- Issa, U.; Saeed, F.; Miky, Y.; Alqurashi, M.; Osman, E. Hybrid AHP-Fuzzy TOPSIS Approach for Selecting Deep Excavation Support System. Buildings 2022, 12, 295. [Google Scholar] [CrossRef]
- Saltelli, A.; Aleksankina, K.; Becker, W.; Fennell, P.; Ferretti, F.; Holst, N.; Li, S.; Wu, Q. Why so many published sensitivity analyses are false: A systematic review of sensitivity analysis practices. Environ. Model. Softw. 2019, 114, 29–39. [Google Scholar] [CrossRef]
- Hoops, S.; Hontecillas, R.; Abedi, V.; Leber, A.; Philipson, C.; Carbo, A.; Bassaganya-Riera, J. Ordinary Differential Equations (ODEs) Based Modeling. In Computational Immunology; Academic Press: Cambridge, MA, USA, 2016; pp. 63–78. [Google Scholar] [CrossRef]
- Effat, H.A.; Ramadan, M.S.; Ramadan, R.H. A spatial model for assessment of urban vulnerability in the light of the UN New Urban Agenda guidelines: Case study of Assiut City, Egypt. Model. Earth Syst. Environ. 2021, 2021, 1–20. [Google Scholar] [CrossRef] [PubMed]
- Waly, N.M.; Ayad, H.M.; Saadallah, D.M. Assessment of spatiotemporal patterns of social vulnerability: A tool to resilient urban development Alexandria, Egypt. Ain Shams Eng. J. 2021, 12, 1059–1072. [Google Scholar] [CrossRef]


| Activity Types | Buffer Zone Radius (km) |
|---|---|
| Dangerous landfill | 15 |
| Oil refinery | 10 |
| Gas plant | 10 |
| Aluminium and cable factories | 10 |
| Thermal power station | 5 |
| Iron plant | 5 |
| Brick factory | 5 |
| Protein feed factory | 3 |
| Asphalt plant | 5 |
| Landfill | 2 |
| WWTPs | 2 |
| Activity Types | Buffer Zone Radius (m) |
|---|---|
| Flour mill processing plant | 1000 |
| Gas power plant | 1000 |
| Wire plant | 1000 |
| Poultry industry | 1000 |
| Poultry slaughter | 1000 |
| Sandwich panel industry | 1000 |
| Woolen textile factory | 500 |
| Concert plant | 500 |
| Plastic and paint plant | 500 |
| Activity Types | Buffer Zone Radius (m) |
|---|---|
| Site of oil stores | 500 |
| Vehicle industrial complex | 500 |
| Pumping station of wastewater | 20 |
| Facility | Maximum Access Distance from Dwellings to Facility (m) | Number of Units/Population |
|---|---|---|
| Nursery | 300 | 1 per 2400–3600 capita |
| Kindergarten | 300 | 1 per 2400–3600 capita |
| Primary school | 500 | 1 per 2400–3600 capita |
| Intermediate school | 500 | 1 per 9600–14,400 capita |
| Secondary school | 800 | 1 per 9600–14,400 capita |
| Health centre | 800 | 1 per 9600–14,400 capita |
| Open space | / | 6.25 m2 per capita |
| Streets | / | 11.6% to 26% from total area |
| Population density per hectare | / | 250 persons per hectare (p/h) |
| Housing density | / | 42 dwellings per hectare (d/h) |
| No. | Data | Description | Source | Accuracy |
|---|---|---|---|---|
| 1 | Sentinel 2 image, October 2021 | It was used to classify the land cover of the study area and extract green space (sub-criteria of the urban domain). | European Union’s Earth observation programme (Copernicus) | 10 m |
| 2 | Pléiades 1, product name: ORTHO, 2014 | The images were utilised to validate land use classes and the boundary of old neighbourhoods and to increase the resolution of image classification. | Iraqi General Survey Authority | 0.50 m |
| 3 | Land use—streets, districts and water networks, 2021 | The data were analysed spatially to classify land use classes, street case (asphalt or dusty) and wastewater discharge systems (sewage network systems or home septic tanks). | Office of the Municipality of Nasiriyah City, Iraq | 2 m |
| 4 | Master plan of Nasiriyah City | The shape files were analysed to compare actual land use with the master plan of the city based on urban planning indicators. | Office of Urban Planning, Nasiriyah City, Iraq | 2 m |
| 5 | Pipeline wastewater, manhole sewages, pump stations and water treatment stations (WTSs) | They were manipulated spatially to determine the locations of polluted sources (WWTPs) and pump stations of wastewater. Spatial analysis of infrastructure distribution in the city was conducted. | Office of Sewage Department in Dhi Qar | 2 m |
| 6 | Poultry sites, protein factories and animal feeds | They were treated spatially and then entered within the sub-criteria of the environment domain. | Agriculture Directorate of Dhi Qar, Iraq | 5 m |
| 7 | Polluted industrial projects | They were analysed spatially and listed under point-source pollution (sub-criteria of the environment domain). | Dhi Qar Investments Office (Iraq) | 5 m |
| 8 | Polluted sites (2021) | They were manipulated and integrated with spatial data and then organised under point-source pollution. | Dhi Qar Environment Office (Iraq) | 1 m |
| 9 | Health care centres and hospitals (2021) | The data were analysed spatially and then compared with urban planning indicators before being entered into the sub-criteria of the social domain. | Ministry of Health (Dhi Qar office, Iraq) | 2 m |
| 10 | Schools (2021) | The same processes in Item (9) were performed. | Ministry of Education (Dhi Qar office, Iraq) | 2 m |
| 11 | Unemployment rate (2021) | Data were entered into the sub-criteria of the social domain. | Iraqi Ministry of Planning, Department of Statistics | Neighbourhood scale |
| 12 | Paper maps (2020) | They were converted into raster form and then utilised to validate the image classification and spatial distribution pattern digitisation of missed geographic features. | Office of Urban Planning, Nasiriyah City, Iraq | 1/25,000 1/10,000 1/2500 |
| 13 | Population housing census (2021) | Data were entered as sub-criteria of the urban domain. | Ministry of Planning/Statistics Office | Neighbourhood scale |
| 14 | Site survey using GPS (2022) | The work was required to validate data, increase the resolution of the geographic features of locations and complete missing data. | Author | 2 m |
| 15 | Site survey using drone images (February 2021) | They were used for the digitalisation of informal settlements. | Author | 2 m |
| Major Criteria | Major Weight | Sub-Criteria | Sub-Weight | Partial Weight = Sub-Weight × Major Weight |
|---|---|---|---|---|
| Environment domain (A) | 0.441 | Class A (c1) | 0.221 | 0.097 |
| Class B (c2) | 0.128 | 0.057 | ||
| Class C (c3) | 0.076 | 0.034 | ||
| Weapon effects (c4) | 0.575 | 0.254 | ||
| Subtotal | 1.000 | 0.441 | ||
| Building domain (B) | 271 | Informal settlements (c5) | 0.644 | 0.175 |
| Lack of infrastructure (c6) | 0.356 | 0.097 | ||
| Subtotal | 1.000 | 0.271 | ||
| Urban domain (C) | 0.144 | Population density (c7) | 0.491 | 0.071 |
| Housing density (c8) | 0.255 | 0.037 | ||
| Green space (c9) | 0.255 | 0.037 | ||
| Subtotal | 1.000 | 0.144 | ||
| Social domain (D) | 0.144 | Health services (c10) | 0.255 | 0.037 |
| Educational services (c11) | 0.255 | 0.037 | ||
| Unemployment rate (c12) | 0.491 | 0.071 | ||
| Subtotal | 1.000 | 0.144 | ||
| Total | ∑ = 1 | ∑ = 1 | 1.000 |
| Vulnerability Indicators | Number of Neighbourhoods | Neighbourhood Code | Population | Ratio from the Total Population | Area (Hectares) |
|---|---|---|---|---|---|
| Very high | 6 | 38, 53, 56, 57, 62 and 79 | 106,809 | 15% | 267 |
| High | 17 | 204,762 | 29% | 557 | |
| Medium | 14 | 119,185 | 17% | 433 | |
| Low | 11 | 77,596 | 11% | 329 | |
| Very low | 13 | 61,194 | 9% | 366 |
| Vulnerability Indicators | Number of Neighbourhoods | Neighbourhood Code | Population | Ratio from the Total Population | Area (Hectares) |
|---|---|---|---|---|---|
| Very high | 11 | 6, 38, 53, 54, 55, 56, 57, 61, 76, 79, 85 | 175,678 | 25% | 431 |
| High | 12 | 115,841 | 16% | 336 | |
| Medium | 14 | 145,345 | 21% | 503 | |
| Low | 13 | 93,033 | 13% | 388 | |
| Very low | 11 | 39,649 | 6% | 293 |
| Vulnerability Indictors | Number of Neighbourhoods | Neighbourhood Code | Population | Ratio from the Total Population | Area (Hectares) |
|---|---|---|---|---|---|
| Very high | 5 | 38, 53, 54, 56, 61 | 104,844 | 15% | 255 |
| High | 15 | 202,208 | 29% | 509 | |
| Medium | 15 | 120,049 | 17% | 484 | |
| Low | 30 | 107,780 | 15% | 430 | |
| Very low | 11 | 34,665 | 5% | 302 |
Publisher’s Note: MDPI stays neutral with regard to jurisdictional claims in published maps and institutional affiliations. |
© 2022 by the authors. Licensee MDPI, Basel, Switzerland. This article is an open access article distributed under the terms and conditions of the Creative Commons Attribution (CC BY) license (https://creativecommons.org/licenses/by/4.0/).
Share and Cite
Hanoon, S.K.; Abdullah, A.F.; Shafri, H.Z.M.; Wayayok, A. Comprehensive Vulnerability Assessment of Urban Areas Using an Integration of Fuzzy Logic Functions: Case Study of Nasiriyah City in South Iraq. Earth 2022, 3, 699-732. https://doi.org/10.3390/earth3020040
Hanoon SK, Abdullah AF, Shafri HZM, Wayayok A. Comprehensive Vulnerability Assessment of Urban Areas Using an Integration of Fuzzy Logic Functions: Case Study of Nasiriyah City in South Iraq. Earth. 2022; 3(2):699-732. https://doi.org/10.3390/earth3020040
Chicago/Turabian StyleHanoon, Sadeq Khaleefah, Ahmad Fikri Abdullah, Helmi Z. M. Shafri, and Aimrun Wayayok. 2022. "Comprehensive Vulnerability Assessment of Urban Areas Using an Integration of Fuzzy Logic Functions: Case Study of Nasiriyah City in South Iraq" Earth 3, no. 2: 699-732. https://doi.org/10.3390/earth3020040