
Geospatial Multi-Criteria Evaluation Using AHP–GIS to Delineate Groundwater Potential Zones in Zakho Basin, Kurdistan Region, Iraq


Abstract
:1. Introduction
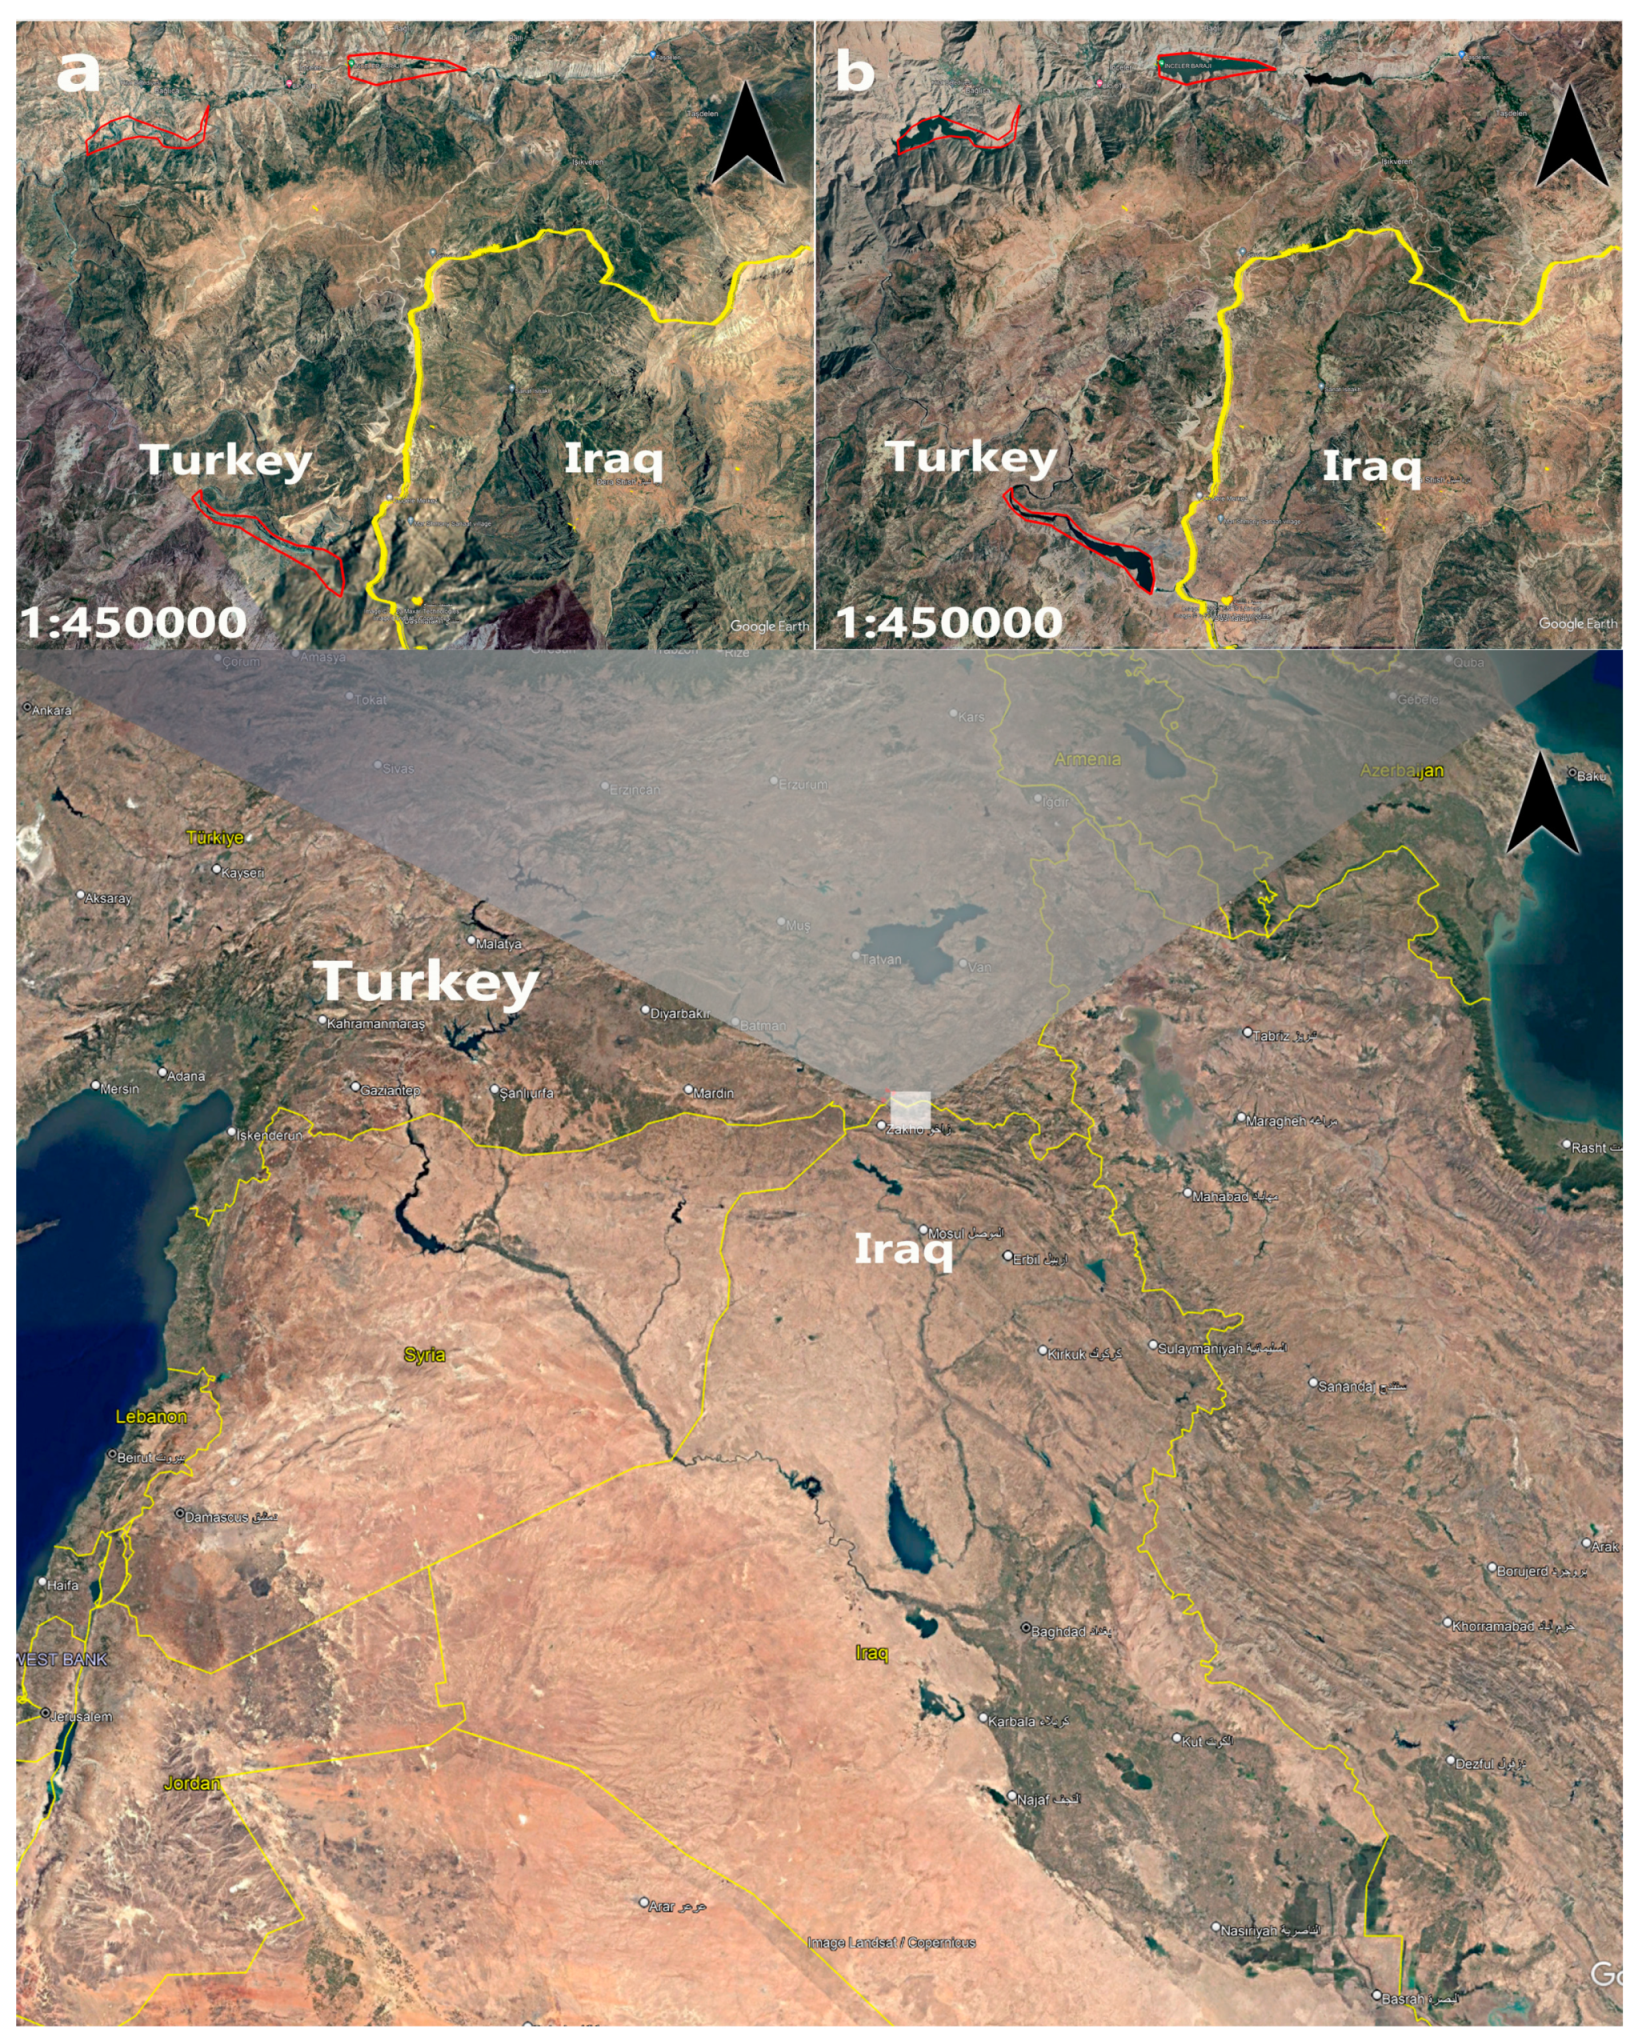
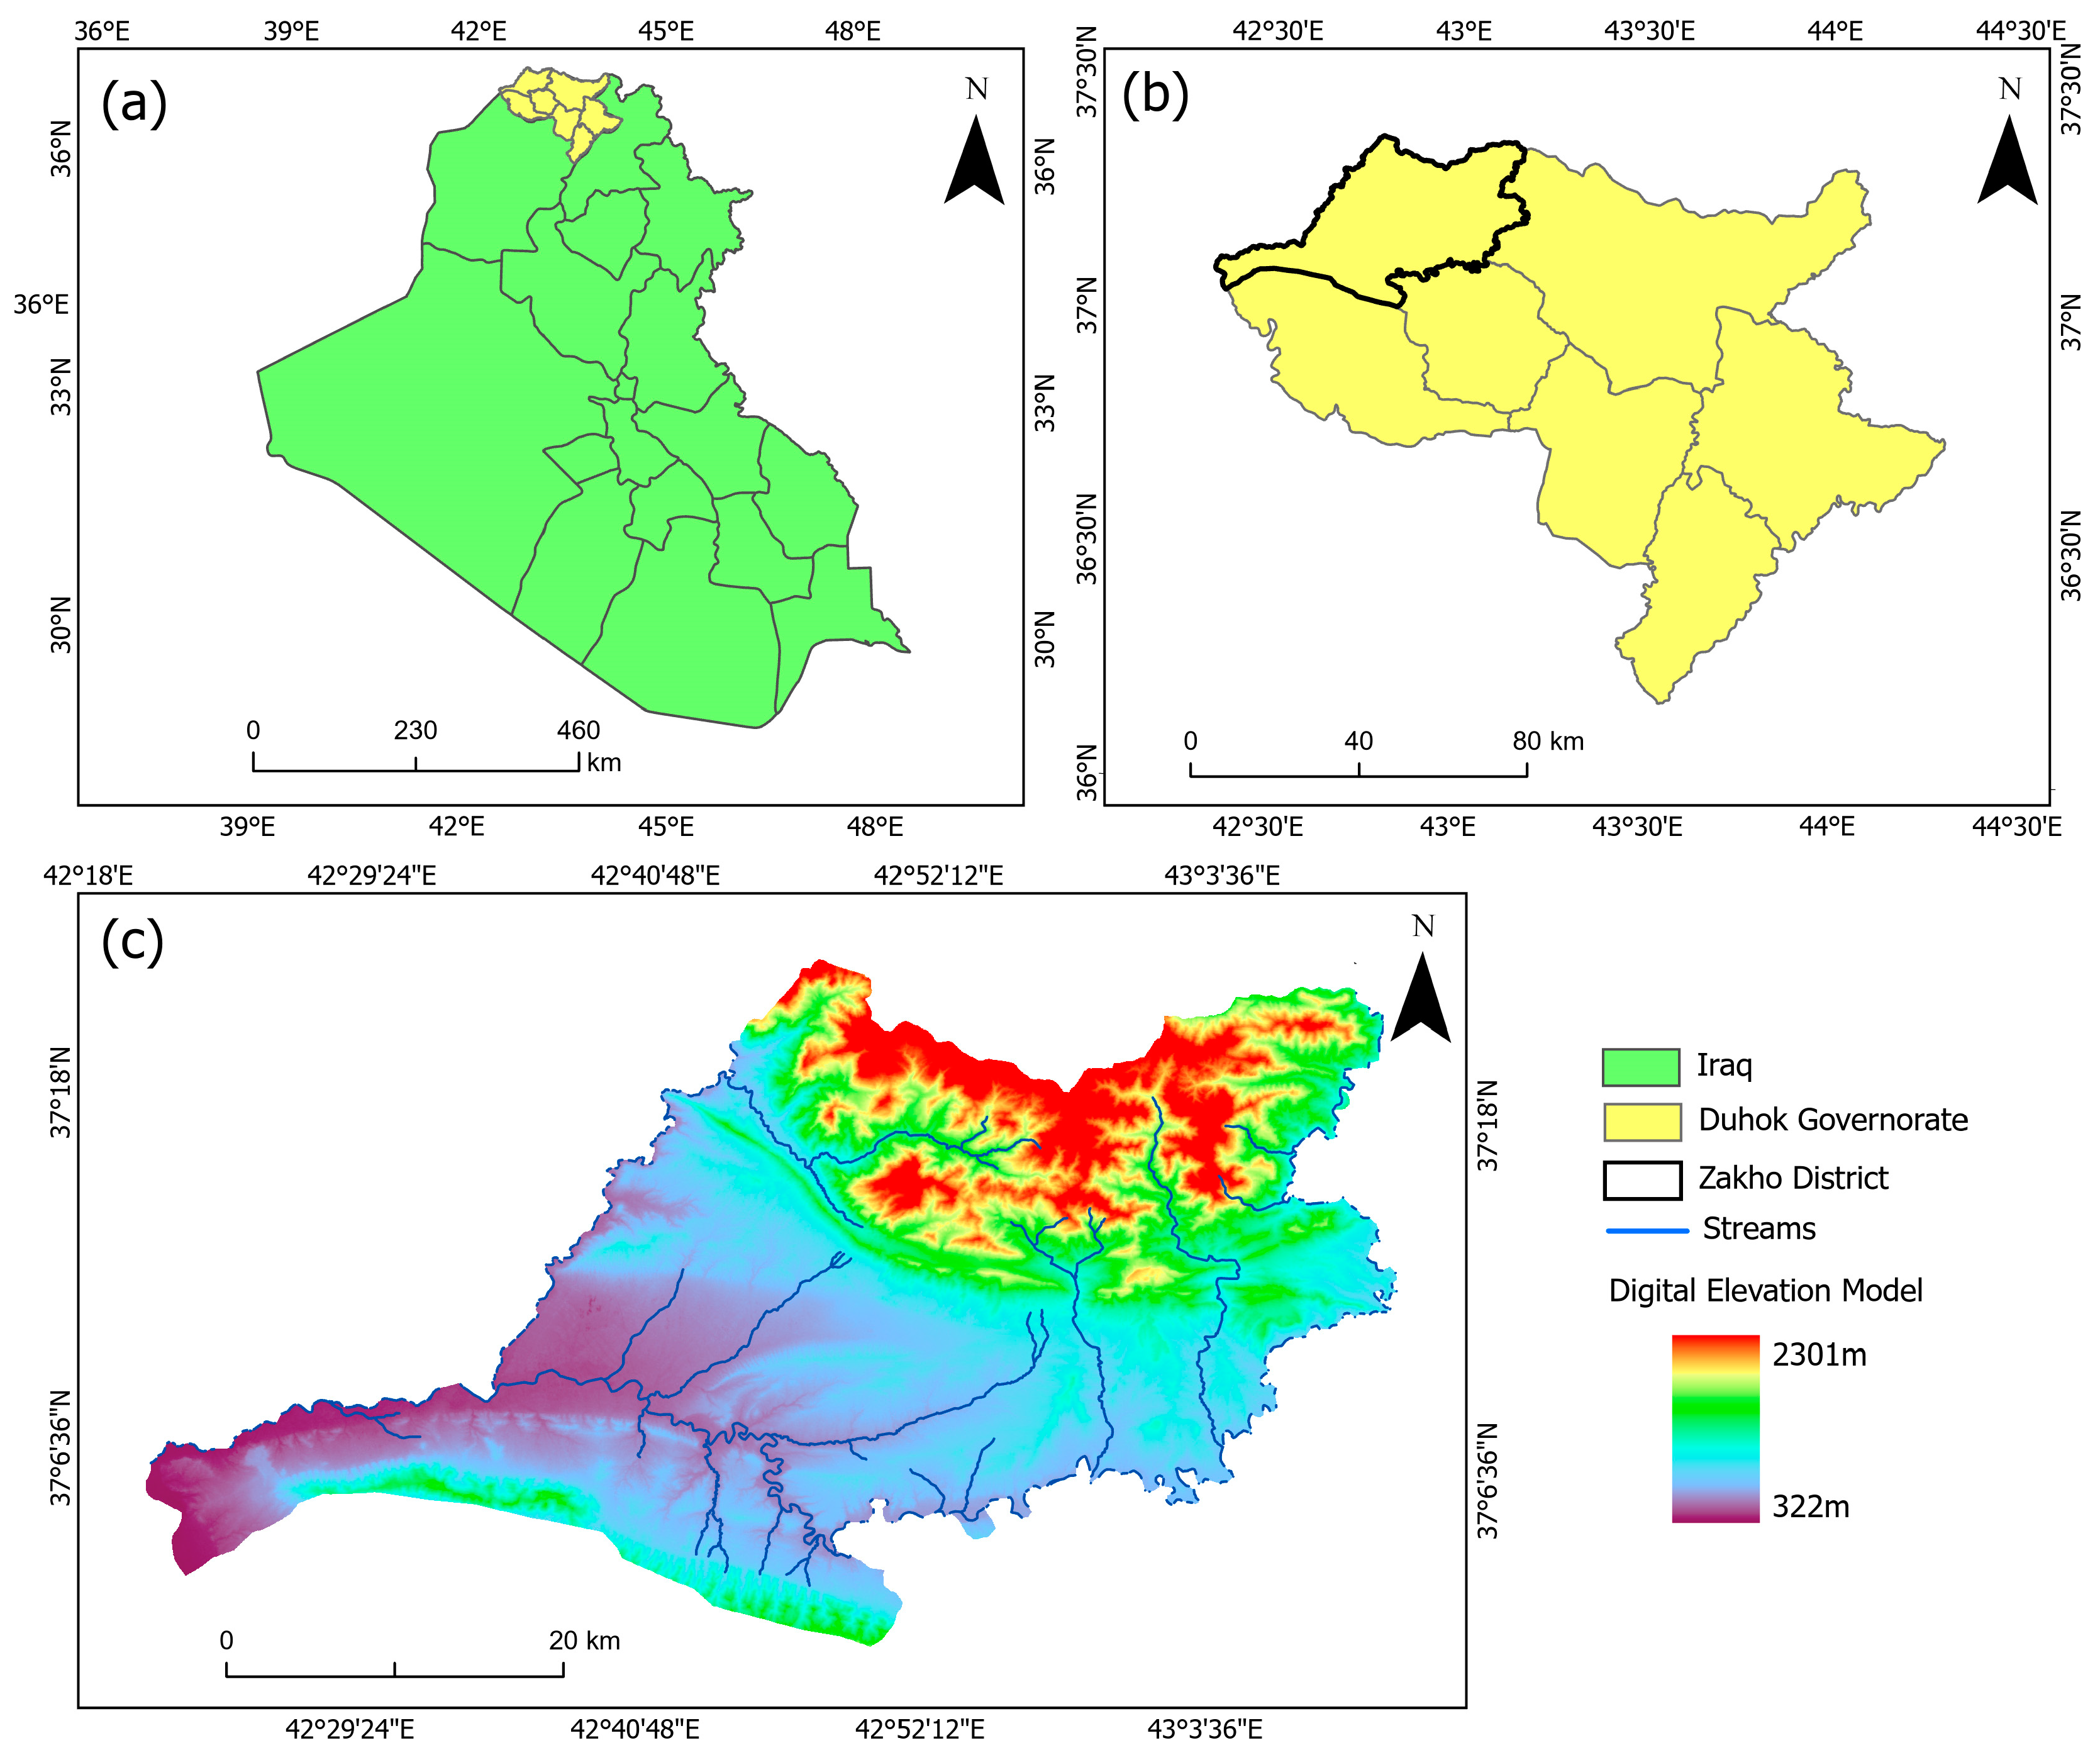
2. Study Area
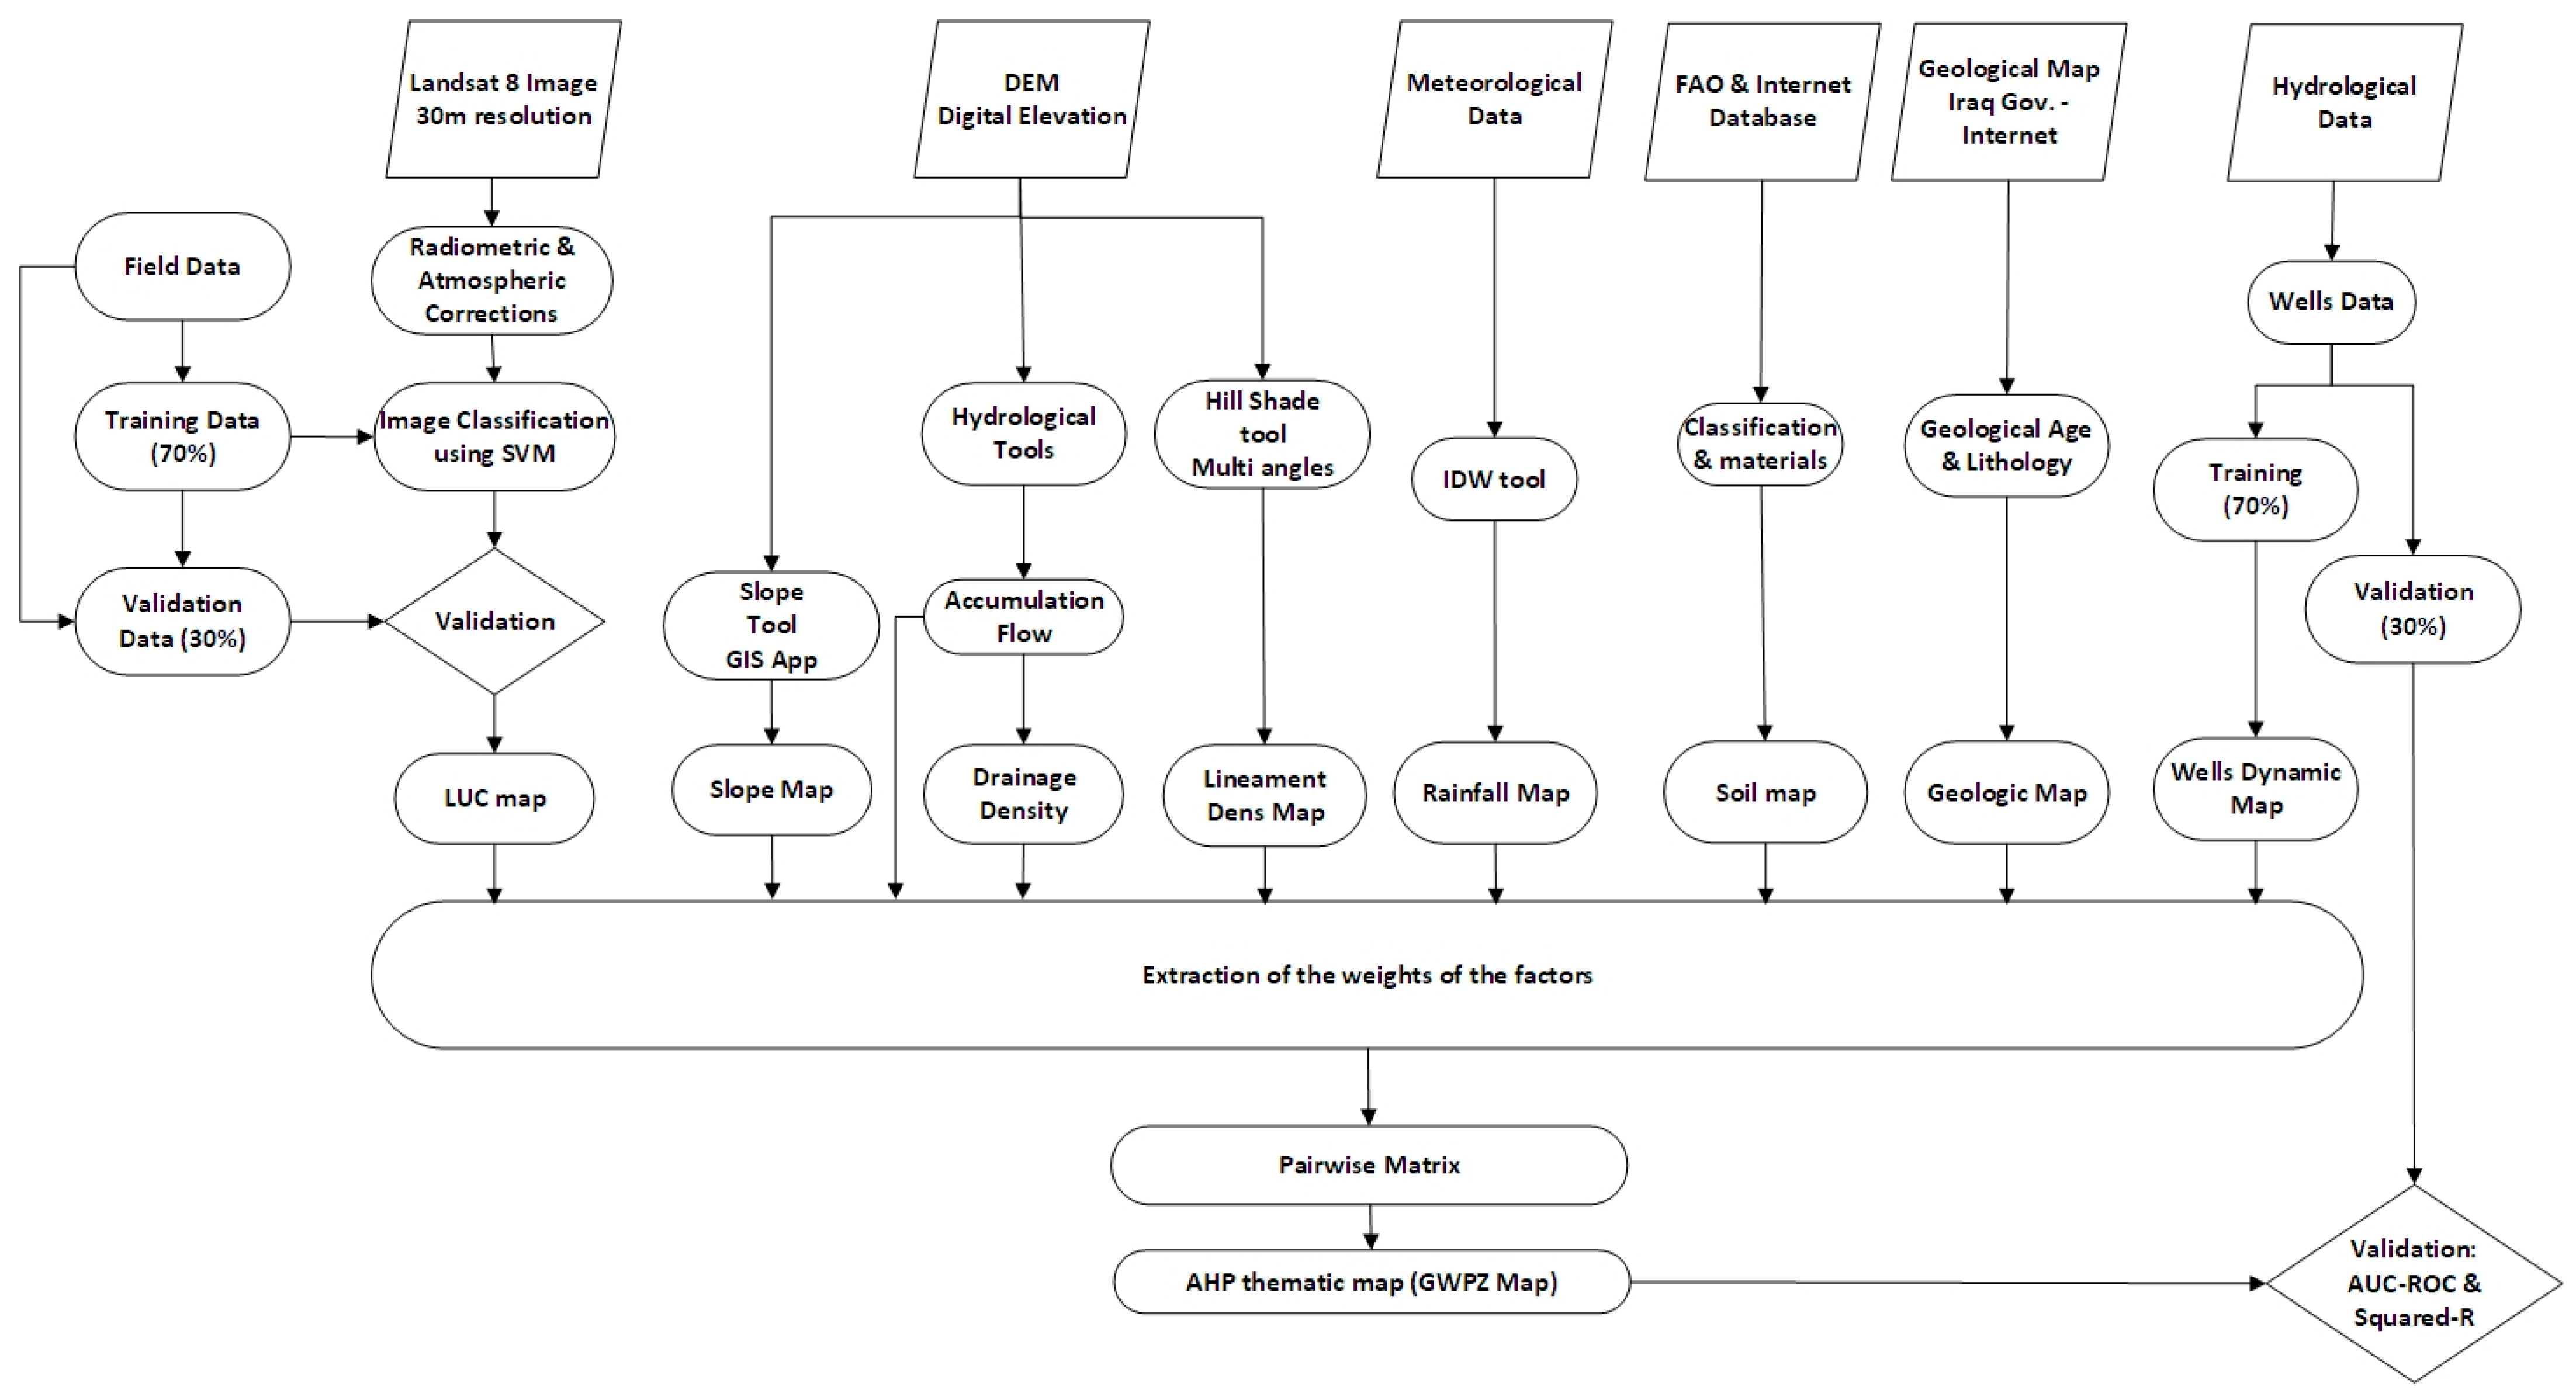
3. Materials and Methods
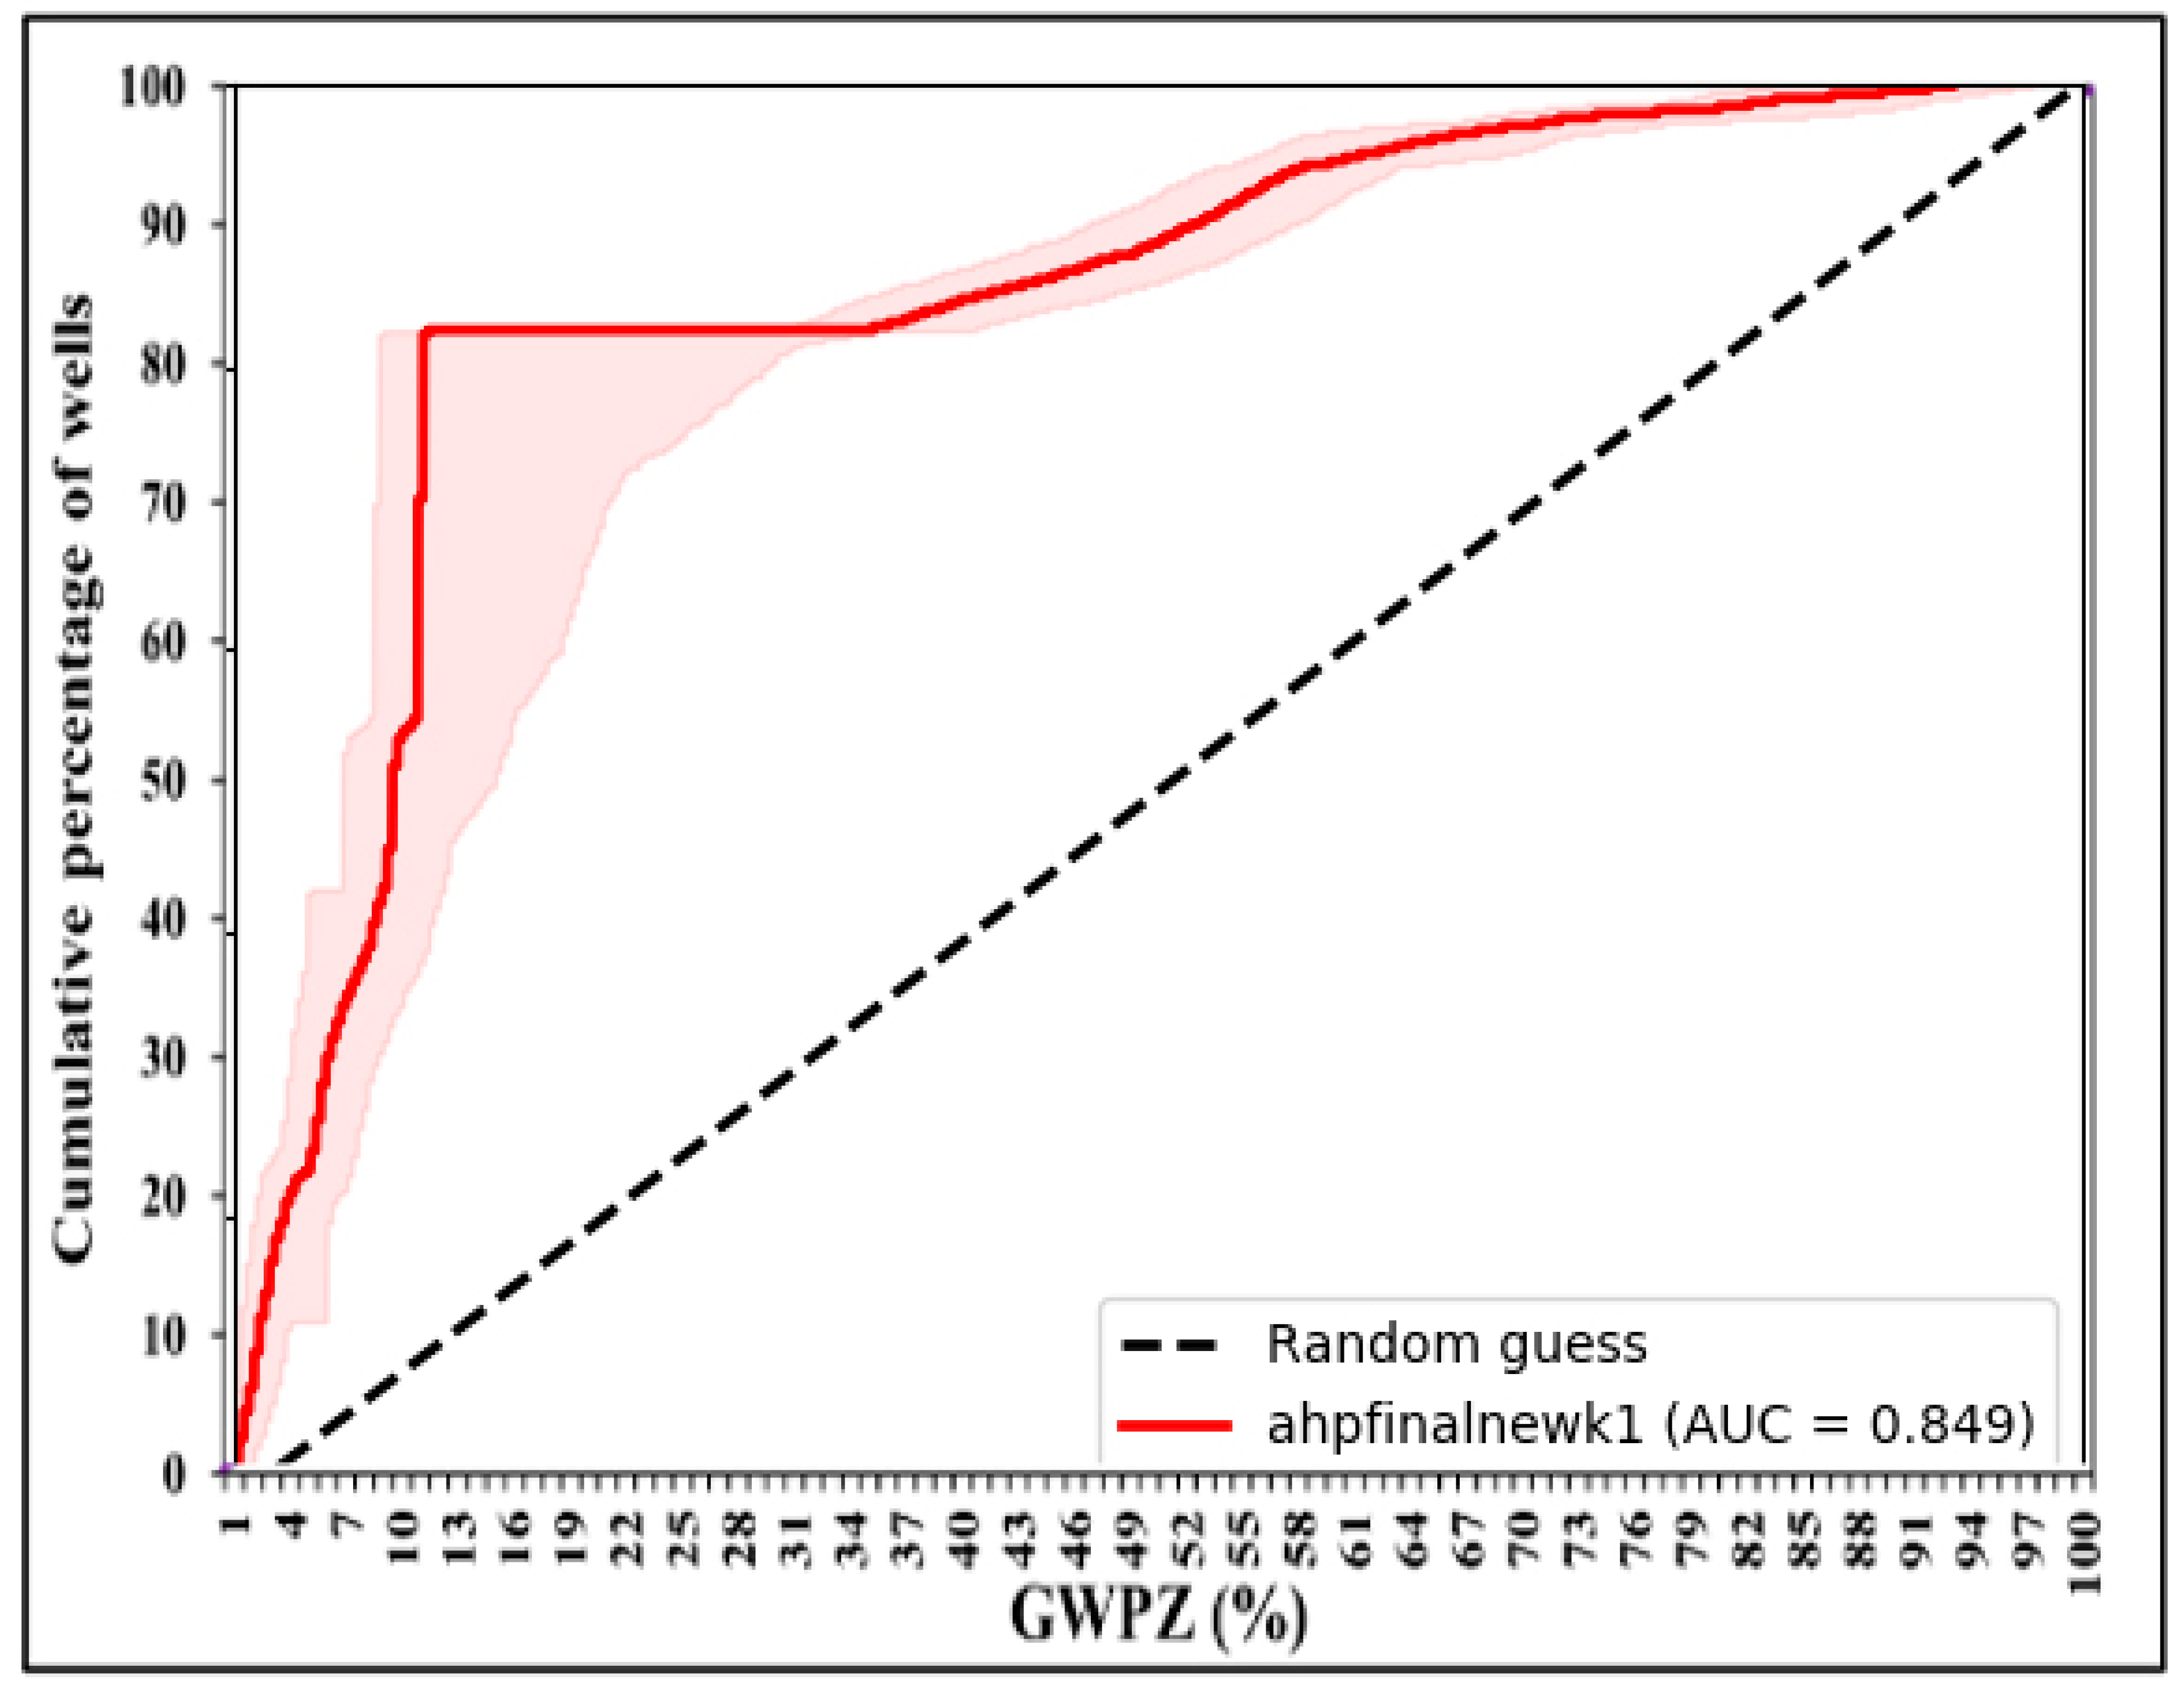
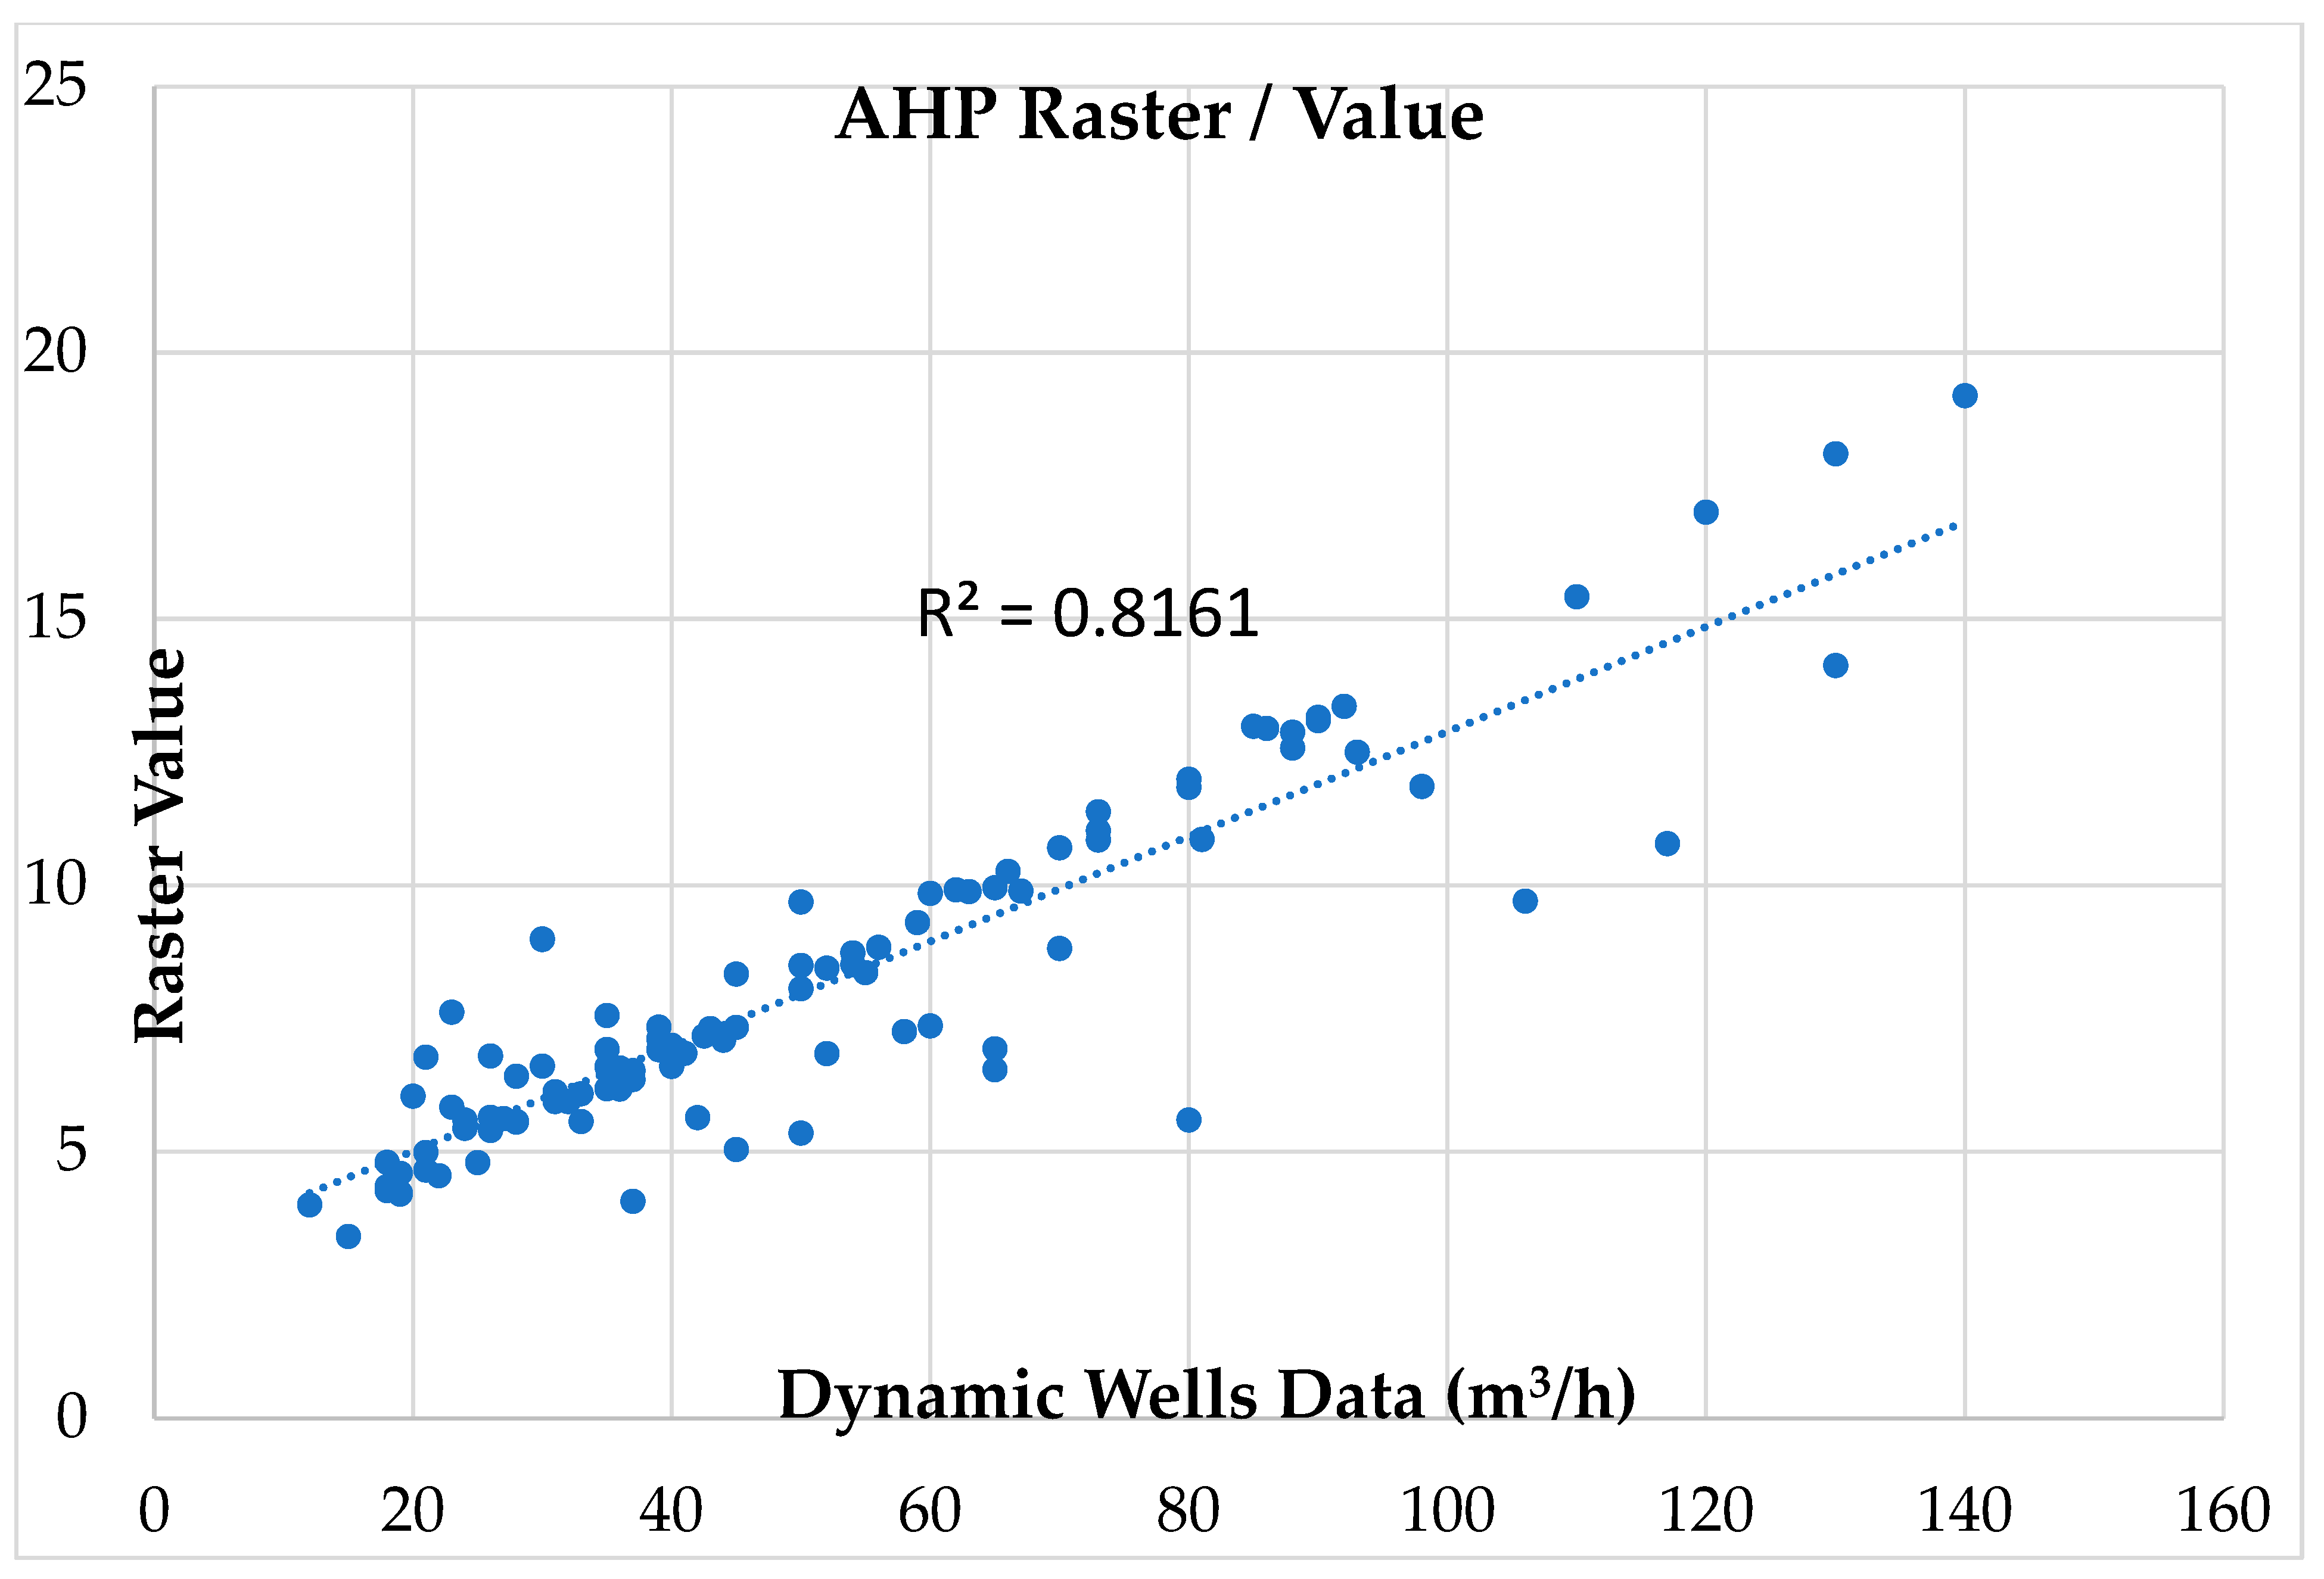
4. Accuracy Assessment
5. Results
5.1. Creation of the Matrices of the AHP
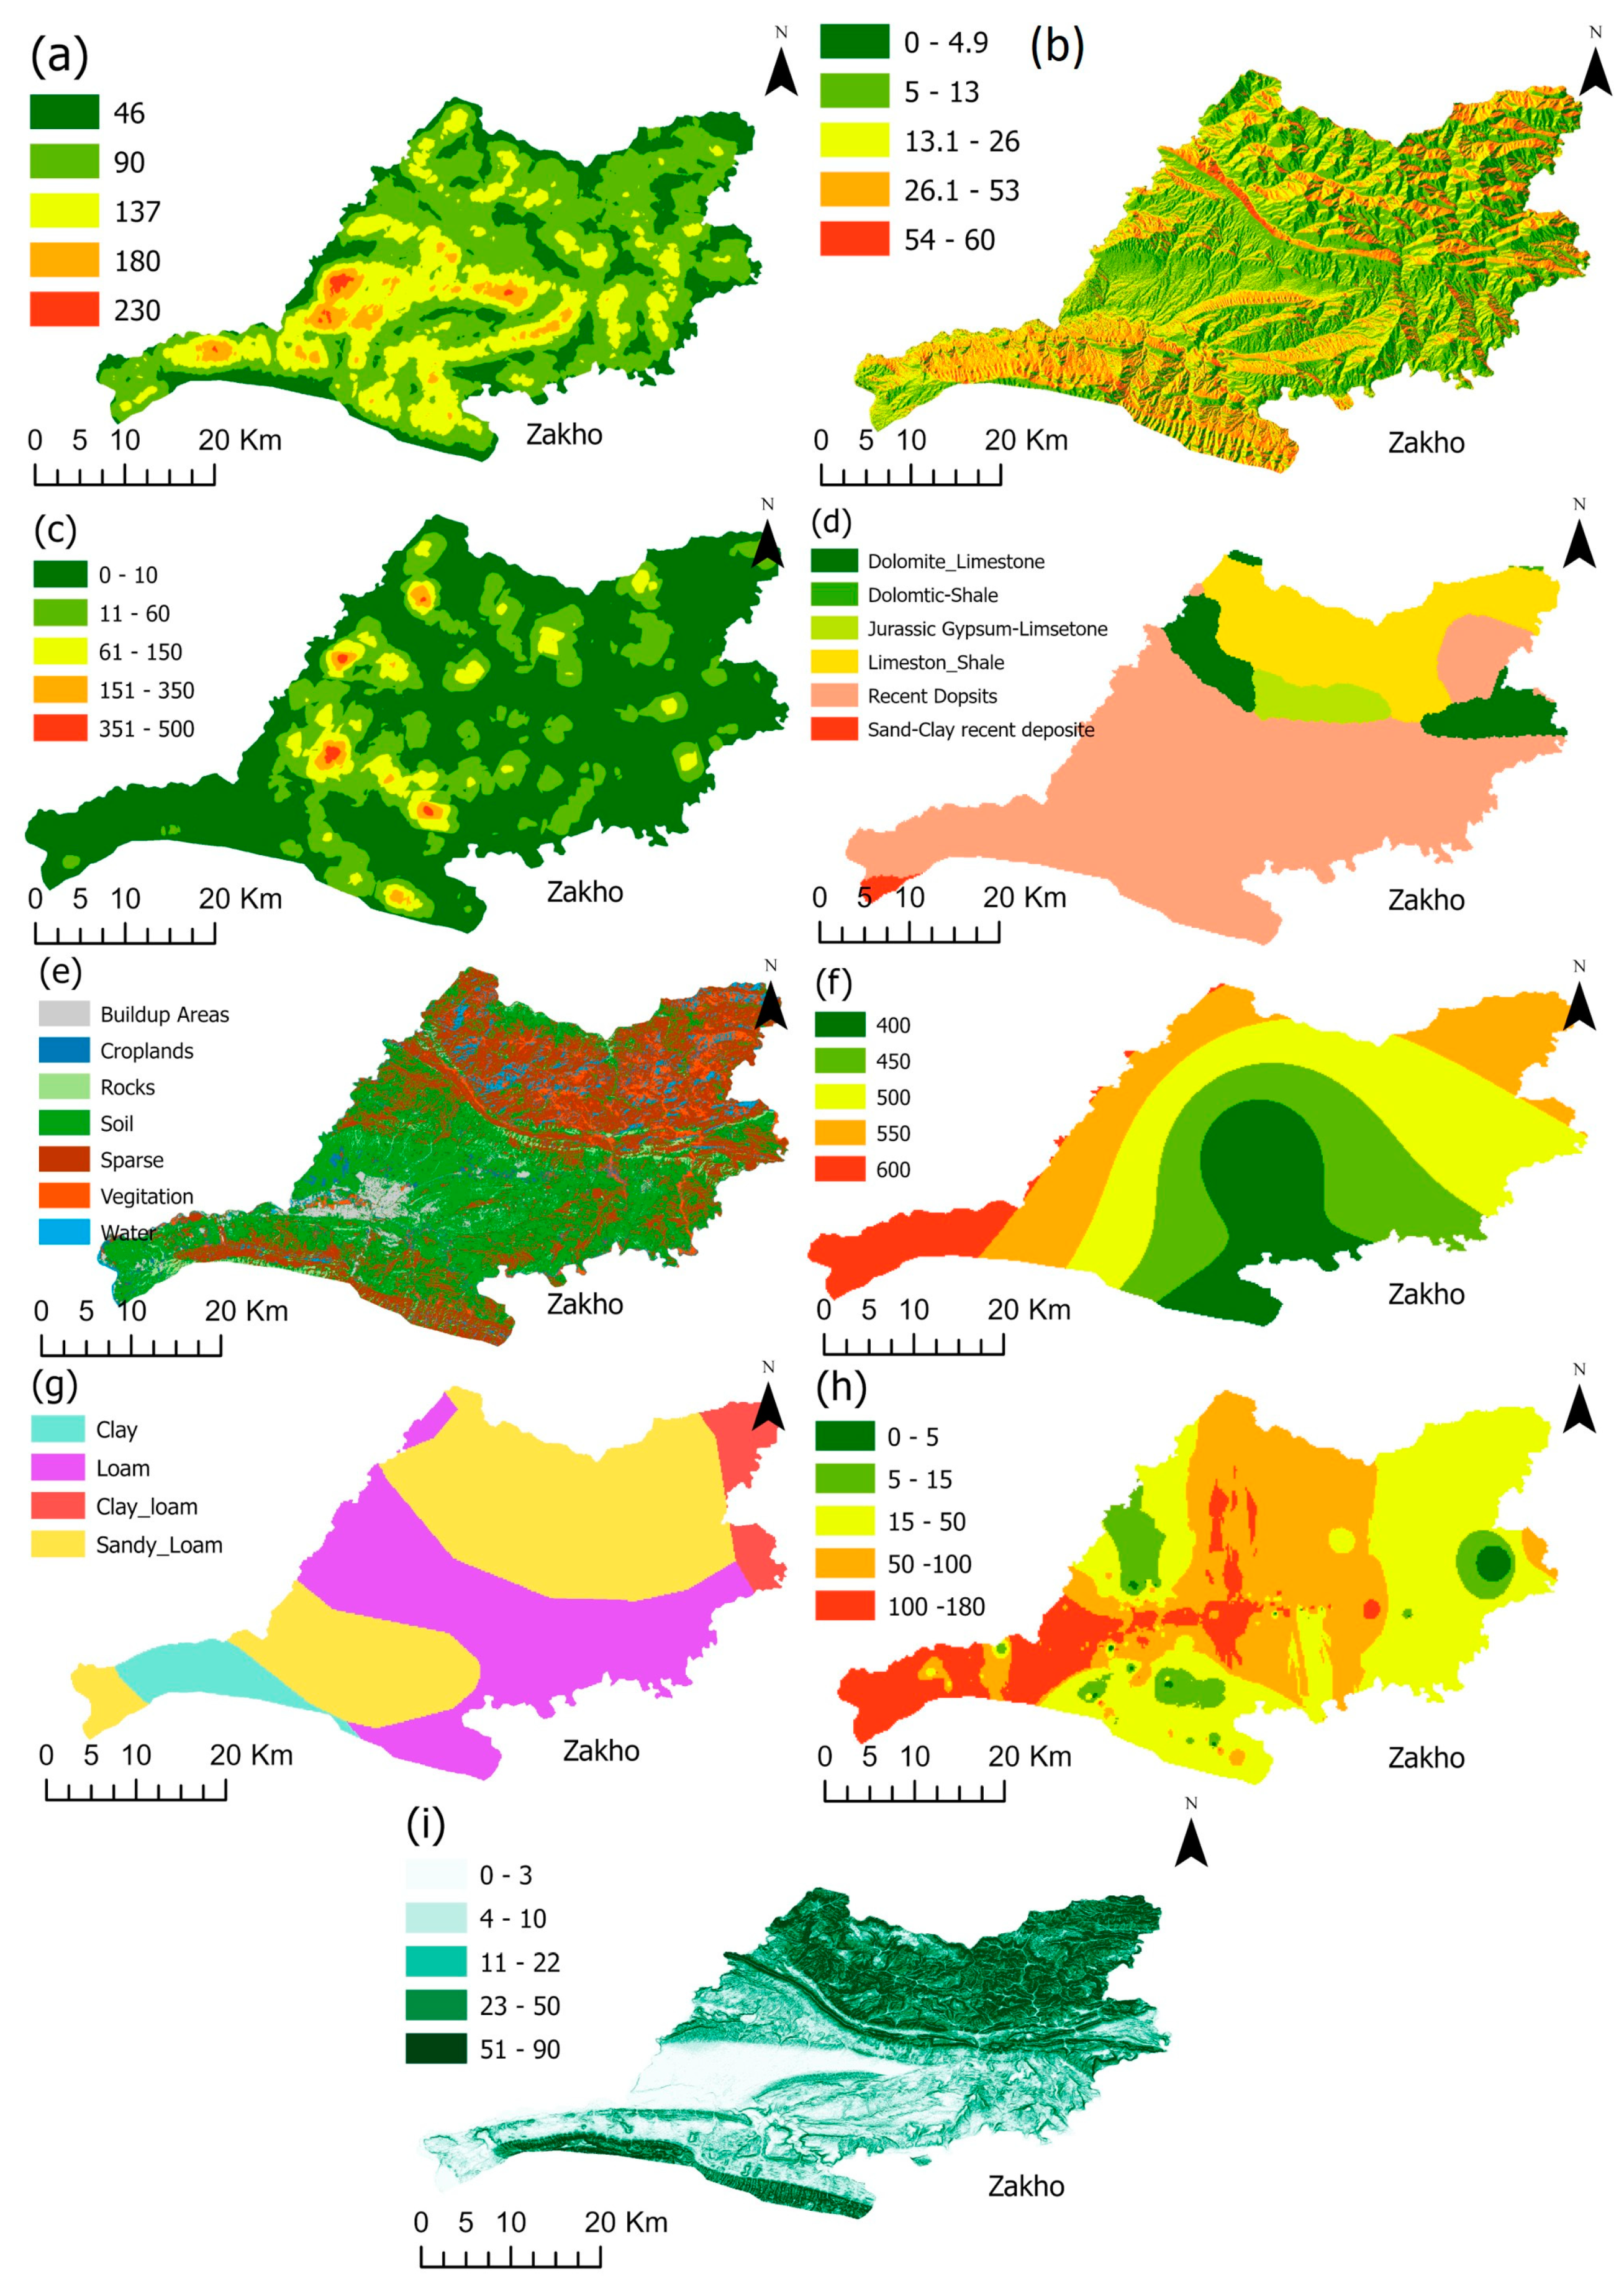
5.2. Factors Involved in the AHP
5.2.1. Drainage Density
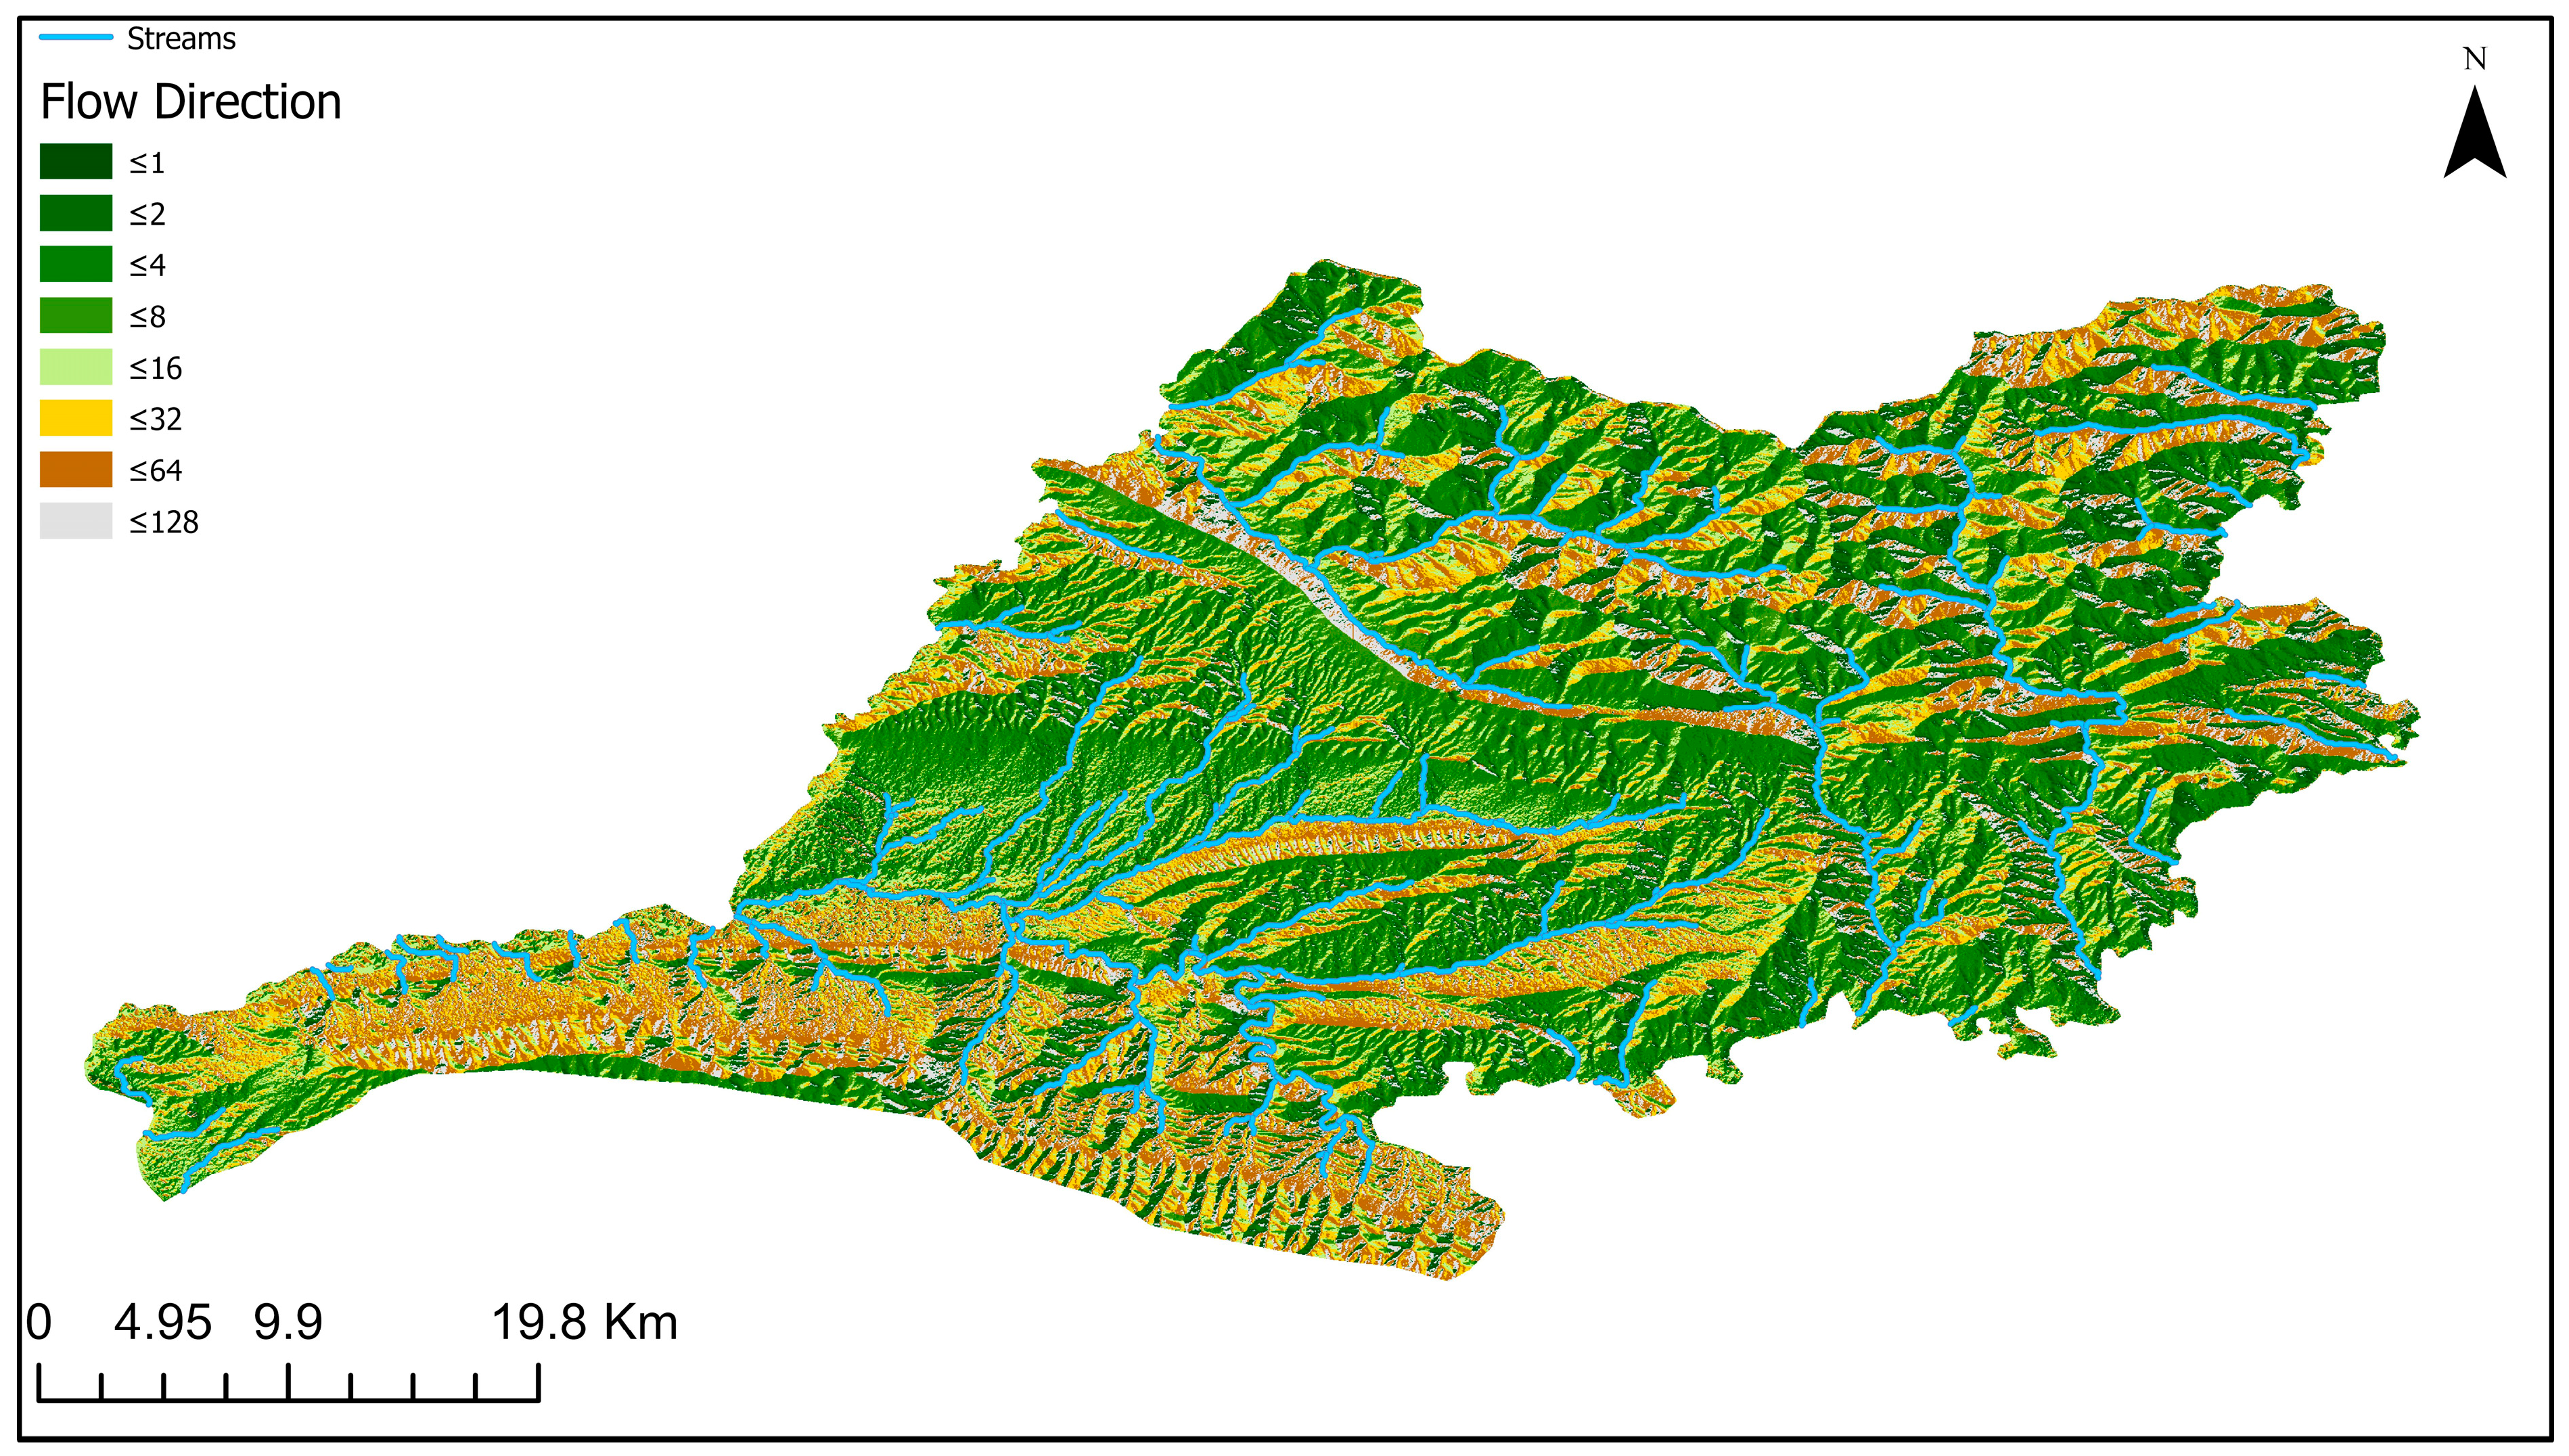
5.2.2. Flow Accumulation
5.2.3. Lineament Density
5.2.4. Geology
5.2.5. Land Use/Land Cover
5.2.6. Rainfall
5.2.7. Soil
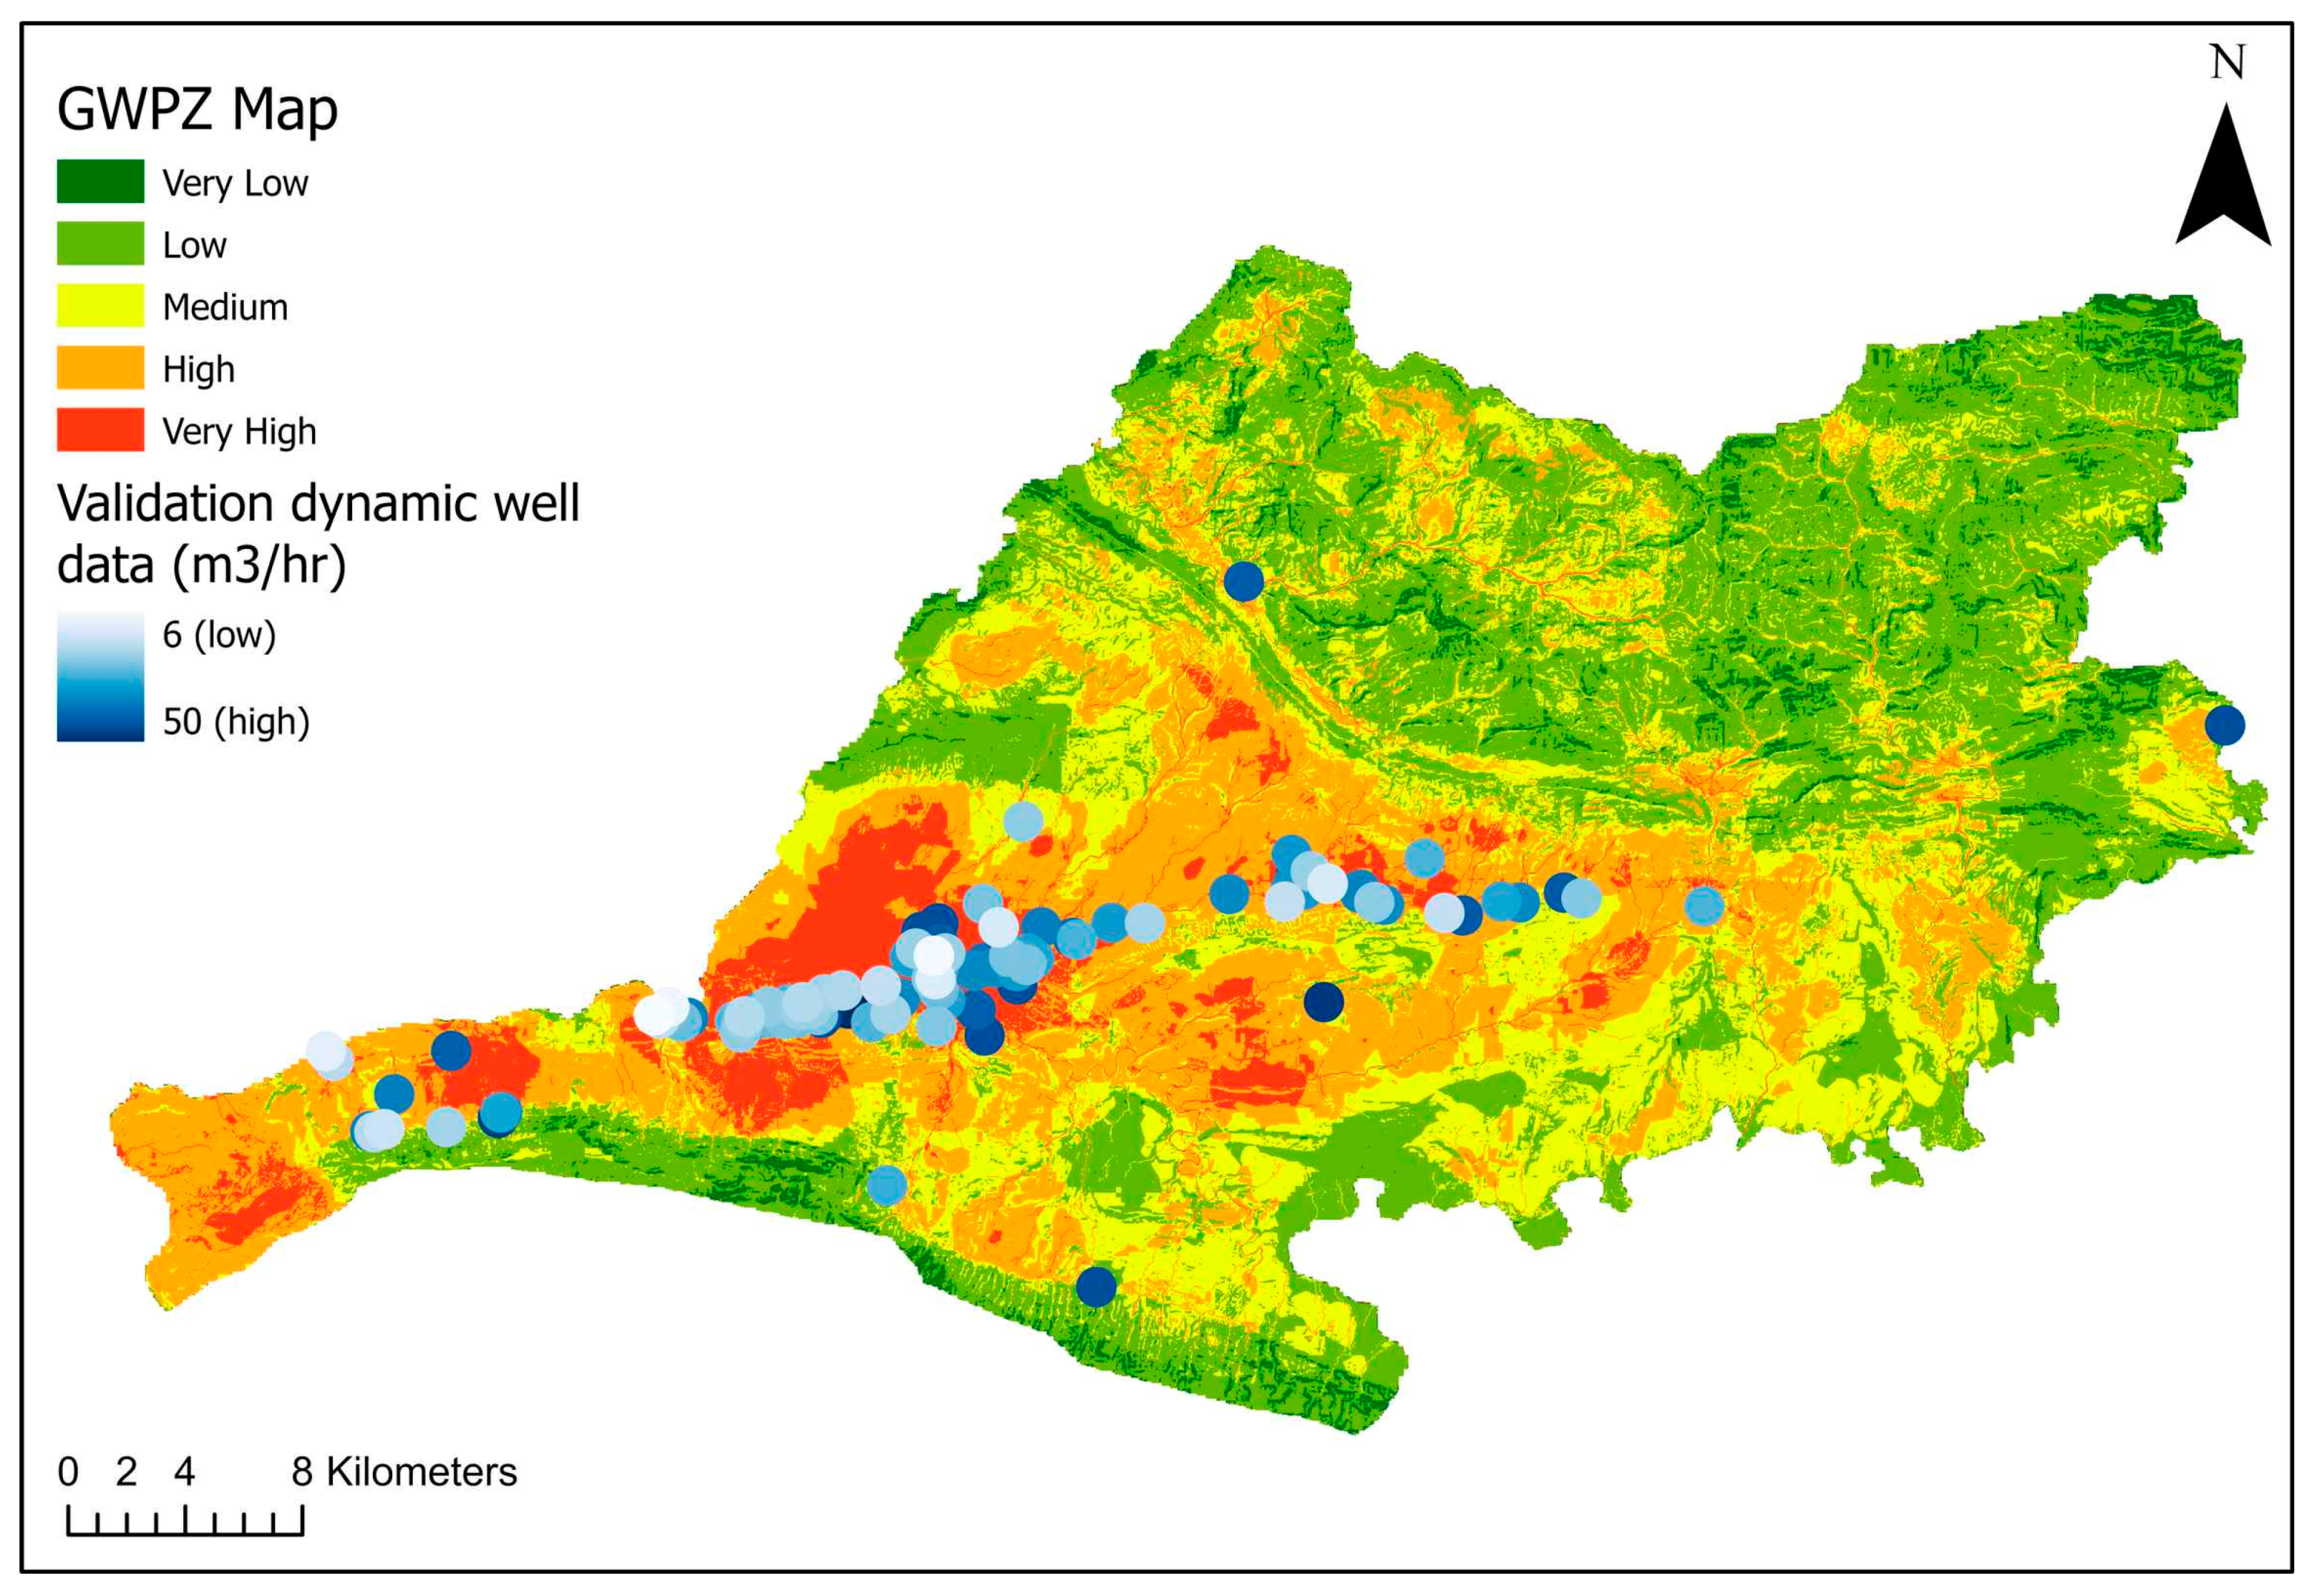
5.2.8. Dynamic Well Data
5.2.9. Slope
6. GWPI Map
Validation
7. Discussion
8. Conclusions
Author Contributions
Funding
Data Availability Statement
Conflicts of Interest
References
- Jenifer, M.A.; Jha, M.K. Comparison of Analytic Hierarchy Process, Catastrophe and Entropy techniques for evaluating groundwater prospect of hard-rock aquifer systems. J. Hydrol. 2017, 548, 605–624. [Google Scholar] [CrossRef]
- Janipella, R.; Quamar, R.; Sanam, R.; Jangam, C.; Pandurang; Balwant; Jyothi, V.; Padmakar, C.; Pujari, P.R. Evaluation of Groundwater Vulnerability to Pollution using GIS Based DRASTIC Method in Koradi, India—A Case Study. J. Geol. Soc. India 2020, 96, 292–297. [Google Scholar] [CrossRef]
- Okello, C.; Tomasello, B.; Greggio, N.; Wambiji, N.; Antonellini, M. Impact of Population Growth and Climate Change on the Freshwater Resources of Lamu Island, Kenya. Water 2015, 7, 1264–1290. [Google Scholar] [CrossRef]
- Alessa, L.; Kliskey, A.; Lammers, R.; Arp, C.; White, D.; Hinzman, L.; Busey, R. The Arctic Water Resource Vulnerability Index: An Integrated Assessment Tool for Community Resilience and Vulnerability with Respect to Freshwater. Environ. Manag. 2008, 42, 523–541. [Google Scholar] [CrossRef]
- De Stefano, L.; Lopez-Gunn, E. Unauthorized groundwater use: Institutional, social and ethical considerations. Water Policy 2012, 14, 147–160. [Google Scholar] [CrossRef]
- Mzuri, R.T.; Omar, A.A.; Mustafa, Y.T. Spatiotemporal Analysis of Land Surface Temperature and Vegetation Changes in Duhok District, Kurdistan Region, Iraq. Iraqi Geol. J. 2022, 55, 67–80. [Google Scholar] [CrossRef]
- Muniraj, K.; Jesudhas, C.J.; Chinnasamy, A. Delineating the Groundwater Potential Zone in Tirunelveli Taluk, South Tamil Nadu, India, Using Remote Sensing, Geographical Information System (GIS) and Analytic Hierarchy Process (AHP) Techniques. Proc. Natl. Acad. Sci. India Sect. A Phys. Sci. 2019, 90, 661–676. [Google Scholar] [CrossRef]
- Yadav, B.; Malav, L.C.; Jangir, A.; Kharia, S.K.; Singh, S.V.; Yeasin; Nogiya, M.; Meena, R.L.; Meena, R.S.; Tailor, B.L.; et al. Application of analytical hierarchical process, multi-influencing factor, and geospatial techniques for groundwater potential zonation in a semi-arid region of western India. J. Contam. Hydrol. 2023, 253, 104122. [Google Scholar] [CrossRef]
- Kubingwa, J.N.; Makoba, E.E.; Mussa, K.R. Integrated Geospatial and Geophysical Approaches for Mapping Groundwater Potential in the Semi-Arid Bukombe District, Tanzania. Earth 2023, 4, 241–265. [Google Scholar] [CrossRef]
- Thapa, R.; Gupta, S.; Gupta, A.; Reddy, D.V.; Kaur, H. Use of geospatial technology for delineating groundwater potential zones with an emphasis on water-table analysis in Dwarka River basin, Birbhum, India. Hydrogeol. J. 2017, 26, 899–922. [Google Scholar] [CrossRef]
- Lee, S.; Lee, C.-W. Application of Decision-Tree Model to Groundwater Productivity-Potential Mapping. Sustainability 2015, 7, 13416–13432. [Google Scholar] [CrossRef]
- Helena, B.; Pardo, R.; Vega, M.; Barrado, E.; Fernandez, J.M.; Fernandez, L. Temporal evolution of groundwater composition in an alluvial aquifer (Pisuerga River, Spain) by principal component analysis. Water Res. 2000, 34, 807–816. [Google Scholar] [CrossRef]
- Pourtaghi, Z.S.; Pourghasemi, H.R. GIS-based groundwater spring potential assessment and mapping in the Birjand Township, southern Khorasan Province, Iran. Hydrogeol. J. 2014, 22, 643–662. [Google Scholar] [CrossRef]
- Nazari, A.; Zaryab, A.; Ahmadi, A. Estimation of groundwater storage change in the Helmand River Basin (Afghanistan) using GRACE satellite data. Earth Sci. Inform. 2022, 16, 579–589. [Google Scholar] [CrossRef]
- Mkumbo, N.J.; Mussa, K.R.; Mariki, E.E.; Mjemah, I.C. The Use of the DRASTIC-LU/LC Model for Assessing Groundwater Vulnerability to Nitrate Contamination in Morogoro Municipality, Tanzania. Earth 2022, 3, 1161–1184. [Google Scholar] [CrossRef]
- Fatah, K.K.; Mustafa, Y.T.; Hassan, I.O. Flood Susceptibility Mapping Using an Analytic Hierarchy Process Model Based on Remote Sensing and GIS Approaches in Akre District, Kurdistan Region, Iraq. Iraqi Geol. J. 2022, 55, 121–149. [Google Scholar] [CrossRef]
- Saaty, T.L. Decision making with the analytic hierarchy process. Int. J. Serv. Sci. 2008, 1, 83–98. [Google Scholar] [CrossRef]
- Yin, H.; Shi, Y.; Niu, H.; Xie, D.; Wei, J.; Lefticariu, L.; Xu, S. A GIS-based model of potential groundwater yield zonation for a sandstone aquifer in the Juye Coalfield, Shangdong, China. J. Hydrol. 2017, 557, 434–447. [Google Scholar] [CrossRef]
- Gnanachandrasamy, G.; Zhou, Y.; Bagyaraj, M.; Venkatramanan, S.; Ramkumar, T.; Wang, S. Remote Sensing and GIS Based Groundwater Potential Zone Mapping in Ariyalur District, Tamil Nadu. J. Geol. Soc. India 2018, 92, 484–490. [Google Scholar] [CrossRef]
- Tang, Z.; Zhang, H.; Yi, S.; Xiao, Y. Assessment of flood susceptible areas using spatially explicit, probabilistic multi-criteria decision analysis. J. Hydrol. 2018, 558, 144–158. [Google Scholar] [CrossRef]
- Saidi, S.; Hosni, S.; Mannai, H.; Jelassi, F.; Bouri, S.; Anselme, B. GIS-based multi-criteria analysis and vulnerability method for the potential groundwater recharge delineation, case study of Manouba phreatic aquifer, NE Tunisia. Environ. Earth Sci. 2017, 76, 511. [Google Scholar] [CrossRef]
- Gdoura, K.; Anane, M.; Jellali, S. Geospatial and AHP-multicriteria analyses to locate and rank suitable sites for groundwater recharge with reclaimed water. Resour. Conserv. Recycl. 2015, 104, 19–30. [Google Scholar] [CrossRef]
- Murthy, K.S.R. Ground water potential in a semi-arid region of Andhra Pradesh—A geographical information system approach. Int. J. Remote Sens. 2000, 21, 1867–1884. [Google Scholar] [CrossRef]
- Machiwal, D.; Jha, M.K.; Mal, B.C. Assessment of Groundwater Potential in a Semi-Arid Region of India Using Remote Sensing, GIS and MCDM Techniques. Water Resour. Manag. 2010, 25, 1359–1386. [Google Scholar] [CrossRef]
- Madrucci, V.; Taioli, F.; de Araújo, C.C. Groundwater favorability map using GIS multicriteria data analysis on crystalline terrain, São Paulo State, Brazil. J. Hydrol. 2008, 357, 153–173. [Google Scholar] [CrossRef]
- Abdekareem, M.; Al-Arifi, N.; Abdalla, F.; Mansour, A.; El-Baz, F. Fusion of Remote Sensing Data Using GIS-Based AHP-Weighted Overlay Techniques for Groundwater Sustainability in Arid Regions. Sustainability 2022, 14, 7871. [Google Scholar] [CrossRef]
- Ahmed, K.; Shahid, S.; bin Harun, S.; Ismail, T.; Nawaz, N.; Shamsudin, S. Assessment of groundwater potential zones in an arid region based on catastrophe theory. Earth Sci. Inform. 2014, 8, 539–549. [Google Scholar] [CrossRef]
- Forootan, E.; Seyedi, F. GIS-based multi-criteria decision making and entropy approaches for groundwater potential zones delineation. Earth Sci. Inform. 2021, 14, 333–347. [Google Scholar] [CrossRef]
- Zhu, Q.; Abdelkareem, M. Mapping Groundwater Potential Zones Using a Knowledge-Driven Approach and GIS Analysis. Water 2021, 13, 579. [Google Scholar] [CrossRef]
- Jassim, S.Z.; Goff, J.C. Geology of Iraq; Dolin, Prague and Moravian Museum: Prague, Czech, 2006; Volume 1, p. 341. [Google Scholar]
- Directorate of Meteorolgy and Seismology of Duhok Province. Available online: http://msduhok.org/page/em-k%C3%AEne/2000-2021/ (accessed on 11 May 2022).
- Rikalovic, A.; Cosic, I.; Lazarevic, D. GIS Based Multi-criteria Analysis for Industrial Site Selection. Procedia Eng. 2014, 69, 1054–1063. [Google Scholar] [CrossRef]
- Chenini, I.; Mammou, A.B.; El May, M. Groundwater recharge zone mapping using GIS-based multi-criteria analysis: A case study in Central Tunisia (Maknassy Basin). Water Resour Manag. 2010, 24, 921–939. [Google Scholar] [CrossRef]
- USSGS. Geologic Map for Arabian Plate. Available online: https://certmapper.cr.usgs.gov/data/apps/world-maps/2000/ (accessed on 6 August 2021).
- FAO. World Soil Map. Available online: https://www.fao.org/soils-portal/data-hub/soil-maps-and-databases/faounesco-soil-map-of-the-world/en/2010/ (accessed on 23 October 2022).
- Arumugam, M.; Kulandaisamy, P.; Karthikeyan, S.; Thangaraj, K.; Senapathi, V.; Chung, S.Y.; Muthuramalingam, S.; Rajendran, M.; Sugumaran, S.; Manimuthu, S. An Assessment of Geospatial Analysis Combined with AHP Techniques to Identify Groundwater Potential Zones in the Pudukkottai District, Tamil Nadu, India. Water 2023, 15, 1101. [Google Scholar] [CrossRef]
- Rao, B.V.; Briz-Kishore, B. A methodology for locating potential aquifers in a typical semi-arid region in India using resistivity and hydrogeologic parameters. Geoexploration 1991, 27, 55–64. [Google Scholar]
- Shekhar, S.; Pandey, A.C. Delineation of groundwater potential zone in hard rock terrain of India using remote sensing, geographical information system (GIS) and analytic hierarchy process (AHP) techniques. Geocarto Int. 2014, 30, 402–421. [Google Scholar] [CrossRef]
- Ikirri, M.; Boutaleb, S.; Ibraheem, I.M.; Abioui, M.; Echogdali, F.Z.; Abdelrahman, K.; Id-Belqas, M.; Abu-Alam, T.; El Ayady, H.; Essoussi, S.; et al. Delineation of Groundwater Potential Area using an AHP, Remote Sensing, and GIS Techniques in the Ifni Basin, Western Anti-Atlas, Morocco. Water 2023, 15, 1436. [Google Scholar] [CrossRef]
- Abrar, H.; Kura, A.L.; Dube, E.E.; Beyene, D.L. AHP based analysis of groundwater potential in the western escarpment of the Ethiopian rift valley. Geol. Ecol. Landsc. 2021, 7, 175–188. [Google Scholar] [CrossRef]
- Luo, D.; Wen, X.; Zhang, H.; Xu, J.; Zhang, R. An improved FAHP based methodology for groundwater potential zones in Longchuan River basin, Yunnan Province, China. Earth Sci. Inform. 2020, 13, 847–857. [Google Scholar] [CrossRef]
- Alonso, J.A.; Lamata, M.T. Consistency in the analytic hierarchy process: A new approach. Int. J. Uncertain. Fuzziness Knowl. -Based Syst. 2006, 14, 445–459. [Google Scholar] [CrossRef]
- Saaty, T.L.; Vargas, L.G. Why is the Principal Eigenvector Necessary? In Models, Methods, Concepts & Applications of the Analytic Hierarchy Process; Springer: Berlin/Heidelberg, Germany, 2012; pp. 63–70. [Google Scholar]
- Chung, C.-J.F.; Fabbri, A.G. Validation of Spatial Prediction Models for Landslide Hazard Mapping. Nat. Hazards 2003, 30, 451–472. [Google Scholar] [CrossRef]
- Das, S. Comparison among influencing factor, frequency ratio, and analytical hierarchy process techniques for groundwater potential zonation in Vaitarna basin, Maharashtra, India. Groundw. Sustain. Dev. 2019, 8, 617–629. [Google Scholar] [CrossRef]
- Maity, B.; Mallick, S.K.; Das, P.; Rudra, S. Comparative analysis of groundwater potentiality zone using fuzzy AHP, frequency ratio and Bayesian weights of evidence methods. Appl. Water Sci. 2022, 12, 1–16. [Google Scholar] [CrossRef]
- Goodarzi, M.R.; Niknam, A.R.R.; Jamali, V.; Pourghasemi, H.R. Aquifer vulnerability identification using DRASTIC-LU model modification by fuzzy analytic hierarchy process. Model. Earth Syst. Environ. 2022, 8, 5365–5380. [Google Scholar] [CrossRef]
- Tucker, G.E.; Bras, R.L. Hillslope processes, drainage density, and landscape morphology. Water Resour. Res. 1998, 34, 2751–2764. [Google Scholar] [CrossRef]
- Freeman, T. Calculating catchment area with divergent flow based on a regular grid. Comput. Geosci. 1991, 17, 413–422. [Google Scholar] [CrossRef]
- Kumar, S.; Vivekanand; Narjary, B.; Kumar, N.; Kaur, S.; Yadav, R.K.; Kamra, S.K. A GIS-based Methodology for Assigning a Flux Boundary to a Numerical Groundwater Flow Model and Its Effect on Model Calibration. J. Geol. Soc. India 2020, 96, 507–512. [Google Scholar] [CrossRef]
- Souei, A.; Zouaghi, T.; Khemiri, S. Lineament characterization for groundwater targeting using satellite images and field data. Earth Sci. Inform. 2022, 16, 455–479. [Google Scholar] [CrossRef]
- Sun, C.; Chen, W.; Shen, Y. The seasonal and spatial distribution of hydrochemical characteristics of groundwater and its controlling factors in the eastern Loess Plateau. Earth Sci. Inform. 2021, 14, 2293–2308. [Google Scholar] [CrossRef]
- Al-Juboury, A.I.; McCann, T. The middle Miocene Fatha (lower Fars) Formation, Iraq. GeoArabia 2008, 13, 141–174. [Google Scholar] [CrossRef]
- Choudhury, U.; Singh, S.K.; Kumar, A.; Meraj, G.; Kumar, P.; Kanga, S. Assessing Land Use/Land Cover Changes and Urban Heat Island Intensification: A Case Study of Kamrup Metropolitan District, Northeast India (2000–2032). Earth 2023, 4, 503–521. [Google Scholar] [CrossRef]
- Beg, A.A.F.; Awadh, S.M.; Thamer, M.B.; Al-Sulttani, A.H. Assessment of Groundwater Quality for Drinking Purposes Using Water Quality Index, and Identifying the Affecting Mechanism in Rashdiya, Central Iraq. Iraqi Geol. J. 2021, 54, 20–32. [Google Scholar] [CrossRef]
- Matenge, R.G.; Parida, B.P.; Letshwenyo, M.W.; Ditalelo, G. Impact of Climate Variability on Rainfall Characteristics in the Semi-Arid Shashe Catchment (Botswana) from 1981–2050. Earth 2023, 4, 398–441. [Google Scholar] [CrossRef]
- Anbarasu, S.; Brindha, K.; Elango, L. Multi-influencing factor method for delineation of groundwater potential zones using remote sensing and GIS techniques in the western part of Perambalur district, southern India. Earth Sci. Inform. 2019, 13, 317–332. [Google Scholar] [CrossRef]
- Liu, Y.; Guo, Y.; Long, L.; Lei, S. Soil Water Behavior of Sandy Soils under Semiarid Conditions in the Shendong Mining Area (China). Water 2022, 14, 2159. [Google Scholar] [CrossRef]
- Ziary, Y.; Safari, H.; Islamic Republic of Iran. To Compare Two Interpolation Methods: IDW, KRIGING for Providing Properties (Area) Surface Interpolation Map Land Price. District 5, Municipality of Tehran area 1. In Proceedings of the FIG Working Week, Hong Kong, 13 May 2007. [Google Scholar]
- Batelaan, O.; De Smedt, F. WetSpass: A flexible, GIS based, distributed recharge methodology for regional groundwater. In Impact of Human Activity on Groundwater Dynamics, Proceedings of the An International Symposium (Symposium S3) Held During the Sixth Scientific Assembly of the International Association of Hydrological Sciences (IAHS), Maastricht, The Netherlands, 18–27 July 2001; International Assn of Hydrological Sciences: Maastricht, The Netherlands, 2001; p. 11. [Google Scholar]
- Rather, A.F.; Ahmed, R.; Wani, G.F.; Ahmad, S.T.; Dar, T.; Javaid, S.; Ahmed, P. Mapping of groundwater potential zones in Pohru Watershed of Jhelum Basin-Western Himalaya, India using integrated approach of remote sensing, GIS and AHP. Earth Sci. Inform. 2022, 15, 2091–2107. [Google Scholar] [CrossRef]
- Das, S.; Mukherjee, J.; Bhattacharyya, S.; Patel, P.P.; Banerjee, A. Detection of groundwater potential zones using analytical hierarchical process (AHP) for a tropical river basin in the Western Ghats of India. Environ. Earth Sci. 2022, 81, 416. [Google Scholar] [CrossRef]
- Ghosh, B. Spatial mapping of groundwater potential using data-driven evidential belief function, knowledge-based analytic hierarchy process and an ensemble approach. Environ. Earth Sci. 2021, 80, 625. [Google Scholar] [CrossRef]
- Turkish-Meteorological-Data. Available online: https://mgm.gov.tr/eng/yearly-climate.aspx1990-2021 (accessed on 23 October 2022).


| Data Layer | Source | Resolution/Scale | Date Acquired | Description |
|---|---|---|---|---|
| Rainfall Data (RF) | Kurdistan National Weather Service | 30 m | 2000–2020 | Historical weather data including temperature, precipitation, and climate factors. |
| Soil Type (SL) | FAO—Soil Survey Database | 30 m | March 2021 | Classification of soil types based on texture, moisture content, and permeability. |
| Land Use/Land Cover (LUC) | Satellite Imagery/Site Survey | 30 m | October 2021 | Categorization of land use and land cover, including urban, agricultural, and forested areas. |
| Geology (G) | World Geologic Map/Iraq Geology Survey Association | 1:50,000 scale | June 2022 | Topographic analysis of the study area, identifying landforms and their characteristics. |
| Accumulation Flow (AccFl) | Hydrological Datasets | 30 m | July 2021 | Runoff surface water accumulation in the region. |
| Slope (S) | Satellite Imagery/Digital Elevation Module | 30 m | July 2021 | The slope feature of the Zakho area shows steep areas to gentle areas. |
| Drainage Density (DD) | Hydrological Datasets | 30 m | August 2020 | Measurement of stream density, indicating the presence of surface water in the region. |
| Lineament Density (LD) | Remote Sensing Imagery | 30 m | November 2021 | Identification of linear features such as faults and fractures that influence groundwater flow. |
| Dynamic Well Data (WD) | Groundwater Directorate of Zakho | Point data | July 2021 | The recorded dynamic of groundwater in various locations. |
| FACTOR | S | ACCFL | DD | WD | LD | LUC | SL | G | RF |
|---|---|---|---|---|---|---|---|---|---|
| S | 1 | 1 | 1 | 1 | 2 | 2 | 2 | 3 | 3 |
| ACCFL | 0.5 | 1 | 1 | 1 | 1 | 2 | 3 | 3 | 3 |
| DD | 0.5 | 1 | 1 | 2 | 3 | 2 | 2 | 3 | 3 |
| WD | 0.5 | 1 | 0.5 | 1 | 3 | 3 | 3 | 3 | 4 |
| LD | 0.5 | 0.5 | 0.333 | 0.333 | 1 | 3 | 3 | 4 | 4 |
| LUC | 0.5 | 0.5 | 0.5 | 0.333 | 0.333 | 1 | 4 | 4 | 4 |
| SL | 0.33 | 0.33 | 0.5 | 0.333 | 0.333 | 0.5 | 1 | 4 | 5 |
| G | 0.33 | 0.333 | 0.33 | 0.333 | 0.333 | 0.25 | 0.25 | 1 | 5 |
| RF | 0.33 | 0.33 | 0.33 | 0.25 | 0.25 | 0.25 | 0.25 | 0.2 | 1 |
| Size of Matrix (n) | Random Consistency Index (RI) |
|---|---|
| 1 | 0 |
| 2 | 0 |
| 3 | 0.52 |
| 4 | 0.89 |
| 5 | 1.11 |
| 6 | 1.25 |
| 7 | 1.35 |
| 8 | 1.4 |
| 9 | 1.45 |
| 10 | 1.49 |
| Factors | Weight | Classification | Overall | Standardization |
|---|---|---|---|---|
| Slope | ||||
| Very Low | 23.042 | 5 | 115.21 | 100 |
| Low | 4 | 92.168 | 75 | |
| Moderate | 3 | 69.126 | 50 | |
| High | 2 | 46.084 | 25 | |
| Very High | 1 | 23.042 | 0 | |
| Accumulation Flow | ||||
| Very High | 19.702 | 5 | 98.51 | 100 |
| High | 4 | 78.808 | 75 | |
| Moderate | 3 | 59.106 | 50 | |
| Low | 2 | 39.404 | 25 | |
| Very Low | 1 | 19.702 | 0 | |
| Drainage Density | ||||
| Very High | 16.537 | 5 | 82.685 | 100 |
| High | 4 | 66.148 | 75 | |
| Moderate | 3 | 49.611 | 50 | |
| Low | 2 | 33.074 | 25 | |
| Very Low | 1 | 16.537 | 0 | |
| Well Data | ||||
| Very High | 12.659 | 5 | 63.295 | 100 |
| High | 4 | 50.636 | 75 | |
| Moderate | 3 | 37.977 | 50 | |
| Low | 2 | 25.318 | 25 | |
| Very Low | 1 | 12.659 | 0 | |
| Lineament Density | ||||
| Very High | 8.64 | 5 | 43.2 | 100 |
| High | 4 | 34.56 | 75 | |
| Moderate | 3 | 25.92 | 50 | |
| Low | 2 | 17.28 | 25 | |
| Very Low | 2 | 17.28 | 25 | |
| Land Use/Land Cover | ||||
| Water | 6.691 | 5 | 33.455 | 100 |
| Vegitation | 4 | 26.764 | 75 | |
| Soil | 5 | 33.455 | 100 | |
| Sparse | 3 | 20.073 | 50 | |
| Rocks | 2 | 13.382 | 25 | |
| Built-Up Area | 1 | 6.691 | 0 | |
| Croplands | 4 | 26.764 | 75 | |
| Soil | ||||
| Sandy Loam | 5.517 | 5 | 27.585 | 100 |
| Loam | 4 | 22.068 | 100 | |
| Caly Loam | 3 | 16.551 | 75 | |
| Clay | 2 | 11.034 | 50 | |
| Geology | ||||
| Recent Deposit | 3.999 | 5 | 19.995 | 100 |
| Dolomitic Limestone | 2 | 7.998 | 25 | |
| Jurassic Gypsum | 3 | 11.997 | 50 | |
| Dolomitic Shale | 2 | 7.998 | 25 | |
| Sand Clay Recent | 4 | 15.996 | 75 | |
| Limestone Shale | 2 | 7.998 | 25 | |
| Rainfall | ||||
| Very High | 3.213 | 5 | 16.065 | 100 |
| High | 4 | 12.852 | 75 | |
| Moderate | 3 | 9.639 | 50 | |
| Low | 2 | 6.426 | 25 | |
| Very Low | 1 | 3.213 | 0 | |
| S | ACCFL | DD | WD | LD | LUC | SL | G | RF | |
|---|---|---|---|---|---|---|---|---|---|
| S | 0.1333 | 0.2 | 0.167 | 0.22 | 0.2 | 0.1 | 0.08 | 0.06 | 0.05 |
| ACCFL | 0.0667 | 0.12 | 0.167 | 0.12 | 0.2 | 0.1 | 0.08 | 0.06 | 0.05 |
| DD | 0.0667 | 0.05 | 0.085 | 0.12 | 0.1 | 0.1 | 0.08 | 0.06 | 0.05 |
| WD | 0.0667 | 0.12 | 0.005 | 0.12 | 0.1 | 0.19 | 0.16 | 0.15 | 0.14 |
| LD | 0.0667 | 0.053 | 0.085 | 0.12 | 0.1 | 0.19 | 0.16 | 0.15 | 0.14 |
| LUC | 0.1333 | 0.12 | 0.085 | 0.06 | 0.051 | 0.1 | 0.16 | 0.167 | 0.16 |
| SL | 0.1333 | 0.1 | 0.085 | 0.06 | 0.05 | 0.05 | 0.08 | 0.167 | 0.16 |
| G | 0.1333 | 0.1 | 0.085 | 0.06 | 0.05 | 0.04 | 0.08 | 0.06 | 0.16 |
| RF | 0.1333 | 0.11 | 0.085 | 0.06 | 0.05 | 0.04 | 0.037 | 0.027 | 0.05 |
| TOTAL | 0.9333 | 0.973 | 0.929 | 0.94 | 0.901 | 0.91 | 0.917 | 0.901 | 0.96 |
Disclaimer/Publisher’s Note: The statements, opinions and data contained in all publications are solely those of the individual author(s) and contributor(s) and not of MDPI and/or the editor(s). MDPI and/or the editor(s) disclaim responsibility for any injury to people or property resulting from any ideas, methods, instructions or products referred to in the content. |
© 2023 by the authors. Licensee MDPI, Basel, Switzerland. This article is an open access article distributed under the terms and conditions of the Creative Commons Attribution (CC BY) license (https://creativecommons.org/licenses/by/4.0/).
Share and Cite
Sulaiman, W.H.; Mustafa, Y.T. Geospatial Multi-Criteria Evaluation Using AHP–GIS to Delineate Groundwater Potential Zones in Zakho Basin, Kurdistan Region, Iraq. Earth 2023, 4, 655-675. https://doi.org/10.3390/earth4030034
Sulaiman WH, Mustafa YT. Geospatial Multi-Criteria Evaluation Using AHP–GIS to Delineate Groundwater Potential Zones in Zakho Basin, Kurdistan Region, Iraq. Earth. 2023; 4(3):655-675. https://doi.org/10.3390/earth4030034
Chicago/Turabian StyleSulaiman, Wassfi H., and Yaseen T. Mustafa. 2023. "Geospatial Multi-Criteria Evaluation Using AHP–GIS to Delineate Groundwater Potential Zones in Zakho Basin, Kurdistan Region, Iraq" Earth 4, no. 3: 655-675. https://doi.org/10.3390/earth4030034
APA StyleSulaiman, W. H., & Mustafa, Y. T. (2023). Geospatial Multi-Criteria Evaluation Using AHP–GIS to Delineate Groundwater Potential Zones in Zakho Basin, Kurdistan Region, Iraq. Earth, 4(3), 655-675. https://doi.org/10.3390/earth4030034