Article

Geospatial Multi-Criteria Evaluation Using AHP–GIS to Delineate Groundwater Potential Zones in Zakho Basin, Kurdistan Region, Iraq

by
Wassfi H. Sulaiman
* and
Yaseen T. Mustafa
Environmental Science Department, Faculty of Science, University of Zakho, Zakho 42002, Kurdistan Region, Iraq
*
Author to whom correspondence should be addressed.
Earth 2023, 4(3), 655-675; https://doi.org/10.3390/earth4030034
Submission received: 24 July 2023 / Revised: 24 August 2023 / Accepted: 26 August 2023 / Published: 1 September 2023

Abstract

:
Groundwater availability in the Zakho Basin faces significant challenges due to political issues, border stream control, climate change, urbanization, land use changes, and poor administration, leading to declining groundwater quantity and quality. To address these issues, this study utilized the Analytic Hierarchy Process (AHP) and geospatial techniques to identify potential groundwater sites in Zakho. The study assigned weights normalized through the AHP eigenvector and created a final index using the weighted overlay method and specific criteria such as slope, flow accumulation, drainage density, lineament density, geology, well data, rainfall, and soil type. Validation through the receiver operating characteristic (ROC) curve (AUC = 0.849) and coefficient of determination (R2 = 0.81) demonstrated the model’s accuracy. The results showed that 17% of the area had the highest potential as a reliable groundwater source, 46% represented high-to-moderate potential zones, and 37% had low potential. Flat areas between rivers and high mountains displayed the greatest potential for groundwater development. Identifying these potential sites can aid farmers, regional planners, and local governments in making precise decisions about installing hand pumps and tube wells for a regular water supply. Additionally, the findings contribute to the development of a sustainable groundwater management plan, focusing on improving water usage and protecting water-related ecosystems in the region. Identification of the optimum influencing factors, arrangement of the factors in a hierarchy, and creation of a GWPI map will allow further planning for groundwater preservation and sustainability. This project can be conducted in other areas facing droughts.

1. Introduction

Groundwater is a valuable natural resource. Groundwater Potential Index (GWPI) can be described as regions that are likely to contain a useful quantity of groundwater [1]. Preserving, sustaining, and developing this resource have become essential for researchers, planners, and decision makers and in protecting it from pollution [2]. The lack of surface freshwater due to climate change and global warming has led to an intense focus on groundwater and groundwater studies to delineate the potential zones of available groundwater in a certain area. The need for groundwater is increasing with the rapid human population growth [3]. The risks of droughts and surface water pollution have also increased the interest in groundwater as an important water resource. In addition to the use of groundwater in agriculture and industry, it is also used for a variety of other purposes [4]. Unplanned and high uses of groundwater can lead to serious damage to the environment and economy of a region, which affects arid-to-semiarid regions [5]. Furthermore, increases in temperature have been directly observed in the last few years [6]. By combining remote sensing (RS) data and GIS spatial analysis, along with the Analytic Hierarchy Process (AHP) methodology for multi-criteria decision making, in this research, we seek to establish a comprehensive framework for identifying and mapping zones with varying levels of groundwater potential [7].
The integration of the Analytic Hierarchy Process (AHP) and geospatial methodologies offered a robust framework for evaluating and spatially delineating the potential groundwater resources in a semiarid region located in western India. This amalgamated strategy facilitates a more precise and comprehensive understanding of the determinants that influence the presence of and fluctuations in groundwater. Consequently, this approach aids in formulating efficient water resource management strategies within the study area, as highlighted in work by Yadav et al. [8].
Political conflict between countries is an additional consideration that elevates the significance of and interest in groundwater research. Turkey is constructing numerous dams to control the streams entering Iraq. Figure 1a,b show that new dams have been built on the borders to control the main rivers which cross the borders into Zakho and then flow into Iraq. One of the dams was built on Hezil Stream, which is only 500 m from the border. In the future, fresh water may be employed as a means of exerting pressure as its significance continues to rise.
In the last few decades, various methods have been used to determine GWPIs. Some are traditional, relying on physical studies and visits to the region, for example, two-dimensional (2D) geophysical surveys [9], which necessitate intensive fieldwork, while others are more advanced and have attempted to incorporate recent technologies. Most of these techniques are based on multi-parameter statistical methods [10], including the decision tree model [11], principal component analysis (PCA) [12], the logistic regression model [13], Gravity Recovery and Climate Experiment (GRACE) [14], and another model called DRASTIC-LU/LC [15], which means “Depth to water, net Recharge, Aquifer media, Soil media, Topography, Impact of vadose zone, and hydraulic Conductivity”. The integration of a Geographic Information System (GIS) and RS techniques with an Analytical Hierarchy Analysis (AHP) has produced an innovative model technique that is easy to use and produces precise results [16].
The AHP is a statistical method introduced by Saaty [17] in the early 1980s. With GIS-based multi-criteria decision making (MCDM) tools, it is conceivable and recommended that hydrological and hydrogeological characteristics that affect groundwater formation are identified to develop prospective groundwater maps [18,19]. The study of hydrology and water resources has made substantial use of GIS-based multi-criteria decision analysis (MCDA) [20], as this technique has been widely used over the past ten years [1].
In geospatial studies, AHP–MCDM techniques based on RS and GIS have been widely used to delineate GWPIs with good results. During these studies, it was discovered that different factors influence groundwater availability, such as the LUC, drainage density (DD), slope (SL), lithology (L), geomorphology (GM), geology (G), lineament density (LD), water table depth (WTD), and surface water body (SW). The Groundwater Potential Index (GWPI) is determined by the overlay and weighting of these factors [21]. These factors (geo-factors) have been used in recent groundwater research studies; nevertheless, they can be changed (added or ignored) depending on the study area’s characteristics [22]. The process of adding factors to the AHP workflow was gradual. Murthy [23] incorporated the radio frequency (RF) into a GWPI map in the semiarid area of the Pradesh region. The LD was used in 2016 by Ibrahim-Bathis and Ahmed [24]. Before 2004, numerous researchers utilized geology factors in the AHP [25]. Scientists and environmentalists have conducted comparable studies utilizing GIS-based AHP and MCDM methodologies to investigate, identify, manage, and sustain groundwater resources [26]. This was done in response to the need to locate alternative water supplies and combat fresh surface water shortages. Most previous studies based on GIS/RS approaches used between four and eight influencing factors [27,28,29]. In the present research, the RS/GIS-based Analytical Hierarchy Process (AHP) methodology was applied to produce a Groundwater Potential Index (GWPI) map specific to the Zakho region. This was achieved by considering nine distinct geo-factors, namely, slope (SL), drainage density (DD), land density (LD), geology (G), land use/land cover (LUC), soil map information, rainfall data, accumulated flow (AccFl), and well data. ArcGIS Pro was used to extract the weights and maps for each parameter and obtain the final overlaid weight maps to produce a GWPI map of the Zakho region basin, which is the index map of the existence of groundwater potential zones. The resulting map will be an accurate source for decision-making processes either for authorities or for the sustainable management of aquifers.

2. Study Area

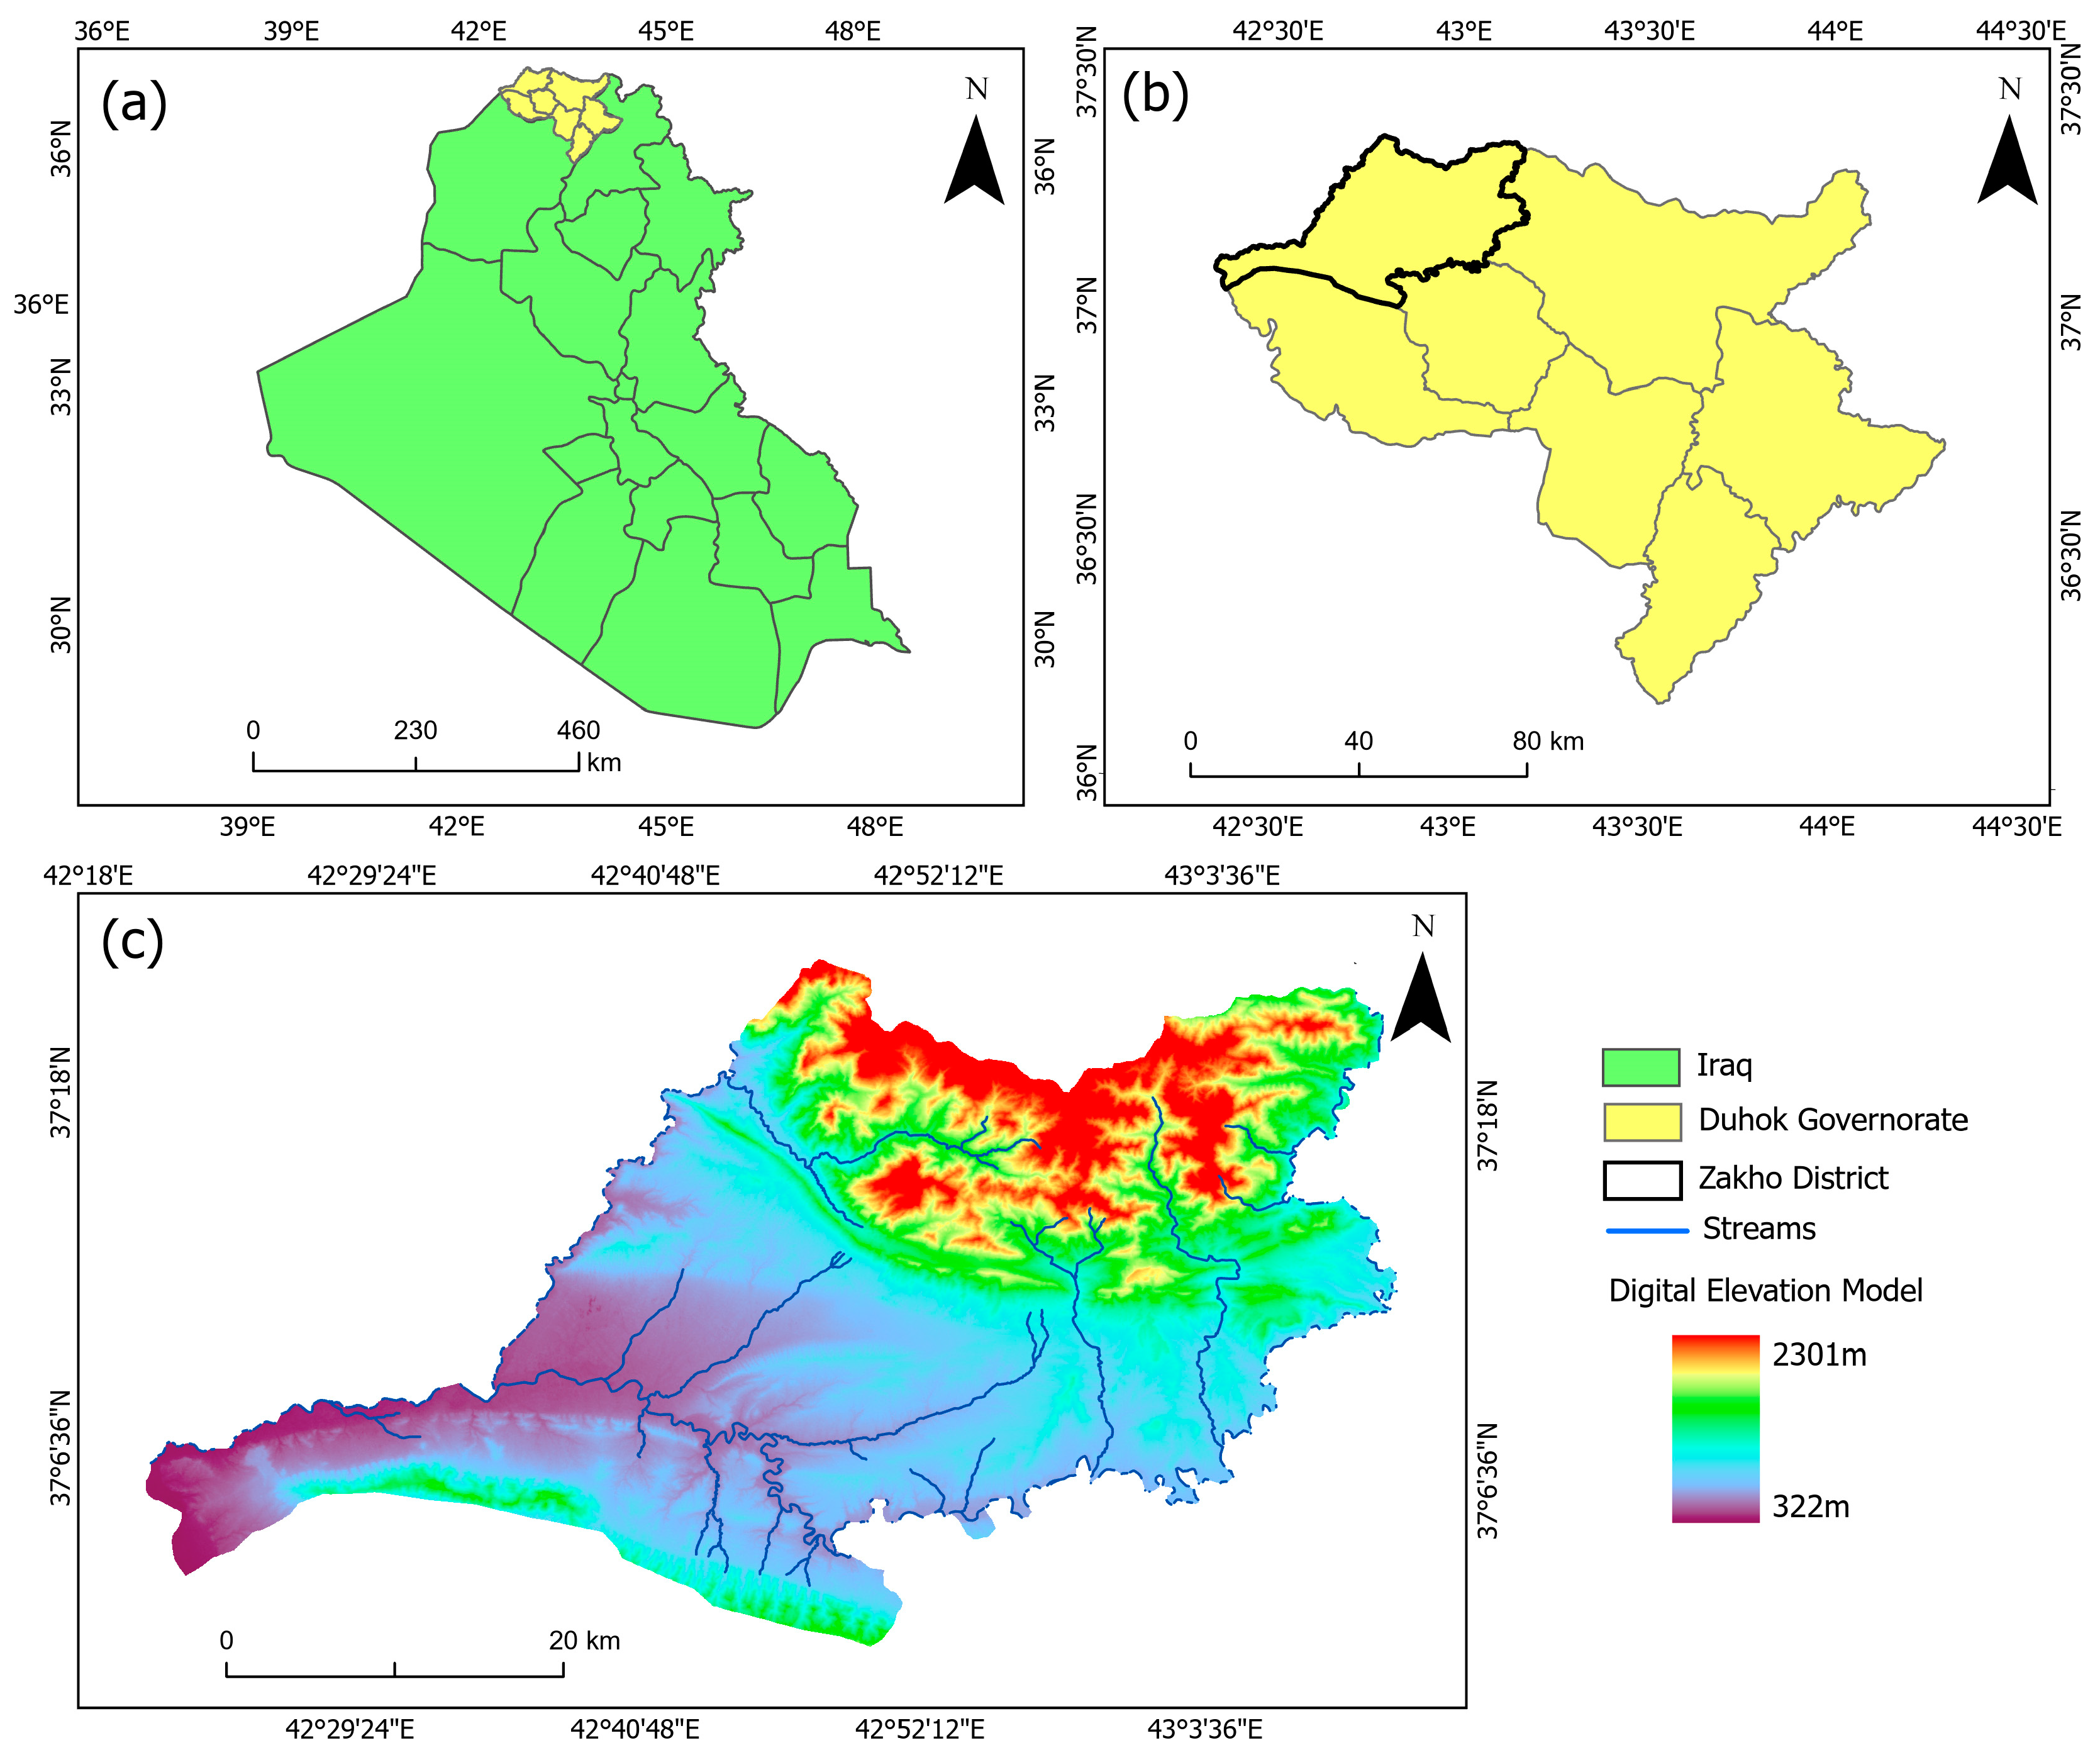
The Zakho region basin is regarded as an important catchment area and a good underground reservoir. This area consists of several major and minor streams. Khabur, one of the main branches of the Tigris River, runs through the region. The area is covered by multiple types of LUC, such as soil, vegetation, agricultural lands, and a large area of mid- to high-altitude mountains with a high annual precipitation ratio. Zakho is in the far northeast of the Iraq and Kurdistan regions and covers an area of 1453.46 km2 (Figure 2). The basin is between 42.7881 and 42.8396 E longitude and 37.0931 and 37.3121 N latitude. The catchment area is mostly covered by recent deposits (alluvial deposits) consisting of sandstone, siltstone, and claystone from the Lower Faris, Upper Faris, and Bakhtiari Geologic Formations [30]. The mountainous area in the north consists of calcite limestone and dolomitic limestone. The area has been inhabited by humans for thousands of years because of the variety of water resources that this area can provide.
The climate of the study area varies from rainy humid weather in the north to semiarid and hot weather in the middle and south. The temperature and rainfall ratio have been altered due to global warming. In arid-to-semiarid areas, there is an increasing need to find alternative water resources [29]. The records from the last 20 years exhibit a clear change in precipitation due to global warming [31]. The average annual rainfall from 2000 to 2021 was 440 mm. Meanwhile, the temperature showed the reverse trend to precipitation, with the temperature increasing over the 20-year period by 3–4 degrees [31].

3. Materials and Methods

The use of a GIS and the AHP has proven to be a good method for analyzing multi-factor models. This approach offers flexibility in resolving issues [32], ultimately leading to solid outcomes. The AHP, which is a decision-making technique, has been used to compare and analyze various alternatives based on multiple variables. The results are helpful for determining the optimum location for new wells and sustaining existing ones. ArcGIS software is particularly adept at data analysis, consistently delivering satisfactory results [33]. The analytical process involves using GIS-based weighting tools to overlay data layers. These thematic maps are then subjected to a grading and interpolation process using spatial analysis and overlay tools. This process takes into account the importance of each parameter. In this study, the determination of the Groundwater Potential Index (GWPI) relies on considering nine factors: slope (S) land use/land cover (LUC), geology (G), drainage density (DD), lineament density (LD), rainfall (RF), soil (SL) data, well data (WD), and accumulated flow (AccFL), as shown in Table 1.
In the AHP, each parameter is given a weight to indicate its relative importance. This thorough procedure leads to the creation of a map. Figure 3 demonstrates the step-by-step approach used to calculate factor weights. Finally, a GWPI map is generated.
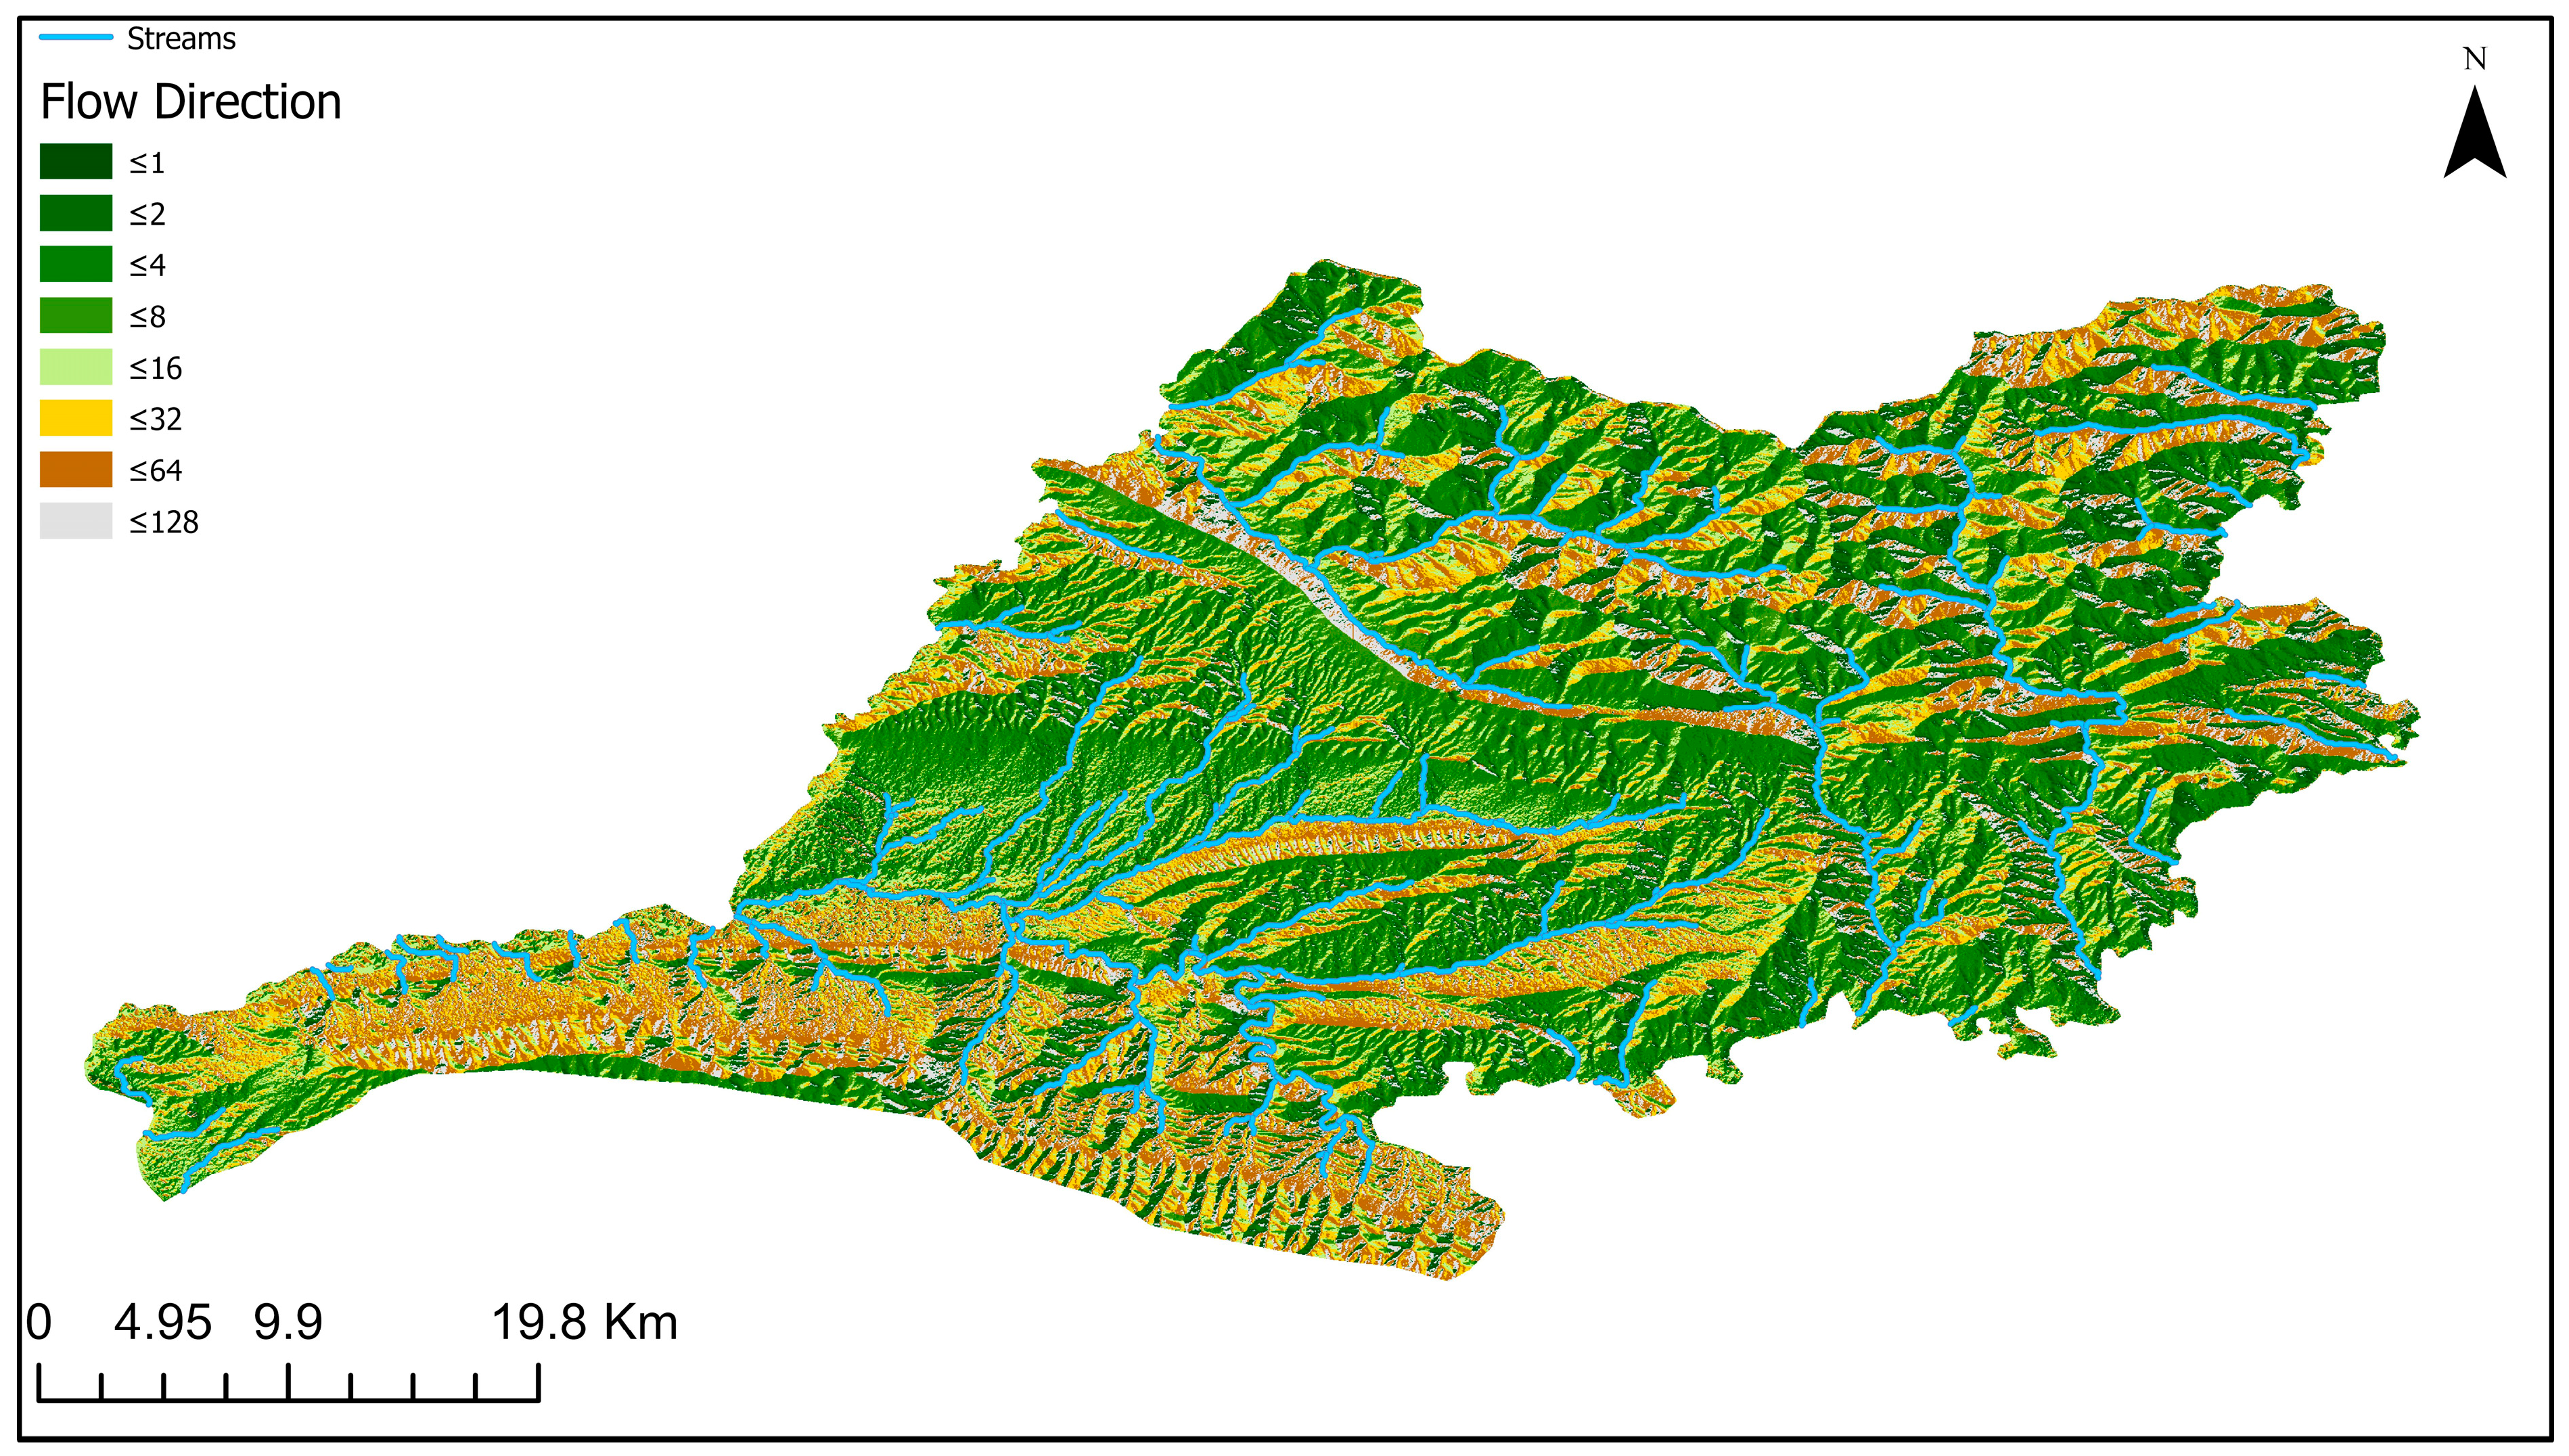
The DD and accumulation flow were derived from Digital Elevation Model (DEM) data; the DEM map shows noticeable variations in elevation between 500 m and 2300 m (Figure 2c) with a spatial resolution of 30 m. The DEM data were acquired from the Shuttle Radar Topography Mission (SRTM) USGS (Earth Explorer) website. These two factors were derived from hydrological tools in ArcGIS Pro. The Fill tool was used first, followed by the Flow Direction map (Figure 4), which showed a common direction from north to south and southwest; the Flow Accumulation map; and finally, the Stream Order Tool. The DD (Equation (1)) refers to the drainage length (Di) over the total area of the Zakho region (A).
D D = D i A
where Di is the drainage length and A is the total area of Zakho.
The LD was created using PCI GEOMATICA software and ArcGIS Pro. Three maps were generated from the DEM with different hill shade angles using the hill shade tool from the spatial analysis tools. The LD refers to the ratio of the total length of the lineaments ( L i ) to the total area ( A ), as shown in Equation (2).
L D = L i A
A slope map was derived from the DEM image. It was used to apply the hill shade and slope tool from the 3D spatial analysis in ArcGIS Pro. The slope map depicts the progression of heights from mountains to plains (high slope to steep slope). The slope can be represented in percentages and degrees. A geological map was generated using a JPEG image obtained from Baghdad’s General Directorate of Geological Survey and the Arabian Plate geology database [34]. The image had to be digitized to ensure that a raster image could be created for the geological map. The soil map used data from the United Nations database, which are stored at the FAO Food and Agriculture Organization data centers [35]. These data are freely downloadable and usable. The LUC map was created by classifying Landsat 8 satellite images captured on 31 August 2021. The Landsat images were preprocessed by applying radiometric and atmospheric corrections. A support vector classifier was used to classify rectified Landsat images. Field data (including existing land types) were collected during a field visit (28 August 2021–3 September 2021). The data were categorized into two groups (training and validation). Training data were used during the classification process, and validation data were used to evaluate the resulting LUC map. This classification procedure was carried out using ENVI v. 5.3 software, which then re-exported the resulting map to ArcGIS Pro. Well data, including depth, static, yield, location, and dynamic data, were obtained from the General Directorate of Groundwater in Zakho. In this study, well data include multiple variables such as well depth, yield, location, dynamic and static data; dynamic data have been utilized within this study to create a GWPI thematic map. All the abovementioned maps were resampled to standardize their spatial resolution (30 m). This was done so that the overlying and weighted analysis processes could be performed.
Pairwise comparison results were used to calculate the weights of the criteria and sub criteria using mathematical calculations. A pairwise matrix was constructed and processed to determine the normalized weights. The factors should be arranged according to their priority and importance in the groundwater recharge process. Equation (3) shows the mathematical calculation of the Groundwater Potential Index (GWPI) [36], which is determined by multiplying the factors by their weight [37]. A significant amount of data can be obtained from the GPWI indicator [38].
G W P I = ( X i × W i )
where S is the slope, AccFl is the accumulation flow, DD is the drainage density, WD is the well data, LUC is the land use/land cover, LD is the lineament density, SL is soil, G is geology, RN is rainfall, and the subscript w refers to the weight of the parameter.
The AHP is a widely employed method to make informed decisions. In the domain of groundwater potential assessments, a comprehensive approach is adopted, integrating the AHP technique with RS and GIS methodologies, as outlined by Ikirri et al. [39]. This approach involves extracting valuable spatial data from remote sensing sources such as satellite images and elevation models. Pertinent features influencing groundwater availability are infused into the dataset through remote sensing data via techniques such as image processing algorithms, land cover categorization, and slope analysis. The potency of the AHP technique lies in its capacity to allocate relative weights to these factors, thereby facilitating the creation of an extensive map that indicates groundwater potential. By systematically exploring various hydrogeological parameters, the AHP not only educates decision makers about groundwater viability within the study area, but also provides crucial insights for the sustainable management of water resources, as emphasized by Abrar [40].
The process is initiated by gathering and combining several datasets that include geological, hydrological, topographical, and land cover data. These datasets form the basis for analyzing the variables affecting the presence and flow of groundwater in the research region. Then, using the AHP as a decision-making tool, relative weights are systematically assigned to these parameters, indicating their individual contributions to groundwater potential. Priority is determined through input from experts, and complex situations are simplified. This aids in resource identification, problem solving, and planning. The AHP uses weight measurements to determine the priority and efficacy of each parameter for recharging groundwater reservoirs. The influencing factors and nature of the problem are well known for the study area; therefore, the AHP method was chosen instead of the Fuzzy AHP, which can be applied for the same purpose but with uncertainty and imprecision. For example, a study conducted by Luo and Wen [41] used an approved FAHP to delineate groundwater potential zones. To implement this method, at least two factors must be considered. These factors were given relative weights; thus, knowledge and expertise are crucial for appropriate evaluation and analysis. Within the AHP and weighted extraction, both types of criteria, quality and quantity, can be used [42]. The GIS-based AHP is an excellent method for detecting GWPI and providing the best information for where, when, and how to manage this vital water resource in the future.
The method relies heavily on assigning a weight to each factor on a scale of 1 to 5 based on its relative importance. This was achieved by constructing a pairwise comparison matrix, in which each factor was ranked according to its significance in the recharge process. The factors were then arranged in a matrix according to their assigned weights. Choosing the priority of the factors is based on expert recommendations and experience in this field to determine which factors are more important than others [43].
In addition to earlier research and literature reviews, fieldwork was necessary to gather the required data for the AHP and to derive weights. The initial procedure started with finding the normalized weights and then the consistency ratio (CR). This procedure was carried out as follows:
Creating a pairwise matrix [17] for all factors, of which there are nine in our study.
p = p 11   p 12   p 13   p 21   p 22   p 23         p n 1   p n 2   p n n  
where p refers to the factors within the matrix.
The next step is calculating normalized weights for the factors:
W n = G M n i = 1 n G M n
where W refers to the column accumulative weight of factors and GM represents the mean of the column weights of all columns.
The judgment coherence is determined by computing the CR:
C R =   C I R I
where CI is the Consistency Index, which is
C I = λ n n 1
where λ represents the eigenvalue of the judgment matrix and is calculated as:
λ = i = 1 n P i W n N . W
where ‘p’ is the weight assigned to each factor in the analysis and N is the total number of groundwater potential zones.
The random index (RI) was obtained from standard tables adopted by Saaty [42]. An acceptable CR value is less than 0.10.

4. Accuracy Assessment

When addressing classification tasks within the AHP framework, such as the assignment of objects to different groups or classes based on their computed weights [44], the ROC–AUC (receiver operating characteristic–area under the curve) validation technique can be applied within the AHP context [45]. For scenarios involving regression-related challenges, or when numerical weights are assigned to alternatives or criteria in the AHP model, R-squared (R2) validation can be employed to assess the model’s fit. The use of ROC–AUC and R2 methodologies is common to validate conclusions drawn from the AHP, particularly in the domain of GIS-based groundwater delineation [46].
In the realm of AHP–GIS for groundwater delineation, the ROC–AUC can be used to evaluate the performance of the AHP model in effectively categorizing potential groundwater zones based on the provided weights and variables. The procedure involves first calculating the ROC curve by adjusting the classification threshold for potential zones and subsequently computing the AUC to distinguish between zones of high and low potential. To compare the True-Positive Rate (TPR) and False-Positive Rate (FPR), an R-squared analysis can be employed to gauge the degree of alignment between the weights allocated through the AHP and the actual GIS values of the groundwater potential for groundwater delineation [47]. Validation is a technique used in the AHP method to evaluate the performance of the model by dividing the data into training and validation sets, using the training data to train the model and the validation data to evaluate its performance. The existing dynamic well data were divided into two groups: a validation group of 30% and a training group of 70%. The training group was used to generate a thematic map of the dynamic well data and to identify potential groundwater zones. The validation group was then used to assess the accuracy of the thematic map by comparing the predicted results with actual data.

5. Results

5.1. Creation of the Matrices of the AHP

Nine factors were used in the AHP pairwise matrix. These included S, AccFl, DD, WD, LD, LUC, SL, G, and RN. The AHP matrix is presented in Table 2, which shows the importance relative to other factors. The calculated CR was 0.079, where the Lamda max was 9.92, CI was 0.12, and RI from the index table for n = 9 was 1.45 (Table 3). The CR was acceptable, because it was less than 0.1. This CR value was directly calculated via the equation above (Equation (6)) using the AHP plugin within ArcGIS Pro software. The classification and standardization of factors are shown in Table 4. Table 5 shows the relative weights
The weights extracted for these factors were 23.042% for S, 19.702% for AccFl, 16.537% for DD, 12.659% for WD, 8.64% for LD, 6.691% for LUC, 5.517% for SL, 3.999% for G, and 3.213% for RN. Each of these weights played a major role in producing the final GWPI thematic map. Any change in priority or order of importance can change the result of the AHP map.

5.2. Factors Involved in the AHP

5.2.1. Drainage Density

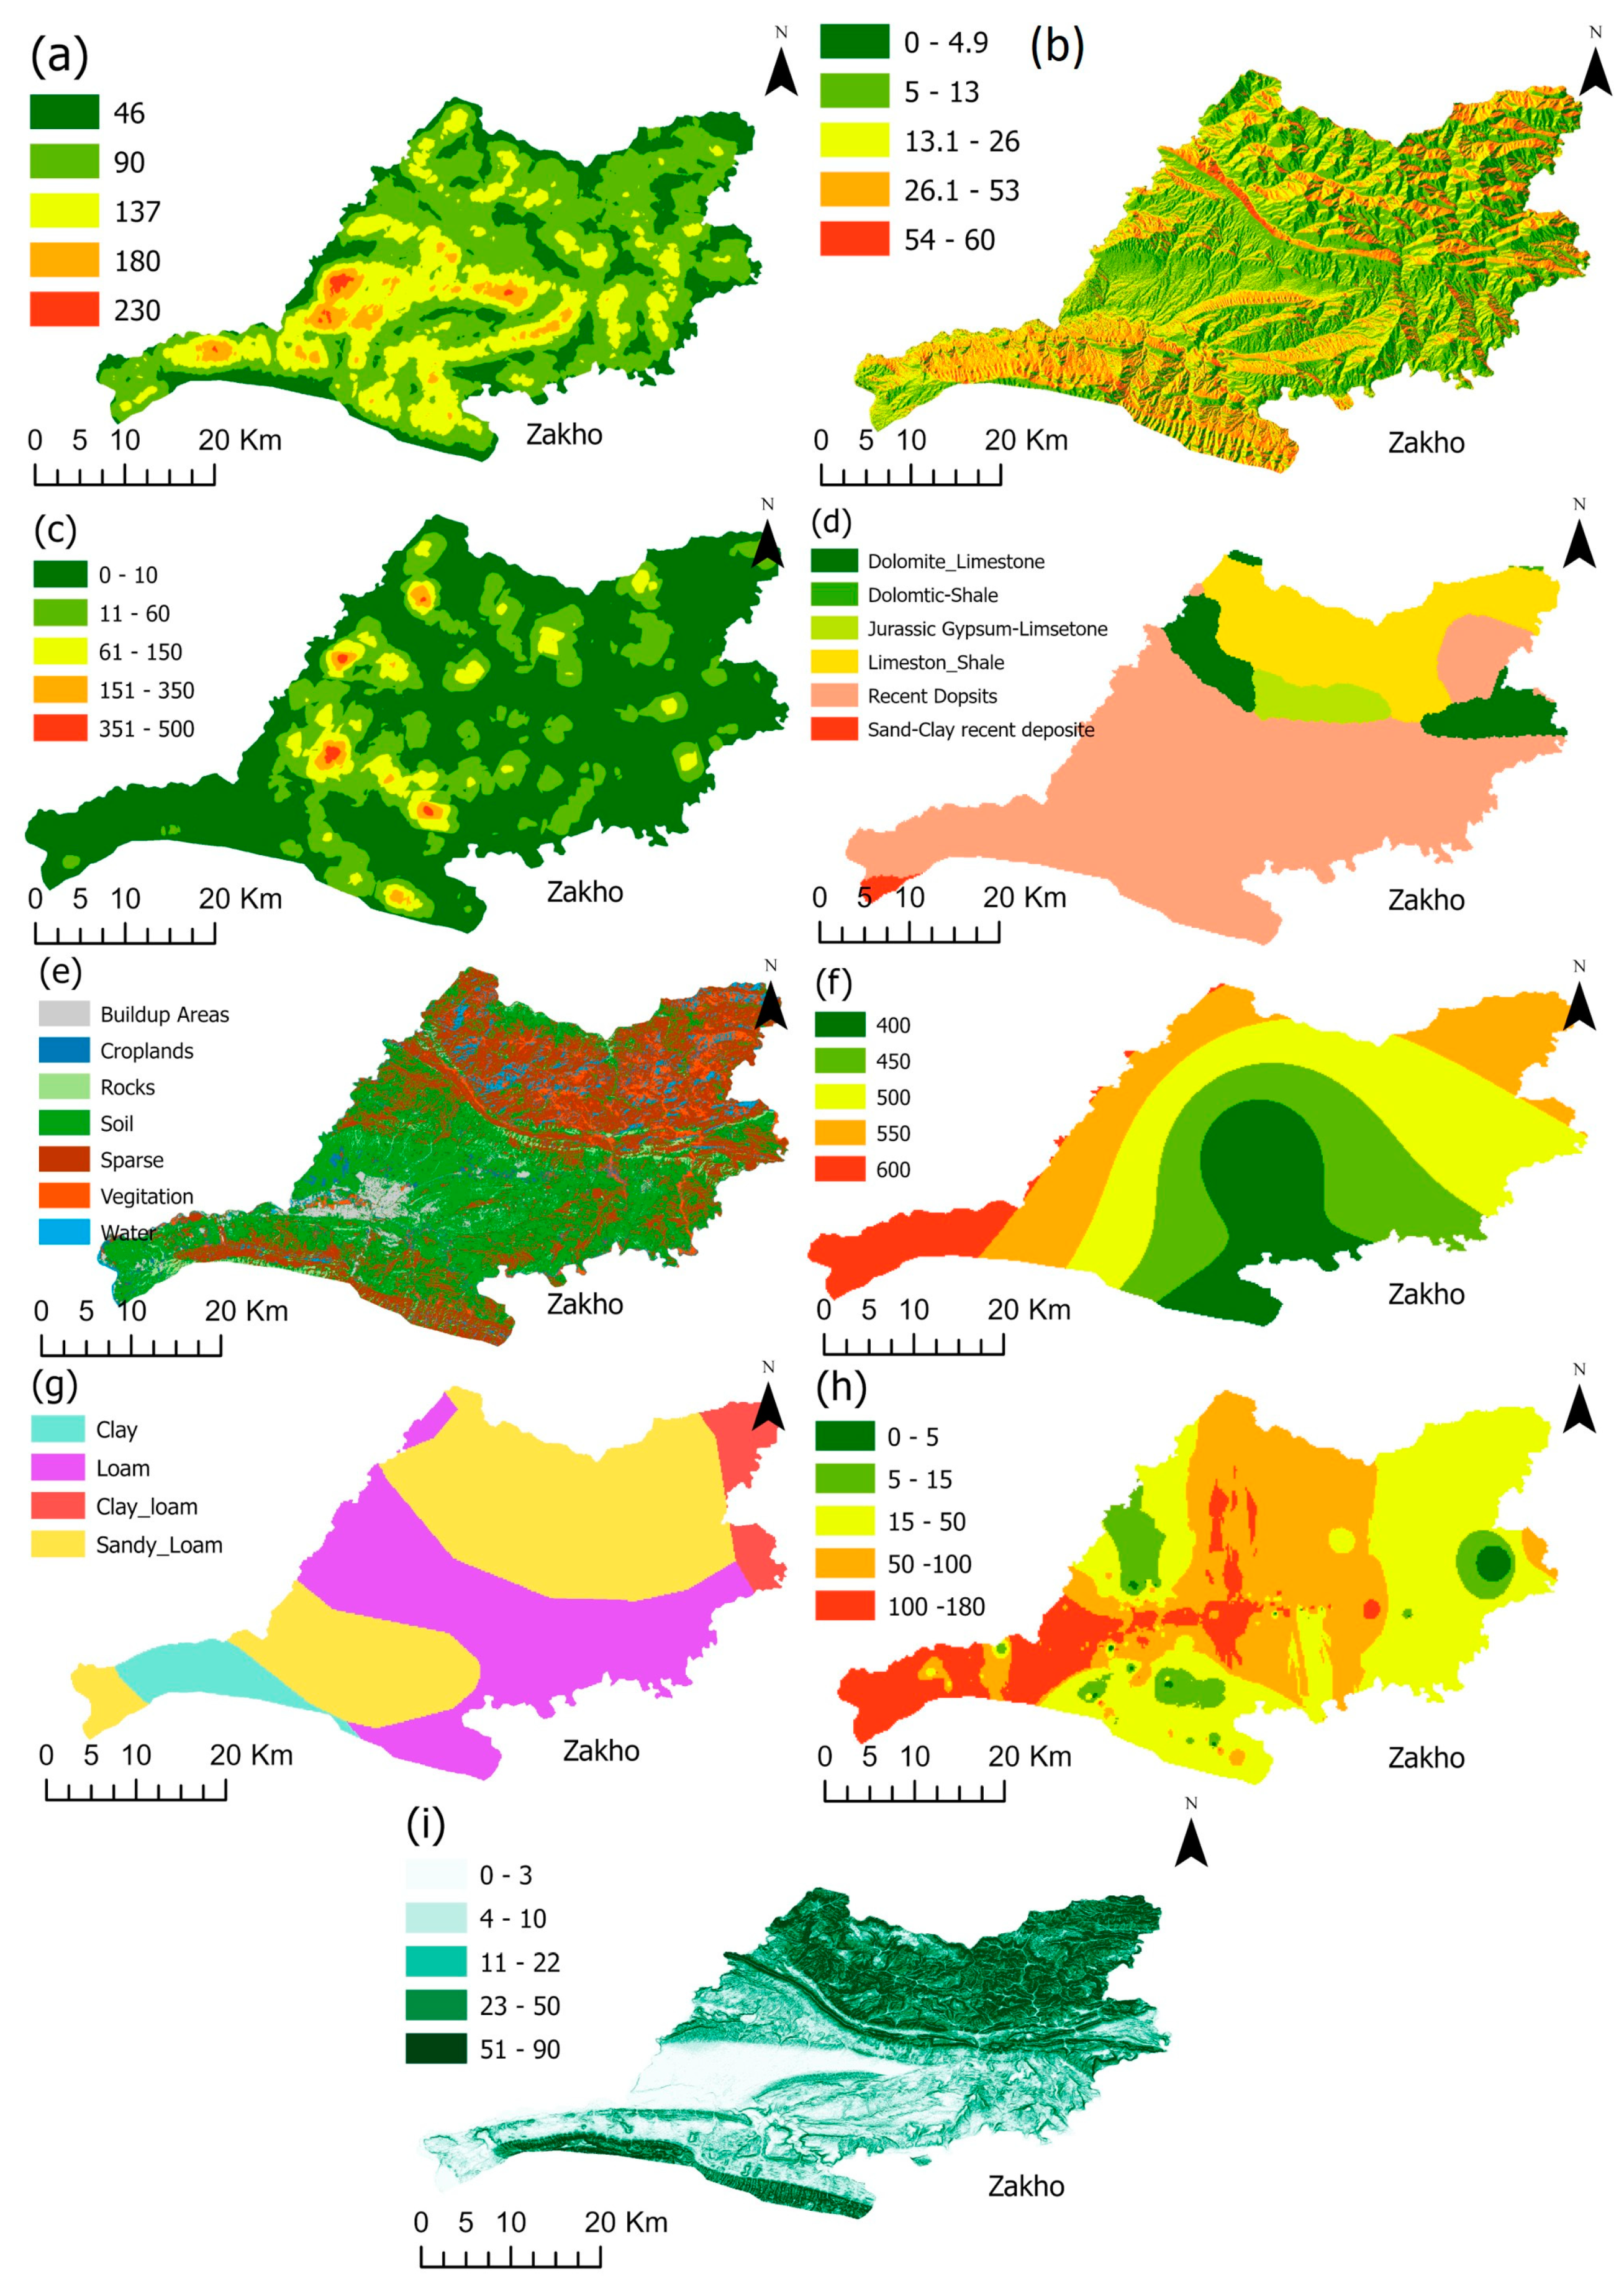
The DD is an effective factor for the GWPI. A high drainage ratio refers to a low ratio of infiltration [48]; thus, as a criterion, the effect of the DD in high drainage zones has a low effect on the recharge process of GWPI, for example, in the mountains and steep valleys. A low drainage density is considered more acceptable in the infiltration process. The Zakho area has a variety of geomorphological features, such as mountains, valleys, and hills; thus, the drainage density in the study area varies from very high (230 km/km2, 33.8%), high (180 km/km2, 26%), medium (137 km/km2, 20%), and low (90 km/km2, 13.45%) to very low (46 km/km2, 6.7%) (Figure 5a). The AHP is a multi-criteria decision-making method that relies on the assessment of different factors affecting groundwater potential, including well data, geology, hydrology, and soil properties. The map shows five zones which have been classed regarding drainage, starting with red color zones that have the lowest drainage rates moving to the dark green areas which represent mountainous areas that have very high drainage rates.

5.2.2. Flow Accumulation

AccFl was determined by calculating the drainage ratio between a pixel and its neighboring pixel(s) in the DEM image [49]. A flow accumulation map was generated using hydrological tools to further determine a flow direction map, which refers to the direction of the flow within the potential zone [50] in ArcGIS Pro. The flow accumulation results in the basin ranges from very high (500 km/km2, 54%), high (240 km/km2, 26.08%), medium (120 km/km2, 13.08%), and low (49 km/km2, 5.53%) to very low (11 km/km2, 4.89%); Figure 5b depicts the generated flow accumulation map.

5.2.3. Lineament Density

Lineaments are natural cracks on the surface of the earth that play an effective role in the filtration process. The produced lineament map shows the major directional faults and fractures that are identifiable in the field, with some increases in their frequency and length. These fractures promote communication between aquifer layers and enhance the rate of rainwater infiltration [51]. The lineament structure can be a good indicator of the groundwater flow direction [41]. The higher the lineament density, the faster the GWPI recharges. The LD map was extracted by creating three hill shade maps at different angles from the DEM image. The results of lineament density within the study area were as follows: very high (480 km/km2, 65%), high (320 km/km2, 23%), medium (63 km/km2, 5.5%), low (50 km/km2, 4.3%), and very low (10 km/km2, 2.2%) (Figure 5c).

5.2.4. Geology

The geology of an area is also an important factor. Geology refers to the lithology of the area and its chemical and physical compositions [52]. Geology plays a crucial role in the Analytic Hierarchy Process (AHP) for determining the Groundwater Potential Index (GWPI). Geology provides information on the structure and composition of the Earth’s crust, which can affect the flow and storage of groundwater. The geology of the Zakho region is characterized by a diverse range of rocks and minerals, as well as a diverse tectonic history and oil and gas deposits, which provide a glimpse into the area’s complex geological past. The composition of recent deposits mostly includes sandstone, siltstone, claystone, and conglomerate, which sand–clay recent deposits are a part of, and all recent deposits are fluvial sediment. All of these phenomena exist only within three geological formations: the Lower Faris, which is composed of marly limestone, claystone, and mudstone; the Upper Faris, which has a similar lithology as the Lower Faris, containing some crucial fossils; and the Bakhtiari Formations, which have a different lithology and mostly contain sandstone, mudstone, and conglomerates [53] (Figure 5d). They are thought to be recent deposits, and their composition (sandstone, siltstone, conglomerate, and clay stones) makes them good aquifers.

5.2.5. Land Use/Land Cover

Land use/land cover can refer to natural and/or man-made land cover [54]. The Land Use and Land Cover factor contributes to the Groundwater Potential Index by affecting groundwater recharge, contaminant transport, human activity impacts, natural filtration, and more. It provides crucial insights into how anthropogenic and natural influences shape the hydrological processes that ultimately impact groundwater availability and quality. Integration of LUC data into GWPI assessments helps in understanding the complex interplay between land use patterns and groundwater potential. LUC is also important for identifying groundwater quality and provides diverse pollution sources. Stormwater runoff from urban areas transports chemicals, heavy metals, and nutrients, whereas fertilizers and pesticides are introduced by agriculture. Surface water flow and infiltration are impacted by land use and cover, and urbanization increases runoff, which might carry contaminants into groundwater. LUC controls how contaminants migrate across the surface of the land, how they enter groundwater, and how they affect the water quality. Differences between urban and natural areas show how human activity affects water quality. Groundwater contamination can result from LUC activities, such as industrial zones and garbage dumps. Nutrient inputs from agriculture necessitate extensive land use monitoring. Surface water and groundwater may be impacted by point-source contamination from industry. Groundwater recharge and natural filtration through forests and wetlands are modified by LUC. Monitoring networks can identify patterns to help manage groundwater resources. Groundwater influenced by LUC is predicted using geospatial models to predict groundwater quality change mitigation, not only the recharge process [55]. Creating an LUC map was one of our major tasks because of the lack of an LUC map from official sources. This procedure had to be performed through the following steps: (1) Image preprocessing. The first step was to preprocess the satellite image, which includes correcting for atmospheric effects, geometric distortions, and radiometric corrections. The goal is to produce a high-quality image that accurately represents the surface features of the Earth. (2) Image segmentation. The next step was to segment the image into homogeneous regions or segments, each of which represents a distinct land cover type. This can be achieved using various algorithms, such as the k-means clustering algorithm or the Markov random field model. (3) Feature extraction. After segmenting the image, the next step was to extract features from the segments that were representative of the different land cover types. These features may include texture, shape, size, and color. (4) Classification. The extracted features are then used as inputs to a classification algorithm, such as a decision tree, random forest, or support vector machine, which assigns each segment to a specific land cover class based on the features. (5) Accuracy assessment. The final step was to assess the accuracy of the classified map. This can be achieved by comparing the results with reference data, such as ground truth data collected through field surveys or existing maps. The accuracy assessment helps to identify areas where the classification may be incorrect and to improve the classification process. The accuracy of the validation was 92%, and the kappa coefficient was 0.89. The built-up area had the lowest infiltration ratio. If not zero, water bodies, vegetation, and croplands had the highest infiltration ratios. By conducting these steps, it was possible to generate an LUC map from a satellite image that accurately represented the distribution and type of land cover in a specific area. The quality of the final map depends on the quality of the input data, the accuracy of the image preprocessing and classification algorithms, and the level of accuracy assessment, the classes produced as follows: water 4.14%, vegetation 4.30%, sparse 35.2%, soil 47.6%, rocks 3.09%, croplands 2.17%, and built-up areas 2.98%. The rocks class has low existence in the area; these rocks are exposed, and there is no soil and vegetation covering the rocks (Figure 5e).

5.2.6. Rainfall

Rainfall is one of the major factors affecting climate change in semiarid areas [56]. The RF data were based on the average annual precipitation for 20 consecutive years (2000–2021). Areas with a high annual rainfall will contribute to groundwater charging every season. Figure 5f shows the interpolated map produced by the Inverse Distance Weighting (IDW) method, which can be used to create a rainfall map from point measurements. The IDW method interpolates values at unsampled locations based on the distances to known points of average annual rainfall ratios. The northern part of the Zakho Basin has a high rainfall ratio; however, the topography of this area makes filtration semi-impossible (mountains and steep cliffs).

5.2.7. Soil

SL is an important factor, both as an individual parameter and within classes of LUC categories. The soil surface and its type, texture, and chemical structure play major roles in feeding groundwater zones [57]. Sandy soil has a major effect in positively recharging aquifers, while loamy and clay soils have the lowest infiltration [58]. The soil in the Zakho Basin varies from sand and sandy–loamy to mud or clay soil [35] (Figure 5g).

5.2.8. Dynamic Well Data

The well data are composed of various types of information (depth, static, dynamic, yield, etc.). Dynamic well data, such as the water level and discharge rate, are important in the Analytic Hierarchy Process (AHP) method for determining the Groundwater Potential Index (GWPI), because they provide critical information about the behavior and characteristics of the groundwater system. Dynamic data from groundwater wells are time-varying measurements of various parameters related to groundwater behavior collected from monitoring wells. These measurements provide insights into how groundwater levels and flow rates change over time, allowing for a better understanding of the dynamic nature of groundwater systems. Dynamic well data provide a direct measure of the hydraulic head and discharge rate of groundwater in a well and can be used to estimate the recharge rate, transmissivity, and other hydrogeological parameters. These parameters are essential for understanding the flow and storage of groundwater in aquifers and for identifying areas of high and low groundwater potential. By incorporating dynamic well data into the AHP method, it is possible to refine the assessment of groundwater potential by considering not only the geological and hydrological conditions of an area but also the actual performance of the groundwater system. This information can then be used to support decision making for groundwater management, water resource planning, and other water-related activities. In summary, the integration of dynamic well data into the AHP method for determining GWPI is important, because it provides a more comprehensive understanding of the groundwater system and allows for more accurate and reliable assessments of groundwater potential. The Inverse Distance Weighting (IDW) is the easiest, most accessible, and one of the most accurate interpolation methods. The IDW method operates under the assumption that values at nearby sampled sites can be used to estimate values at unsampled locations [59]. As the accuracy of the value of the point increases, the nearby sampled points become closer to the untested point. The remaining wells (30%) were used for validation (Figure 5h). When used as a factor within the AHP framework, dynamic well data add a realistic, time-based component to decision-making processes. They improve the precision, dependability, and applicability of AHP-based analyses, allowing better-informed decisions to be made on groundwater potential, resource management, and environmental protection.

5.2.9. Slope

Slope is a critical hydrological factor for recharging the GWPI [60]. The inclination of mountainous and elevated regions significantly influences the formation of zones with a high groundwater potential [61]. An increase in slope will increase water runoff and decrease water infiltration into the ground. A total of 43% of the Zakho region is categorized as a high-slope region, 18% is a medium-slope region, 34% is a low-slope region, and the rest (5%) is a very-low-slope region (Figure 5i).

6. GWPI Map

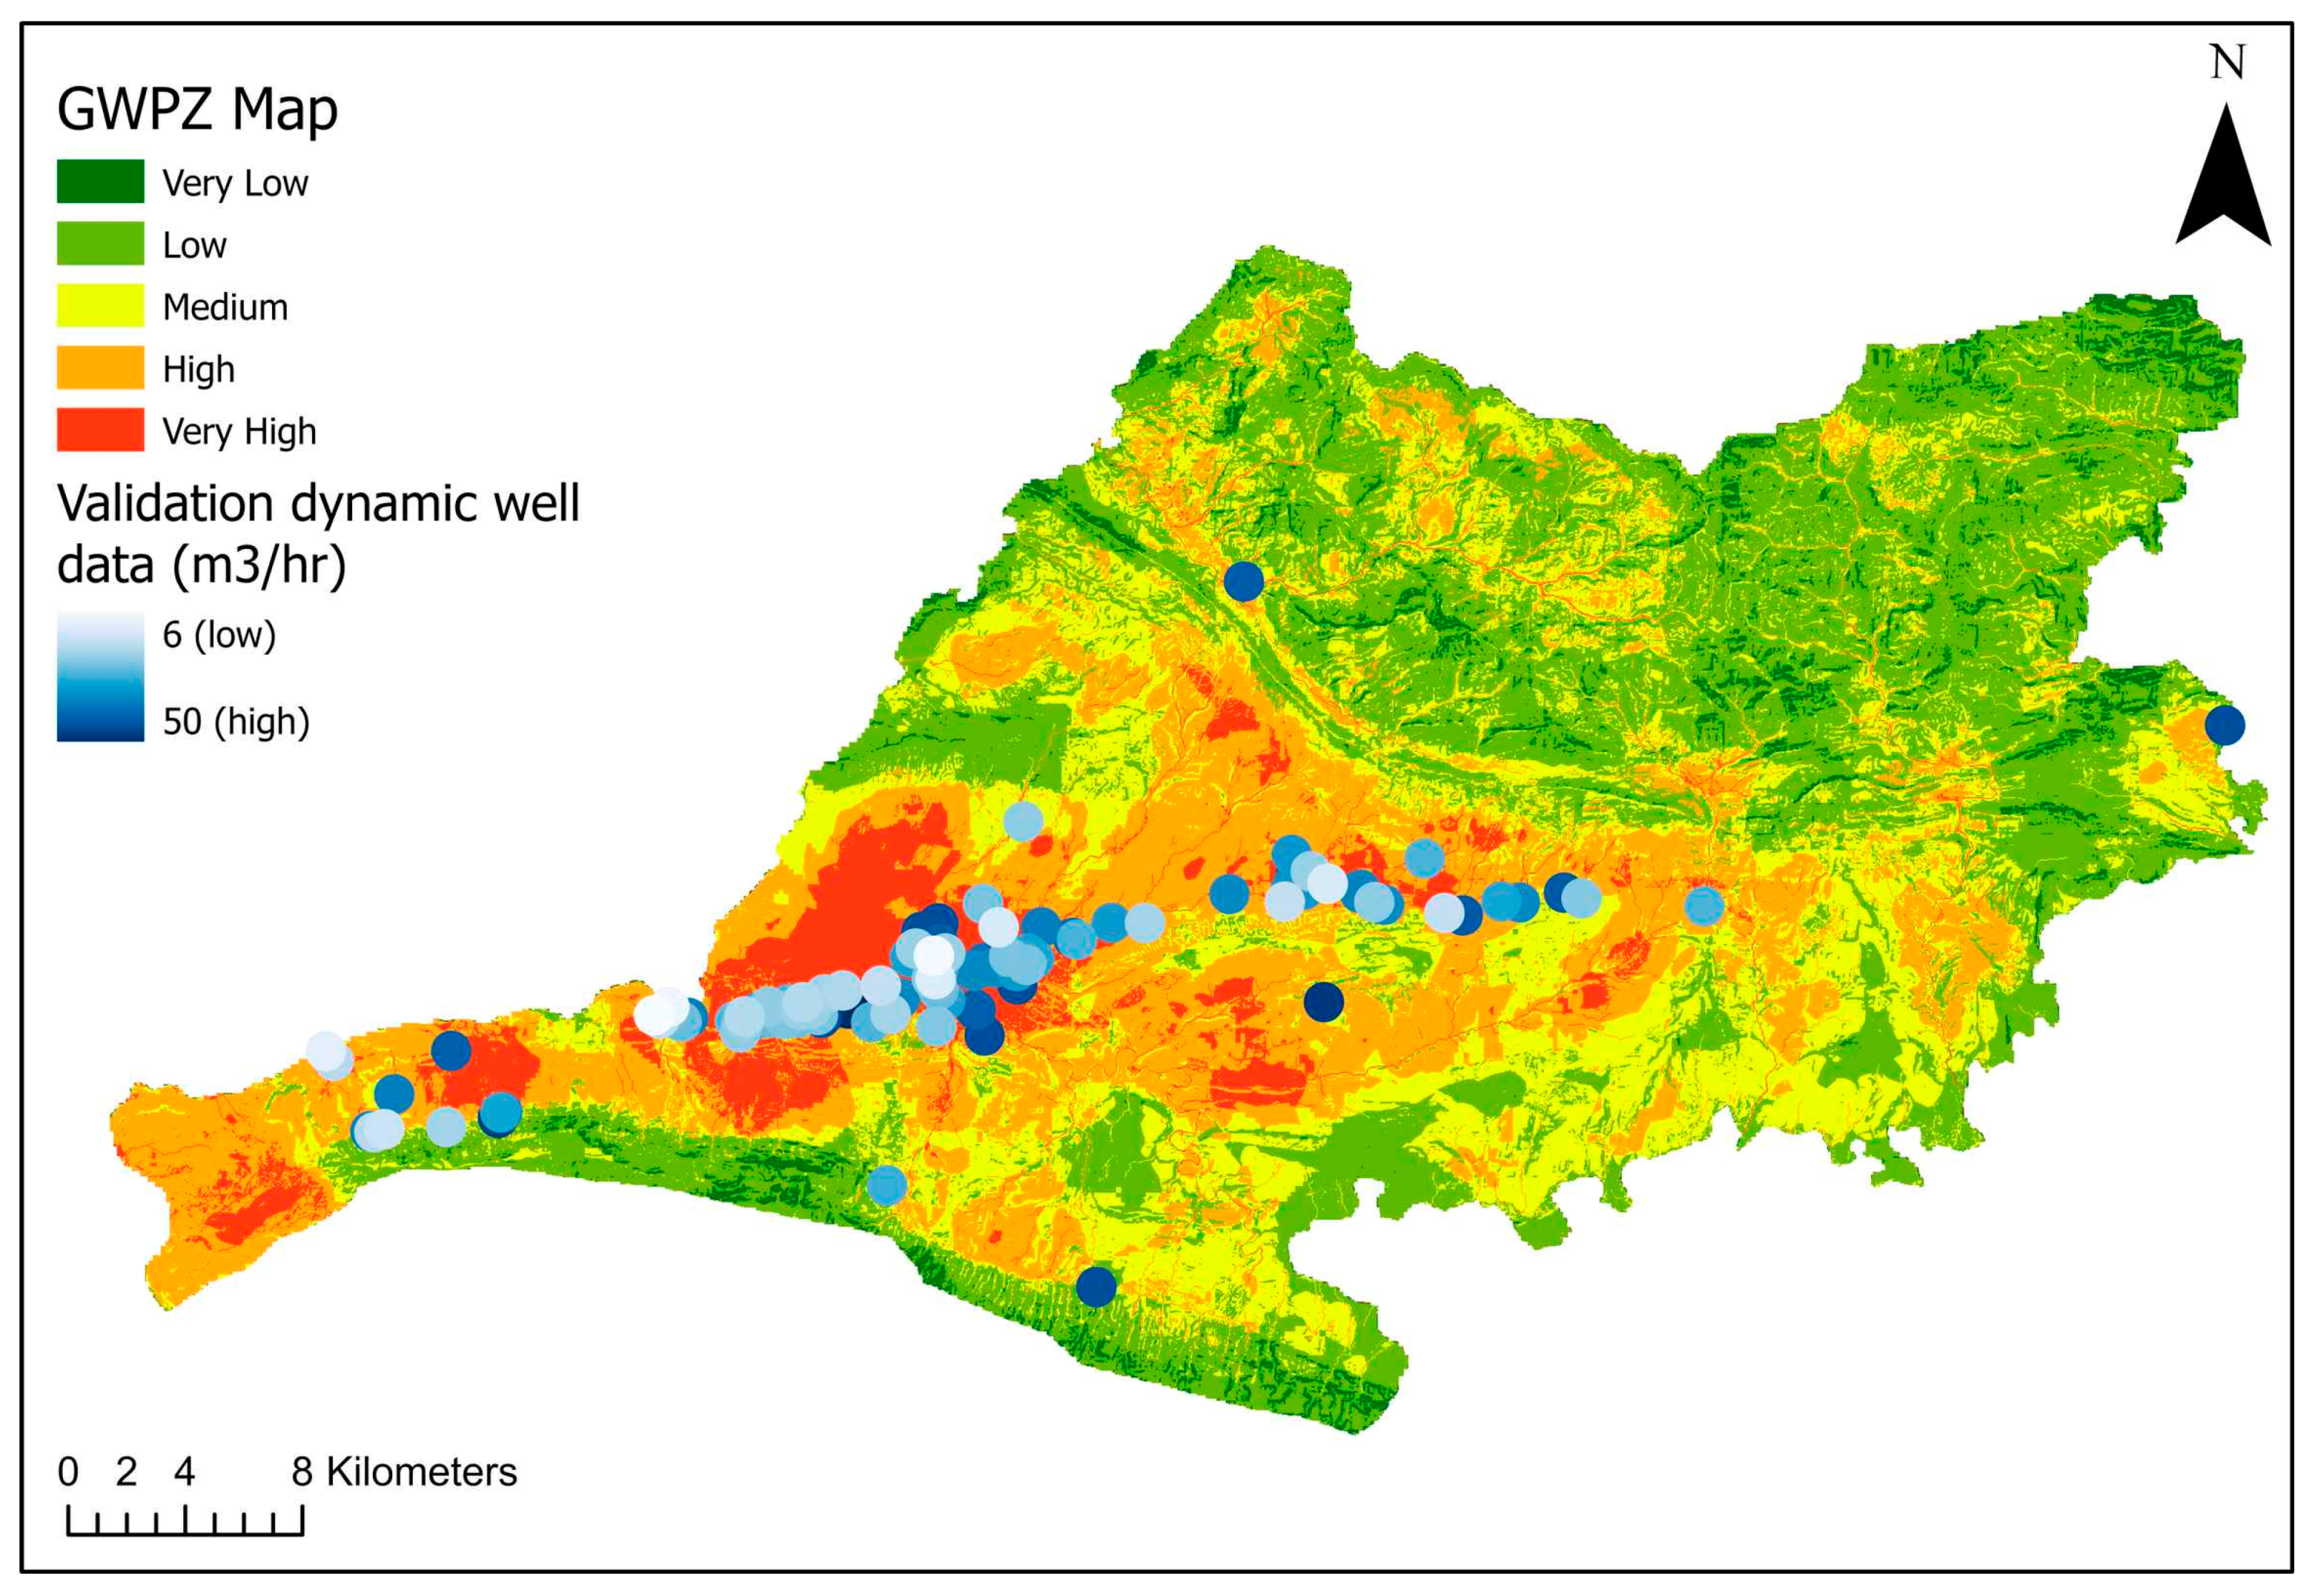
The GWPI map was created from a combination of all nine layers (factors) to produce one thematically indexed map. The final map shows the possible groundwater potential zones in the basin. The classification of potential zones starts from very low to very high groundwater potential zones (Figure 6). The map demonstrates a significant presence of GWIs in the flat region of Zakho, where the city is situated, located in the southwestern portion of the study area, depicted in red. This area covers 17% of the total GWPI map and has a potential of more than 50 m3/h. The areas shown in dark green indicate very low potential zones, accounting for 13% of the map, which means that the potential expected in such areas will be approximately 2–15 m3/h, particularly in the northern and southern regions where high mountain ranges are present, resulting in high runoff processes and low infiltration. Other regions range from low (15–30 m3/h, 25.5%) and medium (30–50 m3/h; 21.5%) potential zones to high potential zones (50–100 m3/h; 23%). Generally, the plane areas located between the two mountains represent the best catchment areas for precipitation and a better environment for infiltration into underground aquifers.

Validation

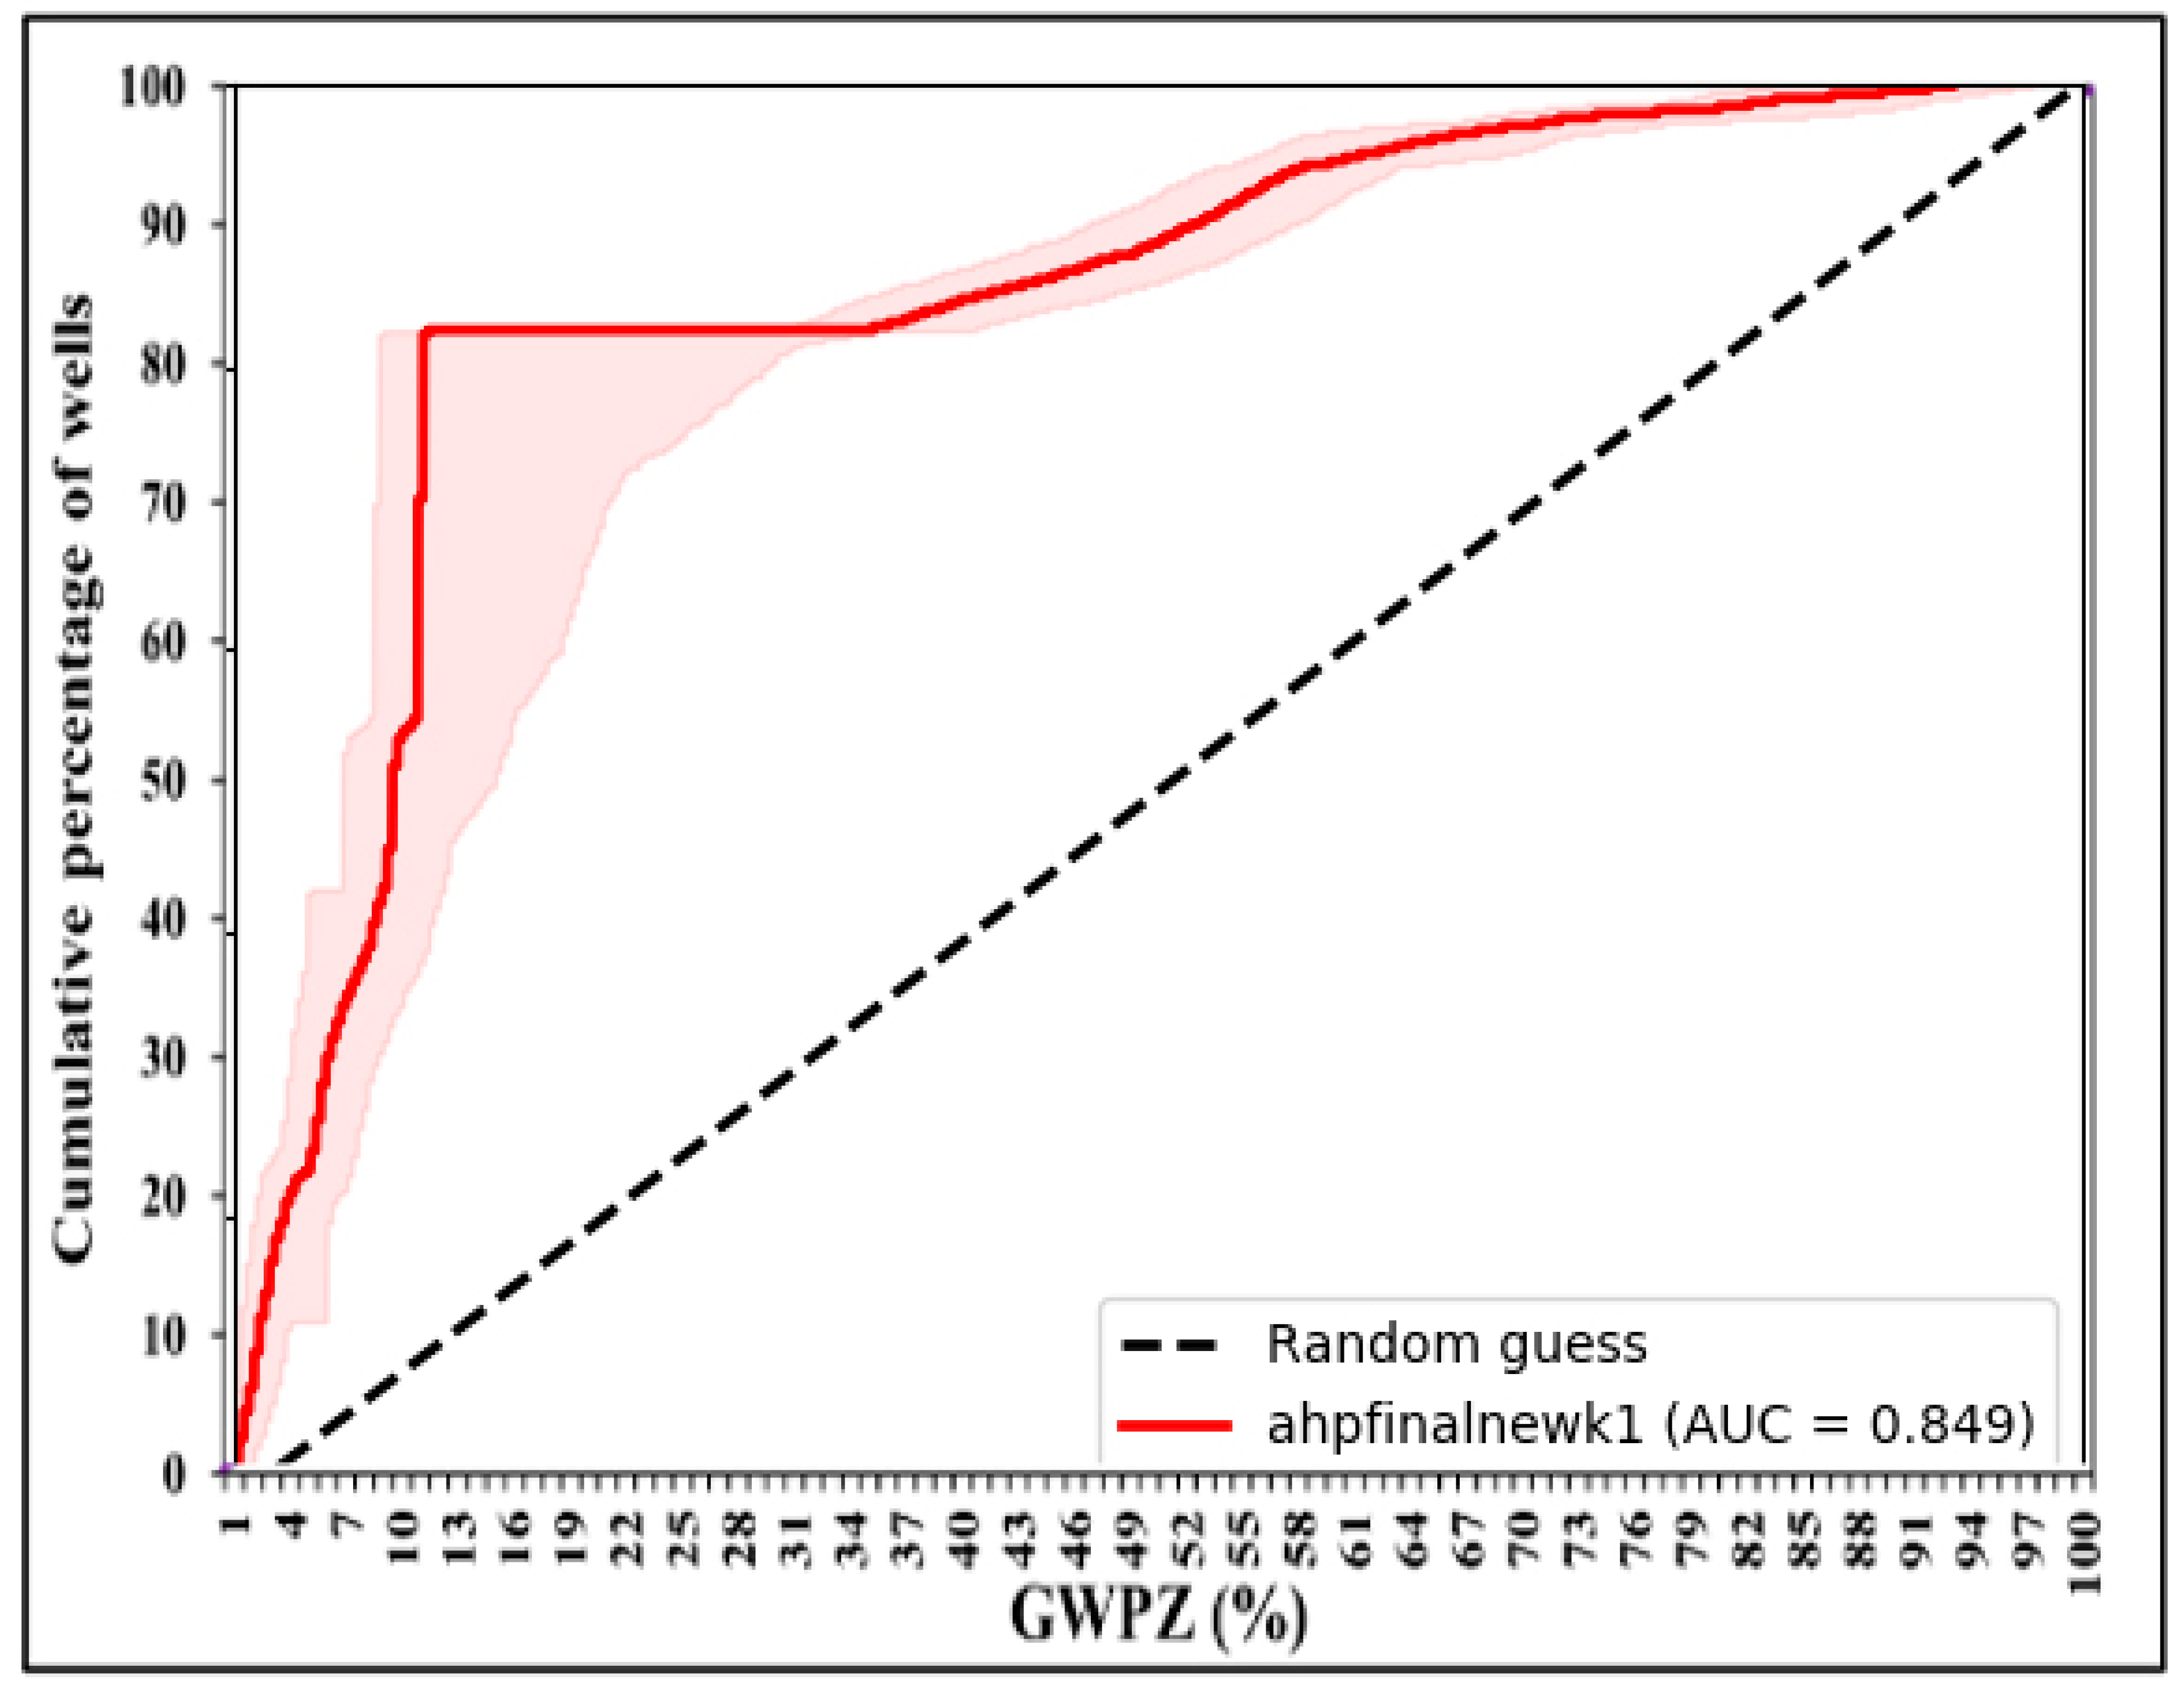
Validation was performed using two common methods, both of which are statistical concepts. The first is the AUC–ROC (area under the receiver–operating characteristic curve), and the second is determining the coefficient of regression R2. In regression analysis, a square regression relationship refers to the relationship between a dependent variable and an independent variable modeled as a square function. In other words, the dependent variable was assumed to be related to the independent variable through a quadratic equation. The results of the validation were found to be reliable, with an R2 of 0.8161 and an AUC–ROC of 0.849 (Figure 7 and Figure 8). These results were deemed to be more than acceptable based on a comparison with training data, and after comparing with other studies, the validation results were very close to the current study; for example, a study carried out by Das Et. Al. [62], which showed 84% accuracy, and another study by Ghosh (2021) [63], which revealed validation results of 73%.

7. Discussion

The AHP- and GIS-based decision-making techniques are user-friendly and easily applicable in GIS environments. There were many difficulties and limitations to conduct the research in better ways; the lack of information and the geopolitical location of the city in addition to the lack of the formal central databases were presented during the selection of essential and effective factors and the determination of the priority of these factors in the AHP pairwise matrix. Identifying factors varies from area to area according to the geological nature, topographical features, hydrological features, and other reasons. The AHP model for one area is not applicable to other areas with the same factors; the model changes depending on expert opinion and the characteristics of the area. The second important step is to extract the weights of the factors to apply them to the AHP matrix to obtain the final thematic map of GWPI. The production of some factor maps was not easy, and some were not available from known sources. For example, the land use/land cover map was constructed from raw data sources such as Landsat SRTM satellite images; a supervised classification of the image had to be performed, and validation had to be carried out in order to confirm the results of the classification. The accuracy of the produced land use/land cover map was 92% with a kappa coefficient of 0.89. The rainfall data from the meteorological directorate of Duhok and Zakho were not sufficient for the training and validation process; therefore, we had to use some of the neighboring Turkish meteorological data stations that surround the study area; data were downloaded from the Turkish Meteorological Data website [64]. Factors such as geology and soil were also created manually (no governmental database) and with the help of data from the FAO and international data sources, but these kinds of data are usually outdated, so an intense effort is needed to achieve an acceptable and realistic map. Geomorphology, a factor commonly incorporated in similar studies, could not be included in this research article. This omission arose because of the lack of an official reference for such data and the arduous nature of manually creating a geomorphological map for the study area, which could potentially take several years. In contrast, RS/GIS software uses tools that use a unique resolution (30 m) and data (WGS1984 projection reference) for all factor maps in this study. This study has a direct impact on multi-aspect issues, and one of the most important issues is how to face upcoming environmental crises in a drought-prone area. The results of this study are somehow compatible with other similar studies that have been carried out on groundwater potentials. The second outcome from this study is the capability of applying the same scenario and plans to other areas facing freshwater issues. The contribution of some factors is commonly used by many studies such as slope, well data, lineament density, etc. Adding other factors depends on the study area characteristics and the availability of data. The integration of multiple techniques and the coordination between them is one of the aspects that will allow us to conduct new, similar research with precise results, although the lack of data and site visit limitations for certain locations may have a negative effect on the research procedures.

8. Conclusions

In this study, GWPIs were determined in the Zakho Basin region using a GIS-based AHP. The combination of remote sensing, a GIS, and the Analytical Hierarchical Process (AHP) has demonstrated effectiveness and convenience for delineating potential groundwater zones within the area. By employing the weighted overlay technique in ArcGIS software, the resulting map was verified as highly accurate when compared with the groundwater level depth and flow direction data obtained from wells. The AHP map revealed that 30% of the area had high to very high potential zones when the nine factors were weighted. In the plain area between the northern and southern mountains, there is a large river called the Tigris. This is a great place for water to gather, because it has low slopes that do not allow rainwater runoff, allowing the rainwater to soak into the ground. In addition to the land cover types in this area, which mainly consist of soil, croplands, and vegetated areas, these three factors have a major effect on the infiltration process of precipitation into the ground. However, the northern part of the study area has higher annual precipitation ratios, but the infiltration is almost zero because of the high-slope surfaces. In conclusion, using multiple factors in the AHP for determining GWPI is important, because they provide valuable information on the recharge of an area and its impact on groundwater potential. This information can be used to support informed decision making for groundwater management and water resource planning. The AHP depends on a combination of these factors to obtain reliable and valid results. If these factors are not carefully considered and managed, the results of the AHP may not accurately reflect the relative importance of the different criteria and may not support the decision-making process effectively; in other words, the quality and precision of the input data and choosing the effective factors in the study area will provide accurate and precise results. GIS–AHP methods are currently considered effective; furthermore, there are many other new methods that have been developed in addition to machine learning and deep learning techniques, including the Gravity Recovery and Climate Experiment (GRACE). Choosing the AHP over the FAHP is more reliable for the study area and also the influencing factors. The result of the GWPI map is subject to change due to the effectiveness of the factors and the arrangement of factor priorities; all scenarios have been tested to determine which factors have the most positive influence on the outcome of the GWPI map.

Author Contributions

Conceptualization, W.H.S. and Y.T.M.; methodology, W.H.S. and Y.T.M.; software, W.H.S.; validation, W.H.S. and Y.T.M.; formal analysis, W.H.S. and Y.T.M.; resources, W.H.S.; data curation, W.H.S.; writing—original draft preparation, W.H.S.; writing—review and editing, Y.T.M.; visualization, W.H.S. and Y.T.M.; supervision, W.H.S. and Y.T.M.; project administration, Y.T.M. All authors have read and agreed to the published version of the manuscript.

Funding

This study received no funding.

Data Availability Statement

The data presented in this study are available upon request from the corresponding author. The data are not publicly available because of privacy restrictions of the government.

Conflicts of Interest

The authors declare no conflict of interest.

References

  1. Jenifer, M.A.; Jha, M.K. Comparison of Analytic Hierarchy Process, Catastrophe and Entropy techniques for evaluating groundwater prospect of hard-rock aquifer systems. J. Hydrol. 2017, 548, 605–624. [Google Scholar] [CrossRef]
  2. Janipella, R.; Quamar, R.; Sanam, R.; Jangam, C.; Pandurang; Balwant; Jyothi, V.; Padmakar, C.; Pujari, P.R. Evaluation of Groundwater Vulnerability to Pollution using GIS Based DRASTIC Method in Koradi, India—A Case Study. J. Geol. Soc. India 2020, 96, 292–297. [Google Scholar] [CrossRef]
  3. Okello, C.; Tomasello, B.; Greggio, N.; Wambiji, N.; Antonellini, M. Impact of Population Growth and Climate Change on the Freshwater Resources of Lamu Island, Kenya. Water 2015, 7, 1264–1290. [Google Scholar] [CrossRef]
  4. Alessa, L.; Kliskey, A.; Lammers, R.; Arp, C.; White, D.; Hinzman, L.; Busey, R. The Arctic Water Resource Vulnerability Index: An Integrated Assessment Tool for Community Resilience and Vulnerability with Respect to Freshwater. Environ. Manag. 2008, 42, 523–541. [Google Scholar] [CrossRef]
  5. De Stefano, L.; Lopez-Gunn, E. Unauthorized groundwater use: Institutional, social and ethical considerations. Water Policy 2012, 14, 147–160. [Google Scholar] [CrossRef]
  6. Mzuri, R.T.; Omar, A.A.; Mustafa, Y.T. Spatiotemporal Analysis of Land Surface Temperature and Vegetation Changes in Duhok District, Kurdistan Region, Iraq. Iraqi Geol. J. 2022, 55, 67–80. [Google Scholar] [CrossRef]
  7. Muniraj, K.; Jesudhas, C.J.; Chinnasamy, A. Delineating the Groundwater Potential Zone in Tirunelveli Taluk, South Tamil Nadu, India, Using Remote Sensing, Geographical Information System (GIS) and Analytic Hierarchy Process (AHP) Techniques. Proc. Natl. Acad. Sci. India Sect. A Phys. Sci. 2019, 90, 661–676. [Google Scholar] [CrossRef]
  8. Yadav, B.; Malav, L.C.; Jangir, A.; Kharia, S.K.; Singh, S.V.; Yeasin; Nogiya, M.; Meena, R.L.; Meena, R.S.; Tailor, B.L.; et al. Application of analytical hierarchical process, multi-influencing factor, and geospatial techniques for groundwater potential zonation in a semi-arid region of western India. J. Contam. Hydrol. 2023, 253, 104122. [Google Scholar] [CrossRef]
  9. Kubingwa, J.N.; Makoba, E.E.; Mussa, K.R. Integrated Geospatial and Geophysical Approaches for Mapping Groundwater Potential in the Semi-Arid Bukombe District, Tanzania. Earth 2023, 4, 241–265. [Google Scholar] [CrossRef]
  10. Thapa, R.; Gupta, S.; Gupta, A.; Reddy, D.V.; Kaur, H. Use of geospatial technology for delineating groundwater potential zones with an emphasis on water-table analysis in Dwarka River basin, Birbhum, India. Hydrogeol. J. 2017, 26, 899–922. [Google Scholar] [CrossRef]
  11. Lee, S.; Lee, C.-W. Application of Decision-Tree Model to Groundwater Productivity-Potential Mapping. Sustainability 2015, 7, 13416–13432. [Google Scholar] [CrossRef]
  12. Helena, B.; Pardo, R.; Vega, M.; Barrado, E.; Fernandez, J.M.; Fernandez, L. Temporal evolution of groundwater composition in an alluvial aquifer (Pisuerga River, Spain) by principal component analysis. Water Res. 2000, 34, 807–816. [Google Scholar] [CrossRef]
  13. Pourtaghi, Z.S.; Pourghasemi, H.R. GIS-based groundwater spring potential assessment and mapping in the Birjand Township, southern Khorasan Province, Iran. Hydrogeol. J. 2014, 22, 643–662. [Google Scholar] [CrossRef]
  14. Nazari, A.; Zaryab, A.; Ahmadi, A. Estimation of groundwater storage change in the Helmand River Basin (Afghanistan) using GRACE satellite data. Earth Sci. Inform. 2022, 16, 579–589. [Google Scholar] [CrossRef]
  15. Mkumbo, N.J.; Mussa, K.R.; Mariki, E.E.; Mjemah, I.C. The Use of the DRASTIC-LU/LC Model for Assessing Groundwater Vulnerability to Nitrate Contamination in Morogoro Municipality, Tanzania. Earth 2022, 3, 1161–1184. [Google Scholar] [CrossRef]
  16. Fatah, K.K.; Mustafa, Y.T.; Hassan, I.O. Flood Susceptibility Mapping Using an Analytic Hierarchy Process Model Based on Remote Sensing and GIS Approaches in Akre District, Kurdistan Region, Iraq. Iraqi Geol. J. 2022, 55, 121–149. [Google Scholar] [CrossRef]
  17. Saaty, T.L. Decision making with the analytic hierarchy process. Int. J. Serv. Sci. 2008, 1, 83–98. [Google Scholar] [CrossRef]
  18. Yin, H.; Shi, Y.; Niu, H.; Xie, D.; Wei, J.; Lefticariu, L.; Xu, S. A GIS-based model of potential groundwater yield zonation for a sandstone aquifer in the Juye Coalfield, Shangdong, China. J. Hydrol. 2017, 557, 434–447. [Google Scholar] [CrossRef]
  19. Gnanachandrasamy, G.; Zhou, Y.; Bagyaraj, M.; Venkatramanan, S.; Ramkumar, T.; Wang, S. Remote Sensing and GIS Based Groundwater Potential Zone Mapping in Ariyalur District, Tamil Nadu. J. Geol. Soc. India 2018, 92, 484–490. [Google Scholar] [CrossRef]
  20. Tang, Z.; Zhang, H.; Yi, S.; Xiao, Y. Assessment of flood susceptible areas using spatially explicit, probabilistic multi-criteria decision analysis. J. Hydrol. 2018, 558, 144–158. [Google Scholar] [CrossRef]
  21. Saidi, S.; Hosni, S.; Mannai, H.; Jelassi, F.; Bouri, S.; Anselme, B. GIS-based multi-criteria analysis and vulnerability method for the potential groundwater recharge delineation, case study of Manouba phreatic aquifer, NE Tunisia. Environ. Earth Sci. 2017, 76, 511. [Google Scholar] [CrossRef]
  22. Gdoura, K.; Anane, M.; Jellali, S. Geospatial and AHP-multicriteria analyses to locate and rank suitable sites for groundwater recharge with reclaimed water. Resour. Conserv. Recycl. 2015, 104, 19–30. [Google Scholar] [CrossRef]
  23. Murthy, K.S.R. Ground water potential in a semi-arid region of Andhra Pradesh—A geographical information system approach. Int. J. Remote Sens. 2000, 21, 1867–1884. [Google Scholar] [CrossRef]
  24. Machiwal, D.; Jha, M.K.; Mal, B.C. Assessment of Groundwater Potential in a Semi-Arid Region of India Using Remote Sensing, GIS and MCDM Techniques. Water Resour. Manag. 2010, 25, 1359–1386. [Google Scholar] [CrossRef]
  25. Madrucci, V.; Taioli, F.; de Araújo, C.C. Groundwater favorability map using GIS multicriteria data analysis on crystalline terrain, São Paulo State, Brazil. J. Hydrol. 2008, 357, 153–173. [Google Scholar] [CrossRef]
  26. Abdekareem, M.; Al-Arifi, N.; Abdalla, F.; Mansour, A.; El-Baz, F. Fusion of Remote Sensing Data Using GIS-Based AHP-Weighted Overlay Techniques for Groundwater Sustainability in Arid Regions. Sustainability 2022, 14, 7871. [Google Scholar] [CrossRef]
  27. Ahmed, K.; Shahid, S.; bin Harun, S.; Ismail, T.; Nawaz, N.; Shamsudin, S. Assessment of groundwater potential zones in an arid region based on catastrophe theory. Earth Sci. Inform. 2014, 8, 539–549. [Google Scholar] [CrossRef]
  28. Forootan, E.; Seyedi, F. GIS-based multi-criteria decision making and entropy approaches for groundwater potential zones delineation. Earth Sci. Inform. 2021, 14, 333–347. [Google Scholar] [CrossRef]
  29. Zhu, Q.; Abdelkareem, M. Mapping Groundwater Potential Zones Using a Knowledge-Driven Approach and GIS Analysis. Water 2021, 13, 579. [Google Scholar] [CrossRef]
  30. Jassim, S.Z.; Goff, J.C. Geology of Iraq; Dolin, Prague and Moravian Museum: Prague, Czech, 2006; Volume 1, p. 341. [Google Scholar]
  31. Directorate of Meteorolgy and Seismology of Duhok Province. Available online: http://msduhok.org/page/em-k%C3%AEne/2000-2021/ (accessed on 11 May 2022).
  32. Rikalovic, A.; Cosic, I.; Lazarevic, D. GIS Based Multi-criteria Analysis for Industrial Site Selection. Procedia Eng. 2014, 69, 1054–1063. [Google Scholar] [CrossRef]
  33. Chenini, I.; Mammou, A.B.; El May, M. Groundwater recharge zone mapping using GIS-based multi-criteria analysis: A case study in Central Tunisia (Maknassy Basin). Water Resour Manag. 2010, 24, 921–939. [Google Scholar] [CrossRef]
  34. USSGS. Geologic Map for Arabian Plate. Available online: https://certmapper.cr.usgs.gov/data/apps/world-maps/2000/ (accessed on 6 August 2021).
  35. FAO. World Soil Map. Available online: https://www.fao.org/soils-portal/data-hub/soil-maps-and-databases/faounesco-soil-map-of-the-world/en/2010/ (accessed on 23 October 2022).
  36. Arumugam, M.; Kulandaisamy, P.; Karthikeyan, S.; Thangaraj, K.; Senapathi, V.; Chung, S.Y.; Muthuramalingam, S.; Rajendran, M.; Sugumaran, S.; Manimuthu, S. An Assessment of Geospatial Analysis Combined with AHP Techniques to Identify Groundwater Potential Zones in the Pudukkottai District, Tamil Nadu, India. Water 2023, 15, 1101. [Google Scholar] [CrossRef]
  37. Rao, B.V.; Briz-Kishore, B. A methodology for locating potential aquifers in a typical semi-arid region in India using resistivity and hydrogeologic parameters. Geoexploration 1991, 27, 55–64. [Google Scholar]
  38. Shekhar, S.; Pandey, A.C. Delineation of groundwater potential zone in hard rock terrain of India using remote sensing, geographical information system (GIS) and analytic hierarchy process (AHP) techniques. Geocarto Int. 2014, 30, 402–421. [Google Scholar] [CrossRef]
  39. Ikirri, M.; Boutaleb, S.; Ibraheem, I.M.; Abioui, M.; Echogdali, F.Z.; Abdelrahman, K.; Id-Belqas, M.; Abu-Alam, T.; El Ayady, H.; Essoussi, S.; et al. Delineation of Groundwater Potential Area using an AHP, Remote Sensing, and GIS Techniques in the Ifni Basin, Western Anti-Atlas, Morocco. Water 2023, 15, 1436. [Google Scholar] [CrossRef]
  40. Abrar, H.; Kura, A.L.; Dube, E.E.; Beyene, D.L. AHP based analysis of groundwater potential in the western escarpment of the Ethiopian rift valley. Geol. Ecol. Landsc. 2021, 7, 175–188. [Google Scholar] [CrossRef]
  41. Luo, D.; Wen, X.; Zhang, H.; Xu, J.; Zhang, R. An improved FAHP based methodology for groundwater potential zones in Longchuan River basin, Yunnan Province, China. Earth Sci. Inform. 2020, 13, 847–857. [Google Scholar] [CrossRef]
  42. Alonso, J.A.; Lamata, M.T. Consistency in the analytic hierarchy process: A new approach. Int. J. Uncertain. Fuzziness Knowl. -Based Syst. 2006, 14, 445–459. [Google Scholar] [CrossRef]
  43. Saaty, T.L.; Vargas, L.G. Why is the Principal Eigenvector Necessary? In Models, Methods, Concepts & Applications of the Analytic Hierarchy Process; Springer: Berlin/Heidelberg, Germany, 2012; pp. 63–70. [Google Scholar]
  44. Chung, C.-J.F.; Fabbri, A.G. Validation of Spatial Prediction Models for Landslide Hazard Mapping. Nat. Hazards 2003, 30, 451–472. [Google Scholar] [CrossRef]
  45. Das, S. Comparison among influencing factor, frequency ratio, and analytical hierarchy process techniques for groundwater potential zonation in Vaitarna basin, Maharashtra, India. Groundw. Sustain. Dev. 2019, 8, 617–629. [Google Scholar] [CrossRef]
  46. Maity, B.; Mallick, S.K.; Das, P.; Rudra, S. Comparative analysis of groundwater potentiality zone using fuzzy AHP, frequency ratio and Bayesian weights of evidence methods. Appl. Water Sci. 2022, 12, 1–16. [Google Scholar] [CrossRef]
  47. Goodarzi, M.R.; Niknam, A.R.R.; Jamali, V.; Pourghasemi, H.R. Aquifer vulnerability identification using DRASTIC-LU model modification by fuzzy analytic hierarchy process. Model. Earth Syst. Environ. 2022, 8, 5365–5380. [Google Scholar] [CrossRef]
  48. Tucker, G.E.; Bras, R.L. Hillslope processes, drainage density, and landscape morphology. Water Resour. Res. 1998, 34, 2751–2764. [Google Scholar] [CrossRef]
  49. Freeman, T. Calculating catchment area with divergent flow based on a regular grid. Comput. Geosci. 1991, 17, 413–422. [Google Scholar] [CrossRef]
  50. Kumar, S.; Vivekanand; Narjary, B.; Kumar, N.; Kaur, S.; Yadav, R.K.; Kamra, S.K. A GIS-based Methodology for Assigning a Flux Boundary to a Numerical Groundwater Flow Model and Its Effect on Model Calibration. J. Geol. Soc. India 2020, 96, 507–512. [Google Scholar] [CrossRef]
  51. Souei, A.; Zouaghi, T.; Khemiri, S. Lineament characterization for groundwater targeting using satellite images and field data. Earth Sci. Inform. 2022, 16, 455–479. [Google Scholar] [CrossRef]
  52. Sun, C.; Chen, W.; Shen, Y. The seasonal and spatial distribution of hydrochemical characteristics of groundwater and its controlling factors in the eastern Loess Plateau. Earth Sci. Inform. 2021, 14, 2293–2308. [Google Scholar] [CrossRef]
  53. Al-Juboury, A.I.; McCann, T. The middle Miocene Fatha (lower Fars) Formation, Iraq. GeoArabia 2008, 13, 141–174. [Google Scholar] [CrossRef]
  54. Choudhury, U.; Singh, S.K.; Kumar, A.; Meraj, G.; Kumar, P.; Kanga, S. Assessing Land Use/Land Cover Changes and Urban Heat Island Intensification: A Case Study of Kamrup Metropolitan District, Northeast India (2000–2032). Earth 2023, 4, 503–521. [Google Scholar] [CrossRef]
  55. Beg, A.A.F.; Awadh, S.M.; Thamer, M.B.; Al-Sulttani, A.H. Assessment of Groundwater Quality for Drinking Purposes Using Water Quality Index, and Identifying the Affecting Mechanism in Rashdiya, Central Iraq. Iraqi Geol. J. 2021, 54, 20–32. [Google Scholar] [CrossRef]
  56. Matenge, R.G.; Parida, B.P.; Letshwenyo, M.W.; Ditalelo, G. Impact of Climate Variability on Rainfall Characteristics in the Semi-Arid Shashe Catchment (Botswana) from 1981–2050. Earth 2023, 4, 398–441. [Google Scholar] [CrossRef]
  57. Anbarasu, S.; Brindha, K.; Elango, L. Multi-influencing factor method for delineation of groundwater potential zones using remote sensing and GIS techniques in the western part of Perambalur district, southern India. Earth Sci. Inform. 2019, 13, 317–332. [Google Scholar] [CrossRef]
  58. Liu, Y.; Guo, Y.; Long, L.; Lei, S. Soil Water Behavior of Sandy Soils under Semiarid Conditions in the Shendong Mining Area (China). Water 2022, 14, 2159. [Google Scholar] [CrossRef]
  59. Ziary, Y.; Safari, H.; Islamic Republic of Iran. To Compare Two Interpolation Methods: IDW, KRIGING for Providing Properties (Area) Surface Interpolation Map Land Price. District 5, Municipality of Tehran area 1. In Proceedings of the FIG Working Week, Hong Kong, 13 May 2007. [Google Scholar]
  60. Batelaan, O.; De Smedt, F. WetSpass: A flexible, GIS based, distributed recharge methodology for regional groundwater. In Impact of Human Activity on Groundwater Dynamics, Proceedings of the An International Symposium (Symposium S3) Held During the Sixth Scientific Assembly of the International Association of Hydrological Sciences (IAHS), Maastricht, The Netherlands, 18–27 July 2001; International Assn of Hydrological Sciences: Maastricht, The Netherlands, 2001; p. 11. [Google Scholar]
  61. Rather, A.F.; Ahmed, R.; Wani, G.F.; Ahmad, S.T.; Dar, T.; Javaid, S.; Ahmed, P. Mapping of groundwater potential zones in Pohru Watershed of Jhelum Basin-Western Himalaya, India using integrated approach of remote sensing, GIS and AHP. Earth Sci. Inform. 2022, 15, 2091–2107. [Google Scholar] [CrossRef]
  62. Das, S.; Mukherjee, J.; Bhattacharyya, S.; Patel, P.P.; Banerjee, A. Detection of groundwater potential zones using analytical hierarchical process (AHP) for a tropical river basin in the Western Ghats of India. Environ. Earth Sci. 2022, 81, 416. [Google Scholar] [CrossRef]
  63. Ghosh, B. Spatial mapping of groundwater potential using data-driven evidential belief function, knowledge-based analytic hierarchy process and an ensemble approach. Environ. Earth Sci. 2021, 80, 625. [Google Scholar] [CrossRef]
  64. Turkish-Meteorological-Data. Available online: https://mgm.gov.tr/eng/yearly-climate.aspx1990-2021 (accessed on 23 October 2022).
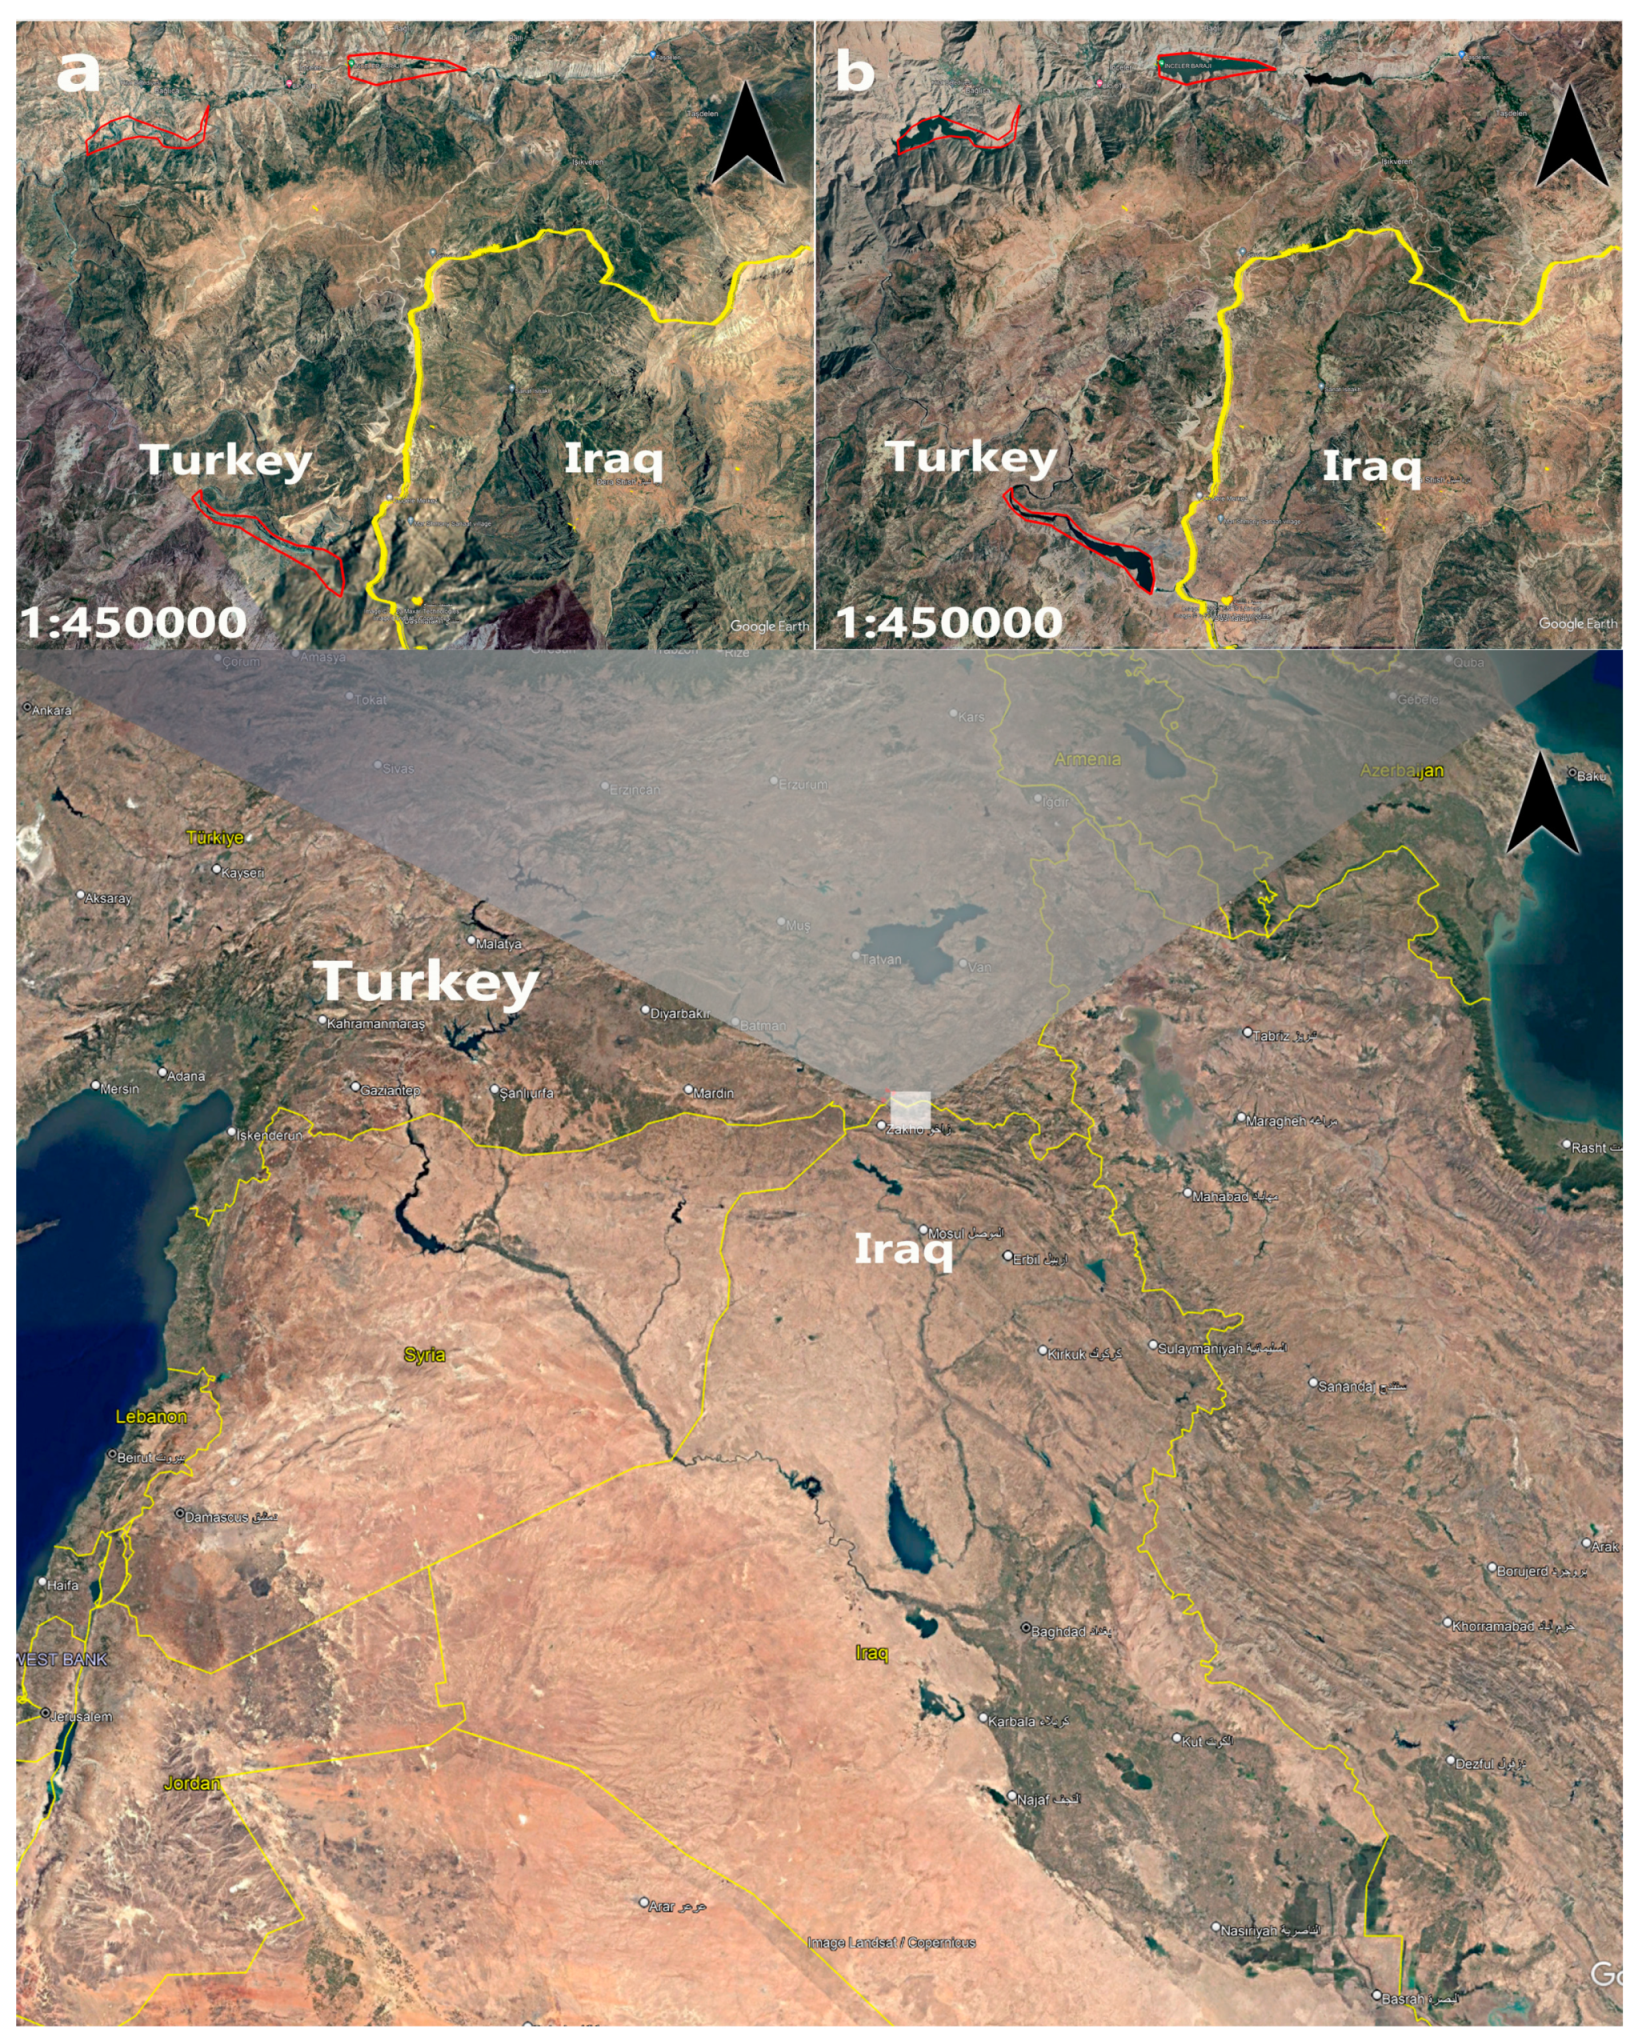
Figure 1. Dam building in Turkey (a) 2015; (b) 2022 (Google Earth 2023).
Earth 04 00034 g001
Figure 2. Location of the study area; (a) Iraq, (b) Duhok province, (c) Zakho region.
Earth 04 00034 g002
Figure 3. Flow chart showing the methods and factors used in this study.
Earth 04 00034 g003
Figure 4. Flow direction map.
Earth 04 00034 g004
Figure 5. Factor thematic map: (a) drainage density (km/km²); (b) flow accumulation (km/km²); (c) lineament density (km/km²); (d) geology; (e) land use/land cover; (f) rainfall (mm/year); (g) soil type; (h) well data; (i) slope (degrees).
Earth 04 00034 g005
Figure 6. Final GWPI map of Zakho, along with the location of validation dataset (30%) of wells.
Earth 04 00034 g006
Figure 7. Square regression validation result.
Earth 04 00034 g007
Figure 8. ROC–AUC validation results.
Earth 04 00034 g008
Table 1. Factors involved in this study and the AHP.
Data LayerSourceResolution/ScaleDate AcquiredDescription
Rainfall Data (RF)Kurdistan National Weather Service30 m2000–2020Historical weather data including temperature, precipitation, and climate factors.
Soil Type (SL)FAO—Soil Survey Database30 mMarch 2021Classification of soil types based on texture, moisture content, and permeability.
Land Use/Land Cover (LUC)Satellite Imagery/Site Survey30 mOctober 2021Categorization of land use and land cover, including urban, agricultural, and forested areas.
Geology (G)World Geologic Map/Iraq Geology Survey Association1:50,000 scaleJune 2022Topographic analysis of the study area, identifying landforms and their characteristics.
Accumulation Flow (AccFl)Hydrological Datasets30 mJuly 2021Runoff surface water accumulation in the region.
Slope (S)Satellite Imagery/Digital Elevation Module30 mJuly 2021The slope feature of the Zakho area shows steep areas to gentle areas.
Drainage Density (DD)Hydrological Datasets30 mAugust 2020Measurement of stream density, indicating the presence of surface water in the region.
Lineament Density (LD)Remote Sensing Imagery30 mNovember 2021Identification of linear features such as faults and fractures that influence groundwater flow.
Dynamic Well Data (WD) Groundwater Directorate of ZakhoPoint dataJuly 2021The recorded dynamic of groundwater in various locations.
Table 2. Pairwise comparison matrix of nine factors for the AHP process.
FACTORSACCFLDDWDLDLUCSLGRF
S111122233
ACCFL0.511112333
DD0.511232233
WD0.510.5133334
LD0.50.50.3330.33313344
LUC0.50.50.50.3330.3331444
SL0.330.330.50.3330.3330.5145
G0.330.3330.330.3330.3330.250.2515
RF0.330.330.330.250.250.250.250.21
Table 3. Random consistency index (RI).
Size of Matrix (n)Random Consistency Index (RI)
10
20
30.52
40.89
51.11
61.25
71.35
81.4
91.45
101.49
Table 4. Classification and standardization of Factors.
FactorsWeightClassificationOverallStandardization
Slope
Very Low23.0425115.21100
Low492.16875
Moderate369.12650
High246.08425
Very High123.0420
Accumulation Flow
Very High19.702598.51100
High478.80875
Moderate359.10650
Low239.40425
Very Low119.7020
Drainage Density
Very High16.537582.685100
High466.14875
Moderate349.61150
Low233.07425
Very Low116.5370
Well Data
Very High12.659563.295100
High450.63675
Moderate337.97750
Low225.31825
Very Low112.6590
Lineament Density
Very High8.64543.2100
High434.5675
Moderate325.9250
Low217.2825
Very Low217.2825
Land Use/Land Cover
Water6.691533.455100
Vegitation426.76475
Soil533.455100
Sparse320.07350
Rocks213.38225
Built-Up Area16.6910
Croplands426.76475
Soil
Sandy Loam5.517527.585100
Loam422.068100
Caly Loam316.55175
Clay211.03450
Geology
Recent Deposit3.999519.995100
Dolomitic Limestone27.99825
Jurassic Gypsum311.99750
Dolomitic Shale27.99825
Sand Clay Recent415.99675
Limestone Shale27.99825
Rainfall
Very High3.213516.065100
High412.85275
Moderate39.63950
Low26.42625
Very Low13.2130
(S) slope, (AccFl) flow accumulation, (DD) drainage density, (WD) well data, (LD) lineament density, (LUC) land use/land cover, (SL) soil, (G) geology, and (RF) rainfall.
Table 5. Normalized weights for the nine factors from the pairwise matrix.
SACCFLDDWDLDLUCSLGRF
S0.13330.20.1670.220.20.10.080.060.05
ACCFL0.06670.120.1670.120.20.10.080.060.05
DD0.06670.050.0850.120.10.10.080.060.05
WD0.06670.120.0050.120.10.190.160.150.14
LD0.06670.0530.0850.120.10.190.160.150.14
LUC0.13330.120.0850.060.0510.10.160.1670.16
SL0.13330.10.0850.060.050.050.080.1670.16
G0.13330.10.0850.060.050.040.080.060.16
RF0.13330.110.0850.060.050.040.0370.0270.05
TOTAL0.93330.9730.9290.940.9010.910.9170.9010.96
Disclaimer/Publisher’s Note: The statements, opinions and data contained in all publications are solely those of the individual author(s) and contributor(s) and not of MDPI and/or the editor(s). MDPI and/or the editor(s) disclaim responsibility for any injury to people or property resulting from any ideas, methods, instructions or products referred to in the content.