

Land Use Land Cover (LULC) Change Dynamics Associated with Mining Activities in Kitwe District and Adequacy of the Legal Framework on Mine Closure in Zambia


Abstract
1. Introduction
2. Data and Methods
2.1. Study Area
2.1.1. Kitwe District
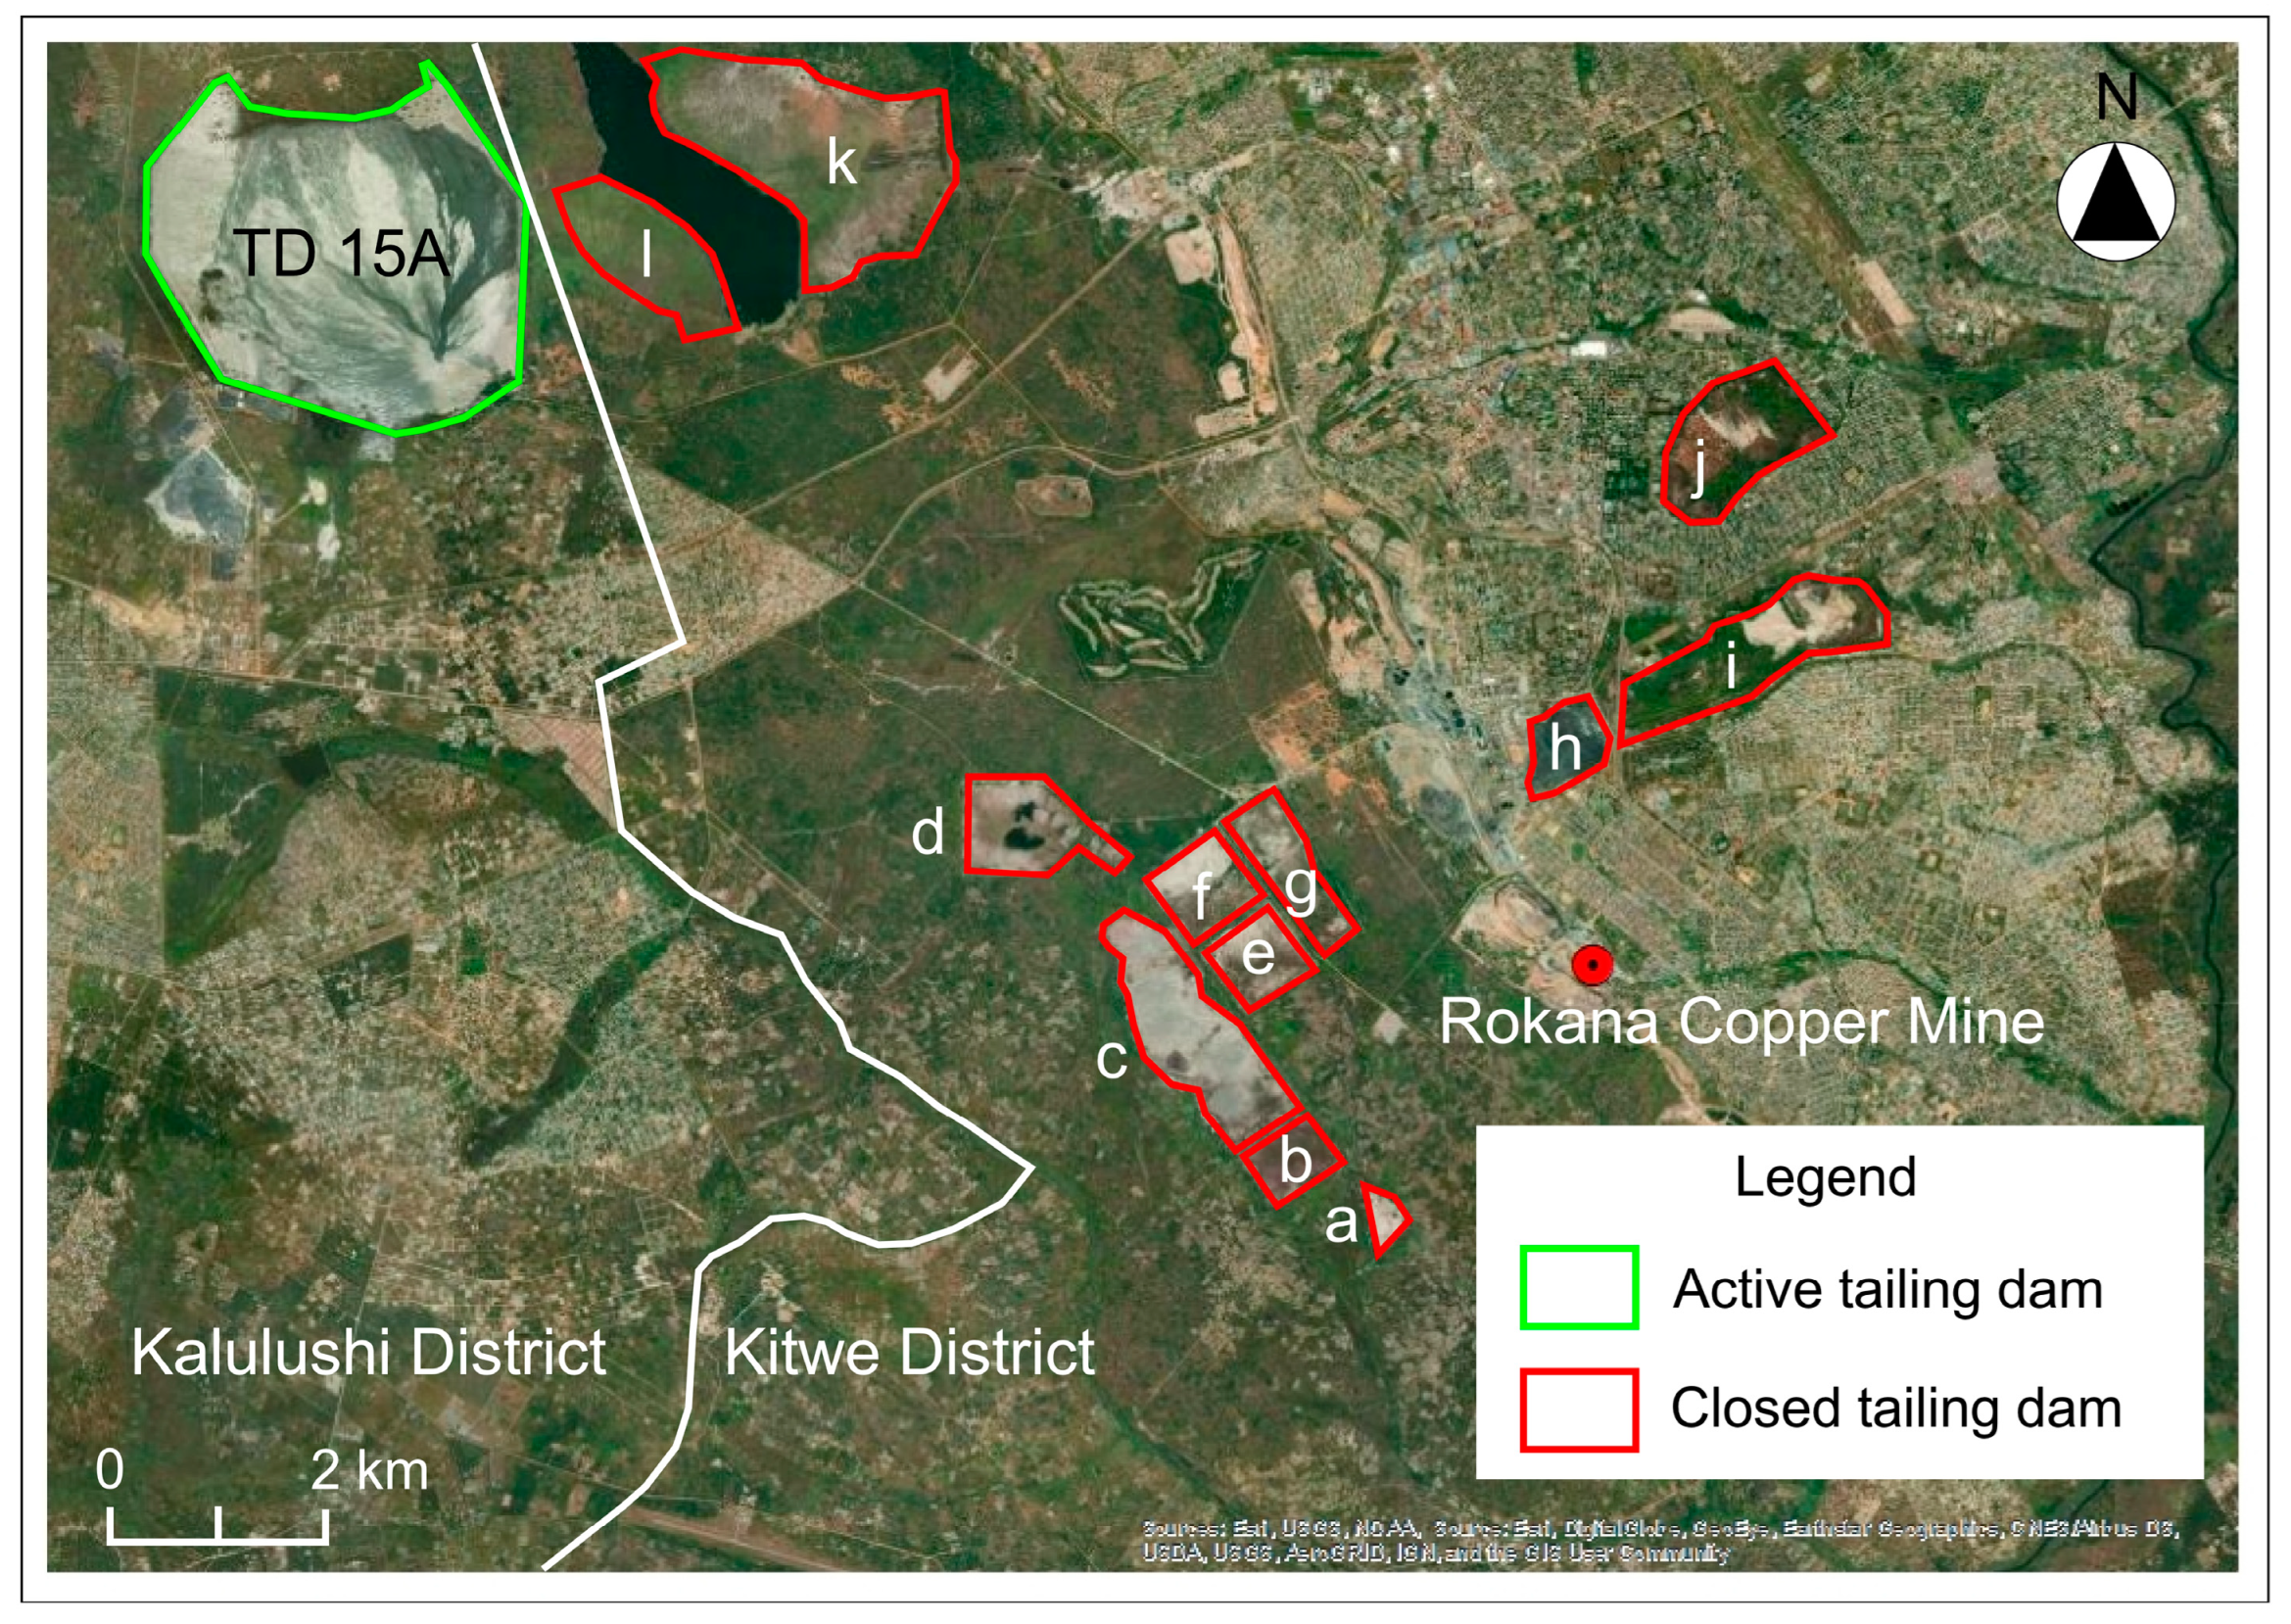
2.1.2. Rokana Mine
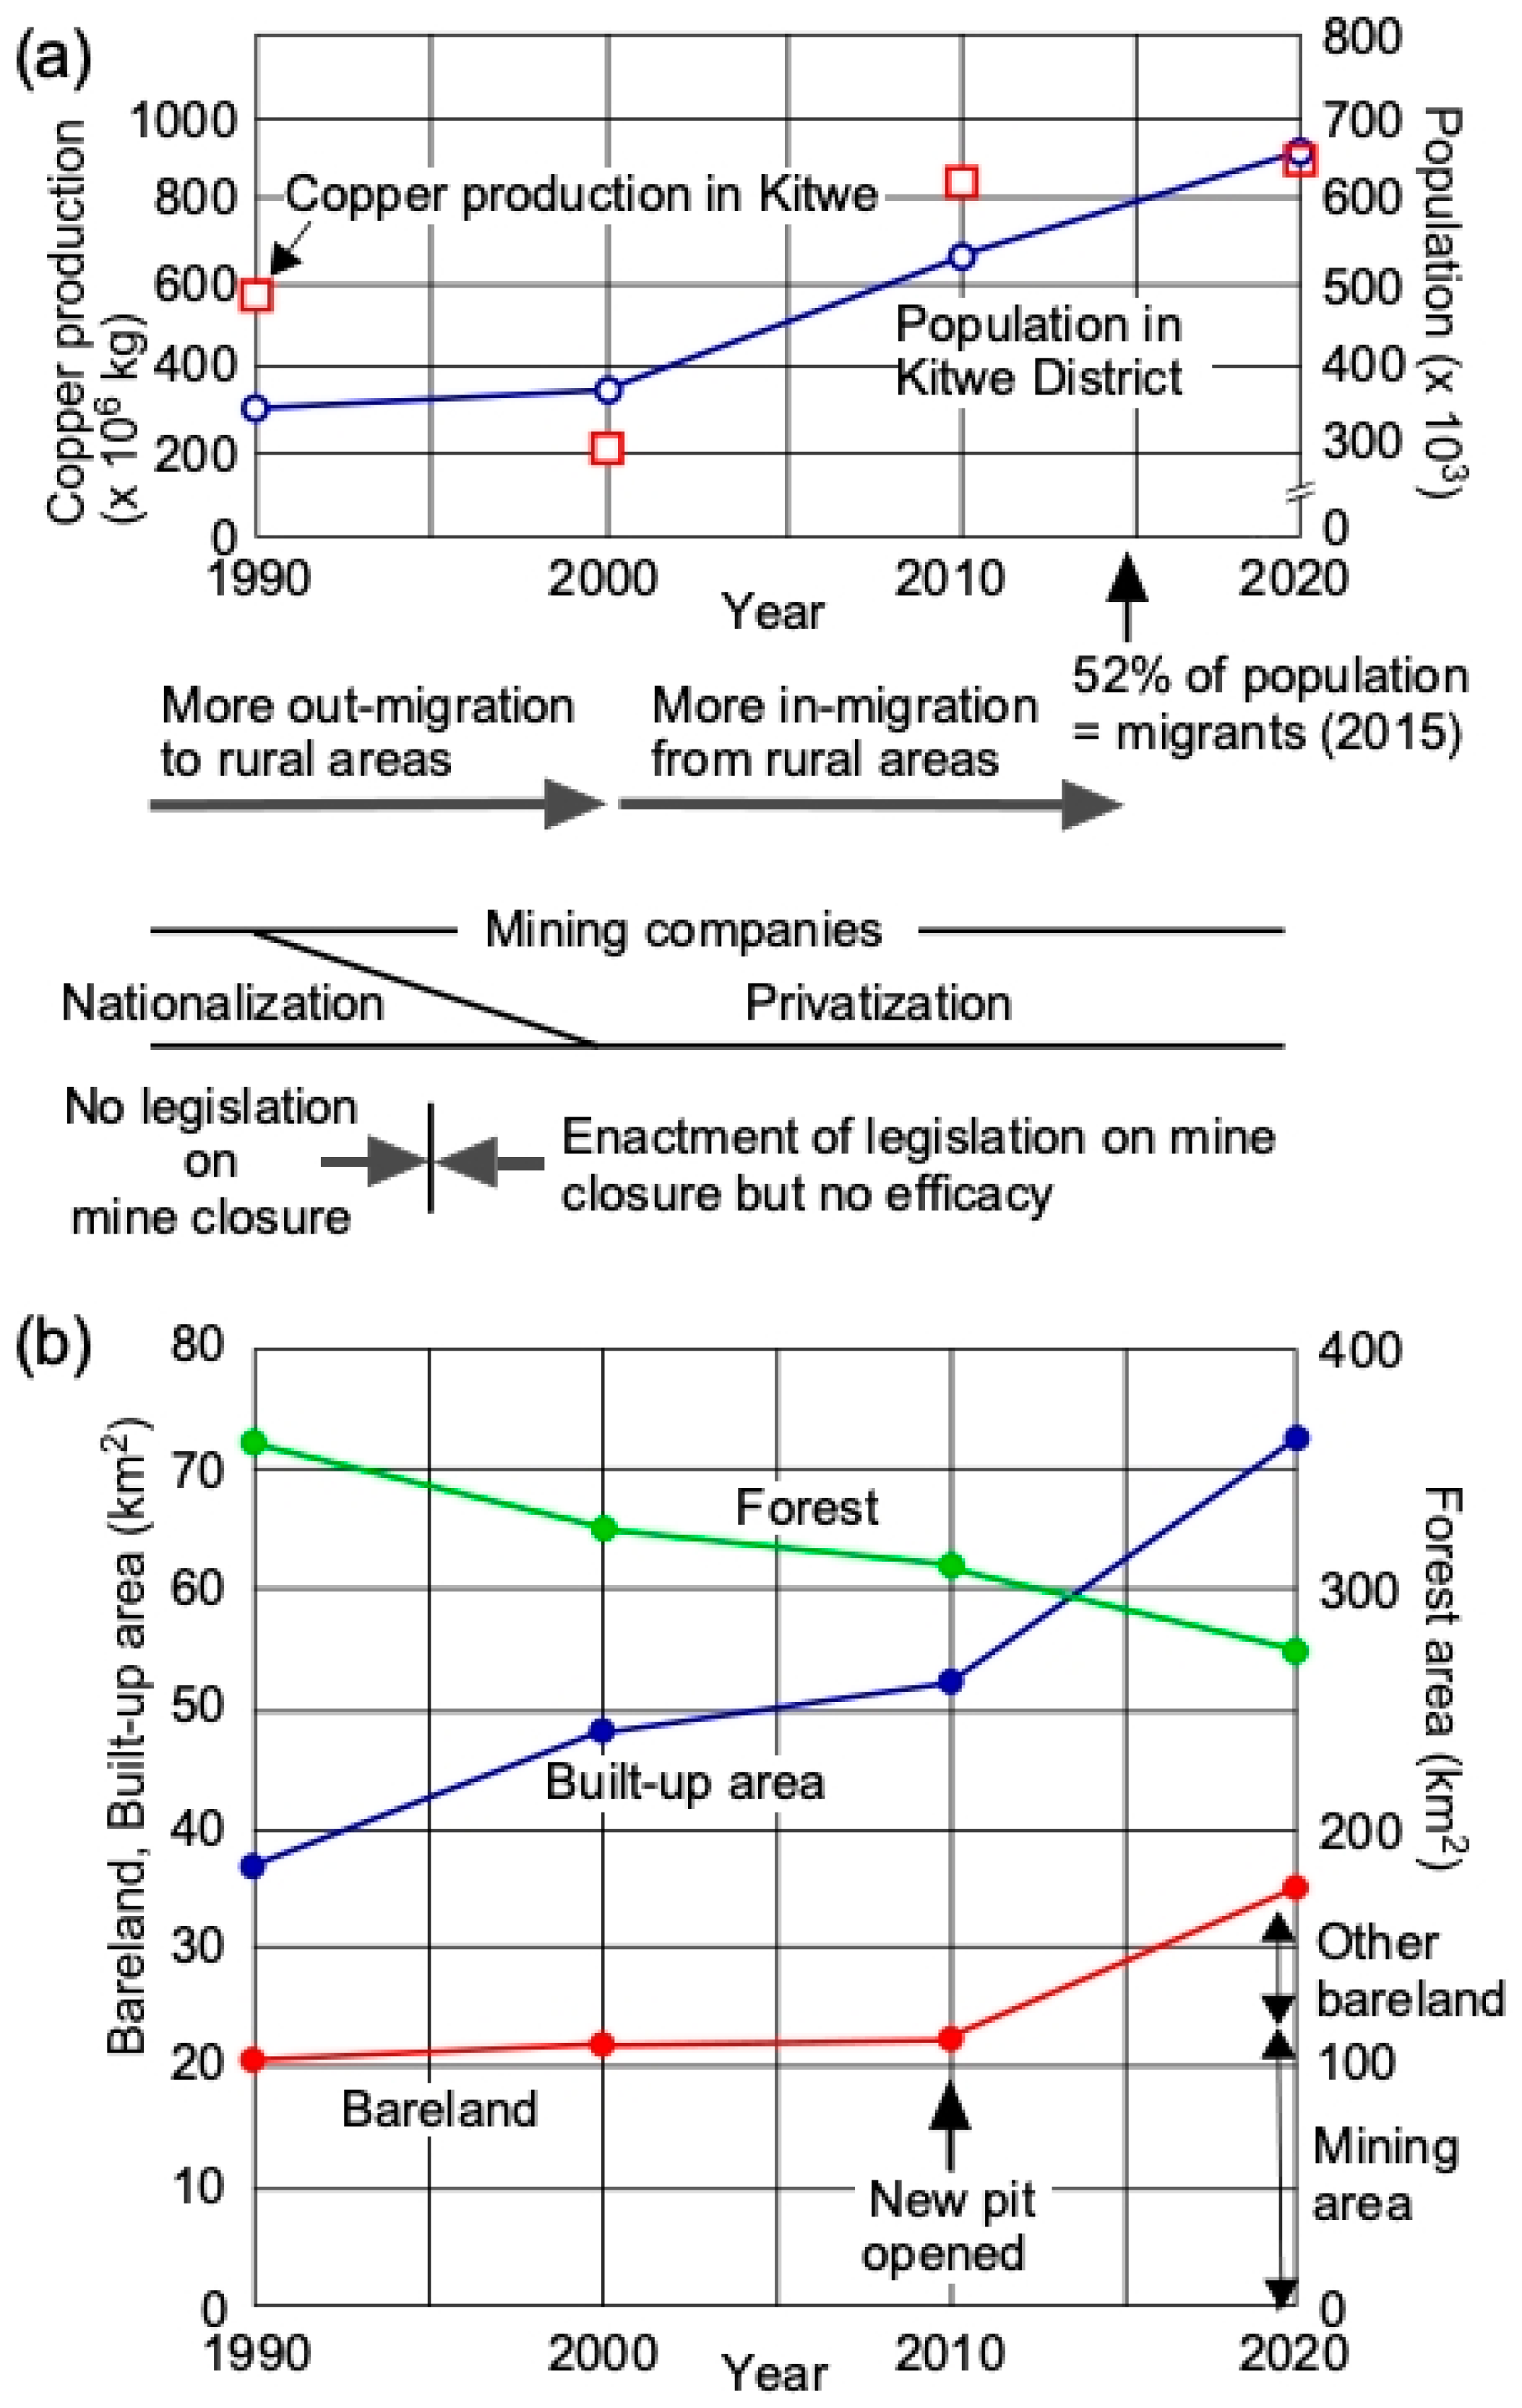
2.1.3. Kitwe District Population
2.2. Remote Sensing Analysis (Landsat Imagery and Processing)
2.3. LULC Classification
2.4. Determination of the Mining Areas
2.5. Validation
2.6. Class Smoothing Process
2.7. Field Survey and Accuracy Assessment
2.8. Collecting Legal Documents on Mine Closure
3. Results
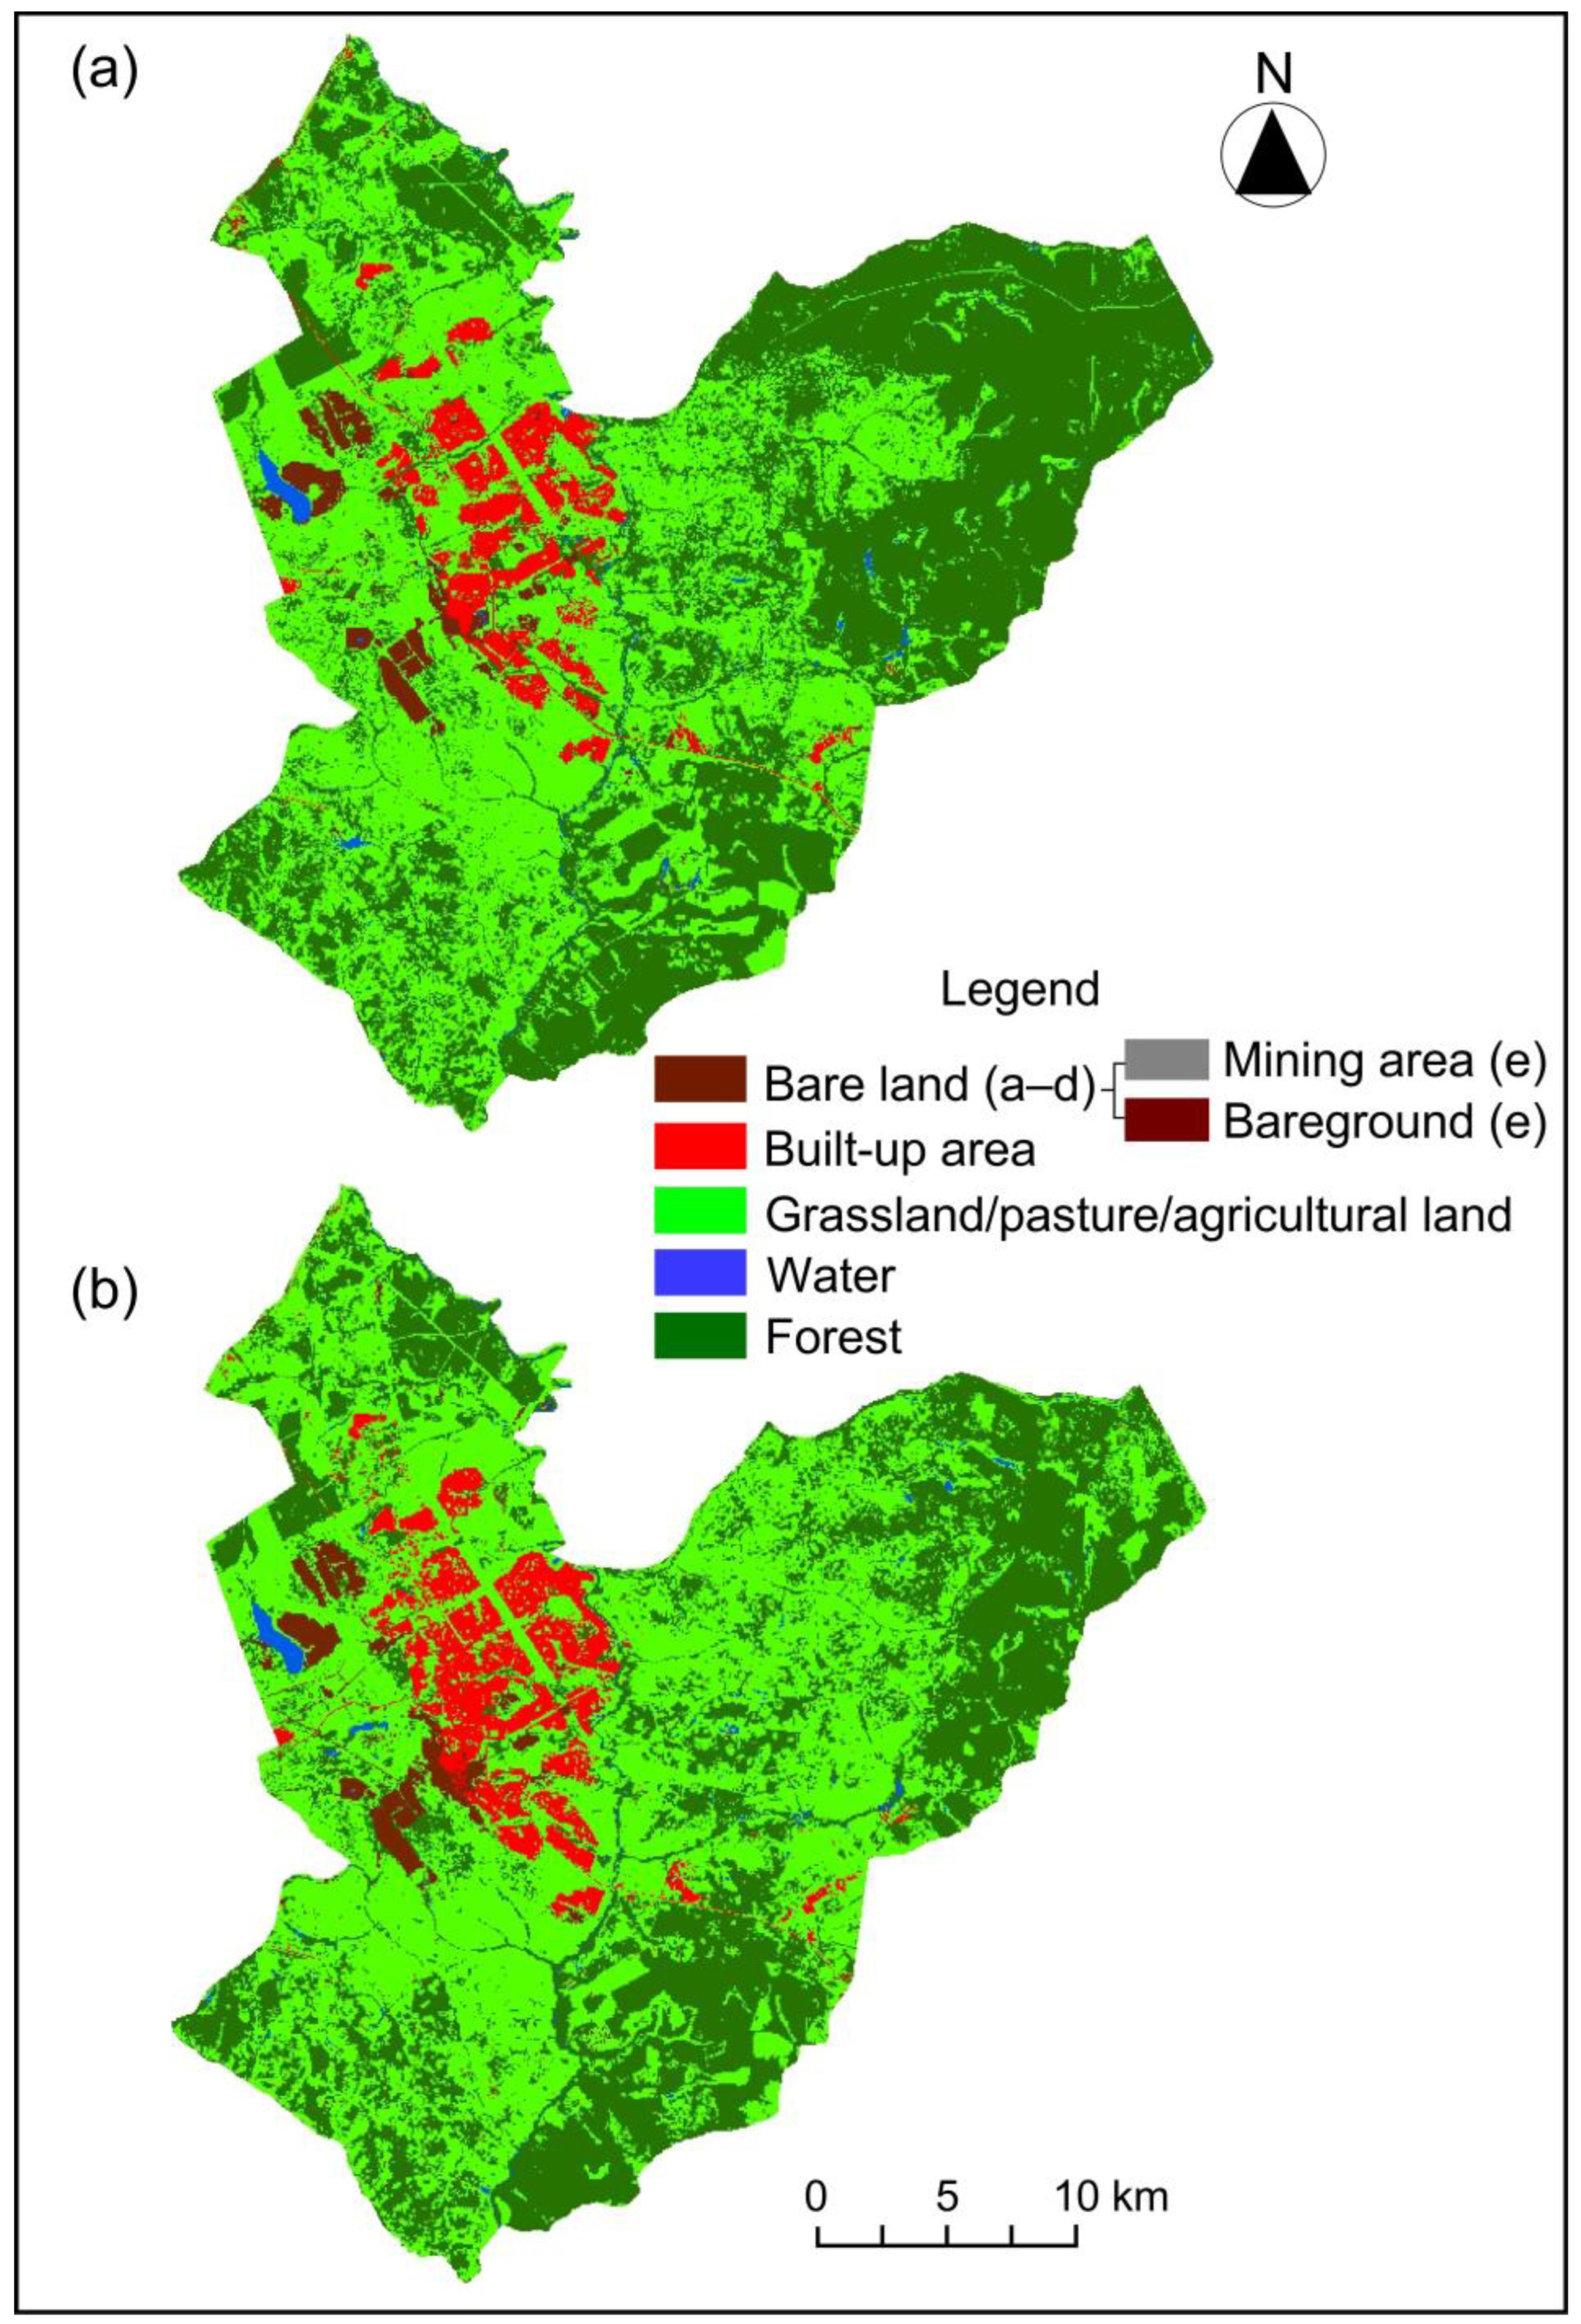
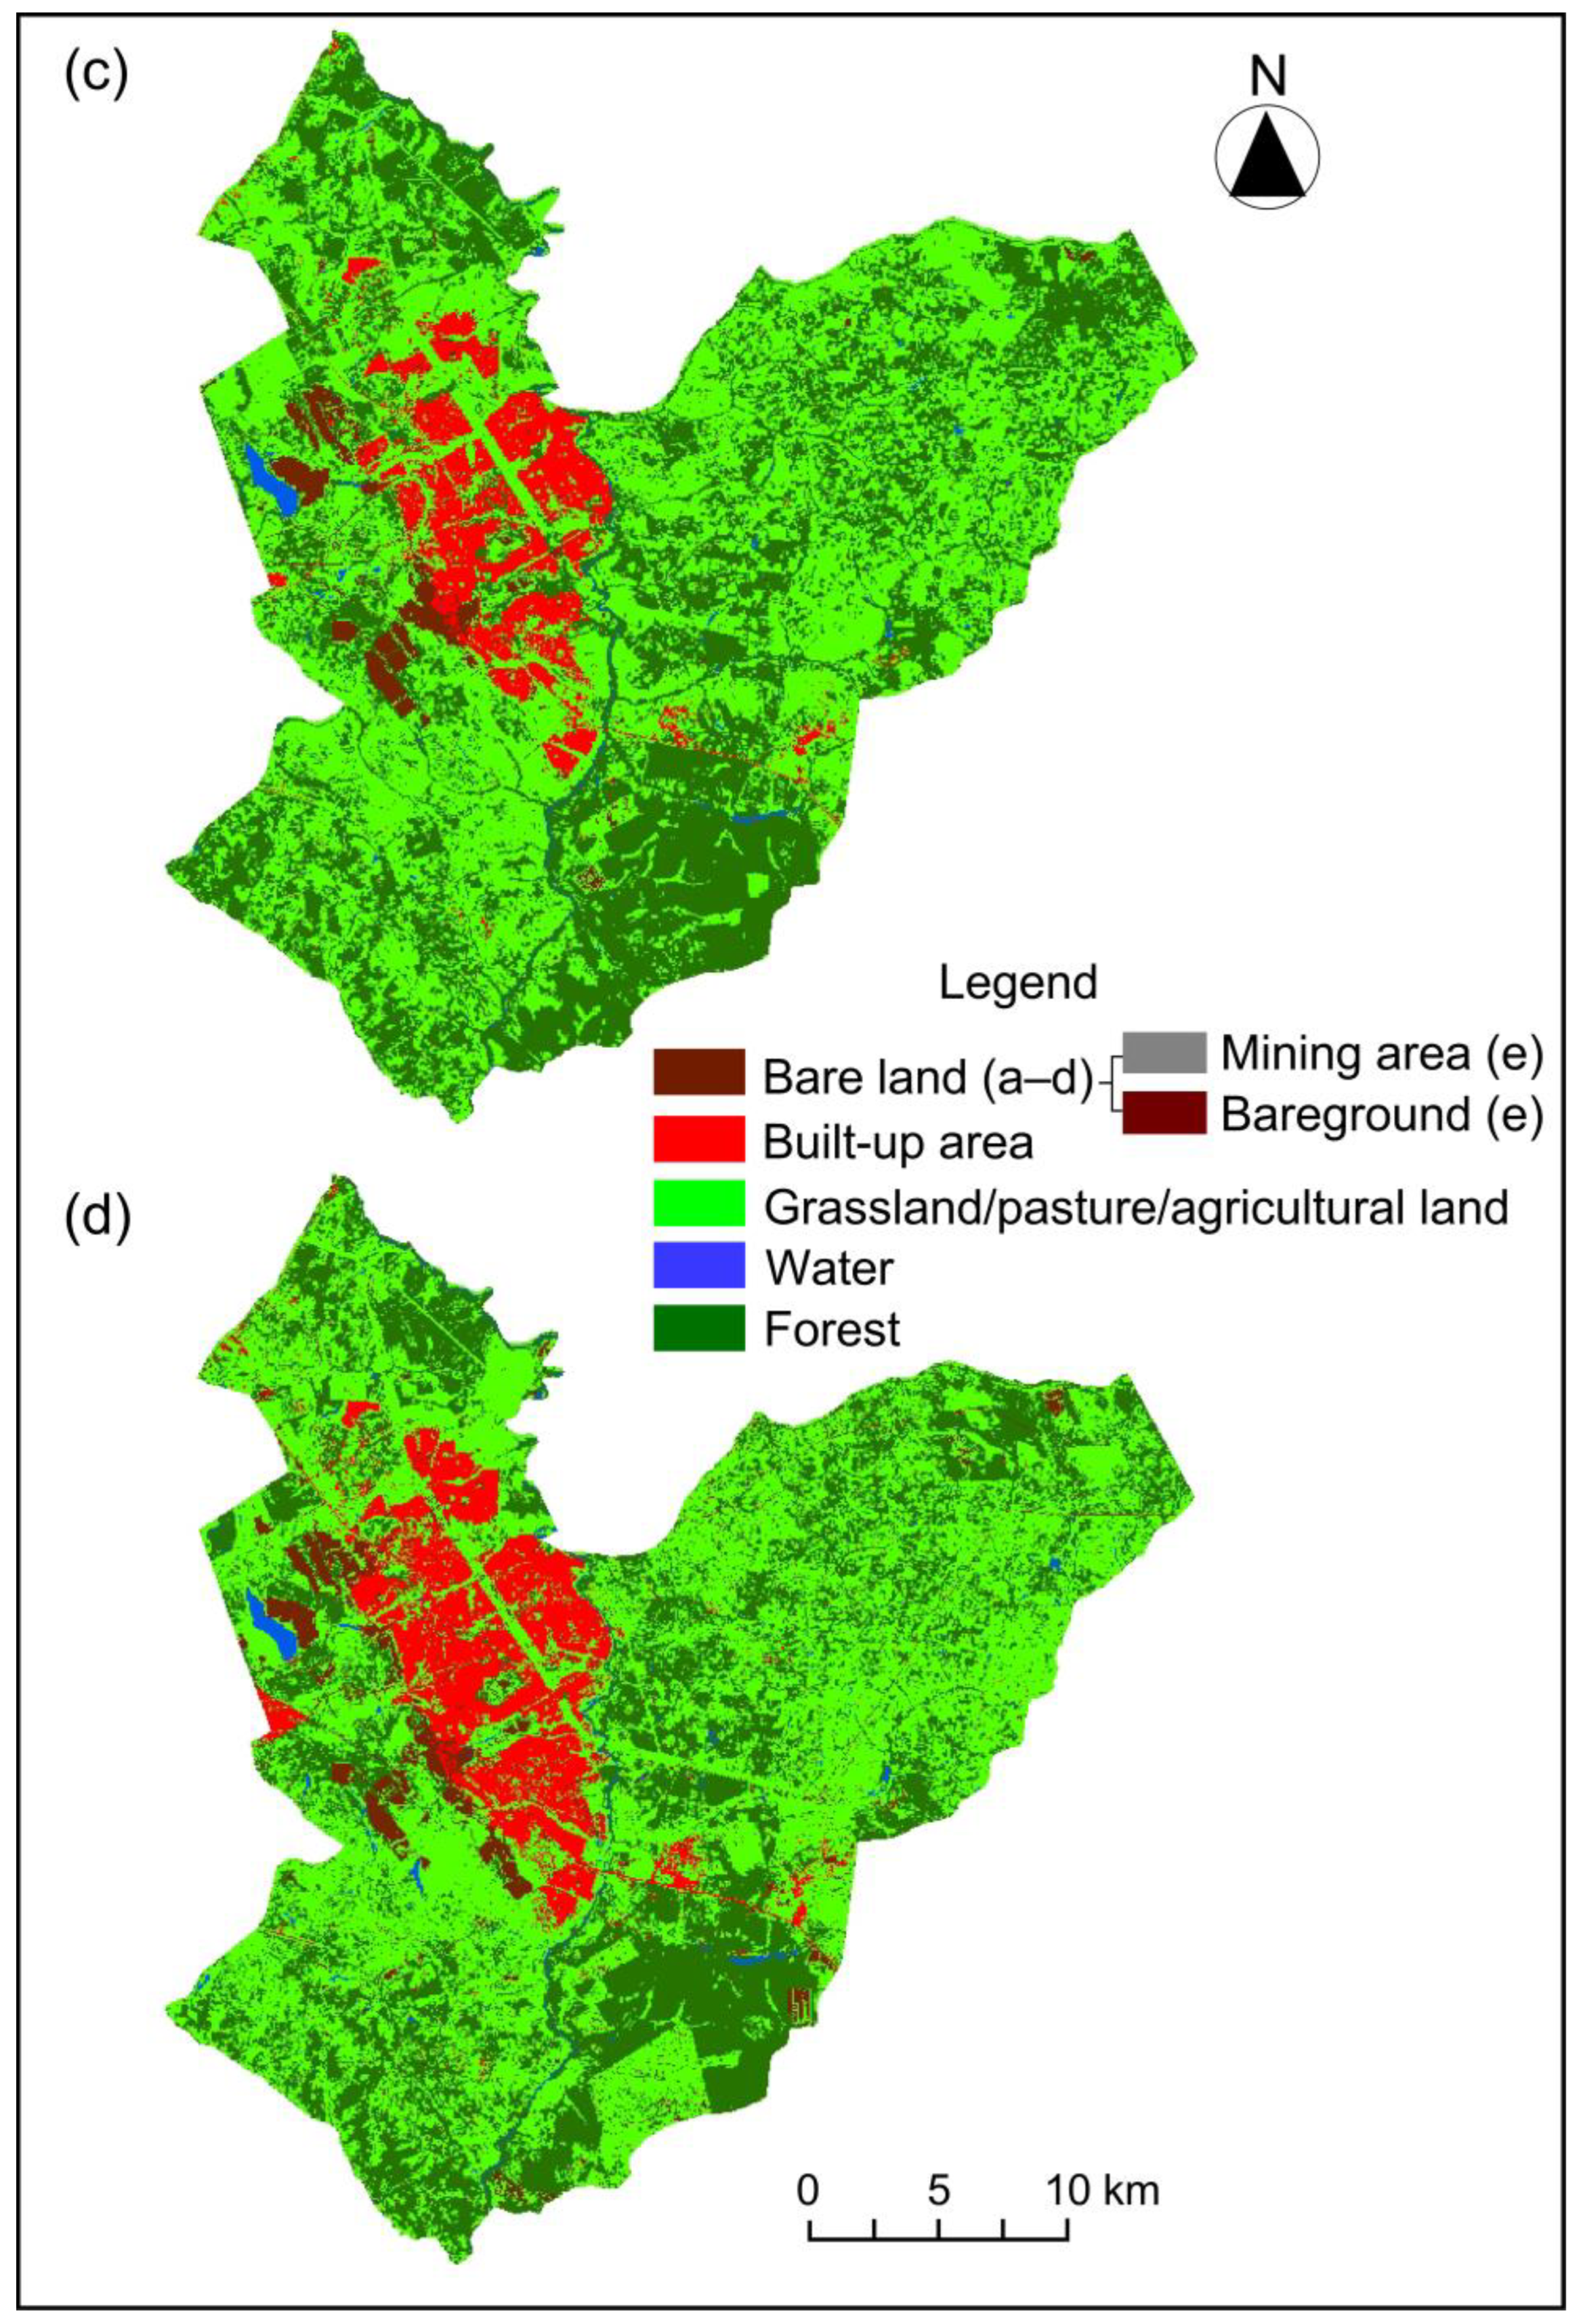
3.1. LULC Classification
3.2. Field Survey and Accuracy Assessment
3.3. LULC Changes
3.3.1. LULC Changes in Kitwe District
3.3.2. LULC Changes Related to Mining Activities
4. Mine Closure Legislation in Zambia
4.1. Status of Mine Closure Legislation
4.2. Statutes Applicable to Mine Closure in Zambia
4.3. Assessment of the Legal Framework on Mine Closure
5. Discussion
6. Conclusions
Author Contributions
Funding
Data Availability Statement
Acknowledgments
Conflicts of Interest
References
- Twisa, S.; Buchroithner, M.F. Land-use and land-cover (LULC) change detection in Wami river basin, Tanzania. Land 2019, 8, 136. [Google Scholar] [CrossRef]
- Rawat, J.S.; Biswas, V.; Kumar, M. Changes in land use/cover using geospatial techniques: A case study of Ramnagar town area, district Nainital, Uttarakhand, India. Egypt. J. Remote Sens. Space Sci. 2013, 16, 111–117. [Google Scholar] [CrossRef]
- Lambin, E.F.; Turner, B.L.; Geist, H.J.; Agbola, S.B.; Angelsen, A.; Bruce, J.W.; Coomes, O.T.; Dirzo, R.; Fischer, G.; Folke, C.; et al. The causes of land-use and land-cover change: Moving beyond the myths. Glob. Environ. Chang. 2001, 11, 261–269. [Google Scholar] [CrossRef]
- Xiao, W.; Lv, X.; Zhao, Y.; Sun, H.; Li, J. Ecological resilience assessment of an arid coal mining area using index of entropy and linear weighted analysis: A case study of Shendong Coalfield, China. Ecol. Indic. 2020, 109, 105843. [Google Scholar] [CrossRef]
- Wang, S.W.; Gebru, B.M.; Lamchin, M.; Kayastha, R.B.; Lee, W.K. Land use and land cover change detection and prediction in the Kathmandu district of Nepal using remote sensing and GIS. Sustainability 2020, 12, 3925. [Google Scholar] [CrossRef]
- Mensah, J. Sustainable development: Meaning, history, principles, pillars, and implications for human action: Literature review. Cogent Soc. Sci. 2019, 5, 1653531. [Google Scholar] [CrossRef]
- Xiao, W.; Deng, X.; He, T.; Chen, W. Mapping annual land disturbance and reclamation in a surface coal mining region using google earth engine and the landtrendr algorithm: A case study of the shengli coalfield in Inner Mongolia, China. Remote Sens. 2020, 12, 1612. [Google Scholar] [CrossRef]
- Schladweiler, B.K. 40 years of the Surface Mining Control and Reclamation Act (SMCRA): What have we learned in the State of Wyoming. Int. J. Coal Sci. Technol. 2018, 5, 3–7. [Google Scholar] [CrossRef][Green Version]
- Carvalho, F.P. Mining industry and sustainable development: Time for change. Food Energy Secur. 2017, 6, 61–77. [Google Scholar] [CrossRef]
- Song, W.; Song, W.; Gu, H.; Li, F. Progress in the remote sensing monitoring of the ecological environment in mining areas. Int. J. Environ. Res. Public Health 2020, 17, 1846. [Google Scholar] [CrossRef]
- Wu, B.; Zhao, Y.; Fang, C. Detection of spatiotemporal changes of surface mining area in Changting County Southeast China. In Proceedings of the IGARSS 2019–2019 IEEE International Geoscience and Remote Sensing Symposium, Yokohama, Japan, 28 July–2 August 2019; pp. 1606–1609. [Google Scholar] [CrossRef]
- Sikamo, J.; Mwanza, A.; Mweemba, C. Copper mining in Zambia—History and future. J. South. Afr. Inst. Min. Metall. 2016, 116, 491–496. [Google Scholar] [CrossRef]
- Perera, N.P. Mining and spoiled land in Zambia: An example of conflicting land use in the third world. GeoJournal 1981, 2, 95–103. [Google Scholar] [CrossRef]
- Limpitlaw, D. Mine Closure in the Zambian Copperbelt: Scenarios for Sustainable Development. In Proceedings of the SAIMM’s Mine Closure Colloquium, Saxonwold, South Africa, 17 June 2003. [Google Scholar]
- Limpitlaw, D. Mapping Mining Waste and Environmental Impacts in Zambia with Landsat. In Proceedings of the 4th European Congress on Regional Scientific Cartography and Information Systems, Bolga, Norway, 17–20 June 2003; Volume 2, pp. 699–971. [Google Scholar]
- Limpitlaw, D.; Woldai, T. Land Use Change Detection as an Initial Stage in Environmental Impact Assessment on the Zambian Copperbelt. In Proceedings of the 28th ISRSE: Information for Sustainable Development, Cape Town, South Africa, 27–31 March 2000. [Google Scholar]
- Chirambo, B. Management of Post Closure Social and Environmental Issues in the Extractive Industry: A Case of Zambia; University of Reading: Reading, UK, 2010. [Google Scholar]
- Clark, A.L.; Clark, J.C. An International Overview of Legal Frameworks for Mine Closure. 2005. Available online: https://www.sciencebase.gov/catalog/item/5140ac89e4b089809dbf5599 (accessed on 27 March 2024).
- Broughton, D.W. Geology and ore deposits of the central African Copperbelt. Econ. Geol. 1936, 31, 93–103. [Google Scholar] [CrossRef]
- Britannica. Kitwe, Zambia. Britannica. Available online: https://www.britannica.com/place/Kitwe (accessed on 24 August 2020).
- Tunatazama. Copper Belt/Former Copper Mining Centre in Kitwe, under New Attack, This Time by Illegal and Small Scale Mining. Available online: http://communitymonitors.net/2018/06/former-copper-mining-centre-in-kitwe-under-new-attack-this-time-by-illegal-and-small-scale-mining/ (accessed on 24 August 2020).
- Munene, H. A History of Rhokana/Rokana Corporation and Its Nkana Mine Division. Ph.D. Thesis, University of the Free State, Bloemfontein, South Africa, 2018. [Google Scholar]
- CSO. 2010 Census of Population and Housing: Population Summary Report; Central Statistical Office: Lusaka, Zambia, 2012. [Google Scholar]
- ZSA. 2022 Census of Population and Housing: Population Summary Report; Zambia Statistics Agency: Lusaka, Zambia, 2022. [Google Scholar]
- Mwitwa, J.; Sibajene, M.; Chipoya, G.C.; Namiluko, Y. City Region Food System Situational Analysis, Kitwe, Zambia; FAO: Rome, Italy, 2016. [Google Scholar]
- Liu, S.; Li, X.; Chen, D.; Duan, Y.; Ji, H.; Zhang, L.; Chai, Q.; Hu, X. Understanding land use/land cover dynamics and impacts of human activities in the Mekong Delta over the last 40 years. Glob. Ecol. Conserv. 2020, 22, e00991. [Google Scholar] [CrossRef]
- USGS (United States Geological Survey). Landsat Collection 1 Level 1 Product Definition. Version 2.0. United States Geological Survey, Department of Interior 2019, Version 2.0. Available online: https://www.usgs.gov/media/files/landsat-collection-1-level-1-product-definition (accessed on 9 November 2023).
- Xiong, J.; Thenkabail, P.S.; Tilton, J.C.; Gumma, M.K.; Teluguntla, P.; Oliphant, A.; Congalton, R.G.; Yadav, K.; Gorelick, N. Nominal 30-m cropland extent map of continental Africa by integrating pixel-based and object-based algorithms using Sentinel-2 and Landsat-8 data on google earth engine. Remote Sens. 2017, 9, 1065. [Google Scholar] [CrossRef]
- Du, Y.; Teillet, P.M.; Cihlar, J. Radiometric normalization of multitemporal high-resolution satellite images with quality control for land cover change detection. Remote Sens. Environ. 2002, 82, 123–134. [Google Scholar] [CrossRef]
- Chander, G.; Markham, B.L.; Helder, D.L. Summary of current radiometric calibration coefficients for Landsat MSS, TM, ETM+, and EO-1 ALI sensors. Remote Sens. Environ. 2009, 113, 893–903. [Google Scholar] [CrossRef]
- Chander, G.; Markham, B.L.; Barsi, J.A. Revised landsat-5 thematic mapper radiometric calibration. IEEE Geosci. Remote Sens. Lett. 2007, 4, 490–494. [Google Scholar] [CrossRef]
- Maas, S.J.; Rajan, N. Normalizing and converting image DC data using scatter plot matching. Remote Sens. 2010, 2, 1644–1661. [Google Scholar] [CrossRef]
- Song, C.; Woodcock, C.E.; Seto, K.C.; Lenney, M.P.; Macomber, S.A. Classification and change detection using Landsat TM data: When and how to correct atmospheric effects? Remote Sens. Environ. 2001, 75, 230–244. [Google Scholar] [CrossRef]
- Yarbrough, L.D.; Navulur, K.; Ravi, R. Presentation of the kauth-thomas transform for Worldview-2 reflectance data. Remote Sens. Lett. 2014, 5, 131–138. [Google Scholar] [CrossRef]
- Firozjaei, M.K.; Alavipanah, S.K.; Liu, H.; Sedighi, A.; Mijani, N.; Kiavarz, M.; Weng, Q. A PCA-OLS model for assessing the impact of surface biophysical parameters on land surface temperature variations. Remote Sens. 2019, 11, 2094. [Google Scholar] [CrossRef]
- Aguilar, R.; Zurita-Milla, R.; Izquierdo-Verdiguier, E.; de By, R.A. A cloud-based multi-temporal ensemble classifier to map smallholder farming systems. Remote Sens. 2018, 10, 729. [Google Scholar] [CrossRef]
- Crawford, C.J.; Manson, S.M.; Bauer, M.E.; Hall, D.K. Multitemporal snow cover mapping in mountainous terrain for Landsat climate data record development. Remote Sens. Environ. 2013, 135, 224–233. [Google Scholar] [CrossRef]
- Hu, Y.; Dong, Y. Anautomatic approach for land-change detection and land updates based on integrated NDVI timing analysis and the CVAPS method with GEE support. ISPRS J. Photogramm. Remote Sens. 2018, 146, 347–359. [Google Scholar] [CrossRef]
- Dong, J.; Xiao, X.; Menarguez, M.A.; Zhang, G.; Qin, Y.; Thau, D.; Biradar, C.; Moore, B.I. Mapping paddy rice planting area in northeastern Asia with Landsat 8 images, phenology-based algorithm and Google Earth Engine. Physiol. Behav. 2019, 176, 139–148. [Google Scholar] [CrossRef] [PubMed]
- Orengo, H.A.; Petrie, C.A. Large-scale, multi-temporal remote sensing of palaeo-river networks: A case study from Northwest India and its implications for the Indus civilisation. Remote Sens. 2017, 9, 735. [Google Scholar] [CrossRef]
- White, J.C.; Wulder, M.A.; Hobart, G.W.; Luther, J.E.; Hermosilla, T.; Griffiths, P.; Coops, N.C.; Hall, R.J.; Hostert, P.; Dyk, A. Pixel-based image compositing for large-area dense time series applications and science. Can. J. Remote Sens. 2014, 40, 192–212. [Google Scholar] [CrossRef]
- Goldblatt, R.; You, W.; Hanson, G.; Khandelwal, A.K. Detecting the boundaries of urban areas in India: A dataset for pixel-based image classification in google earth engine. Remote Sens. 2016, 8, 634. [Google Scholar] [CrossRef]
- Shelestov, A.; Lavreniuk, M.; Kussul, N.; Novikov, A.; Skakun, S. Exploring Google Earth Engine platform for big data processing: Classification of multi-temporal satellite imagery for crop mapping. Front. Earth Sci. 2017, 5, 232994. [Google Scholar] [CrossRef]
- Pelletier, C.; Valero, S.; Inglada, J.; Champion, N.; Dedieu, G. Assessing the robustness of random forests to map land cover with high resolution satellite image time series over large areas. Remote Sens. Environ. 2016, 187, 156–168. [Google Scholar] [CrossRef]
- Deilmai, B.R.; Ahmad, B.; Zabihi, H. Comparison of two Classification methods (MLC and SVM) to extract land use and land cover in Johor Malaysia. IOP Conf. Ser. Earth Environ. Sci. 2014, 20, 012052. [Google Scholar] [CrossRef]
- Atik, C.; Kut, R.A.; Yilmaz, R.; Birant, D. Support Vector Machine Chains with a Novel Tournament Voting. Electronics 2023, 12, 2485. [Google Scholar] [CrossRef]
- Vapnik, V.N. The Nature of Statistical Learning Theory, 2nd ed.; Springer: New York, NY, USA, 1995. [Google Scholar]
- Kotsiantis, S.B. Supervised machine learning: A review of classification techniques. Hyperfine Interact. 2007, 237, 3–24. [Google Scholar] [CrossRef]
- Janssen, L.L.F.; van der Wel, F.J.M. Accuracy assessment of satellite derived land-cover data: A review. Photogramm. Eng. Remote Sens. 1994, 60, 419–426. [Google Scholar]
- Erasu, D. Remote sensing-based urban land use/land cover change detection and monitoring. J. Remote Sens. GIS 2017, 6, 168–173. [Google Scholar] [CrossRef]
- Syifa, M.; Panahi, M.; Lee, C.W. Mapping of post-wildfire burned area using a hybrid algorithm and satellite data: The case of the Camp Fire wildfire in California, USA. Remote Sens. 2020, 12, 623. [Google Scholar] [CrossRef]
- Liu, J.G.; Mason, P.J. Essential Image Processing and GIS for Remote Sensing; John Wiley & Sons: Hoboken, NJ, USA, 2013; pp. 1–443. [Google Scholar]
- Wang, Y.; Song, H.; Zhang, Y. Spectral-spatial classification of hyperspectral images using joint bilateral filter and graph cut based model. Remote Sens. 2016, 8, 748. [Google Scholar] [CrossRef]
- Qian, Y.; Zhang, K.; Qiu, F. Spatial contextual noise removal for post classification smoothing of remotely sensed images. Proc. ACM Symp. Appl. Comput. 2005, 1, 524–528. [Google Scholar] [CrossRef]
- Jawak, S.D.; Luis, A.J.; Fretwell, P.T.; Convey, P.; Durairajan, U.A. Semiautomated detection and mapping of vegetation distribution in the Antarctic environment using spatial-spectral characteristics of WorldView-2 imagery. Remote Sens. 2019, 11, 1909. [Google Scholar] [CrossRef]
- Perveen, M.F.; Nagasawa, R.; Shawkat Ali, S.M.; Husnain, H. Evaluation of aster spectral bands for agricultural land cover mapping using pixel-based and object-based classification approaches. In Proceedings of the 2nd International Conference on Geographic Object-Based Image Analysis, Calgary, AB, Canada, 5–7 August 2008. [Google Scholar]
- Tottrup, C. Improving tropical forest mapping using multi-date Landsat TM data and pre-classification image smoothing. Int. J. Remote Sens. 2004, 25, 717–730. [Google Scholar] [CrossRef]
- Dash, P.; Sanders, S.L.; Parajuli, P.; Ouyang, Y. Improving the Accuracy of Land Use and Land Cover Classification of Landsat Data in an Agricultural Watershed. Remote Sens. 2023, 15, 4020. [Google Scholar] [CrossRef]
- Anand, A. Unit 14 Accuracy Assessment. In Processing and Classification of Remotely Sensed Images; IGNOU: New Delhi, India, 2017; pp. 59–77. [Google Scholar]
- Morales-Barquero, L.; Lyons, M.B.; Phinn, S.R.; Roelfsema, C.M. Trends in remote sensing accuracy assessment approaches in the context of natural resources. Remote Sens. 2019, 11, 2305. [Google Scholar] [CrossRef]
- Thapa, R.B.; Murayama, Y. Urban mapping, accuracy, & image classification: A comparison of multiple approaches in Tsukuba City, Japan. Appl. Geogr. 2009, 29, 135–144. [Google Scholar] [CrossRef]
- Foody, G.M. Status of land cover classification accuracy assessment. Remote Sens. Environ. 2002, 80, 185–201. [Google Scholar] [CrossRef]
- Congalton, R.G.; Green, K. Assessing the Accuracy of Remotely Sensed Data Principles and Practices, 3rd ed.; CRC Press: Boca Raton, FL, USA, 2005; ISBN 978-1498776660. [Google Scholar] [CrossRef]
- Huang, Y.; Tian, F.; Wang, Y.; Wang, M.; Hu, Z. Effect of coal mining on vegetation disturbance and associated carbon loss. Environ. Earth Sci. 2015, 73, 2329–2342. [Google Scholar] [CrossRef]
- Garai, D.; Narayana, A.C. Land use/land cover changes in the mining area of Godavari coal fields of southern India. Egypt. J. Remote Sens. Space Sci. 2018, 21, 375–381. [Google Scholar] [CrossRef]
- Emmanuel, A.Y.; Jerry, C.S.; Dzigbodi, D.A. Review of environmental and health impacts of mining in Ghana. J. Health Pollut. 2018, 8, 43–52. [Google Scholar] [CrossRef] [PubMed]
- Obeng, E.A.; Oduro, K.A.; Obiri, B.D.; Abukari, H.; Guuroh, R.T.; Djagbletey, G.D.; Appiah-Korang, J.; Appiah, M. Impact of illegal mining activities on forest ecosystem services: Local communities’ attitudes and willingness to participate in restoration activities in Ghana. Heliyon 2019, 5, e02617. [Google Scholar] [CrossRef]
- Libanda, B.; Zheng, M.; Ngonga, C. Spatial and temporal patterns of drought in Zambia. J. Arid Land 2019, 11, 180–191. [Google Scholar] [CrossRef]
- BOZ. Bank of Zambia 2020 Annual Report; Bank of Zambia: Ndola, Zambia, 2020. [Google Scholar]
- UN-HABITAT. Regional Technical Cooperation Division. Zambia: Kitwe Urban Profile; UN-HABITAT: Nairobi, Kenya, 2009. [Google Scholar]
- Xu, X.; Cai, H.; Sun, D.; Hu, L.; Banson, K.E. Impacts of mining and urbanization on the Qin-Ba mountainous environment, China. Sustainability 2016, 8, 488. [Google Scholar] [CrossRef]
- Simutanyi, N. Background: Mining in Zambia; Institute for Security Studies: Cape Town, South Africa, 2008. [Google Scholar]
- Lindahl, J. Environmental Impacts of Mining in Zambia, towards better environmental management and sustainable exploitation of mineral resources. Geol. Surv. Swed. 2014, 27, 1–27. [Google Scholar] [CrossRef]
- Fraser, A.; Larmer, M. Zambia, Mining, and Neoliberalism: Boom and Bust on the Globalized Copperbelt; Palgrave Macmillan: New York, NY, USA, 2010. [Google Scholar]
- World Bank Group Zambia. Mining Investment and Governance Review; Bank of Zambia: Lusaka, Zambia, 2016. [Google Scholar]
- IIED. MMSD Working Paper No. 44 Research on Mine Closure Policy; IIED: London, UK, 2002; pp. 1–92. Available online: https://www.iied.org/g00541 (accessed on 27 March 2024).
- Starke, L. Breaking New Ground: Mining, Minerals and Sustainable Development; Routledge: London, UK, 2002; pp. 197–230. [Google Scholar] [CrossRef]
- Columbia Center on Sustainable Investment. Mapping Mining to the Sustainable Development Goals: An Atlas; Columbia Center on Sustainable Investment: New York, NY, USA, 2016. [Google Scholar]
- AFRODAD. Impacts of Fluctuating Commodity Prices on Government Revenue in the SADC Region: The Case of Copper for Zambia; AFRODAD: Harare, Zimbabwe, 2016; ISBN 978-0-7974-8205-0. [Google Scholar]
- Phiri, D. Thousands Lose Jobs as Baluba Mine Shuts Down Due to Loadshedding. Available online: https://twitter.com/zambiawatchdog/status/640874856268070913 (accessed on 10 January 2022).
- Government of Zambia. The Mines and Minerals (Environmental) Regulations; Government of Zambia: Lusaka, Zambia, 1997. [Google Scholar]
- Government of Zambia. The Mines and Minerals (Environmental Protection Fund) Regulations; Government of Zambia: Lusaka, Zambia, 1998. [Google Scholar]
- Government of Zambia. The Environmental Management Act; Government of Zambia: Lusaka, Zambia, 2011; pp. 87–178. [Google Scholar]
- Government of Zambia. Mines and Minerals Development Act; Government of Zambia: Lusaka, Zambia, 2015. [Google Scholar]
- Sishekanu, M.; Katati, M. Subjectivity in the logic of Zambia’s environmental impact assessments (EIA) process: The bedrock of controversial EIA approvals. Law Environ. Dev. J. 2021, 17, 40–54. [Google Scholar]
- DMP; EPA. Guidelines for Preparing Mine Closure Plans. (Revision of the Guidelines for Preparing Mine Closure Plans, June 2011); Department of Mines and Petroleum Mineral House: Perth, Australia, 2015; Volume 51, pp. 39–54. [Google Scholar]
- Silwamba, E.S.; Jalasi, J.A.L.L. Mining Regulation in Zambia. Available online: http://www.dentonsmininglaw.com/mining-regulation-in-zambia/ (accessed on 10 January 2022).
- Ndulo, M. Mining Rights in Zambia; Kenneth Kaunda Foundation: Lusaka, Zambia, 1987; ISBN 9982010018. [Google Scholar]
- Kangwa, J. Mining Minerals Sustainable Development Southern Africa; African Institute of Corporate Citizenship: Johannesburg, Gauteng, South Africa, 2001; pp. 1–23. [Google Scholar]
- Pring, G. The Law of Public Participation in Mining and Resources Development; Working Paper No. 21a; Oxford University Press Inc.: New York, NY, USA, 2002; 710p, ISBN 0-19-925378-1. [Google Scholar]
- Kawashima, T.; Korcelli, P. (Eds.) Human Settlement Systems: Spatial Patterns and Trends; IIASA Collaborative Paper; IIASA: Laxenburg, Austria, 1982. [Google Scholar] [CrossRef]
- Population Stat. Population Stat Kitwe, Zambia Population. Available online: https://populationstat.com/zambia/kitwe (accessed on 24 November 2023).
- Enshassi, A.; Kochendoerfer, B.; Rizq, E. An evaluation of environmental impacts of construction projects. Rev. Ing. Constr. 2014, 29, 234–254. [Google Scholar] [CrossRef]
- Contreras-Hermosilla. The underlying causes of forest decline, The CGIAR System. CIFOR Occas. Pap. 2000, 30, 1–25. [Google Scholar]
- Chibbabbuka, R.H.; Masinja, J.; Franco, I.B. Legal Reforms as a Tool for Sustainable Development in Former Mining Communities: A Case Study of Kabwe Lead-Zinc Mine, Zambia. J. Sustain. Dev. Law Policy 2021, 12, 226–257. [Google Scholar] [CrossRef]
- Yesuph, A.Y.; Dagnew, A.B. Land use/cover spatiotemporal dynamics, driving forces and implications at the Beshillo catchment of the Blue Nile Basin, North Eastern Highlands of Ethiopia. Environ. Syst. Res. 2019, 8, 21. [Google Scholar] [CrossRef]


| Year of Census | Population | Male | Female |
|---|---|---|---|
| 1990 | 347,024 | 175,812 | 171,212 |
| 2000 | 376,124 | 189,650 | 186,474 |
| 2010 | 517,543 | 256,740 | 260,803 |
| 2022 | 661,901 | 321,654 | 340,247 |
| Data Used | Sensor | Path/Row | Spatial Resolution (m) | Source |
|---|---|---|---|---|
| Landsat TM | TM | 172/69 | 30 | USGS |
| Landsat TM | TM | 172/69 | 30 | USGS |
| Landsat TM | TM | 172/69 | 30 | USGS |
| Landsat OLI | OLI | 172/69 | 30 | USGS |
| PlanetScope | OrthoTile | 2792051_3533219 | 3 | Planet |
| LULC Class | Description |
|---|---|
| Bare land (including mining area) * | Areas devoid of vegetation cover, e.g., mining area, sediments, exposed rocks, and unpaved roads |
| Built-up area | Settlements and tarred roads |
| Forest | Land with tree canopy density more than 40% |
| Grassland/pasture/agricultural land | Areas where vegetation is dominated by grasses, pasture, and agricultural use |
| Water | Water bodies |
| LULC Class | Area in 1990 | Area in 2000 | Area in 2010 | Area in 2020 | ||||
|---|---|---|---|---|---|---|---|---|
| km2 | % | km2 | % | km2 | % | km2 | % | |
| Bare Land * | 20.90 | 2.6 | 21.70 | 2.7 | 22.46 | 2.8 | 35.58 | 4.5 |
| Built-up Area | 37.06 | 4.6 | 49.11 | 6.1 | 52.58 | 6.6 | 72.90 | 9.1 |
| Grassland/Pasture/Agricultural Land | 369.43 | 46.2 | 398.12 | 49.8 | 403.89 | 50.5 | 412.96 | 51.7 |
| Water | 5.69 | 0.7 | 6.19 | 0.8 | 5.59 | 0.7 | 6.94 | 0.9 |
| Forest | 366.34 | 45.8 | 324.30 | 40.6 | 314.90 | 39.4 | 271.04 | 33.9 |
| Total | 799.42 | 100.0 | 799.42 | 100.0 | 799.42 | 100.0 | 799.42 | 100.0 |
| Sub-Classes | Area (km2) | Proportion (%) |
|---|---|---|
| Mining Area | 22.95 | 64.51 |
| Bare Ground | 12.63 | 35.49 |
| Total (Bare Land) | 35.58 | 100.00 |
| LULC Class | Bare Land | Built-Up Area | Grassland/Pasture/Agricultural Land | Water | Forest | Ground Truth |
|---|---|---|---|---|---|---|
| Bare Land | 38 | 9 | 5 | 0 | 0 | 52 |
| Built-up Area | 4 | 32 | 0 | 0 | 0 | 36 |
| Grassland/Pasture/Agricultural Land | 5 | 9 | 44 | 5 | 1 | 64 |
| Water | 3 | 0 | 0 | 44 | 1 | 48 |
| Forest | 0 | 0 | 1 | 1 | 49 | 51 |
| Total | 50 | 50 | 50 | 50 | 51 | 251 |
| LULC Class | Producer’s Accuracy (%) | User’s Accuracy (%) |
|---|---|---|
| Bare Land | 76.0 | 73.1 |
| Built-up Area | 64.0 | 88.9 |
| Grassland/Pasture/Agricultural Land | 88.0 | 68.8 |
| Water | 88.0 | 91.7 |
| Forest | 96.1 | 96.1 |
| Overall Accuracy (%) | 82.47 | |
| Kappa | 0.78 |
| LULC Class | BL | BUA | F | GPAL | W | Total | Loss |
|---|---|---|---|---|---|---|---|
| 1990/2000 | |||||||
| BL | 13.87 | 2.25 | 0.36 | 4.18 | 0.24 | 20.90 | 7.03 |
| BUA | 0.50 | 31.61 | 0.37 | 4.58 | 0.01 | 37.06 | 5.45 |
| F | 0.29 | 2.83 | 253.68 | 108.30 | 1.25 | 366.34 | 112.66 |
| GPAL | 6.89 | 12.42 | 68.38 | 279.93 | 1.81 | 369.43 | 89.50 |
| W | 0.15 | 0.01 | 1.51 | 1.14 | 2.89 | 5.69 | 2.80 |
| Total | 21.70 | 49.11 | 324.30 | 398.12 | 6.19 | 799.43 | 217.44 |
| Gain | 7.83 | 17.51 | 70.62 | 118.19 | 3.30 | 217.44 | |
| 2000/2010 | |||||||
| BL | 14.70 | 1.20 | 0.57 | 5.16 | 0.07 | 21.70 | 7.00 |
| BUA | 0.60 | 38.61 | 2.93 | 6.97 | 0.01 | 49.11 | 10.51 |
| F | 0.71 | 0.66 | 220.33 | 100.95 | 1.65 | 324.30 | 103.96 |
| GPAL | 6.42 | 12.12 | 89.47 | 289.02 | 1.10 | 398.12 | 109.11 |
| W | 0.02 | 0.00 | 1.60 | 1.81 | 2.76 | 6.19 | 3.43 |
| Total | 22.46 | 52.58 | 314.90 | 403.89 | 5.59 | 799.42 | 234.01 |
| Gain | 7.76 | 13.97 | 94.57 | 114.88 | 2.83 | 234.01 | |
| 2010/2020 | |||||||
| BL | 12.45 | 1.86 | 1.20 | 6.90 | 0.06 | 22.46 | 10.01 |
| BUA | 1.35 | 46.52 | 0.70 | 4.01 | 0.00 | 52.58 | 6.06 |
| F | 6.11 | 4.51 | 177.88 | 124.14 | 2.26 | 314.90 | 137.02 |
| GPAL | 15.52 | 20.00 | 90.97 | 276.47 | 0.93 | 403.89 | 127.42 |
| W | 0.15 | 0.01 | 0.30 | 1.44 | 3.69 | 5.59 | 1.90 |
| Total | 35.58 | 72.90 | 271.04 | 412.96 | 6.94 | 799.42 | 282.42 |
| Gain | 23.13 | 26.38 | 93.17 | 136.49 | 3.25 | 282.42 |
| LULC Class | BL | BUA | F | GPAL | W | Total | Loss |
|---|---|---|---|---|---|---|---|
| 1990/2020 | |||||||
| BL | 11.02 | 3.28 | 1.19 | 5.04 | 0.37 | 20.90 | 9.89 |
| BUA | 0.76 | 32.53 | 0.49 | 3.28 | 0.01 | 37.06 | 4.53 |
| F | 7.05 | 4.30 | 171.03 | 181.94 | 2.03 | 366.34 | 195.31 |
| GPAL | 16.42 | 32.77 | 97.89 | 220.87 | 1.48 | 369.43 | 148.55 |
| W | 0.34 | 0.02 | 0.45 | 1.83 | 3.05 | 5.69 | 2.64 |
| Total | 35.58 | 72.90 | 271.04 | 412.96 | 6.94 | 799.42 | 360.92 |
| Gain | 24.56 | 40.37 | 100.02 | 192.09 | 3.89 | 360.92 |
| LULC Class | Net Change in 1990–2000 | Net Change in 2000–2010 | Net Change in 2010–2020 | Overall Change in 1990–2020 |
|---|---|---|---|---|
| Bare Land | 0.79 | 0.76 | 13.11 | 14.67 |
| Built-up Area | 12.05 | 3.47 | 20.32 | 35.84 |
| Grassland/Pasture/Agricultural Land | 28.70 | 5.76 | 9.07 | 43.53 |
| Water | 0.50 | –0.60 | 1.35 | 1.25 |
| Forest | –42.04 | –9.40 | –43.86 | –95.30 |
| Statute | Provision | Focus | Gap |
|---|---|---|---|
| Mines Environmental Regulations 1997 | Regulation 5(2) | Environmental Project Brief (EPB) or an EIS | Limited mine closure planning stipulations required to be included in the EIS Inadequate provisions directly addressing review of mine closure provisions Relinquishment and post-closure obligations Socioeconomic requirements |
| Regulation 6 | Mine closure certificate issuance for any mine closed and the mining right or permit | ||
| Regulation 22 | Checklist on the contents of a decommissioning and closure plan for mine dump | ||
| Regulation 65 | Developer’s contribution to the Fund established under Section 86 of the Mines Act | ||
| Regulation 66 | Classifying developers to determine their fund contribution | ||
| Environmental Protection Fund Regulations 1998 | Regulation 3(5) | Approving withdrawals of funds from the Fund and the overall good management of the Fund | Lack of diverse financial assurance forms Ineffectiveness of concession provision for environmental protection fund contributions |
| Regulation 7(1) | Developers to be paid from the Fund moneys required for the objectives of the Fund and refunds to holders of licenses in accordance with the Mines Act | ||
| Environmental Management Act 2011 | Section 5 | Citizen’s duty to safeguard and enhance the environment | Inadequate provisions regarding mine closure planning/plans Stakeholder engagement and public participation |
| Section 29 | Environmental Impact Statement (EIS). | ||
| Mines and Minerals Development Act, 2015 | Section 4 | Exploitation of minerals shall ensure safety, health, and environmental protection | No guidance as to what this rehabilitation plan should contain |
| Section 81 | Rehabilitation, levelling, re-grassing, reforesting, or contouring | ||
| Section 82 | Clear away all mining and mineral processing plant | ||
| Section 83 | Backing up Section 82 by the government disposing | ||
| Section 86 | Environmental protection fund |
Disclaimer/Publisher’s Note: The statements, opinions and data contained in all publications are solely those of the individual author(s) and contributor(s) and not of MDPI and/or the editor(s). MDPI and/or the editor(s) disclaim responsibility for any injury to people or property resulting from any ideas, methods, instructions or products referred to in the content. |
© 2024 by the authors. Licensee MDPI, Basel, Switzerland. This article is an open access article distributed under the terms and conditions of the Creative Commons Attribution (CC BY) license (https://creativecommons.org/licenses/by/4.0/).
Share and Cite
Mutimba, K.; Watanabe, T.; Chand, M.B. Land Use Land Cover (LULC) Change Dynamics Associated with Mining Activities in Kitwe District and Adequacy of the Legal Framework on Mine Closure in Zambia. Earth 2024, 5, 110-132. https://doi.org/10.3390/earth5020006
Mutimba K, Watanabe T, Chand MB. Land Use Land Cover (LULC) Change Dynamics Associated with Mining Activities in Kitwe District and Adequacy of the Legal Framework on Mine Closure in Zambia. Earth. 2024; 5(2):110-132. https://doi.org/10.3390/earth5020006
Chicago/Turabian StyleMutimba, Kawisha, Teiji Watanabe, and Mohan Bahadur Chand. 2024. "Land Use Land Cover (LULC) Change Dynamics Associated with Mining Activities in Kitwe District and Adequacy of the Legal Framework on Mine Closure in Zambia" Earth 5, no. 2: 110-132. https://doi.org/10.3390/earth5020006
APA StyleMutimba, K., Watanabe, T., & Chand, M. B. (2024). Land Use Land Cover (LULC) Change Dynamics Associated with Mining Activities in Kitwe District and Adequacy of the Legal Framework on Mine Closure in Zambia. Earth, 5(2), 110-132. https://doi.org/10.3390/earth5020006