Article

Is Zagreb Green Enough? Influence of Urban Green Spaces on Mitigation of Urban Heat Island: A Satellite-Based Study

Forest Science and Technology Centre of Catalonia (CTFC), Ctra St. Llorenç de Morunys km.2, 25280 Solsona, Spain
Earth 2024, 5(4), 604-622; https://doi.org/10.3390/earth5040031 (registering DOI)
Submission received: 9 August 2024 / Revised: 2 October 2024 / Accepted: 4 October 2024 / Published: 5 October 2024

Abstract

:
The urban heat island phenomenon is a climatic condition in which urbanized areas exhibit higher temperature values than their natural surroundings. This occurs due to an unbalanced energy budget caused by the extensive use of synthetic materials. In such a scenario, urban green areas act as stressors to mitigate the intensity of the urban heat island and improve urban well-being. This study analyzes the spatial-temporal characteristics of the urban heat island in Zagreb, Croatia, aiming to examine the role of different types of green infrastructure in mitigating elevated temperature values and facilitating the definition of greener planning strategies. To achieve this, a multitemporal remote sensing- and NDVI-based analysis was conducted for the time series 1984–2014. An urban heat island intensity map was obtained for the selected 30-year period, along with thermal graphs registering land surface temperature values among different city districts. The results reveal significant heterogeneity, displaying variable behavior dependent on the city district. The role of Zagreb’s urban green areas in urban heat island mitigation is evident but largely dependent on urban morphology, construction types, and periods. Urban forests and urban parks play the most significant role in temperature reduction, followed by residential building neighborhoods and extensive neighborhoods consisting of familiar houses with gardens. Continuously built areas, such as the city center and industrial zones, are less prone to registering lower intensity values. Additionally, multitemporal intensity variations based on land use changes are registered in several districts.

1. Introduction

Approximately two-thirds of Europe’s population resides in urban areas, and urbanization continues to exhibit a consistent upward trend in the post-industrial era [1]. While originally intended to enhance human well-being and living standards, continuous urban growth has brought about various adverse effects, with the urban heat island (UHI) phenomenon standing out as a prominent concern [2]. UHI is a climatic condition characterized by elevated temperatures in urbanized areas compared to their natural surroundings, resulting from the extensive use of synthetic materials, an imbalanced energy budget, and diminished evapotranspiration values, additionally increased by anthropogenic heat sources such as traffic, industry, or heating/air conditioning systems [3]. This condition leads to a decline in the quality of life, increased energy and water consumption, and the prevalence of heat-related diseases [4]. Synthetic surfaces exhibit a high capacity for absorbing thermal energy, with the energy levels stored in artificial surfaces consistently surpassing those in natural areas [5]. The impact of the UHI phenomenon is particularly intensified during heat waves. In the context of climate change, it is anticipated that the severity and frequency of heat waves will persistently increase, necessitating greater reliance on cooling systems. This, in turn, will contribute to additional heat emissions and elevated temperatures [6].
Numerous studies have highlighted the positive impact of Urban Green Spaces (UGSs) on mitigating the UHI phenomenon. Both private gardens and public green areas have a positive effect on UHI intensity reduction [7,8]. UGSs, in the literature also denominated as green infrastructure, are (semi-)natural spaces characterized by their multifunctionality that contribute to inhabitants’ well-being. They encompass urban forests, public parks, permeable vegetated surfaces, green roofs and walls, green alleys and streets, as well as private vegetated surfaces [9,10]. Nowadays, mitigation efforts mostly focus on expanding UGSs, planting street trees, and reducing impervious surfaces [11]. These effects include the shading and transpiration role of UGSs, which enhance air humidity and alleviate UHI intensity [12]. The characteristics of UGSs play a crucial role in influencing various aspects of the UHI and urban microclimate. The morphology of green areas, determined by their shape and size, affects cooling intensity and distance [13,14]. Smaller parks and those with a higher shape index exhibit a smaller cooling strength but a greater cooling distance [15]. Conversely, larger parks and urban forests wield a significant influence, capable of creating their own microclimate. Street trees not only contribute to psychological thermal comfort but also enhance UGS connectivity, which proves more effective in reducing UHI intensity [16,17,18]. Therefore, the mitigation of UHI intensity is directly influenced by spatial patterns and strongly depend on the urban morphology. The irregular characteristics of urban morphology in most European cities contribute to uneven UHI intensity properties, thereby significantly limiting potential mitigation actions [19]. Nevertheless, the importance of incorporating green infrastructure into urban planning strategies is paramount, both for existing and future city districts, with the goal of reducing UHI intensity, mitigating its negative impacts, and enhancing human well-being [20,21]. Therefore, comprehensive studies on the characteristics and temporal changes of UHI and UGS are crucial to fully understand their relationship and behavior. This understanding, in turn, helps define the most appropriate urban development strategy for UHI mitigation and the creation of green and sustainable cities [22,23,24].
It is crucial to distinguish between “air” UHI, typically described using data from meteorological stations with limited spatial features, and “surface” UHI, which is commonly studied using remotely sensed data [25,26]. Urban surfaces undergo constant changes in land use within relatively small areas, exhibiting diverse physical features in built environments and frequent transformations over temporal scales. For that reason, satellite imagery has emerged as a valuable tool in analyzing the UHI phenomenon [27]. Remote sensing’s capability for multi-temporal registration and the availability of spatially continuous datasets make it particularly effective in detecting the relevant physical and spatial features of the UHI phenomenon compared to meteorological in situ data [28,29]. In this study, we focused on analyzing “surface” UHI, utilizing land surface temperature (LST) as an indicator obtained from Landsat thermal sensors to describe UHI characteristics [30].
This study was carried out in Zagreb, Croatia, where only a limited number of studies have been conducted on the UHI phenomenon [26,31,32,33]. The primary objective of this study, differing from previous research, is to specifically evaluate the role of UGS in mitigating the UHI effect in Zagreb. It aims to establish a connection between UGSs and urban morphology patterns and assess the continuous spatial variability of the UHI phenomenon. That is achieved by conducting a multi-temporal analysis of Zagreb’s UHI characteristics through the use of UHI intensity maps and thermal graphs. In this study, we aim to emphasize the significance of the equitable spatial distribution of UGS in mitigating the UHI phenomenon and to identify the UGS typologies that facilitate this goal. We contend that a city can only be considered green enough when all districts receive a balanced provision of ecosystem services, including climate regulation. The main innovation of this research lies in its spatial assessment of Zagreb’s UGSs and the evaluation of their contributions to UHI mitigation based on their respective typologies. Due to Zagreb’s complex socio-historical background, and its influence on urban planning and urban morphology, UGSs have significantly different effects on UHI mitigation. The identification of the most effective UGS typologies in UHI mitigation can ease spatial planning and help in the definition of adequate urban development strategies. Additionally, given the noticeable absence of a green policy, the aim is to, based on the current features of UHI, underscore the importance of adopting green-oriented urban strategies to achieve a more sustainable city.

2. Material and Methods
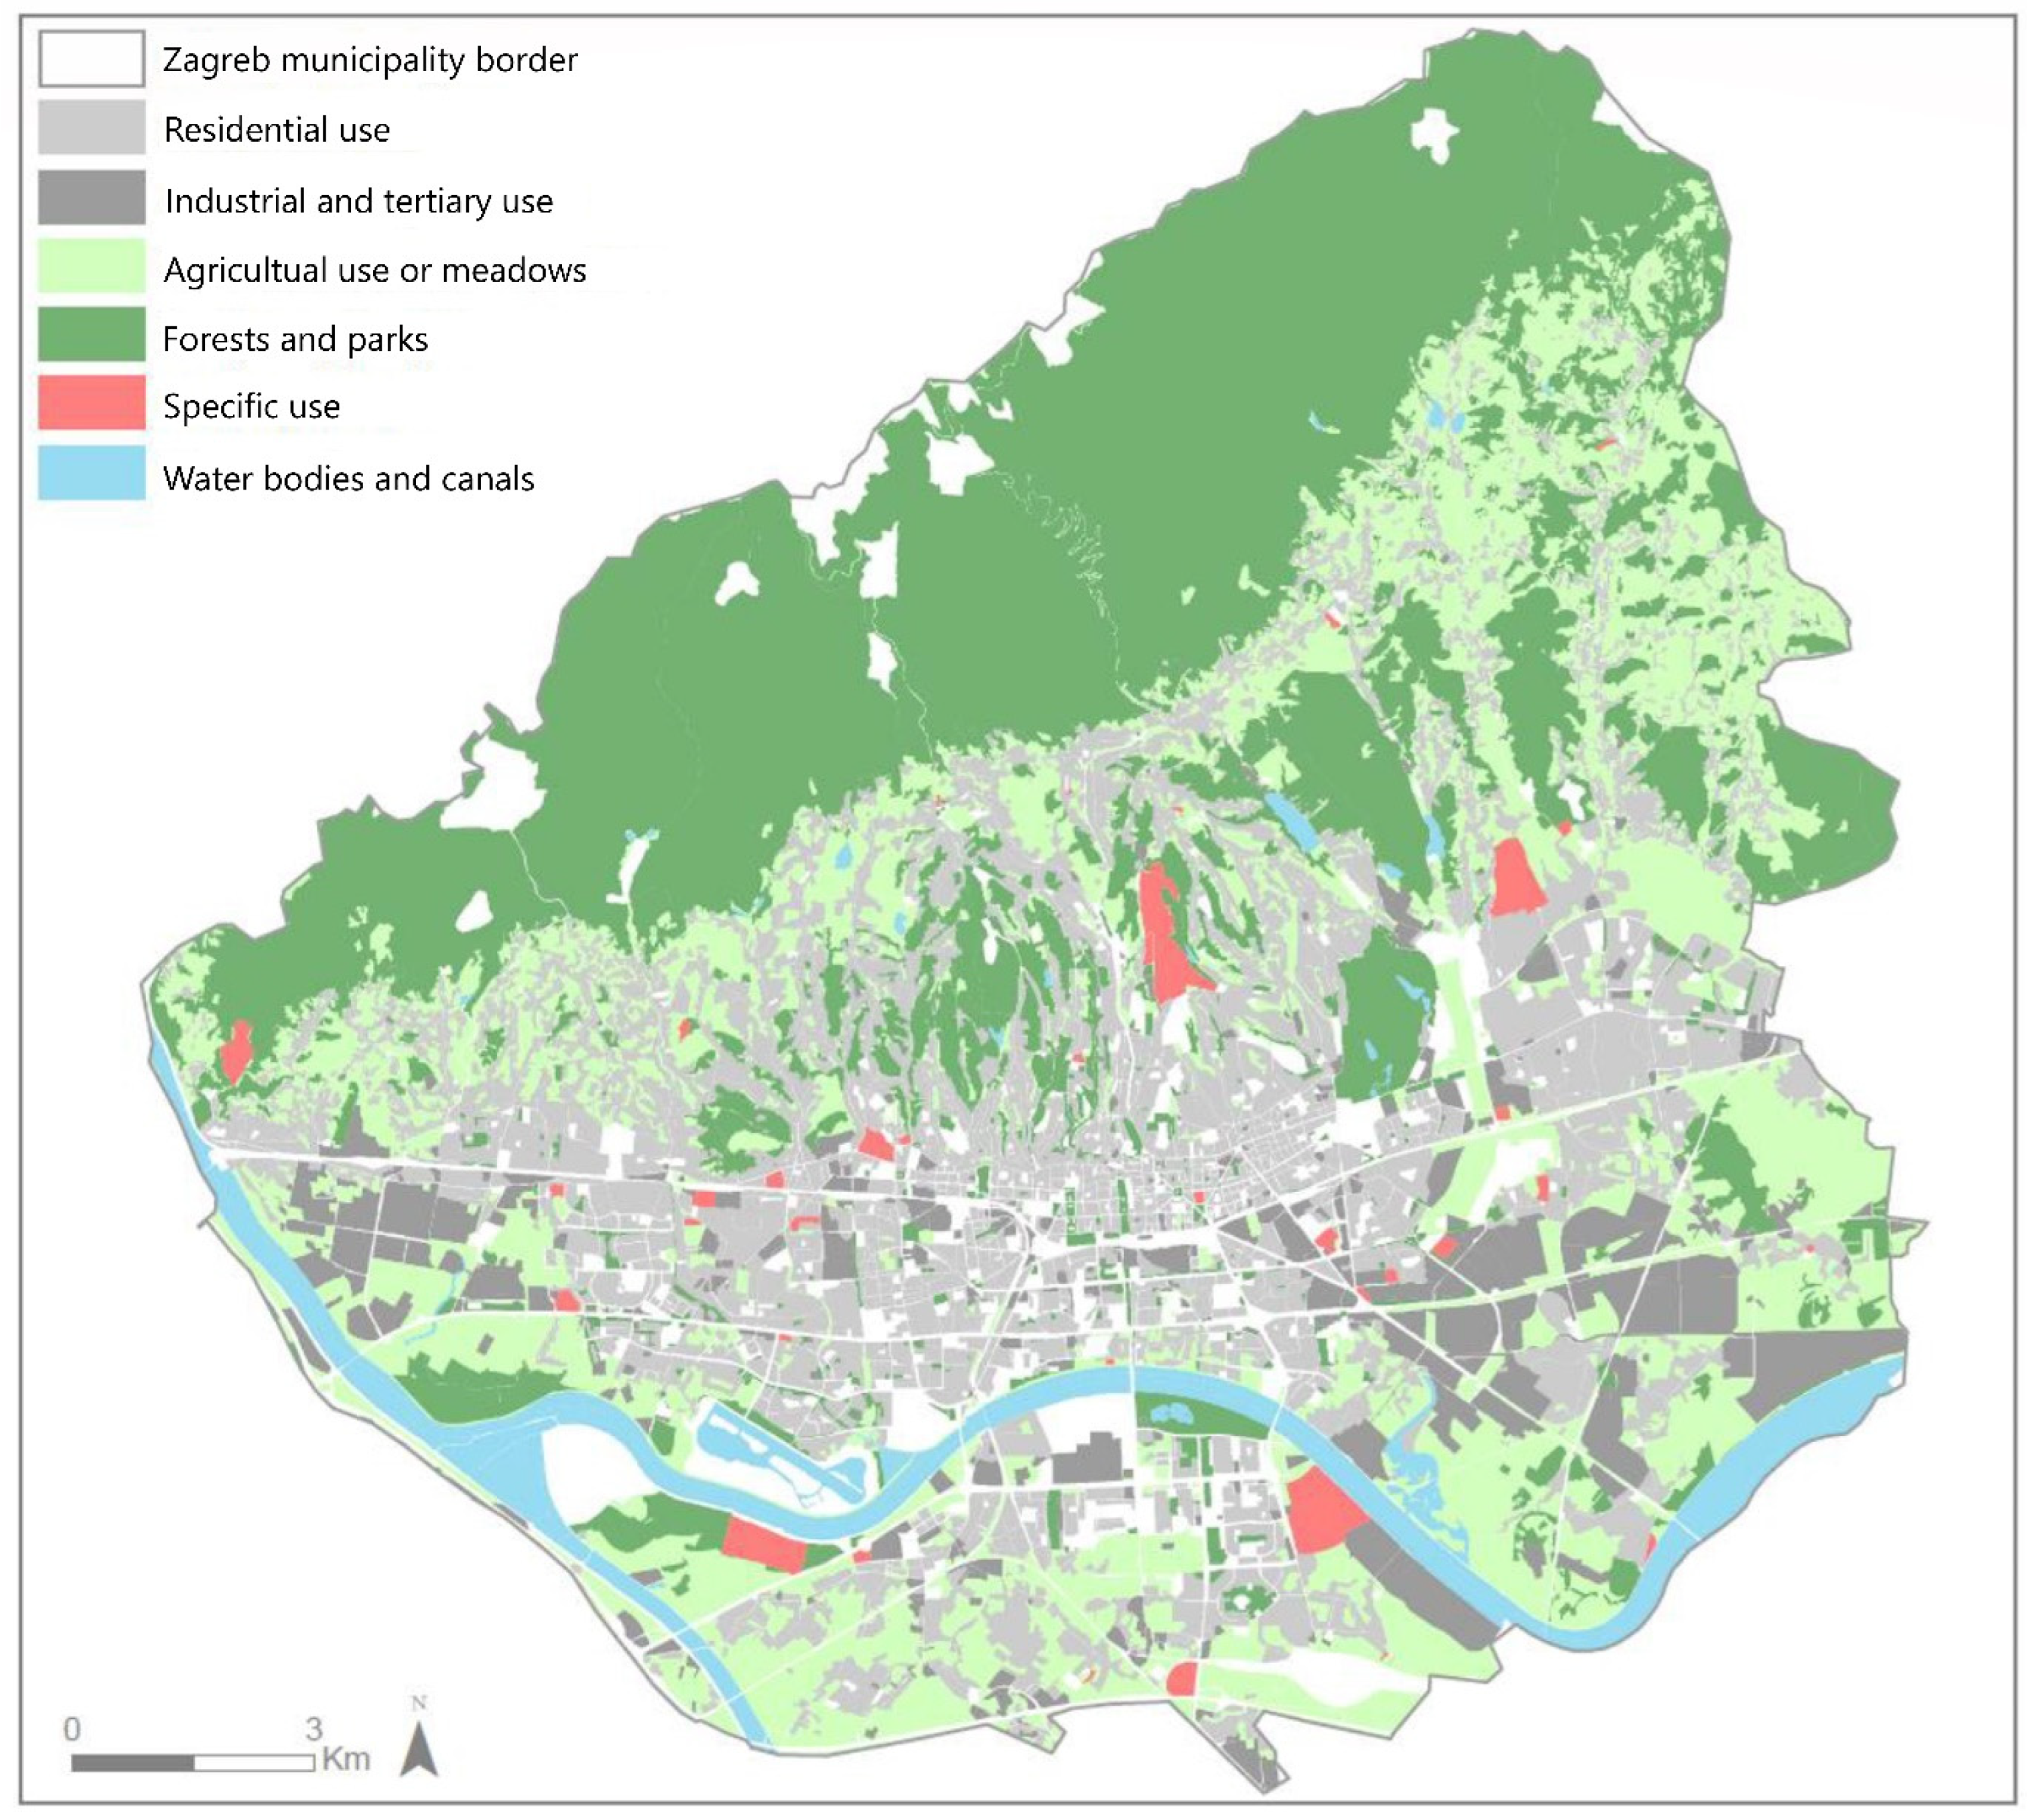
2.1. Study Area

Zagreb, situated in the central part of Croatia, serves as the country’s capital and is classified as a medium-sized European city. To the north of the city lies the 1034 m high Medvednica mountain, and its southern slopes encompass several urban districts. Urbanized regions extend to approximately 350 m in altitude, beyond which the area is designated as a nature park, safeguarded by forest cover. The majority of the urban expanse occupies flat land between the southern slopes of Medvednica and the Sava River, which flows longitudinally through the southern part of the city (Figure 1).
The historic city center, Gornji Grad, is situated on the southernmost hills of Medvednica. Planned urbanization in the 19th century led to the expansion of the city to the lower plain, giving rise to the Lower Town, known as Donji Grad. The initial half of the 20th century witnessed further expansion marked by the emergence of unplanned workers’ neighborhoods such as Trešnjevka, Trnje, and Dubrava. The latter half of the century saw the dominance of socialist-style architecture in southward expansion, crossing the river into Novi Zagreb. This trend continued with the development of more modern neighborhoods on the city’s outskirts from the 1980s onwards, including areas like Špansko, Borovje, and Dugave [34,35].
This study concentrates on the predominantly continuously urbanized areas of the city, encompassing the administrative settlement of Zagreb (349 km2), while excluding predominantly rural city districts and the nature park area. The entire urban area, as per the 2021 census, is home to 769,944 inhabitants and is characterized by a moderate pace of urban expansion.
Zagreb, as per the Köppen climate classification, falls under the Cfb category, and is characterized by four distinct seasons. Winters are cold and moderately snowy, featuring temperatures below 0 °C. Summers are warm, accompanied by rainy periods, with temperatures exceeding 30 °C. Springs and autumns are mild and somewhat unstable, marked by precipitation periods influenced by various low-pressure areas [36].

2.2. Image Selection and Results Presentation

The study was designed to present the results in two distinct formats, aiming to gather comprehensive and detailed insights into UHI characteristics and to discern the significance of UGSs in UHI mitigation (Figure 2). We opted to employ Landsat thermal bands due to their superior temporal resolution. Consequently, a multi-temporal analysis spanning 30 years was conducted, commencing with the first available image captured by the thermal sensor.
To observe linear temperature variations within the city and potential multi-temporal shifts, alterations in land use, and modifications in UHI behavior, five axes were implemented. These axes were strategically positioned to traverse the city in different directions, aiming to capture information on the thermal behavior of various surfaces and districts. Temperature data were extracted from the LST maps, following the methodology outlined in the subsequent section. The map illustrating the axes’ locations for obtaining the thermal profiles is shown in Figure 3.
In addition to the thermal profiles, a UHI intensity map spanning a 30-year period (1984–2014) was generated. This map was constructed through principal component analysis, a statistical method designed to condense information contained in a diverse set of variables by compressing data and eliminating redundant information [37].
The process of image selection aligns with the primary objectives of the study. We specifically opted for images with minimal or zero cloud cover, captured during the spring or summer months when vegetation is at its peak, facilitating the identification of UGSs’ influence on UHI intensity. Following a thorough analysis of data availability, we identified and selected 10 images for processing. Eight of these images were utilized for the thermal graph analysis—four corresponding to spring months and four to summer months. Each set had an initial temporal resolution of approximately 15 years, which was subsequently reduced to 7 years in the second period. Additionally, eight images with zero cloud cover were employed for a multi-temporal UHI intensity analysis (Table 1). All scenes were sourced from the Glovis (https://glovis.usgs.gov/app (accessed on 5 February 2024)) service and pertain to the Landsat path 190/row 28 dataset. The selection of these scenes was contingent upon their availability and alignment with the specific requirements of our study.
For each date, we downloaded images corresponding to the red, infrared, and thermal bands, as thermal and NDVI analysis was undertaken [38]. In the case of the TIRS sensor, we utilized band 10 to acquire thermal data [39]. All data were analyzed, either in their original form or resampled, at a pixel resolution of 30 m.

2.3. Image Processing

Landsat imagery is initially presented in digital numbers, necessitating the conversion of data into physical units. Given the ongoing multi-temporal analysis, it is crucial to radiometrically correct the data to ensure comparability. Initially, we computed spectral radiance using two distinct sets of formulas based on the sensor that captured the original data [40]. For the TM and ETM+ sensors, we applied the following formulas:
L λ = G   N D + B
where
  • L λ = spectral radiance;
  • G = gain; obtained from the image metadata;
  • B = bias; obtained from the image metadata;
  • ND = digital number value.
ρ T = ( L λ L α ) d 2 π E 0 λ Θ s o l τ 1 τ 0  
where
  • ρ T = apparent reflectance;
  • ( L λ L α ) = atmospherically corrected radiance;
  • d 2 = correction factor of Sun−Earth distance;
  • E 0 λ = exatmospheric solar irradiance;
  • Θ s o l = solar zenith angle;
  • τ 1 = incident flow transmissivity;
  • τ 0 = ascendant flow transmissivity.
The procedure was different for the images captured by the TIRS sensor. The following formulas were applied:
ρ λ = M ρ Q c a l + A ρ
where
  • ρ λ = apparent reflectance without solar angle correction;
  • M ρ = specific multiplying factor; obtained from the image metadata;
  • A ρ = specific additive factor; obtained from the image metadata;
  • Q c a l = digital number value.
ρ λ = ρ λ cos ( Θ s z )
where
  • ρ λ = apparent reflectance;
  • ρ λ = apparent reflectance without solar angle correction;
  • Θ s z = solar zenith angle.
The estimation of the LST was conducted using the method proposed by Jiménez-Muñoz and Sobrino [41]. This approach calculates the LST utilizing thermal band information and emissivity data, demonstrating robust performance across various sensors. To initiate this process, emissivity values were computed. Emissivity, representing an object’s ability to emit thermal radiation, is contingent on its physical characteristics [42]. In this study, we opted to employ the NDVI thresholds method to derive the emissivity values. This method posits that objects with similar physical characteristics, and thus comparable NDVI values, share similar emissivity features. While the method and thresholds utilized are based on prior studies, they can be slightly adapted depending on the characteristics of the study area [43,44]. The final values and thresholds applied in this study are presented in the following table (Table 2).
Finally, once emissivity data were obtained, we proceeded with the LST estimation. Two different methods were used depending on the sensor used to capture the thermal band images. The TM and ETM+ sensors used the following:
T = γ ( ε 1 L λ ) + δ
where
  • γ and δ depend directly on the Planck equation: γ = T2sen/1256 Lλ; δ = T2sen − (T2sen/1256 Lλ);
  • L λ   = radiant energy;
  • Tsen = brightness temperature in K.
The TIRS sensor used the following:
y = m x + b
where
  • y = top of the atmosphere radiance;
  • m   = radiance multiplier; constant for band 10 = 0.0003342;
  • b = radiance adder; constant for band 10 = 0.1.
T = K 2 ln ( K 1 y + 1 )
where
  • T = brightness temperature;
  • K 1   = constant for the band 10 = 774.89;
  • K 2   = constant for the band 10 = 1321.08;
  • y = top of the atmosphere radiance.
T S T = T 1 + ( 10.8 ε 14 , 380 ) ln ( ε )
where
  • T S T = land surface temperature;
  • ε = emissivity.
All data and image processing as well as the visualization of the results was performed using ArcGIS 10.8, Erdas Imagine 16.5 and Microsoft Excel 365 software.

3. Results

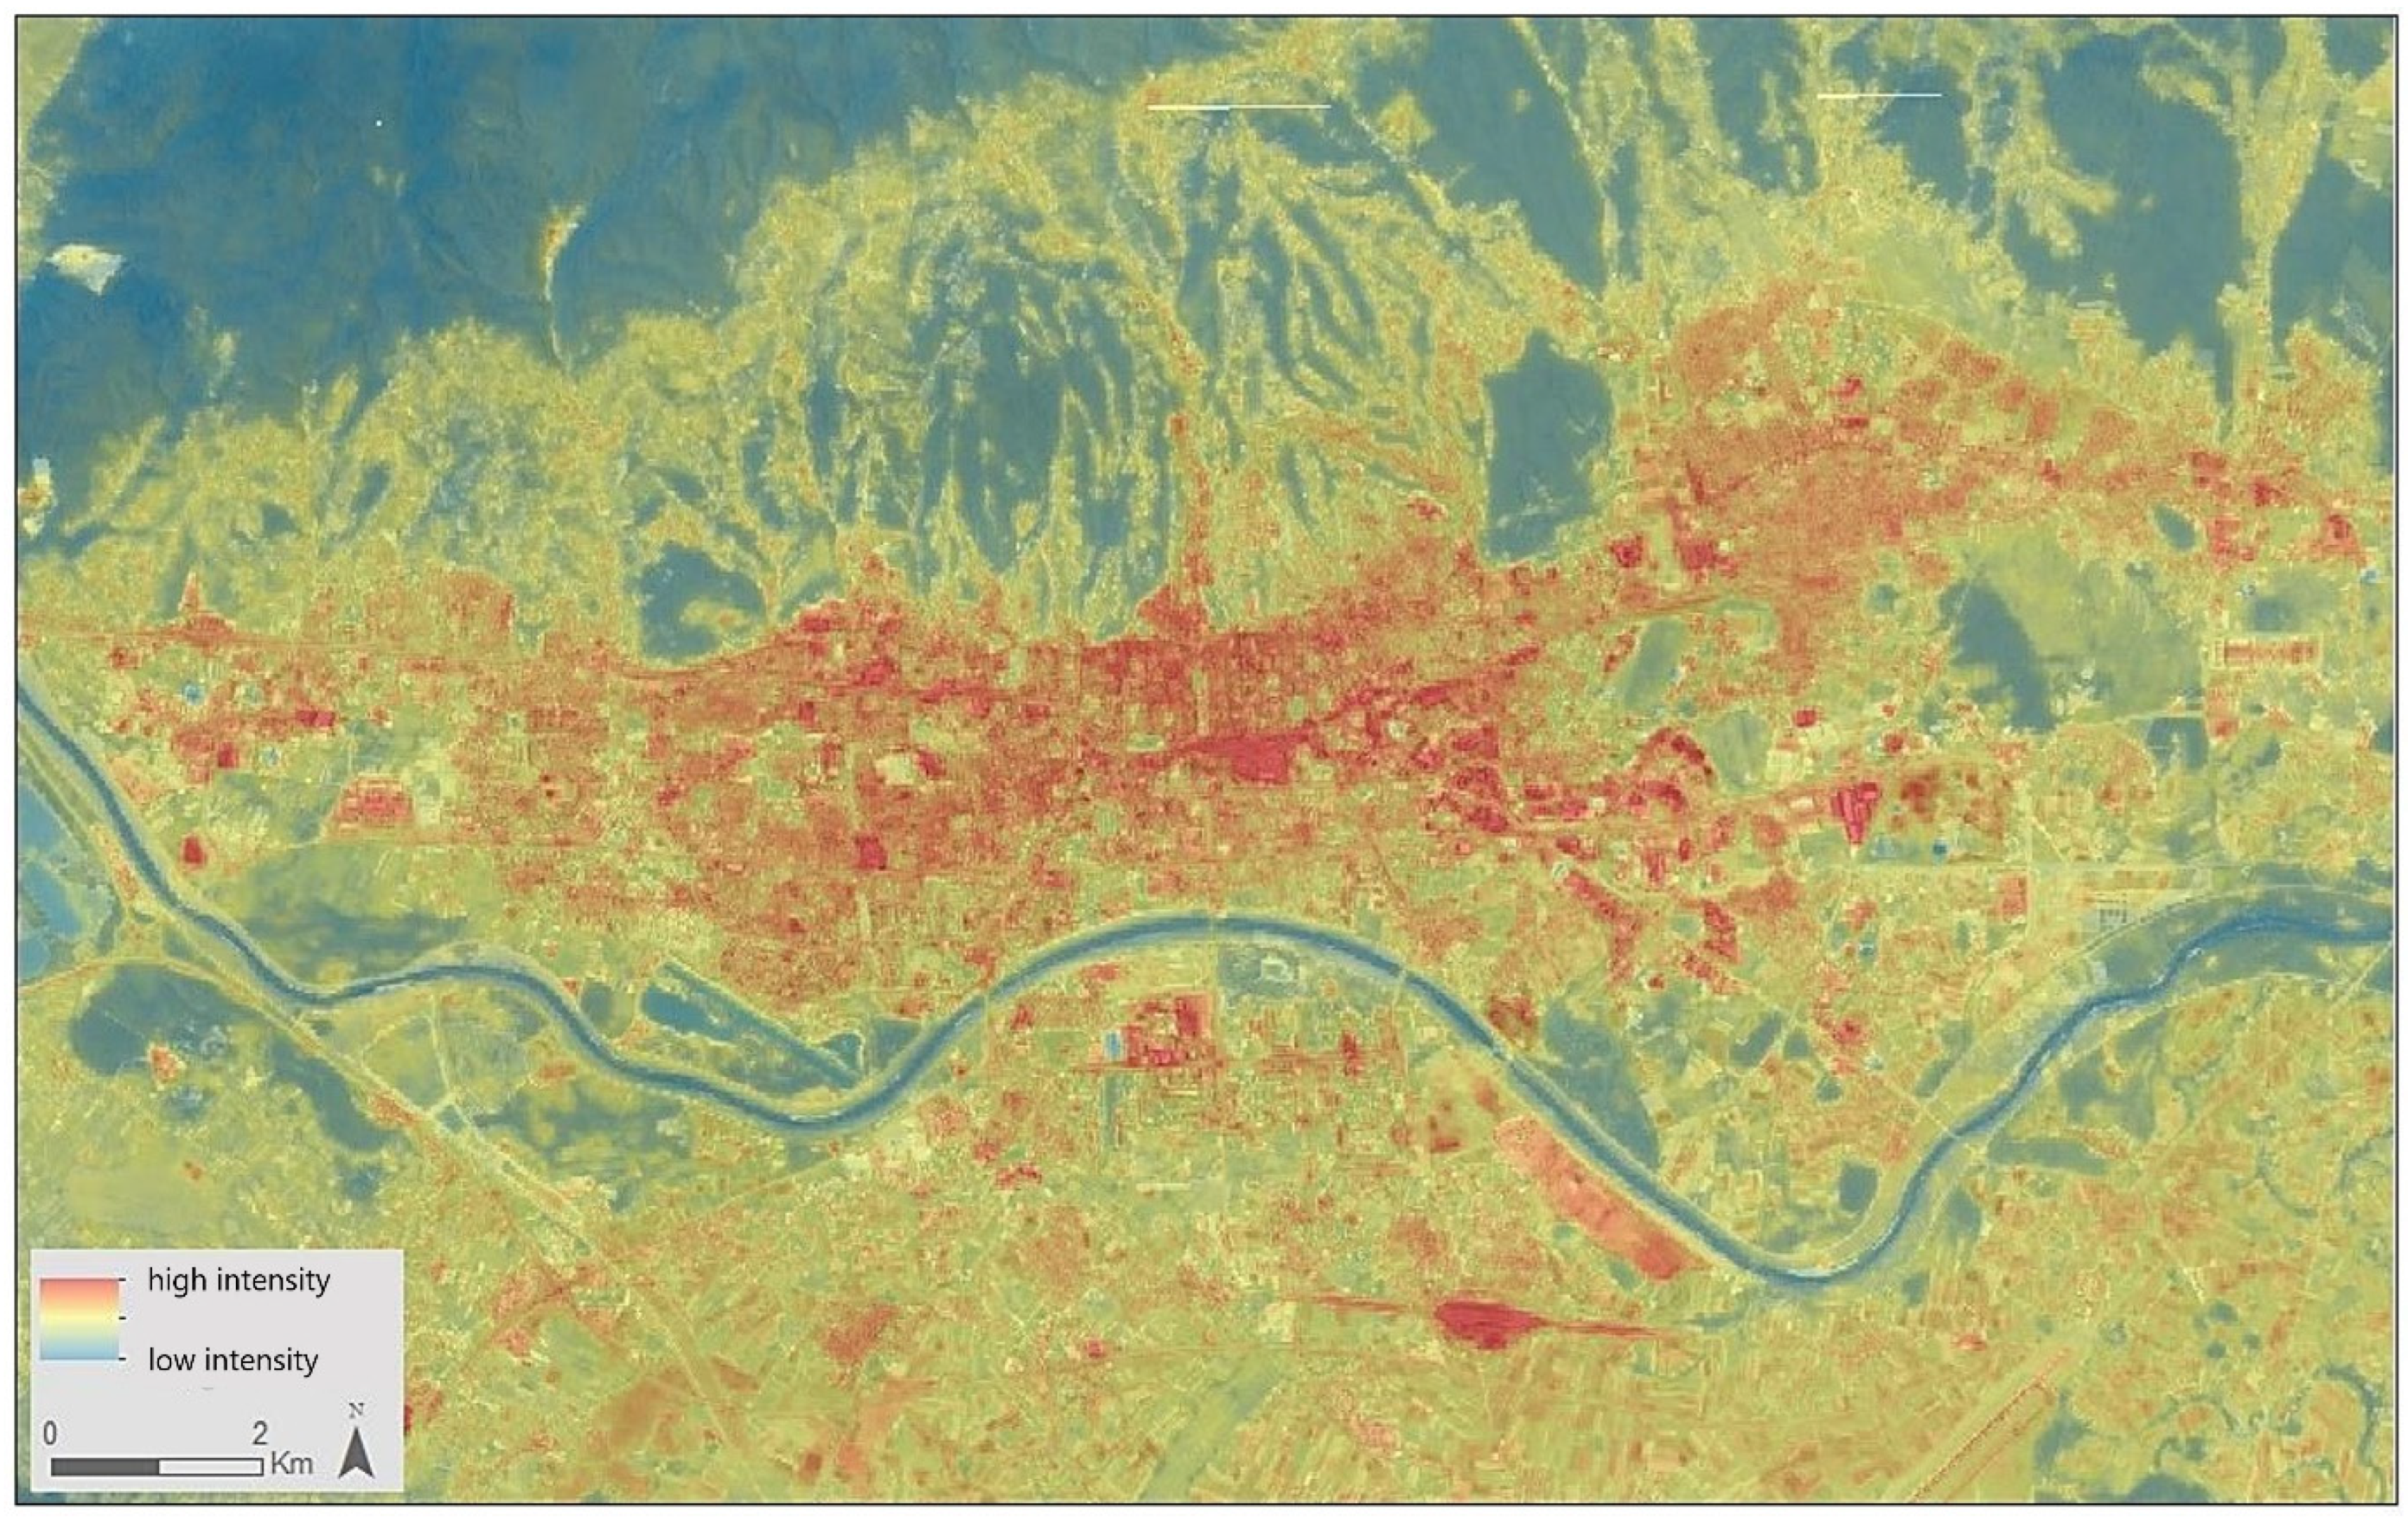
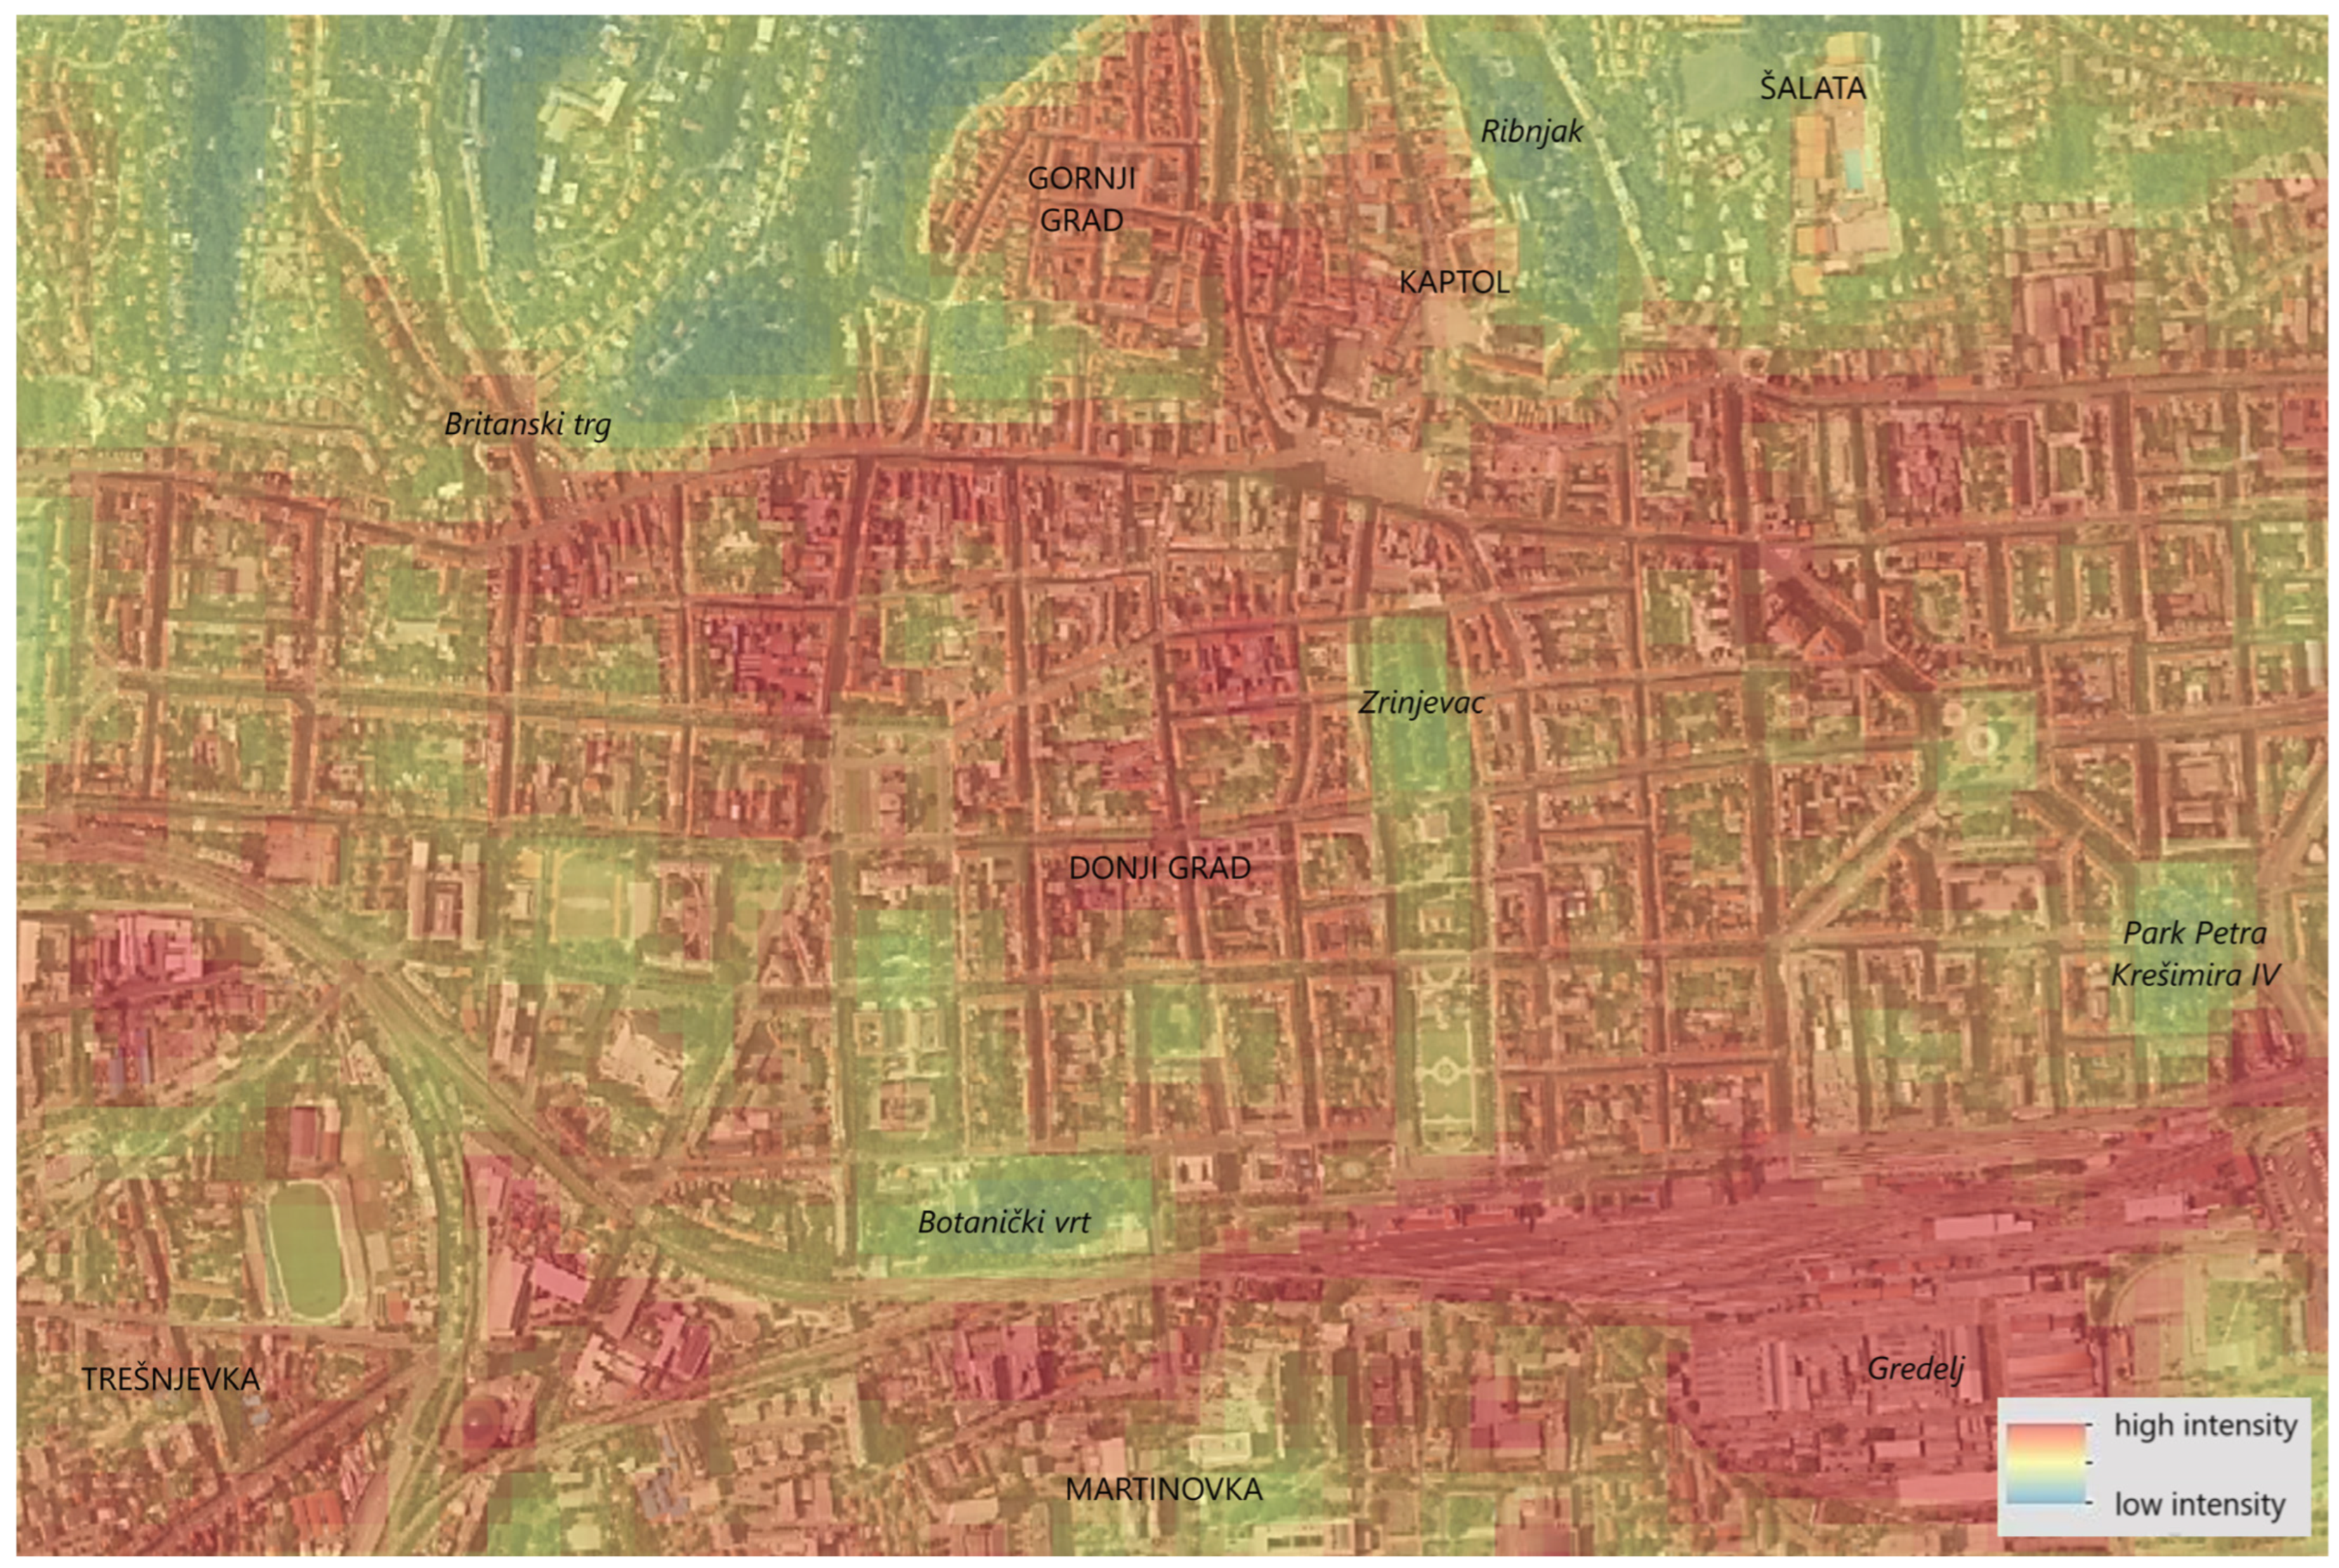
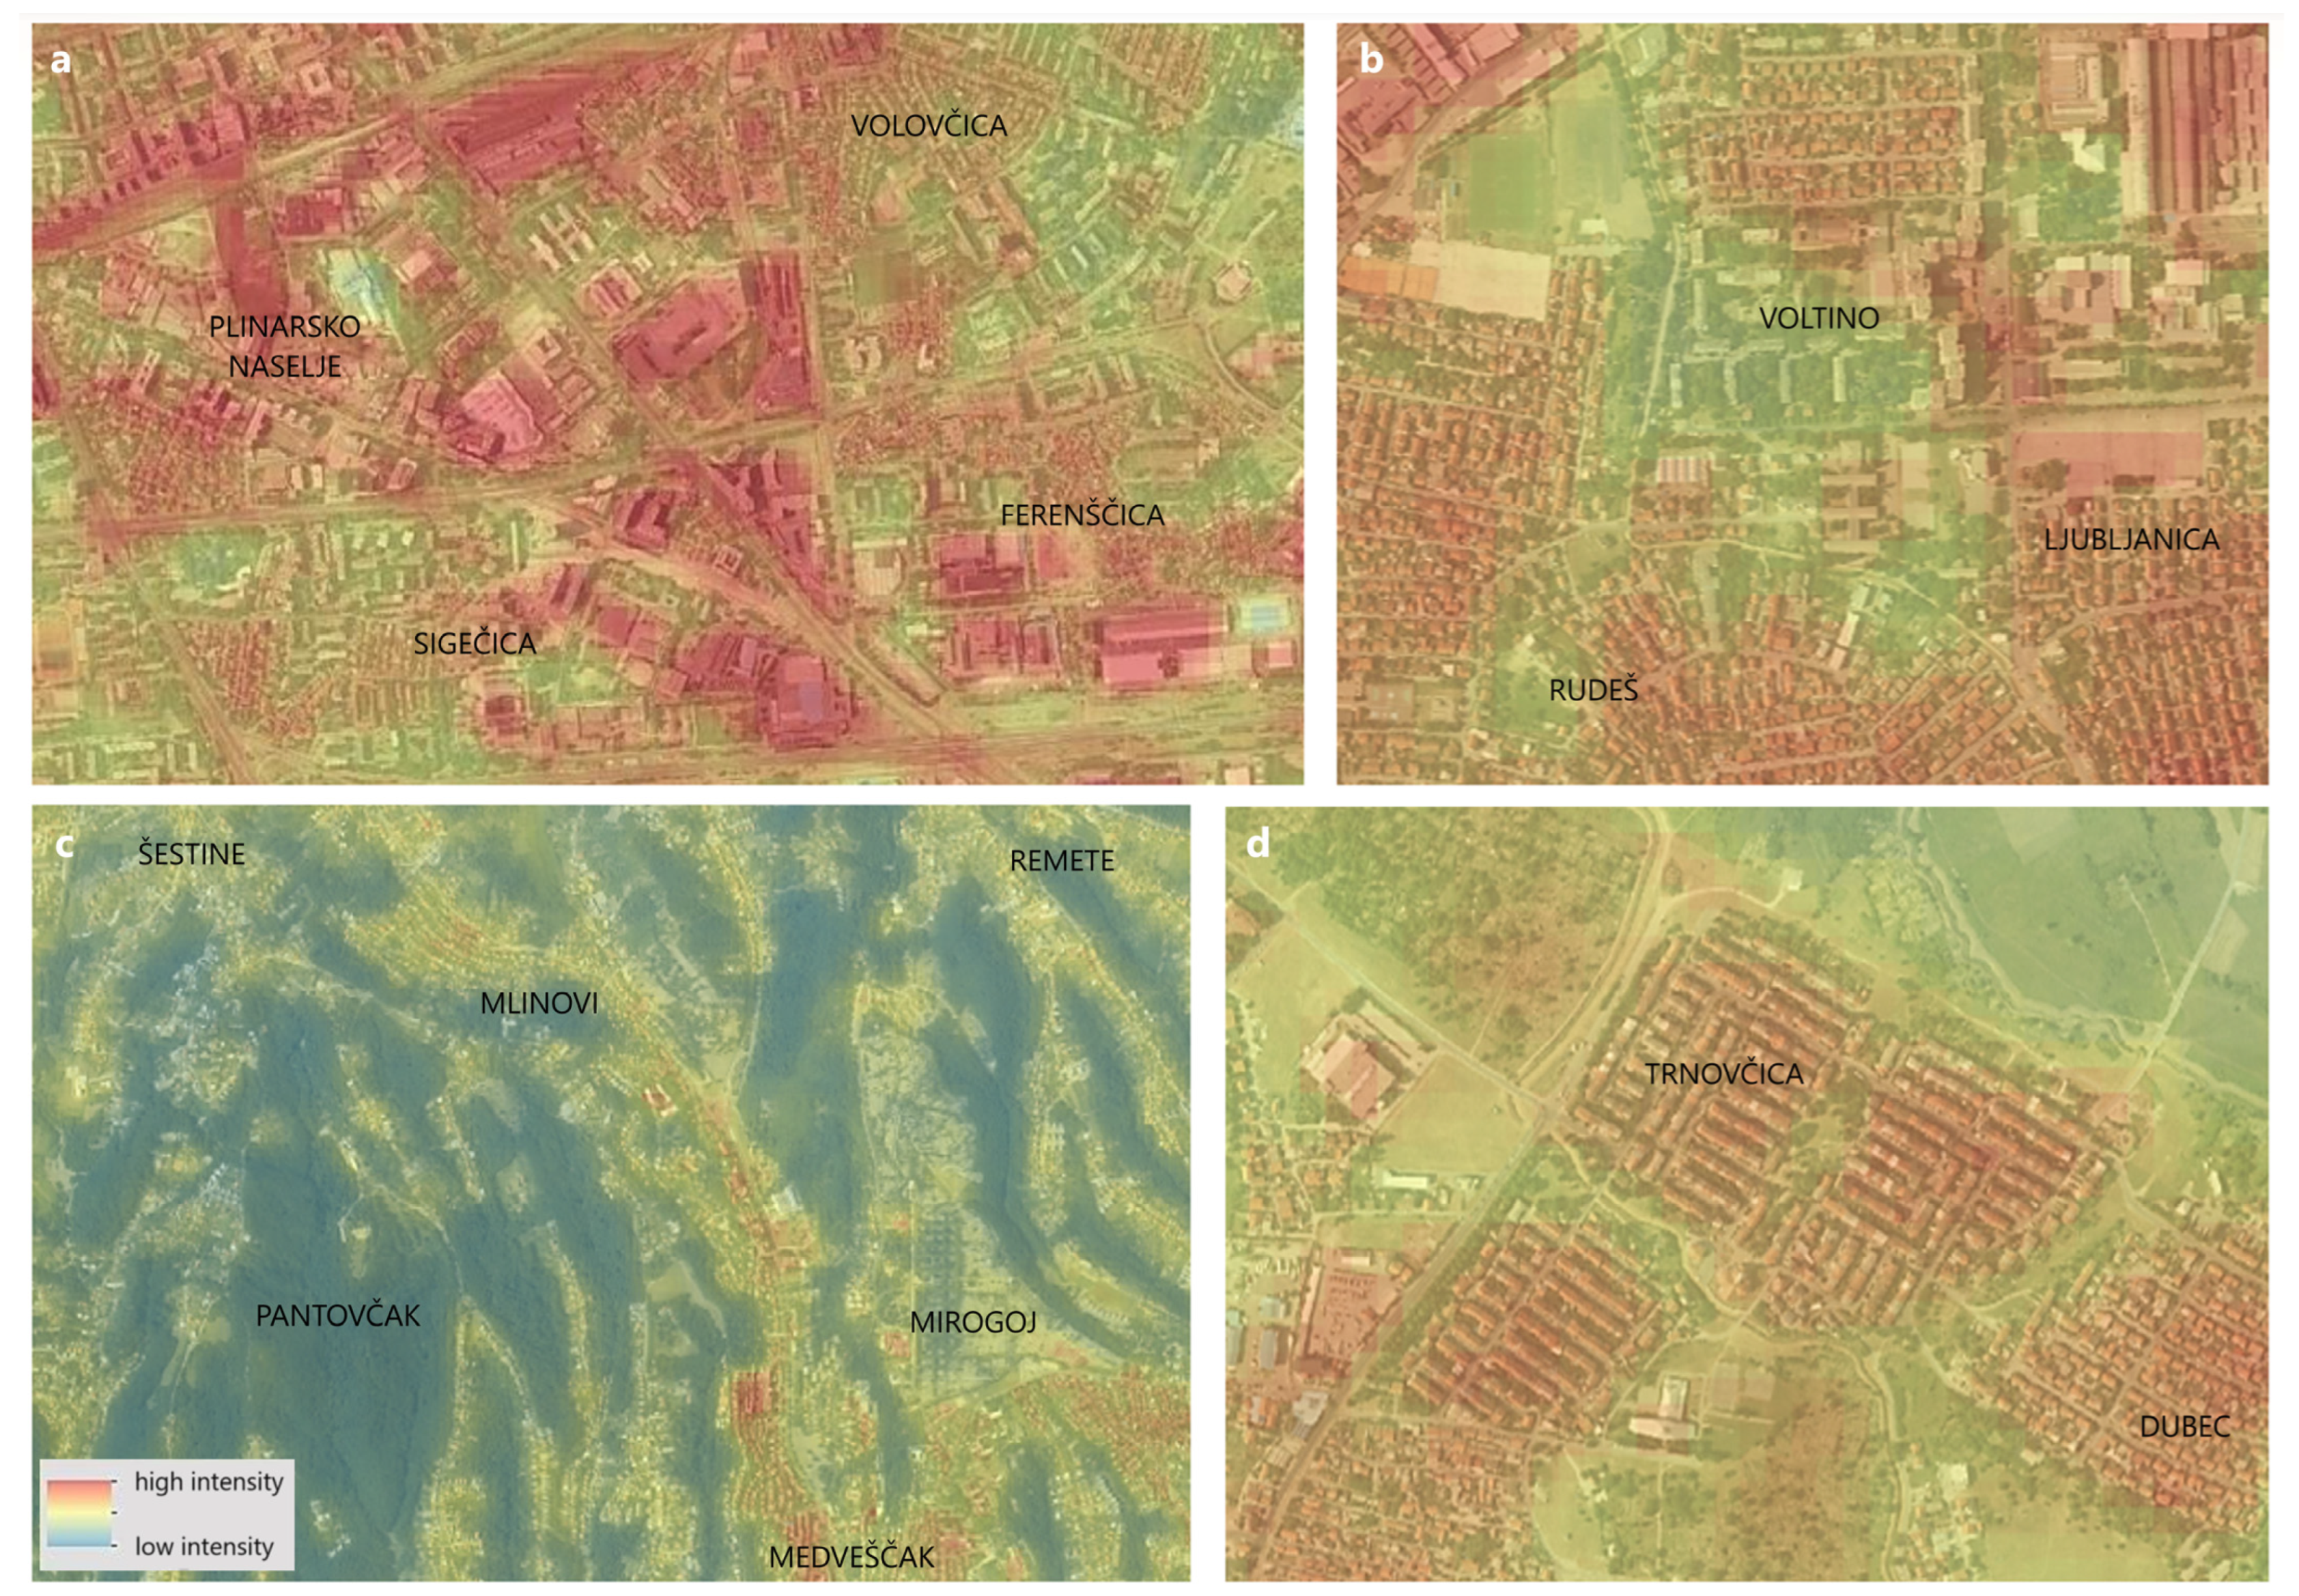
3.1. UHI Intensity Map

The overall findings of the analysis regarding the intensity of Zagreb’s UHI are presented in Figure 4. To delve into the specific characteristics of UHI behavior, Figure 5 and Figure 6 offer zoomed-in views of particular segments from Figure 4.
In broad terms, the spatial features of UHI intensity exhibit considerable heterogeneity, displaying variable behavior dependent on the city district. Notably, high intensity, depicted in dark red on the map, is concentrated in specific locations irregularly distributed throughout the city. The eastern (Žitnjak) and western (Jankomir) industrial zones, as well as areas related to railway usage (such as the Gredelj complex, marshalling yard, or tramway depots), stand out prominently. Certain tertiary sector zones, particularly a business area around Radnička street (predominantly in Sigečica and Plinarsko naselje), register exceptionally high intensity values. Detailed characteristics of UHI behavior in this specific zone can be observed in Figure 6a.
High UHI intensity is evident in the city center, indicated by the red color on the map. This specific area is magnified in Figure 5. Gornji Grad exhibits high intensity values, as does the majority of the central Donji Grad area. Conversely, lower UHI levels are noted in the western portion of the city center. Notably, cooler zones (depicted in green on the map) emerge within areas of consistently high intensity, particularly where built-up spaces are replaced by parks (“green horseshoe”).
The presence of medium-high UHI intensity extends more widely on the map, encompassing all city areas, particularly those outside the city center. This is represented by light red and orange pixels. Residential zones like Dubrava, Trnje, or Trešnjevka exhibit this characteristic with a consistent pattern, while Novi Zagreb or Gajnice display more variability and slightly lower intensity. Neighborhoods exemplifying this type of UHI behavior are depicted in Figure 6b,d.
The yellow pixels on the map signify medium-low UHI intensity. Their spatial distribution is irregular, noticeable both in the northern districts along the Medvednica slopes and in suburban areas to the south. In the northern regions, these pixels are more sporadically distributed within built-up areas, interspersed with large low-intensity fragments (Figure 6c). In the suburban sections, they correspond predominantly to continuous non-built land.
Low-intensity values, depicted as light green pixels on the map, are primarily associated with areas covered by vegetation, such as urban parks or land fragments with less dense vegetation cover. These areas are distributed throughout the city, including the city center, exemplified by the botanical garden and park Zrinjevac (Figure 5), as well as in the outskirts, such as Vukomerec.
Lastly, very low UHI intensity prevails in the northern part of the city on the Medvednica mountain (Figure 6c), with several “cooler islands” within the city. Examples include the river Sava, lakes Jarun and Bundek, or dense urban forests that, in some instances, extend into densely built-up areas (e.g., park Maksimir, Tuškanac, Grmoščica).

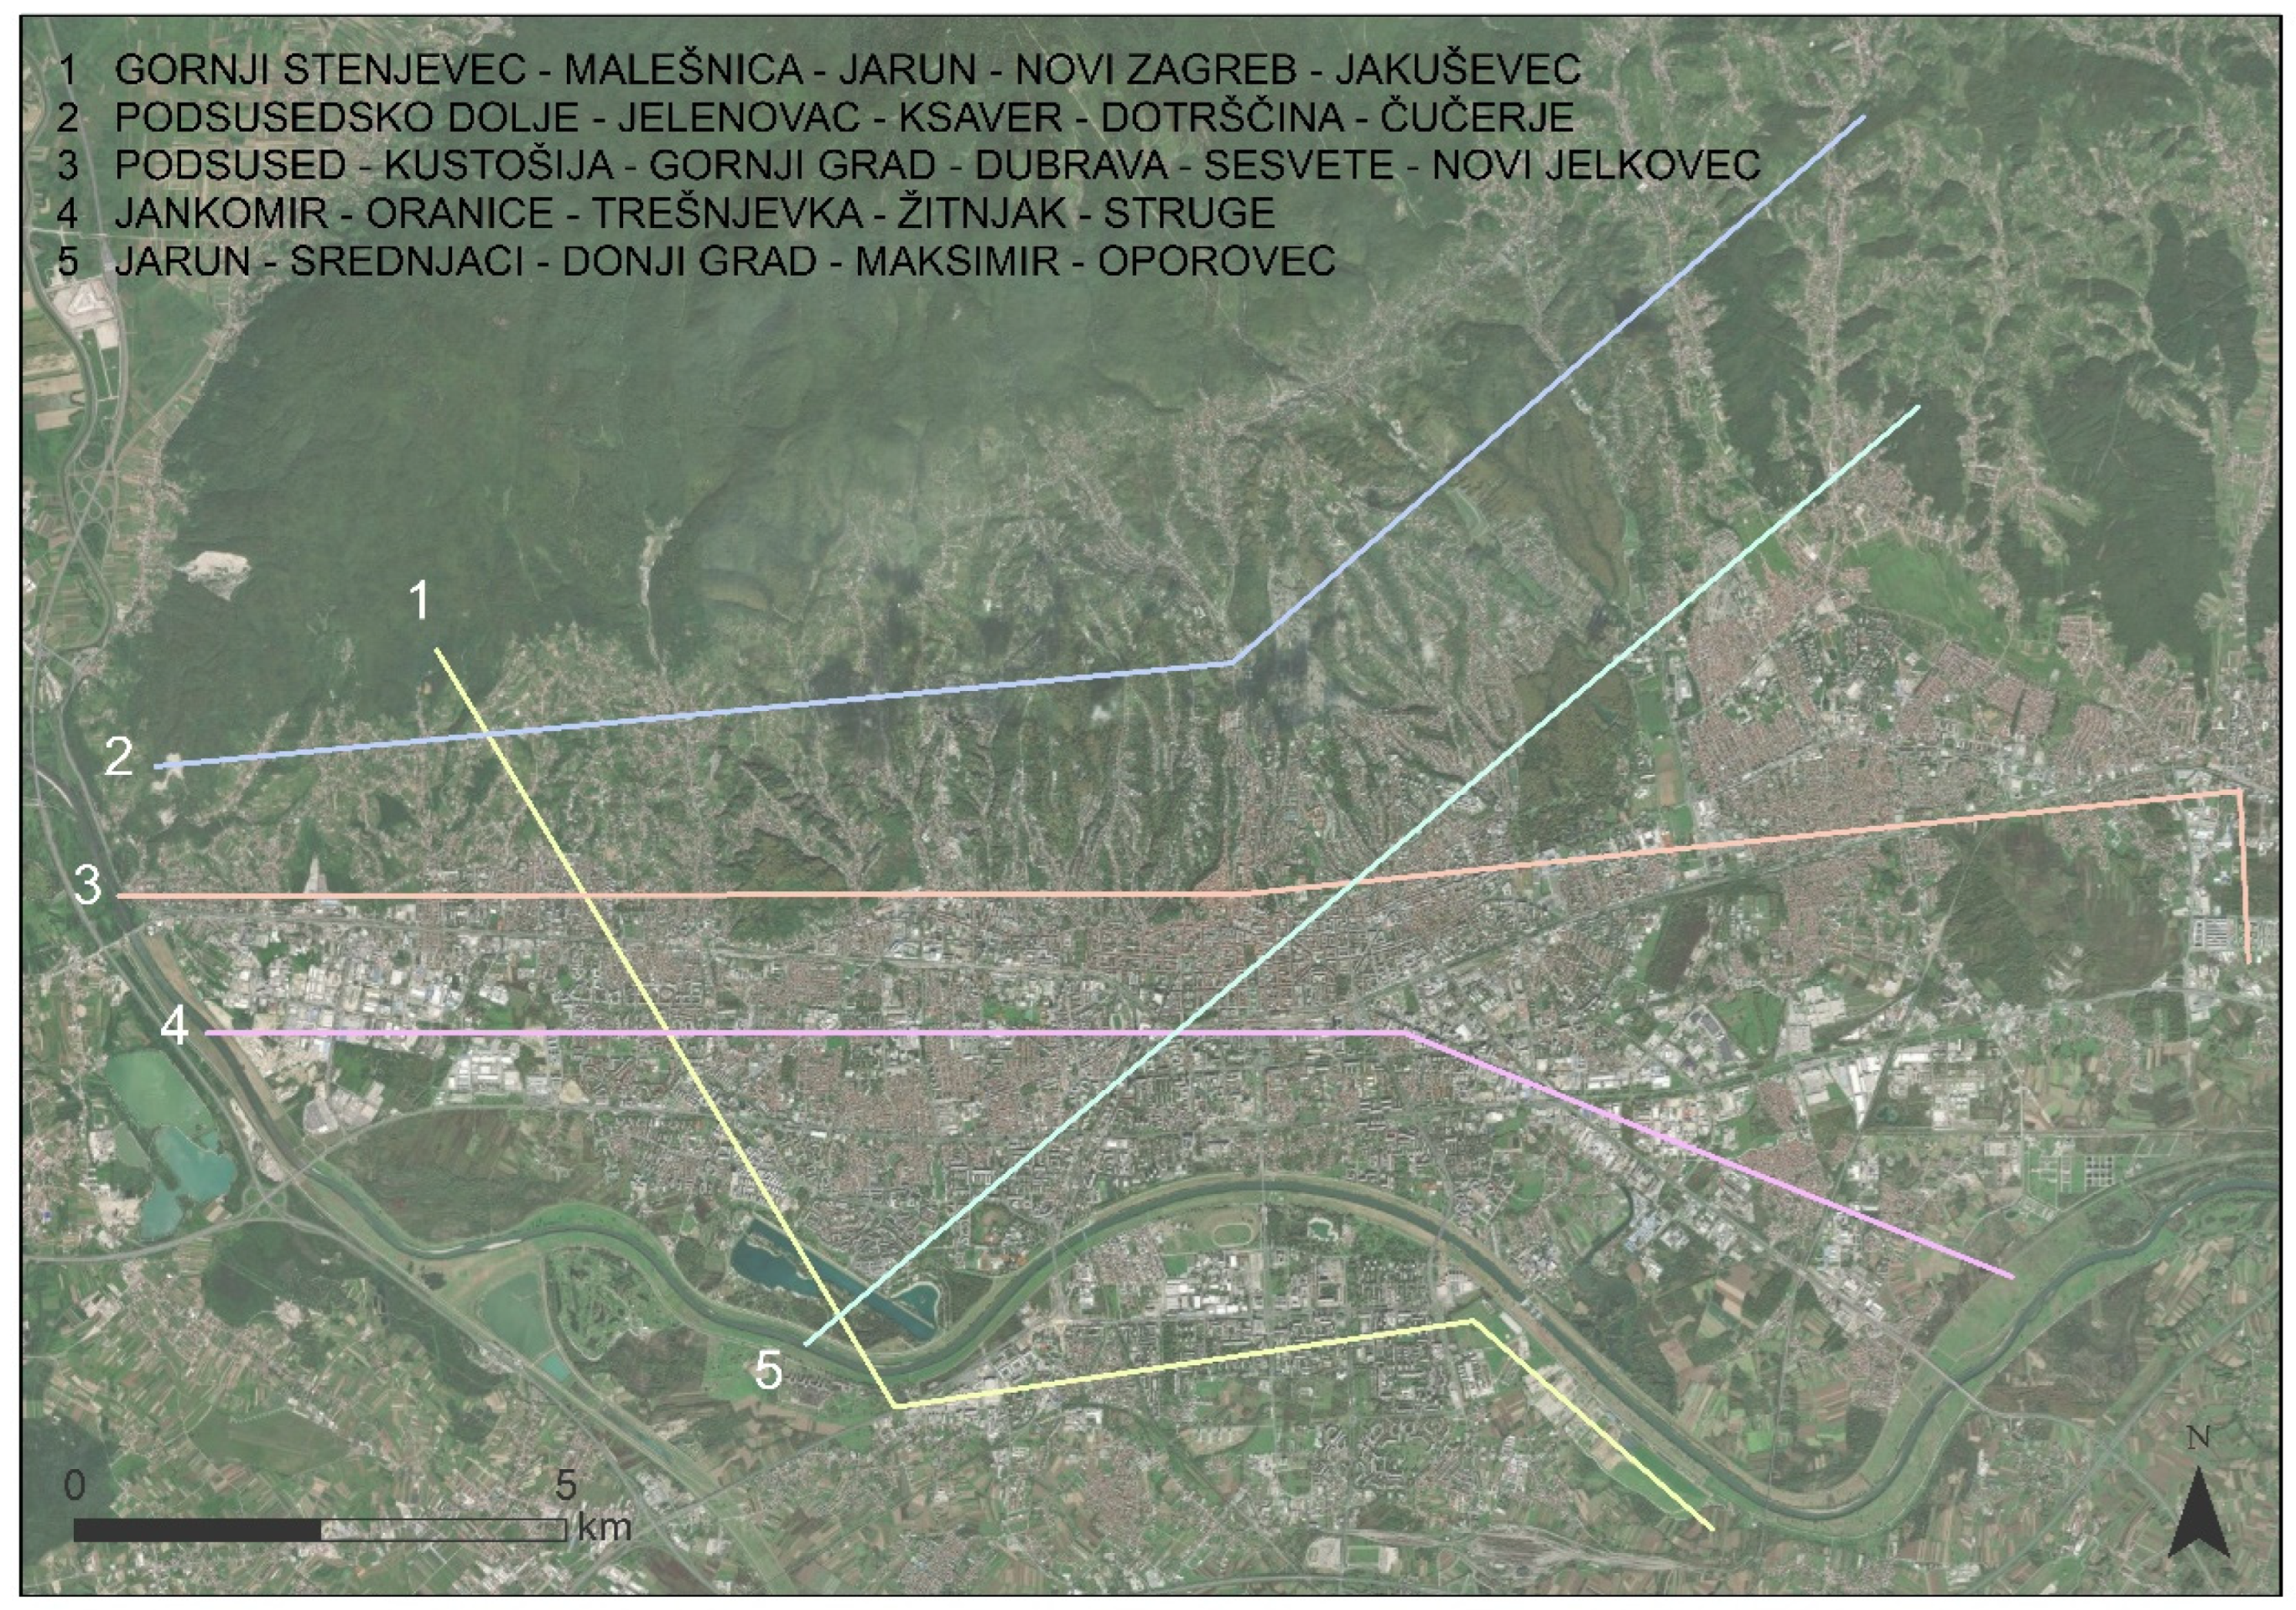
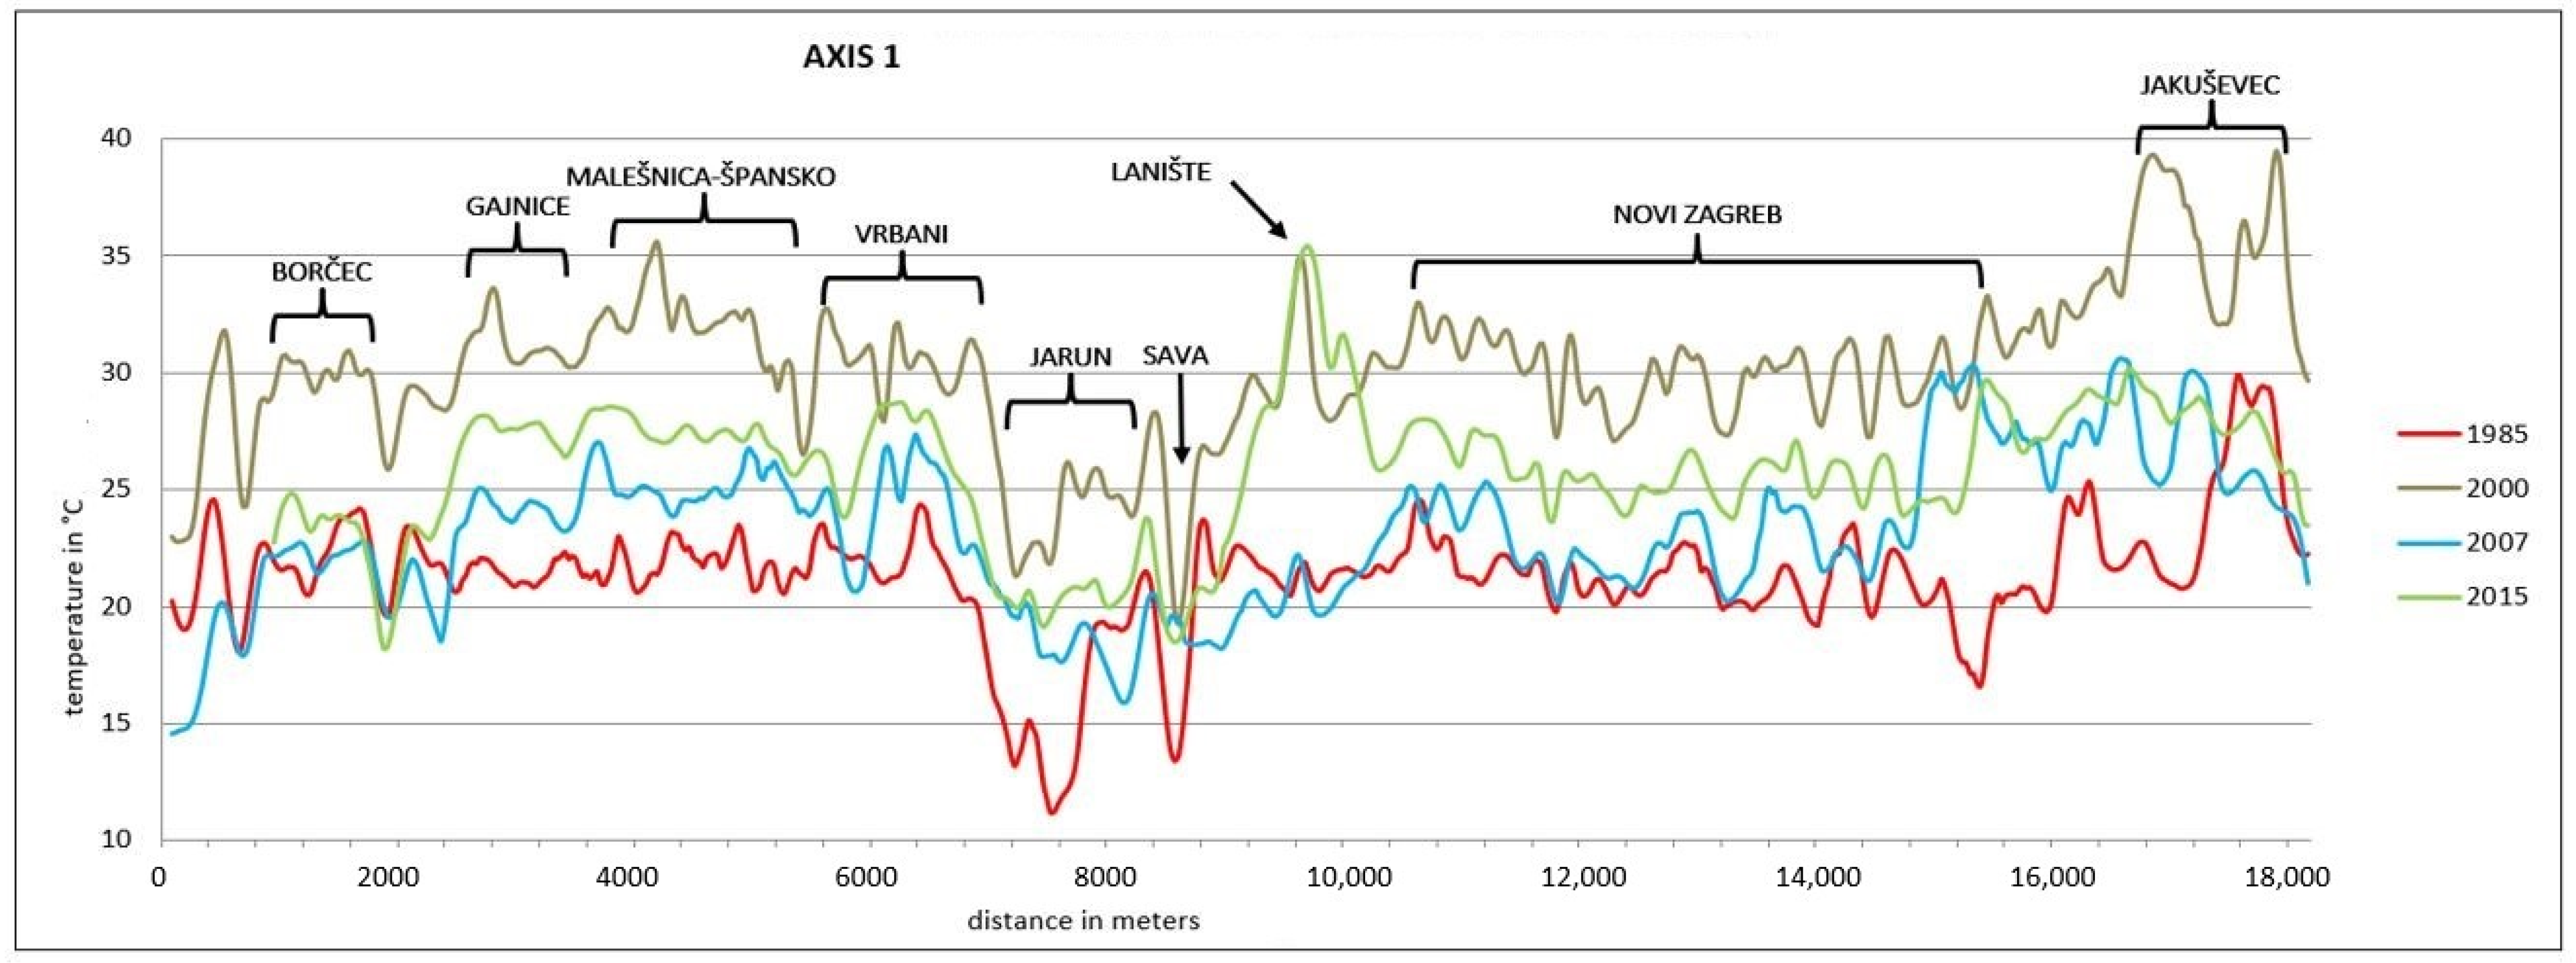
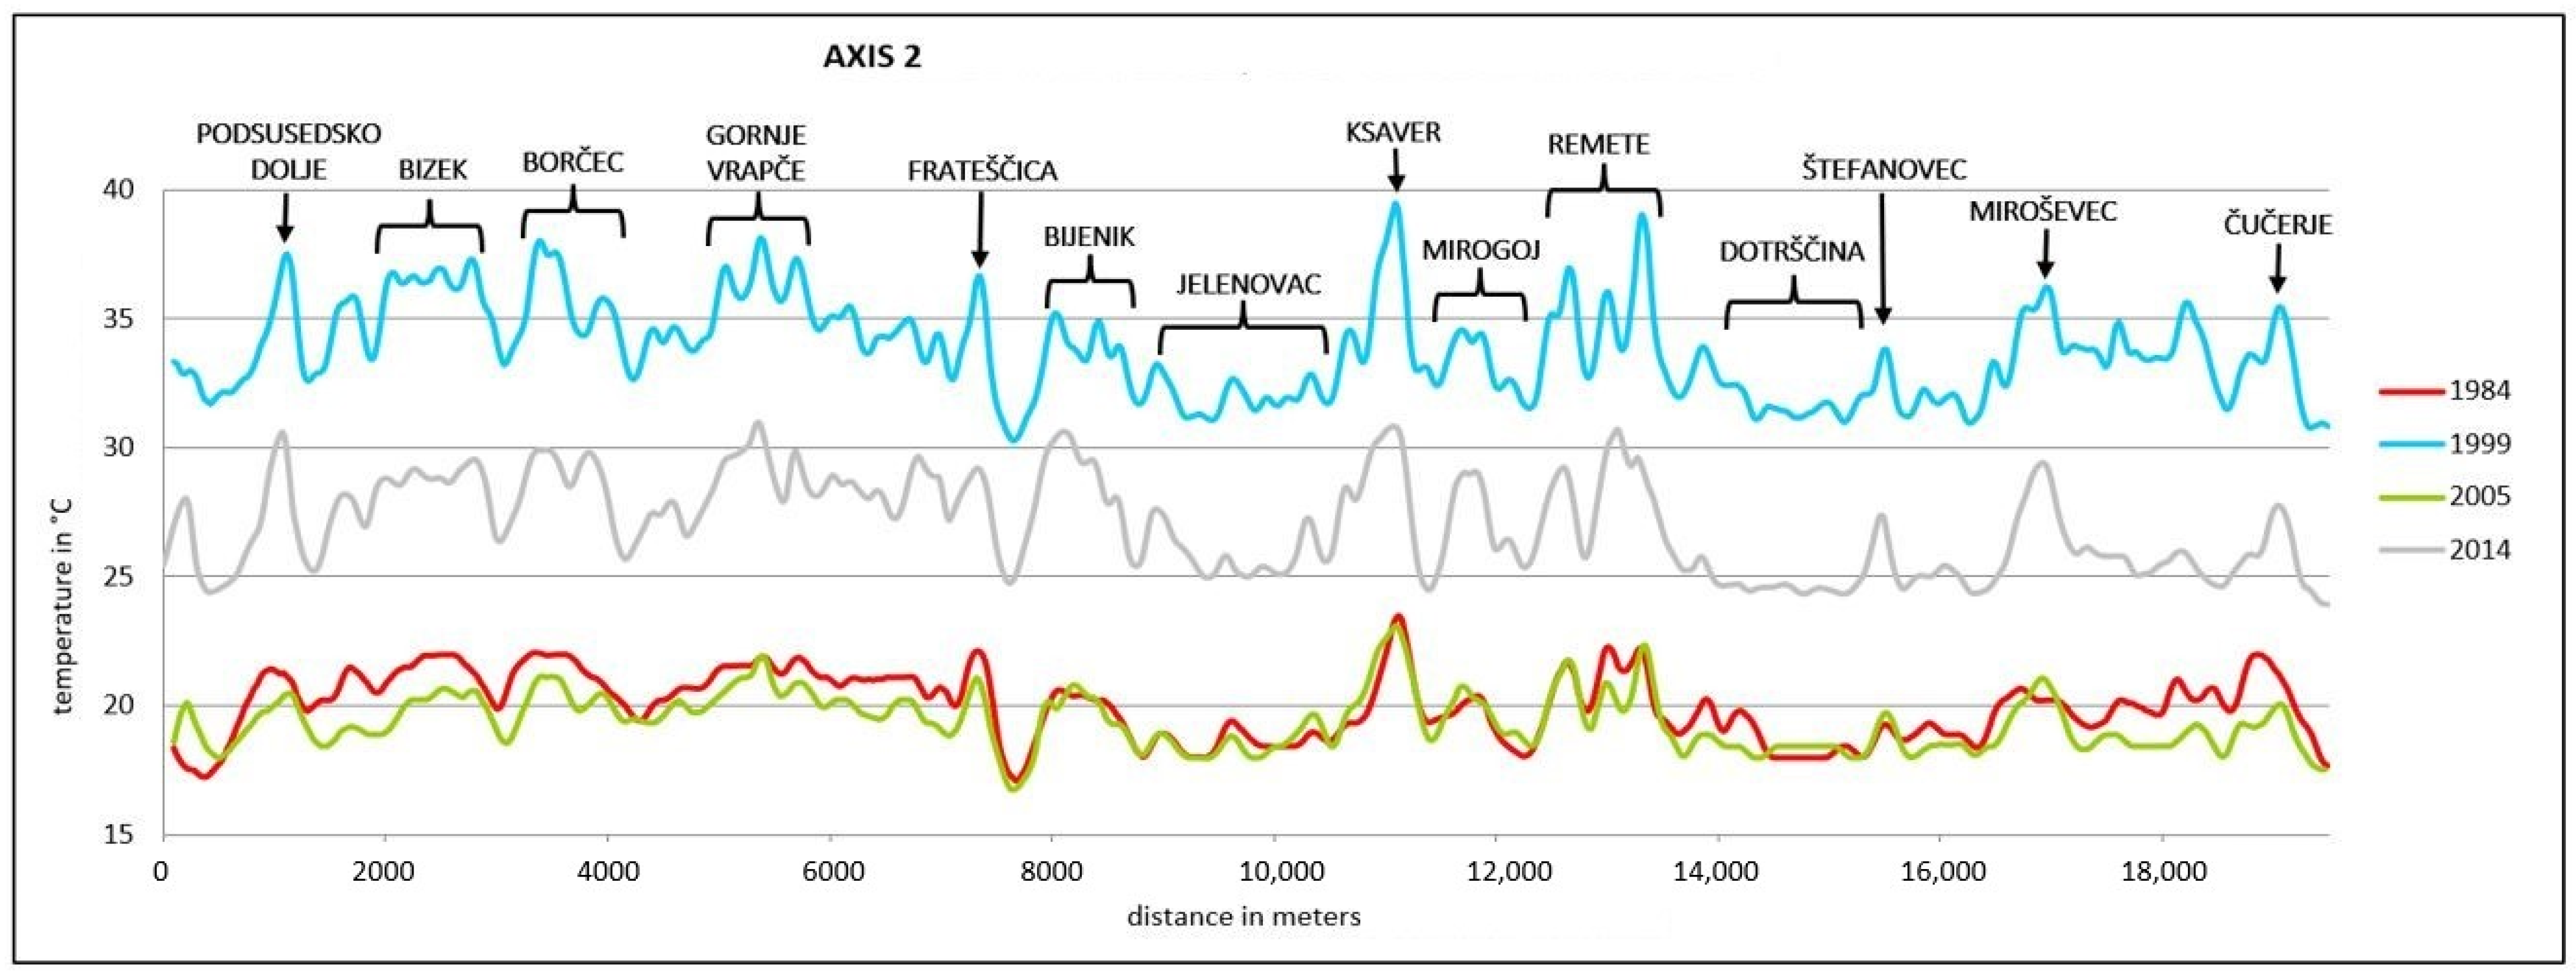
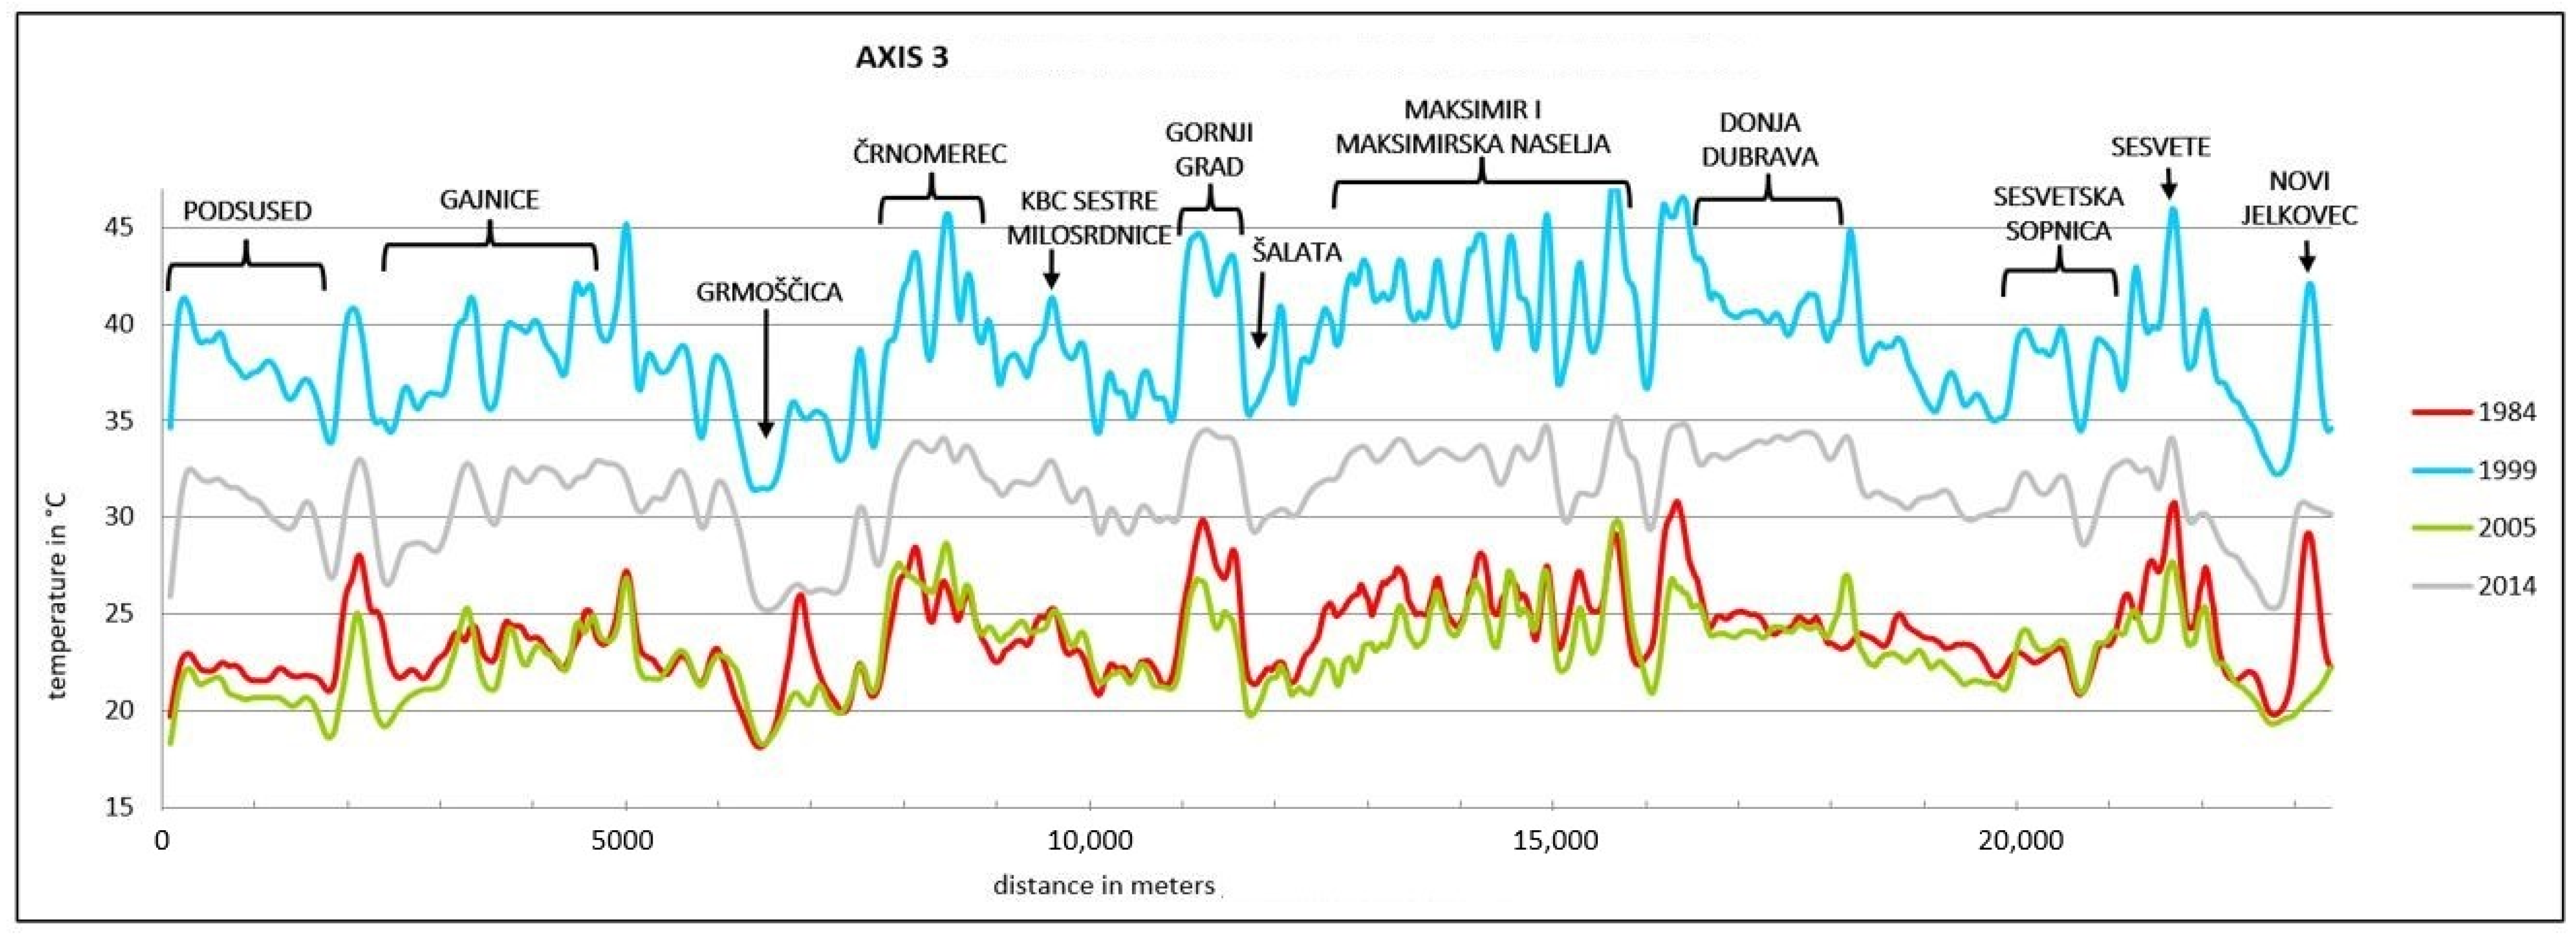
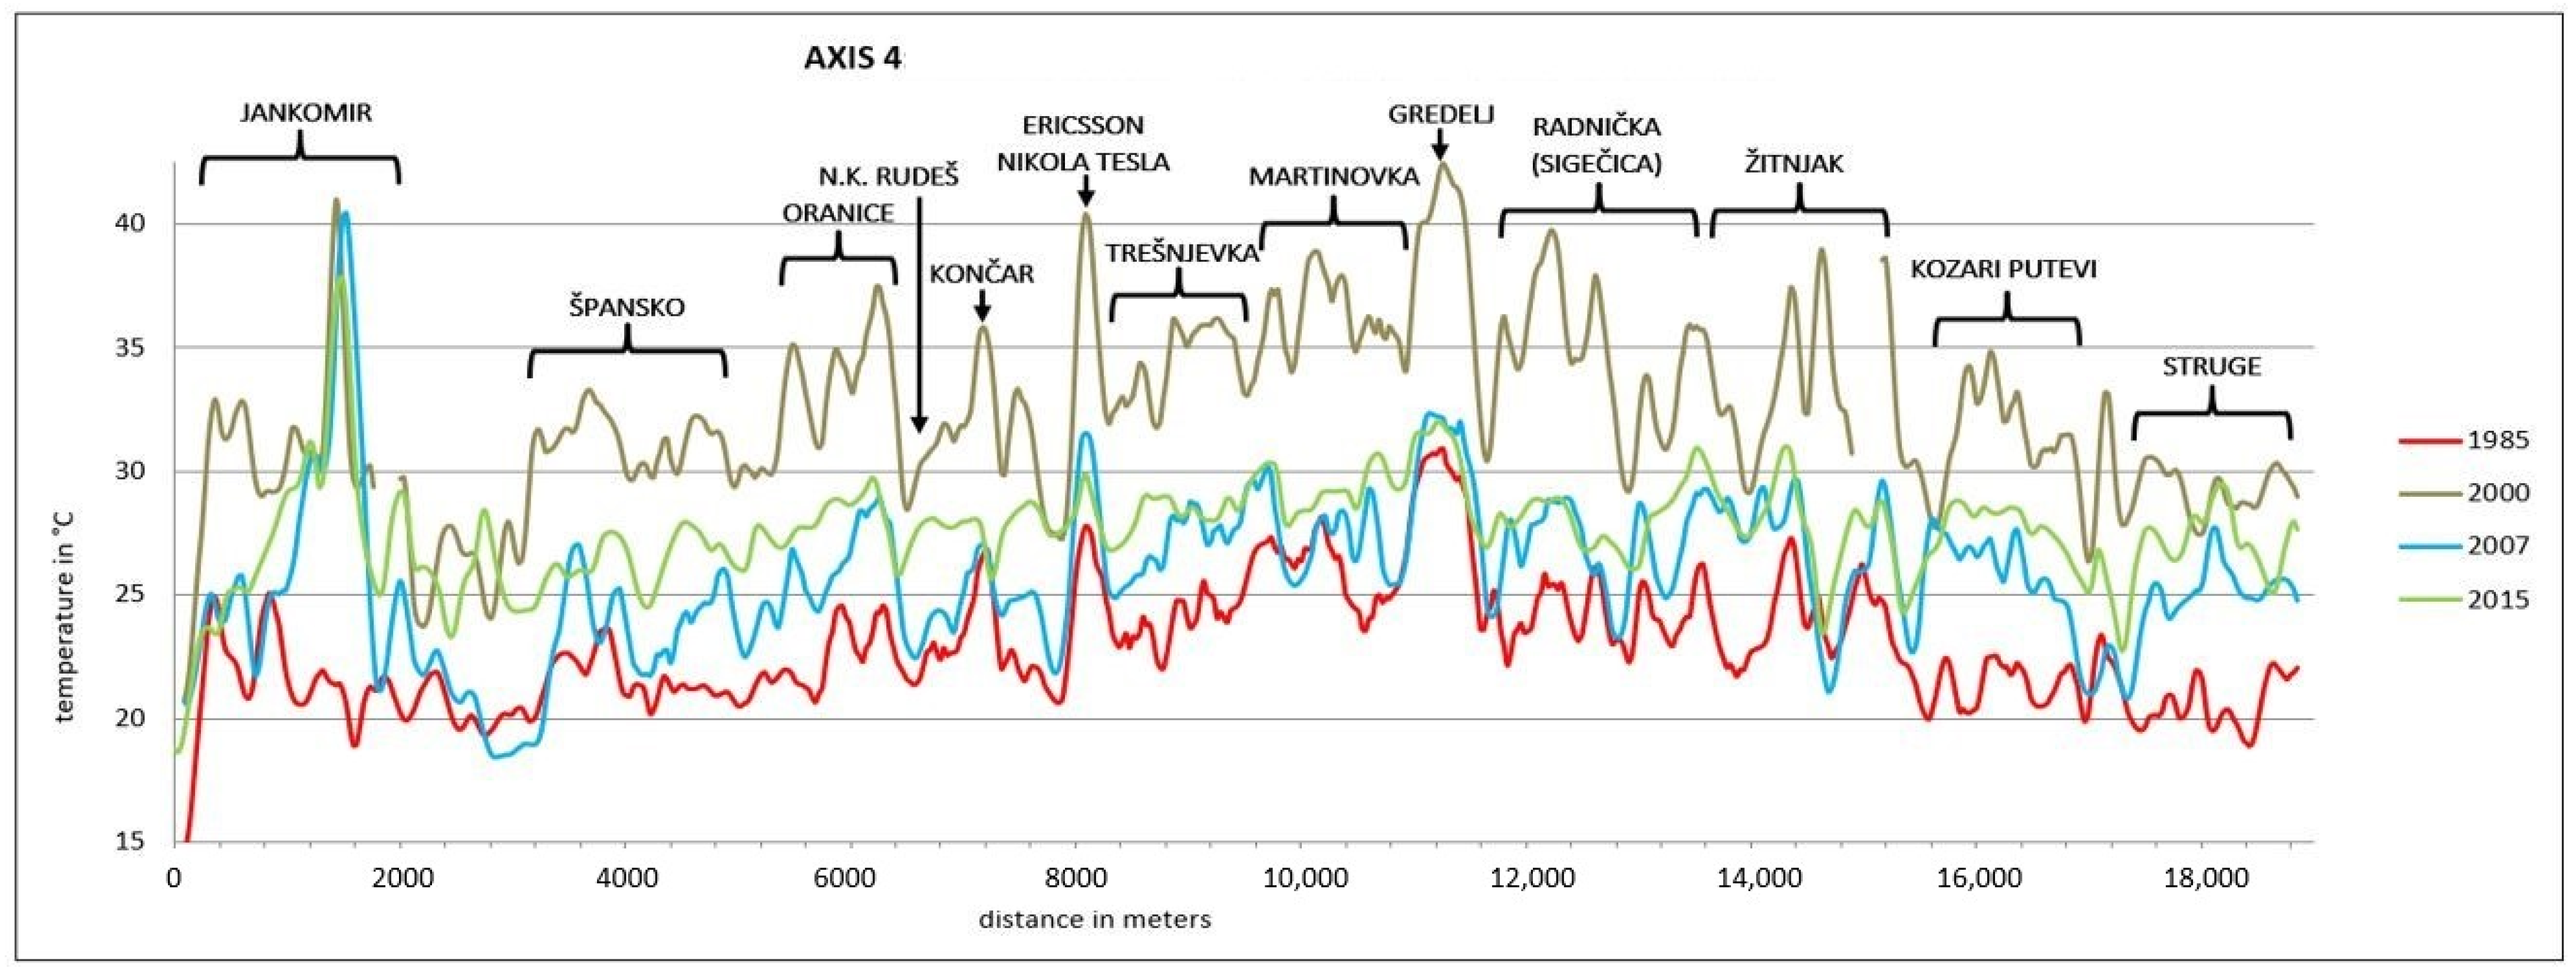
3.2. Thermal Profile Graphs

The results of the thermal graphs’ analysis are depicted in Figure 7, Figure 8, Figure 9, Figure 10 and Figure 11. These graphs provide a detailed overview of land surface temperature (LST) behavior within the city, following the predefined axes. The objective of these graphs is to illustrate the thermal variations between different city districts and temperature fluctuations based on land cover characteristics.
Axis 1 (Figure 7) traverses the city from the northwestern mountainous region towards the south, crossing the Sava River and horizontally passing through the Novi Zagreb area. Lower temperature readings are observed in mountainous neighborhoods, such as Borčec, and in the Novi Zagreb area. Additionally, Novi Zagreb exhibits relatively high and consistent temperature variations along the axis. Gajnice, Špansko, Malešnica, and Vrbani display similar thermal profile behavior, with temperature readings slightly higher than those in Novi Zagreb and Borčec. Lanište and Jakuševec are areas where multi-temporal changes were observed, transitioning from relatively low temperatures recorded in 1985 and 2000 to higher records in 2007 and 2015. Lastly, both Lake Jarun and the River Sava exert a substantial influence on the thermal profile, significantly lowering the temperature compared to neighboring areas.
The thermal profile of the northern part of the city is captured by axis 2 (Figure 8), corresponding to mountainous neighborhoods. The graph illustrates continuous temperature oscillations with several peaks and some areas of low temperature. As evident in Figure 6c, this region is characterized by consistent changes in land cover. Consequently, each peak on the graph aligns with an urbanized area, exhibiting varying levels of urbanization (where Bizek, Gornje Vrapče, or Bijenik have lower temperature readings than Remete or Ksaver), while each temperature decline is associated with natural surfaces, with Jelenovac and Dotrčšina being the most spatially extensive ones.
Axis 3 (Figure 9) traverses the entire city in an east–west direction, passing through the city center. The thermal graph displays heterogeneous behavior with distinct repetitive patterns. Irregular temperature variations are observed at the beginning and end of the graph, corresponding to areas situated on the outskirts of the city. Amid relatively low temperature readings, peaks are recorded in the Gajnice, Sesvete, and Novi Jelkovec neighborhoods. In the central part of the graph, closer to the city center, temperature behavior is more regular and mostly repetitive. Notable temperature peaks are identified in Črnomerec and Gornji Grad, while Maksimir and Maksimirska naselja exhibit consistent high–low temperature oscillations within a small area. Conversely, the temperature profile in Donja Dubrava shows minimal variations and a decreasing tendency toward the city outskirts. Low temperature records in the city center are noted in the neighboring areas of Gornji Grad (Tuškanac and Šalata). Finally, a significant temperature decrease is recorded in Grmoščica park.
Axis 4 (Figure 10) gathers information from both residential and industrial or tertiary sector-oriented city districts. The thermal profile displays a heterogeneous nature; however, certain repetitive behavioral characteristics can be discerned. Firstly, the highest temperature readings align with non-residential built-up areas, predominantly industrial complexes and zones (such as Gredelj, Ericsson Nikola Tesla, the industrial zone in Jankomir, and Žitnjak). Additionally, within the industrial and Radnička business zones, some changes in graph tendencies can be observed on a multi-temporal basis, reflecting land use changes. Secondly, districts like Oranice and Martinovka record relatively high temperature readings with distinct temperature variations and certain multi-temporal changes, albeit exhibiting notably smoother features compared to the previously mentioned areas. Thirdly, the residential neighborhood of Trešnjevka registers relatively high LST values, but without notable temperature oscillations. Finally, residential neighborhoods situated on the city outskirts, such as Špansko, Kozari putevi, and Struge, exhibit mostly homogeneous graph characteristics with relatively low temperature records.
Axis 5 (Figure 11) traverses the city in a southwest–northeast direction, passing through residential neighborhoods, the city center, and several parks and urban forests. Irregular graph characteristics are observed in districts like Gredice, Srednjaci, Knežija, and Laščina, where temperature oscillations can be noted, but without any discernible regular pattern. This contrasts with the LST behavior in Donji Grad, where all variations exhibit almost entirely regular and repetitive features. Lastly, several noticeable temperature decreases can be observed in different parts of the city. Among them, Jarun, Botanički vrt, and Granešina are less spatially extensive and register smaller thermal oscillations, while in Maksimir, these characteristics are considerably more pronounced.

4. Discussion

In this research, we undertook a spatial-temporal examination of UHI traits within Zagreb. Our study highlights variations in UHI intensity across different city districts, primarily influenced by urban morphology, with temporal fluctuations stemming from alterations in land use and city development. While UHI hotspots and cooler pockets within the city align with findings from prior research [26,31], our study offers a broader temporal perspective on spatial shifts, incorporating historical data to illustrate continuous changes across neighboring surfaces within the city. Furthermore, the study aimed to scrutinize and evaluate the role of various types of UGSs in mitigating the UHI phenomenon [45,46,47]. Recent years have witnessed a heightened awareness of the significance of UGSs in urban environments, particularly following the publication of the Millennium Ecosystem Assessment (MEA) and the establishment of more refined frameworks for studying ecosystem services [48]. Given the current global context characterized by escalating urbanization trends and the impacts of climate change on urban life quality, there is a pressing need for research that can inform urban planning policies aimed at enhancing human well-being [49,50,51]. In this regard, comprehending the spatial attributes of UGSs at the local level is essential for gaining a comprehensive understanding of climate regulation in urban areas and effectively managing them [52,53,54].
The findings reveal that UHI behavior in Zagreb exhibits heterogeneous characteristics, yet discernible patterns can be discerned and linked to features of UGSs. Within the city center (Donji Grad), where urban morphology is defined by continuous building development, street trees exhibit minimal impact on reducing UHI intensity. However, city parks with consistent tree cover serve as cooler enclaves amidst predominantly warm surroundings. Temperature differentials of up to 5 °C are recorded, clearly distinguishing built-up areas from UGS. Additionally, the physical and structural characteristics of UGS significantly influence UHI intensity. A dense canopy configuration enhances the cooling effect, with high tree density and leaf area density notably reducing the maximum daily temperatures in vegetated areas compared to built-up surfaces or sparsely vegetated parks [55]. While pervious surfaces without trees (such as meadows or agricultural areas, typically located on the outskirts of Zagreb) do reduce UHI intensity, their cooling effect is less pronounced than that of tree-covered UGSs [56]. Additionally, a fragmented spatial distribution of urban green areas has a weaker cooling effect than contiguous canopy cover, as seen when comparing city parks to urban forests [57]. These general findings are also evident in our study area, as shown by the UHI intensity maps and thermal graphs. Temperature variations are lower in the city center or within artificially created UGSs than in naturally occurring urban forests in the northern neighborhoods. Among inner-city parks, those with denser vegetation cover have a greater cooling effect (for example, Botanički vrt, Šalata, etc.). Beyond providing insights into the current impact of UGSs on UHI mitigation, these findings can be directly applied to future urban planning to enhance cooling effects within cities. Furthermore, considering tree species’ suitability and utilizing specific indices, such as the leaf area index, can improve the management of UGSs and their integration into city planning [58].
Residential areas situated beyond the city center display distinct typologies based on their construction era. Generally, districts constructed in a predominantly socialist style play a significant role in mitigating UHI intensity (Novi Zagreb, Gredice, Srednjaci, Knežija). However, as construction years progress, the effectiveness of UHI mitigation diminishes, with newer neighborhoods registering higher UHI values (Špansko, Malešnica, Vrbani). This pattern correlates directly with the spatial distribution and size of UGSs within these districts. Socialist-era neighborhoods, characterized by extensive planning and the incorporation of ample green spaces such as wide avenues and large city parks, exhibit temperature trends that closely align with park size. Over time, urban planning shifted towards predominantly profit-driven construction, often neglecting the inclusion of green spaces within neighborhoods, thereby directly impacting human well-being. These findings demonstrate a strong connection between urban morphology and UHI intensity [59,60]. In addition to street layout, the relationship between streets and parks, and park size, building typology, and construction density play a significant role in mitigating the UHI [61,62]. Tall buildings generally help reduce UHI intensity through shading; however, when densely clustered, they can increase the UHI due to greater anthropogenic heat effects [63]. Therefore, a combination of sparsely located tall buildings and large vegetated parks offers the best results for UHI mitigation. In many cases, the urban morphology of Zagreb’s socialist style developments exhibits these favorable characteristics, making them the most effective form for mitigating the UHI phenomenon. In contrast, newer neighborhoods tend to have greater spatial heterogeneity, characterized by smaller, fragmented UGSs and denser clusters of lower buildings—factors that contribute to higher UHI intensity [64,65].
Residential areas comprised mostly of single-family homes display less temperature variability within neighborhoods compared to those dominated by residential buildings, but generally medium-high UHI records (Trešnjevka, Donja Dubrava, Kozari Putevi). These areas typically consist of parcels housing a single-family dwelling and an adjacent garden, with the temperature records closely linked to parcel size. Neighborhoods with smaller parcels tend to have higher construction densities and consequently higher UHI intensities. Conversely, private gardens play a more pronounced role in UHI mitigation in areas with larger parcels, typically situated farther from the city center. As demonstrated in prior research [15], the size of UGSs also plays a role in determining the extent of temperature reduction within these areas and their surrounding vicinity. Larger UGSs tend to contribute more significantly to temperature reduction within urban environments, particularly those containing urban forests, which create distinct microclimates. This trend is evident in Zagreb, where urban forests or expansive urban parks, often situated near built-up areas, markedly alter thermal patterns or establish cool islands on UHI intensity maps (such as Maksimir and Jarun). Temperature differentials of up to 10ºC are recorded in these instances. Furthermore, multi-temporal observations clearly illustrate how changes in land use, such as the conversion of agricultural land or green spaces into built-up areas, directly impact UHI intensity (as observed in areas like Lanište and Jankomir).
The current UHI characteristics in Zagreb are heavily influenced by the city’s historical development, planning practices, and socio-political circumstances. While drastic changes may not be feasible now in many cases, some modifications can be made. More importantly, these past practices, both positive and negative, can serve as valuable examples for future urban planning and the integration of UGSs in urban development. A large portion of Zagreb’s urbanized area has never been strategically planned. The first significant urban planning efforts date back to the early 20th century, when the city center (Donji Grad) was developed. The second major phase of planning occurred during the Yugoslav period, which saw the construction of large socialist-style neighborhoods [66,67,68]. In both cases, UGSs were included as a key component of strategic planning, which has contributed to favorable UHI characteristics today. In contrast, areas with parcel housing which were largely developed spontaneously without a specific strategic urban development plan now exhibit relatively high UHI values. After Croatia gained independence, major political and social changes led to negative urban development practices. Increased authoritarian tendencies, failed privatization efforts, and profit-driven political agendas resulted in rapid changes to urban planning policies [69]. This shift led to a decline in well-being-oriented planning and the diminished role of UGSs in urban development, giving rise to “aggressive urbanism” [70,71]. This approach has fostered urban morphologies that, rather than mitigating, exacerbate the UHI effect. In addition to the construction of new residential and commercial neighborhoods driven by private investors (Borovje, Sveta Klara, Lanište), these practices are also reshaping existing neighborhoods (Trešnjevka, Trnje) [72]. This has resulted in a noticeable increase in built-up areas, leading to higher levels of both anthropogenic and surface heat.
These trends underscore the crucial importance of strategic and sustainable city planning and highlight the necessity of incorporating UGSs into the formulation of urban planning strategies. It is noteworthy that, despite prevailing climate change patterns, newer neighborhoods and current urbanistic trends in Zagreb exhibit significantly less capacity to mitigate UHI intensity compared to older ones, particularly those built during the socialist era. This indicates that urban planning strategies in Zagreb have yet to fully embrace the trends emphasizing the importance of UGSs within urbanized areas. The evident effectiveness of green spaces in Zagreb’s urban climate regulation, as demonstrated by existing green infrastructure, underscores their potency as a tool for mitigating UHI intensity. But the lack of UGSs in numerous neighborhoods results in an unequally regulated climate within the city. Therefore, it is imperative to emulate neighborhoods and urban morphologies that exemplify successful UHI mitigation in future urban planning endeavors for the city.
It is important to underline that this research analyzes the UHI phenomenon based on land surface temperature using remote sensing technology, which introduces certain limitations in the precision of temperature values. However, the aim of this study is not to provide exact temperature readings across the city, but rather to highlight the relative changes in UHI behavior driven by the spatial characteristics of UGSs. For this purpose, remote sensing techniques were chosen over traditional meteorological data. Several studies have demonstrated a positive correlation between the surface UHI and air temperature UHI, acknowledging the strong spatial variability of the surface UHI [73,74,75]. These studies also indicate slightly higher land surface temperature values when compared to those recorded at meteorological stations. In this context, the primary contribution of this study is its detailed analysis of the spatial behavior of the UHI phenomenon, based on spatially continuous and multitemporal data. This approach allows for the identification and definition of UHI patterns in relation to urban morphology and other relevant factors, providing valuable insights for promoting strategic and greener urban planning. Moreover, this method can be easily replicated in other study areas that lack comprehensive research and face challenges similar to those of Zagreb.
Additionally, beyond climate regulation, UGSs offer a diverse array of ecosystem services that can significantly enhance human well-being and provide local populations with benefits within their own neighborhoods [51,76,77]. Several studies conducted in Zagreb have highlighted the importance of UGS in providing various ecosystem services beyond climate regulation [78,79], emphasizing the multifunctionality of green infrastructure in the city. Although this study primarily focuses on climate regulation, it is crucial to recognize the value of other ecosystem services and stress the importance of a comprehensive approach to UGS management. Therefore, evaluating the full range of ecosystem services can further highlight the importance of UGS and increase awareness among both the local population and decision-makers. Incorporating the framework of ecosystem services into urban policies is an approach that every urban area should adopt to foster a more sustainable environment [80,81]. Through this research, alongside other similar studies [82,83], we aim to emphasize the urgent need for changes in urban policies and strategies in Zagreb. Furthermore, we seek to highlight existing exemplary practices within the city that can serve as models for achieving a greener urban landscape, reducing UHI intensity, and enhancing the provision of various urban ecosystem services.

5. Conclusions

This case study analyzed the spatial-temporal characteristics of the UHI phenomenon in Zagreb, Croatia, utilizing satellite-based thermal imagery. The study employed continuous intensity maps and thermal graphs to investigate UHI patterns. Its primary objective was to evaluate the role of UGS in mitigating the UHI effect in the city and emphasize the importance of leveraging existing exemplary UGS characteristics in urban planning strategies. The findings uncovered heterogeneous features of the UHI phenomenon across the city, which are closely linked to urban morphology and the spatial attributes of UGSs. Temporal analyses of UHI trends revealed the decreasing impact of UGSs on climate regulation, highlighting the imperative to enhance and expand green infrastructure within the city. This underscores the necessity for a more robust sustainability-focused approach in urban planning efforts.

Funding

This research received no external funding.

Data Availability Statement

Data is available on request from the corresponding author.

Acknowledgments

Special thanks to Juan Ramón de la Riva Fernández for his help and indirect participation in this research.

Conflicts of Interest

The author declares no conflicts of interest.

References

  1. Wang, H.; He, Q.; Liu, X.; Zhuang, Y.; Hong, S. Global urbanization research from 1991 to 2009: A systematic research review. Landsc. Urban Plan. 2012, 104, 299–309. [Google Scholar] [CrossRef]
  2. Rizwan, A.M.; Dennis, L.Y.; Liu, C. A review on the generation, determination and mitigation of Urban Heat Island. J. Environ. Sci. 2008, 20, 120–128. [Google Scholar] [CrossRef] [PubMed]
  3. Chen, X.L.; Zhao, H.M.; Li, P.X.; Yin, Z.Y. Remote sensing image-based analysis of the relationship between urban heat island and land use/cover changes. Remote Sens. Environ. 2006, 104, 133–146. [Google Scholar] [CrossRef]
  4. Piracha, A.; Chaudhary, M.T. Urban air pollution, urban heat island and human health: A review of the literature. Sustainability 2022, 14, 9234. [Google Scholar] [CrossRef]
  5. Mirzaei, P.A. Recent challenges in modeling of urban heat island. Sustain. Cities Soc. 2015, 19, 200–206. [Google Scholar] [CrossRef]
  6. Marando, F.; Heris, M.P.; Zulian, G.; Udías, A.; Mentaschi, L.; Chrysoulakis, N.; Parastatidis, D.; Maes, J. Urban heat island mitigation by green infrastructure in European Functional Urban Areas. Sustain. Cities Soc. 2022, 77, 103564. [Google Scholar] [CrossRef]
  7. Gunawardena, K.R.; Wells, M.J.; Kershaw, T. Utilising green and bluespace to mitigate urban heat island intensity. Sci. Total Environ. 2017, 584–585, 1040–1055. [Google Scholar] [CrossRef]
  8. Balany, F.; Ng, A.W.M.; Muttil, N.; Muthukumaran, S.; Wong, M.S. Green infrastructure as an urban heat island mitigation strategy—A review. Water 2020, 12, 3577. [Google Scholar] [CrossRef]
  9. Reyes-Riveros, R.; Altamirano, A.; De La Barrera, F.; Rozas-Vásquez, D.; Vieli, L.; Meli, P. Linking public urban green spaces and human well-being: A systematic review. Urban For. Urban Green. 2021, 61, 127105. [Google Scholar] [CrossRef]
  10. Van Oijstaeijen, W.; Van Passel, S.; Cools, J. Urban green infrastructure: A review on valuation toolkits from an urban planning perspective. J. Environ. Manag. 2020, 267, 110603. [Google Scholar] [CrossRef]
  11. Xiao, X.D.; Dong, L.; Yan, H.; Yang, N.; Xiong, Y. The influence of the spatial characteristics of urban green space on the urban heat island effect in Suzhou Industrial Park. Sustain. Cities Soc. 2018, 40, 428–439. [Google Scholar] [CrossRef]
  12. Aram, F.; García, E.H.; Solgi, E.; Mansournia, S. Urban green space cooling effect in cities. Heliyon 2019, 5, e01339. [Google Scholar] [CrossRef] [PubMed]
  13. Nastran, M.; Kobal, M.; Eler, K. Urban heat islands in relation to green land use in European cities. Urban For. Urban Green. 2019, 37, 33–41. [Google Scholar] [CrossRef]
  14. Zoulia, I.; Santamouris, M.; Dimoudi, A. Monitoring the effect of urban green areas on the heat island in Athens. Environ. Monit. Assess. 2009, 156, 275–292. [Google Scholar] [CrossRef] [PubMed]
  15. Xu, C.; Chen, G.; Huang, Q.; Su, M.; Rong, Q.; Yue, W.; Haase, D. Can improving the spatial equity of urban green space mitigate the effect of urban heat islands? An empirical study. Sci. Total Environ. 2022, 841, 156687. [Google Scholar] [CrossRef]
  16. Klemm, W.; Heusinkveld, B.G.; Lenzholzer, S.; van Hove, B. Street greenery and its physical and psychological impact on thermal comfort. Landsc. Urban Plan. 2015, 138, 87–98. [Google Scholar] [CrossRef]
  17. Lobaccaro, G.; Acero, J.A. Comparative analysis of green actions to improve outdoor thermal comfort inside typical urban street canyons. Urban Clim. 2015, 14, 251–267. [Google Scholar] [CrossRef]
  18. Weng, Q.; Lu, D.; Schubring, J. Estimation of land surface temperature-vegetation abundance relationship for urban heat island studies. Remote Sens. Environ. 2004, 89, 467–483. [Google Scholar] [CrossRef]
  19. Ward, K.; Lauf, S.; Kleinschmit, B.; Endlicher, W. Heat waves and urban heat islands in Europe: A review of relevant drivers. Sci. Total Environ. 2016, 569–570, 527–539. [Google Scholar] [CrossRef]
  20. Bao, T.; Li, X.; Zhang, J.; Zhang, Y.; Tian, S. Assessing the Distribution of Urban Green Spaces and its Anisotropic Cooling Distance on Urban Heat Island Pattern in Baotou, China. ISPRS Int. J. Geoinf. 2016, 5, 12. [Google Scholar] [CrossRef]
  21. Abebe, M.T.; Megento, T.L. The city of addis ababa from ‘forest city’ to ‘urban heat island’: Assessment of urban green space dynamics. J. Urban Environ. Eng. 2016, 10, 254–262. [Google Scholar] [CrossRef]
  22. Maheng, D.; Ducton, I.; Lauwaet, D.; Zevenbergen, C.; Pathirana, A. The sensitivity of urban heat island to urban green space-A model-based study of City of Colombo, Sri Lanka. Atmosphere 2019, 10, 151. [Google Scholar] [CrossRef]
  23. Doick, K.J.; Peace, A.; Hutchings, T.R. The role of one large greenspace in mitigating London’s nocturnal urban heat island. Sci. Total Environ. 2014, 493, 662–671. [Google Scholar] [CrossRef] [PubMed]
  24. Park, J.; Kim, J.H.; Lee, D.K.; Park, C.Y.; Jeong, S.G. The influence of small green space type and structure at the street level on urban heat island mitigation. Urban For. Urban Green. 2017, 21, 203–212. [Google Scholar] [CrossRef]
  25. Shastri, H.; Ghosh, S. Urbanisation and Surface Urban Heat Island Intensity (SUHII). In Climate Change Signals and Response: A Strategic Knowledge Compendium for India; Springer: Berlin/Heidelberg, Germany, 2019; pp. 73–90. [Google Scholar] [CrossRef]
  26. Krtalić, A.; Kuveždi, A.; Mrlec, K. Satellite-driven assessment of surface urban heat islands in the city of zagreb, croatia. ISPRS Ann. Photogramm. Remote Sens. Spat. Inf. Sci. 2020, 5, 757–764. [Google Scholar] [CrossRef]
  27. Zhou, D.; Xiao, J.; Bonafoni, S.; Berger, C.; Deilami, K.; Zhou, Y.; Frolking, S.; Yao, R.; Qiao, Z.; Sobrino, J.A. Satellite remote sensing of surface urban heat islands: Progress, challenges, and perspectives. Remote Sens. 2019, 11, 48. [Google Scholar] [CrossRef]
  28. de Almeida, C.R.; Teodoro, A.C.; Gonçalves, A. Study of the urban heat island (Uhi) using remote sensing data/techniques: A systematic review. Environments 2021, 8, 105. [Google Scholar] [CrossRef]
  29. Sobrino, J.A.; Oltra-Carrió, R.; Sòria, G.; Jiménez-Muñoz, J.C.; Franch, B.; Hidalgo, V.; Mattar, C.; Julien, Y.; Cuenca, J.; Romaguera, M.; et al. Evaluation of the surface urban heat island effect in the city of Madrid by thermal remote sensing. Int. J. Remote Sens. 2013, 34, 3177–3192. [Google Scholar] [CrossRef]
  30. Martin, P.; Baudouin, Y.; Gachon, P. An alternative method to characterize the surface urban heat island. Int. J. Biometeorol. 2015, 59, 849–861. [Google Scholar] [CrossRef]
  31. Bonacci, O.; Roje-Bonacci, T.; Vrsalović, A. The day-to-day temperature variability method as a tool for urban heat island analysis: A case of Zagreb-Grič Observatory (1887–2018). Urban Clim. 2022, 45, 101281. [Google Scholar] [CrossRef]
  32. Nitis, T.; Klaic, Z.B.; Moussiopoulos, N. Effects of topography on urban heat island. In Proceedings of the 10th International Conference on Harmonisation within Atmospheric Dispersion Modelling for Regulatory Purposes, Garmisch-Partenkirchen, Germany, 1–4 June 2005; Volume 1, p. 5. [Google Scholar]
  33. Nimac, I.; Herceg-Bulić, I.; Žuvela-Aloise, M.; Žgela, M. Impact of North Atlantic Oscillation and drought conditions on summer urban heat load—A case study for Zagreb. Int. J. Climatol. 2022, 42, 4850–4867. [Google Scholar] [CrossRef]
  34. Milić, B. Urbani razvoj gradova na tlu Hrvatske—19. stoljeće, Urban Development of Croatian towns in 19th Century. Prost. Znan. Časopis Za Arhit. I Urban. 2006, 14, 197–217. [Google Scholar]
  35. Franković, E. Urbanističko planiranje Zagreba od 1945. do 1985. Radovi Instituta za Povijest Umjetnosti, 1985, pp. 85–87. Available online: https://hrcak.srce.hr/file/327987 (accessed on 5 February 2024).
  36. Lohmann, U.; Sausen, R.; Bengtsson, L.; Cubasch, U.; Pelwitz, J.; Roeckner, E. The Köppen climate classification as a diagnostic tool for general circulation models. Clim. Res. 1993, 3, 177–193. [Google Scholar] [CrossRef]
  37. Greenacre, M.; Groenen, P.J.F.; Hastie, T.; D’Enza, A.I.; Markos, A.; Tuzhilina, E. Principal component analysis. Nat. Rev. Methods Primers 2022, 2, 433–459. [Google Scholar] [CrossRef]
  38. Pettorelli, N.; Vik, J.O.; Mysterud, A.; Gaillard, J.M.; Tucker, C.J.; Stenseth, N.C. Using the satellite-derived NDVI to assess ecological responses to environmental change. Trends Ecol. Evol. 2005, 20, 503–510. [Google Scholar] [CrossRef]
  39. Barsi, J.A.; Schott, J.R.; Hook, S.J.; Raqueno, N.G.; Markham, B.L.; Radocinski, R.G. Landsat-8 thermal infrared sensor (TIRS) vicarious radiometric calibration. Remote Sens. 2014, 6, 11607–11626. [Google Scholar] [CrossRef]
  40. Chuvieco, E. Teledetección Medioambiental; Ariel: Barcelona, Spain, 2010. [Google Scholar]
  41. Jiménez-Munoz, J.C.; Sobrino, J.A. A generalized single-channel method for retrieving land surface temperature from remote sensing data. J. Geophys. Res. Atmos. 2003, 108, 22. [Google Scholar] [CrossRef]
  42. Stathopoulou, M.; Cartalis, C.; Petrakis, M. Integrating Corine Land Cover data and Landsat TM for surface emissivity definition: Application to the urban area of Athens, Greece. Int. J. Remote Sens. 2007, 28, 3291–3304. [Google Scholar] [CrossRef]
  43. Sobrino, J.A.; Raissouni, N.; Li, Z.L. A comparative study of land surface emissivity retrieval from NOAA data. Remote Sens. Environ. 2001, 75, 256–266. [Google Scholar] [CrossRef]
  44. Valor, E.; Caselles, V. Mapping land surface emissivity from NDVI: Application to European, African, and South American areas. Remote Sens. Environ. 1996, 57, 167–184. [Google Scholar] [CrossRef]
  45. Saaroni, H.; Amorim, J.H.; Hiemstra, J.A.; Pearlmutter, D. Urban Green Infrastructure as a tool for urban heat mitigation: Survey of research methodologies and findings across different climatic regions. Urban Clim. 2018, 24, 94–110. [Google Scholar] [CrossRef]
  46. Semenzato, P.; Bortolini, L. Urban Heat Island Mitigation and Urban Green Spaces: Testing a Model in the City of Padova (Italy). Land 2023, 12, 476. [Google Scholar] [CrossRef]
  47. Zhou, W.; Yu, W.; Zhang, Z.; Cao, W.; Wu, T. How can urban green spaces be planned to mitigate urban heat island effect under different climatic backgrounds? A threshold-based perspective. Sci. Total Environ. 2023, 890, 164422. [Google Scholar] [CrossRef] [PubMed]
  48. Millennium Ecosystem Assessment. Ecosystems and Human Well-Being; World Resources Institute: Washington, DC, USA, 2005; Available online: http://pdf.wri.org/ecosystems_human_wellbeing.pdf (accessed on 3 October 2024).
  49. Woodruff, S.C.; BenDor, T.K. Ecosystem services in urban planning: Comparative paradigms and guidelines for high quality plans. Landsc. Urban Plan. 2016, 152, 90–100. [Google Scholar] [CrossRef]
  50. Krishnan, S. Planning for Ecosystem Services in Cities; Springer Nature: London, UK, 2021; Volume 14. [Google Scholar] [CrossRef]
  51. Ahern, J.; Cilliers, S.; Niemelä, J. The concept of ecosystem services in adaptive urban planning and design: A framework for supporting innovation. Landsc. Urban Plan. 2014, 125, 254–259. [Google Scholar] [CrossRef]
  52. Vieira, J.; Matos, P.; Mexia, T.; Silva, P.; Lopes, N.; Freitas, C.; Correia, O.; Santos-Reis, M.; Branquinho, C.; Pinho, P. Green spaces are not all the same for the provision of air purification and climate regulation services: The case of urban parks. Environ. Res. 2018, 160, 306–313. [Google Scholar] [CrossRef]
  53. Lin, B.B.; Meyers, J.; Beaty, R.M.; Barnett, G.B. Urban green infrastructure impacts on climate regulation services in Sydney, Australia. Sustainability 2016, 8, 788. [Google Scholar] [CrossRef]
  54. Goldenberg, R.; Kalantari, Z.; Destouni, G. Comparative quantification of local climate regulation by green and blue urban areas in cities across Europe. Sci. Rep. 2021, 11, 23872. [Google Scholar] [CrossRef]
  55. Esfehankalateh, A.T.; Ngarambe, J.; Yun, G.Y. Influence of tree canopy coverage and leaf area density on urban heat island mitigation. Sustainability 2021, 13, 7496. [Google Scholar] [CrossRef]
  56. Morabito, M.; Crisci, A.; Guerri, G.; Messeri, A.; Congedo, L.; Munafò, M. Surface urban heat islands in Italian metropolitan cities: Tree cover and impervious surface influences. Sci. Total Environ. 2021, 751, 142334. [Google Scholar] [CrossRef]
  57. Greene, C.S.; Kedron, P.J. Beyond fractional coverage: A multilevel approach to analyzing the impact of urban tree canopy structure on surface urban heat islands. Appl. Geogr. 2018, 95, 45–53. [Google Scholar] [CrossRef]
  58. Eyster, H.N.; Beckage, B. Arboreal Urban Cooling Is Driven by Leaf Area Index, Leaf Boundary Layer Resistance, and Dry Leaf Mass per Leaf Area: Evidence from a System Dynamics Model. Atmosphere 2023, 14, 552. [Google Scholar] [CrossRef]
  59. Liu, B.; Guo, X.; Jiang, J. How Urban Morphology Relates to the Urban Heat Island Effect: A Multi-Indicator Study. Sustainability 2023, 15, 787. [Google Scholar] [CrossRef]
  60. Peng, W.; Wang, R.; Duan, J.; Gao, W.; Fan, Z. Surface and canopy urban heat islands: Does urban morphology result in the spatiotemporal differences? Urban Clim. 2022, 42, 101136. [Google Scholar] [CrossRef]
  61. Kolokotsa, D.; Lilli, K.; Gobakis, K.; Mavrigiannaki, A.; Haddad, S.; Garshasbi, S.; Mohajer, H.R.H.; Paolini, R.; Vasilakopoulou, K.; Bartesaghi, C.; et al. Analyzing the Impact of Urban Planning and Building Typologies in Urban Heat Island Mitigation. Buildings 2022, 12, 537. [Google Scholar] [CrossRef]
  62. Loughner, C.P.; Allen, D.J.; Zhang, D.L.; Pickering, K.E.; Dickerson, R.R.; Landry, L. Roles of urban tree canopy and buildings in urban heat island effects: Parameterization and preliminary results. J. Appl. Meteorol. Clim. 2012, 51, 1775–1793. [Google Scholar] [CrossRef]
  63. Yuan, C.; Adelia, A.S.; Mei, S.; He, W.; Li, X.X.; Norford, L. Mitigating intensity of urban heat island by better understanding on urban morphology and anthropogenic heat dispersion. Build. Environ. 2020, 176, 106876. [Google Scholar] [CrossRef]
  64. Santos, L.G.R.; Nevat, I.; Pignatta, G.; Norford, L.K. Climate-informed decision-making for urban design: Assessing the impact of urban morphology on urban heat island. Urban Clim. 2021, 36, 100776. [Google Scholar] [CrossRef]
  65. Liao, W.; Hong, T.; Heo, Y. The effect of spatial heterogeneity in urban morphology on surface urban heat islands. Energy Build. 2021, 244, 111027. [Google Scholar] [CrossRef]
  66. Ivanković, V. Western Part of Zagreb in Regulatory Plans form 1865, 1887 and 1907. E-Zb. Elektron. Zb. Rad. Građevinskog Fak. 2024, 14, 26–35. [Google Scholar] [CrossRef]
  67. Čavlović, M.; Lovrenčić, L.; Sevšek, A.; Lovrenčić, L.; Sevšek, A. The two ‘halves’ of New Zagreb. In Mapping Urban Changes; Škarić, A.P., Ed.; Institut za povijest umjetnosti: Zagreb, Croatia, 2017; pp. 1–24. [Google Scholar]
  68. Zoranić, A. Residential architecture of Novi Zagreb on the example of Siget settlement. Period. Eng. Nat. Sci. USA 2022, 10, 56–64. [Google Scholar] [CrossRef]
  69. Milan, C. From the streets to the town halls: Municipalist platforms in the post-Yugoslav space. Urban Stud. 2023, 60, 2158–2175. [Google Scholar] [CrossRef]
  70. Gašparović, S.; Sopina, A. Uloga pejsaža u planiranju grada Zagreba od početka 20. do početka 21. stoljeća. Prostor 2018, 26, 132–145. [Google Scholar] [CrossRef]
  71. Bešević, M.; Miličić, I.M.; Gabric, O.; Gabric, O. 4th International Conference Contemporary Achievements in Civil Engineering 2016 Faculty of Civil Engineering; University of Novi Sad, Faculty of Civil Engineering Subotica: Subotica, Serbia, 2016. [Google Scholar]
  72. Gotovac, A.S.; Podgorelec, S.; Villa, Z.K.-D. the Quality of Life in Housing Estates in the Context of West-European and Post-Socialist Countries1. Geoadria 2021, 26, 143–166. [Google Scholar] [CrossRef]
  73. Schwarz, N.; Schlink, U.; Franck, U.; Großmann, K. Relationship of land surface and air temperatures and its implications for quantifying urban heat island indicators—An application for the city of Leipzig (Germany). Ecol. Indic. 2012, 18, 693–704. [Google Scholar] [CrossRef]
  74. Li, L.; Zha, Y.; Wang, R. Relationship of surface urban heat island with air temperature and precipitation in global large cities. Ecol. Indic. 2020, 117, 106683. [Google Scholar] [CrossRef]
  75. Sheng, L.; Tang, X.; You, H.; Gu, Q.; Hu, H. Comparison of the urban heat island intensity quantified by using air temperature and Landsat land surface temperature in Hangzhou, China. Ecol. Indic. 2017, 72, 738–746. [Google Scholar] [CrossRef]
  76. Bolund, P.; Hunhammar, S. Ecosystem services in urban areas. Ecol. Econ. 1999, 29, 293–301. [Google Scholar] [CrossRef]
  77. Gómez-Baggethun, E.; Barton, D.N. Classifying and valuing ecosystem services for urban planning. Ecol. Econ. 2013, 86, 235–245. [Google Scholar] [CrossRef]
  78. Kičić, M.; Haase, D.; Marin, A.M.; Vuletić, D.; Ostoić, S.K. Perceptions of cultural ecosystem services of tree-based green infrastructure: A focus group participatory mapping in Zagreb, Croatia. Urban For. Urban Green. 2022, 78, 127767. [Google Scholar] [CrossRef]
  79. Ostoić, S.K.; Marin, A.M.; Kičić, M.; Vuletić, D. Qualitative exploration of perception and use of cultural ecosystem services from tree-based urban green space in the city of zagreb (Croatia). Forests 2020, 11, 876. [Google Scholar] [CrossRef]
  80. Sylla, M.; Hagemann, N.; Szewrański, S. Mapping trade-offs and synergies among peri-urban ecosystem services to address spatial policy. Environ. Sci. Policy 2020, 112, 79–90. [Google Scholar] [CrossRef]
  81. Spyra, M.; La Rosa, D.; Zasada, I.; Sylla, M.; Shkaruba, A. Governance of ecosystem services trade-offs in peri-urban landscapes. Land Use Policy 2020, 95, 104617. [Google Scholar] [CrossRef]
  82. Tandarić, N.; Ives, C.D.; Watkins, C. From city in the park to ‘greenery in plant pots’: The influence of socialist and post-socialist planning on opportunities for cultural ecosystem services. Land Use Policy 2022, 120, 106309. [Google Scholar] [CrossRef]
  83. Seletković, A.; Kičić, M.; Ančić, M.; Kolić, J.; Pernar, R. The Urban Heat Island Analysis for the City of Zagreb in the Period 2013–2022 Utilizing Landsat 8 Satellite Imagery. Sustainability 2023, 15, 3963. [Google Scholar] [CrossRef]
Figure 1. Land use and distribution of green surfaces within the study area.
Earth 05 00031 g001
Figure 2. Conceptual framework and workflow of the study.
Earth 05 00031 g002
Figure 3. Location of axes used in thermal profile analysis.
Earth 05 00031 g003
Figure 4. Map of UHI intensity in Zagreb (multitemporal analysis 1984–2015).
Earth 05 00031 g004
Figure 5. UHI intensity in the city center (area zoomed in from Figure 3); multitemporal analysis 1984–2015.
Earth 05 00031 g005
Figure 6. UHI intensity of selected city areas (area zoomed in from Figure 3): (a) Radnička street business area (Plinarsko naselje—Sigečica—Ferenščica), (b) Rudeš—Voltino—Ljubljanica, (c) Pantovčak—Ksaver—Mirogoj, (d) Trnovčica; multitemporal analysis 1984–2015.
Earth 05 00031 g006
Figure 7. Thermal profile corresponding to axis 1 (Figure 3).
Earth 05 00031 g007
Figure 8. Thermal profile corresponding to axis 2 (Figure 3).
Earth 05 00031 g008
Figure 9. Thermal profile corresponding to axis 3 (Figure 3).
Earth 05 00031 g009
Figure 10. Thermal profile corresponding to axis 4 (Figure 3).
Earth 05 00031 g010
Figure 11. Thermal profile corresponding to axis 5 (Figure 3).
Earth 05 00031 g011
Table 1. Images used in the study.
Image DateSatellite/SensorThermal Profile AnalysisUHI Intensity Map Analysis
21 August 1984Landsat 5/TMXX
2 April 1985Landsat 5/TMXX
7 August 1999Landsat 7/ETM+XX
19 April 2000Landsat 7/ETM+XX
12 August 2001Landsat 7/ETM+ X
11 May 2002Landsat 7/ETM+ X
14 July 2005Landsat 5/TMX
1 May 2007Landsat 7/ETM+XX
7 July 2014Landsat 8/OLI, TIRSXX
7 May 2015Landsat 8/OLI, TIRSX
Table 2. NDVI thresholds and corresponding emissivity values applied in the study.
Land CoverNDVI ThresholdsEmissivity
Vegetation>0.50.99
Water<−0.50.98
Built-up areas−0.5 <= NDVI <= 0.10.95
Bare soil0.1 <= NDVI <= 0.20.94
Mixed pixels0.2 <= NDVI <= 0.5Valor and Caselles [44]
Disclaimer/Publisher’s Note: The statements, opinions and data contained in all publications are solely those of the individual author(s) and contributor(s) and not of MDPI and/or the editor(s). MDPI and/or the editor(s) disclaim responsibility for any injury to people or property resulting from any ideas, methods, instructions or products referred to in the content.

