Next Article in Journal
Advancing Community Resilience through Community Radio: The Case of EK-FM in Western Kenya
Previous Article in Journal
The Impacts of the Pandemic on Sustainable Production and Consumption: Toward a System Dynamics Approach
 
 
Please note that, as of 4 December 2024, Environmental Sciences Proceedings has been renamed to Environmental and Earth Sciences Proceedings and is now published here.
Proceeding Paper

Tree Size Structure of Tectona grandis (Linn f.) Stand in Hilltop and Valley-Bottom of Omo Forest Reserve †

by
Oladele Fisayo Falade
* and
Stephen Busola Oguntona
Department of Forest Production and Products, University of Ibadan, Ibadan 200284, Nigeria
*
Author to whom correspondence should be addressed.
Presented at the 2nd International Electronic Conference on Forests—Sustainable Forests: Ecology, Management, Products and Trade, 1–15 September 2021, Available Online: https://iecf2021.sciforum.net/.
Environ. Sci. Proc. 2022, 13(1), 21; https://doi.org/10.3390/IECF2021-10823
Published: 31 August 2021

Abstract

:
Variability of a microsite contributes to the size hierarchy in tree populations. Tree size symmetry varies with the available growth resources. However, competition hierarchy may not cause size symmetry in tree populations. The identification of mechanisms that determine size hierarchy has ecological significance in the management of a forest stand. Therefore, this study investigated the tree size structure of the Teak stand in the Hilltop and Valley-Bottom stands of the Omo Forest Reserve. A ten-year-old Teak plantation was delineated into Hilltop and Valley-Bottom stands based on topography. Five (30 m × 30 m) sample plots were systematically demarcated on 1 km transects in each stand. Tree stems with diameter at breast height (dbh) ≥ 10 cm were enumerated. Diameter at breast height and total height were measured using Girth tape and Spiegel Relaskop. Stem size inequality, diversity and stand attributes of both stands were evaluated for diameter and height. Data collected were analyzed using descriptive, correlation, regression analysis and t-test at α0.05. Mean dbh and height in the Valley-Bottom stand (11.30 ± 4.82 cm dbh and 7.26 ± 3.21 m) were not significantly different from the Hilltop stand (10.19 ± 4.62 cm dbh and 7.12 ± 3.88 m). Stem density in the Hilltop stand (1431.0 stems/ha) was higher than in Valley-Bottom stand (1248.0 stems/ha). All distributions expressed unimodality, except the diameter distribution of the Valley-Bottom stand, which expressed bimodality. The inequality was strongly correlated with the diversity indices in dbh and height distributions in the Hilltop and Valley-Bottom stands, respectively. The same mechanism was responsible for the dbh and height structures of the Hilltop and Valley-Bottom stands, respectively. However, different mechanisms were responsible for the dbh and height structures of the Valley-Bottom and Hilltop stands, respectively.

1. Introduction

Trees of monoculture stand compete for growth resources through inter-tree competition. Asymmetric and symmetric models are recognized as two extreme expressions of competition symmetry [1]. There is intrinsic difference between competition symmetry for above-ground and below-ground tree growth resources. Asymmetric and symmetric models are considered for light and soil nutrient, respectively. Therefore, tree size symmetry varies with variation in available plant-growth resources [2]. Identification of mechanisms that are causing size hierarchy in tree populations is critical because of their ecological and management significance [3]. However, understanding the effect of topographic elevation on size symmetry is limited [4]. The estimate of size structure of even-aged Tectona grandis plantation in different elevations is required so as to identify competition mechanisms for tree growth resources at different elevation belts. Tree height and diameter are components of tree size. The tree height determines light capturing capacity, while stem diameter determines mechanical support and water transport efficiency [5]. Allometry and architecture of a tree are regulated by abiotic and biotic factors [5]. Therefore, tree height-diameter relationship reflects the available environmental resources, and therefore, can be used to support decision making on silvicultural treatments. However, the effect of elevation on tree height-diameter allometry is yet to be clarified. The hypothesis was to assess the effect of topographic elevation on size symmetry within the teak plantation. The aim of the study was to analyze the spatial difference of the stem form of 10-year-old Tectona grandis plantation in Omo Forest Reserve. Therefore, this study investigated tree size structure of the Teak stands in the Hilltop and Valley-Bottom stands of the Omo Forest Reserve.

2. Materials and Methods

2.1. The Study Area

This study was conducted in 10-year-old Tectona grandis plantation in Area J4 of the Omo Forest Reserve. The Omo Forest Reserve is located between Latitude 6°35′ to 7°05′ N and Longitude 4°19’ to 4°40’ E at an altitude of 150 m above sea level (asl) in the Ijebu area of Ogun State in Southwestern Nigeria [6]. The Omo Forest Reserve covers 130,500 hectares of land area. It is the largest industrial plantation forest area in Nigeria. The Tectona grandis plantation used for this study was planted in the year 2010 using a spacing of 2.0 m × 3.0 m among tree stems and covers 22 hectares of land area. The plantation is located in the Fire Blast area of Area J4 in the Omo Forest Reserve.

2.2. Demarcation of Sample Plots and Method of Data Collection

A reconnaissance survey was conducted to assess the landscape and stand physiognomy so as to determine the sampling technique to be adopted. It was observed that the Teak plantation was a steep landscape. Therefore, the Teak plantation was delineated into two stands base on natural demarcation of its topographic elevation so as to achieve the objective and reduce variation. Therefore, the plantation was divided into two elevation belts; the Hilltop stand is located between 105 and 112 m asl and the Valley-Bottom stand is located between 85 and 104 m asl. The sampling method for plot selection was stratified systematic sampling technique. Five sample (30 m × 30 m) plots were systematically demarcated on 1 km transects parallel to each other in the Hilltop and Valley-Bottom stands. The height and diameter at base, breast-height, middle and top of Teak stems were measured in each plot using Spiegel relaskop and Girth tape and stem density was estimated.

2.3. Data Analysis

Stem density was computed for the Hilltop and Valley-Bottom stands and converted to hectare. The regression analysis of stem H-D allometry of the Hilltop and Valley-Bottom stands were evaluated. Additionally, diameter at breast height (dbh) and height measurements of tree stems were divided into 17 and 10 equal interval size classes, respectively, starting from the smallest to the largest. Dbh and height-density distributions were represented with histograms. Therefore, diameter-density and height-density distribution of Hilltop and Valley-Bottom stands were characterized by their mean, standard deviation and Coefficient of Variation. Additionally, inequality measures (Gini-coefficient, Coefficient of Variation and Skewness coefficient) and diversity indices (Shannon, Simpson, Margalef and Evenness) were calculated singly for the diameter and height distributions of the Hilltop and Valley-Bottom stands. Further analyses were carried out: (i) significant differences between means were tested using t-test at 0.05 level and (ii) size inequality statistics (Gini-Coefficient, Coefficient of Variation and Skewnes-Coefficient) were correlated with diversity indices and stand attributes (mean dbh, mean height and stand density) at 0.05 level singly for diameter and height distributions. The highly significant correlation values at 0.05 level were extracted from matrices.

3. Results

3.1. The H-D Allometry

The H-D allometry for Hilltop stand was derived from 644 sample tree stems and best described by the equation (Height = 5.73*ln(Dbh) − 5.61), which explained 45.5% of variation in tree height, while the Valley-Bottom stand was derived from 562 sample tree stems and best described by the equation (Height = 5.34*ln(Dbh) − 5.16), which explained 59.1% of variation in tree height. There was a significant difference between the tree height for a given diameter of stems in the Hilltop and Valley-Bottom stands. The diameter at breast height increased with an exponential increase in height in the Hilltop and Valley-Bottom stands of Tectona grandis. Figure 1a,b shows that H-D allometries of the Hilltop and Valley-Bottom stands were not the same, and thus, they may be site specific. Therefore, a single equation cannot be used for the prediction of the H-D relationship of Tectona grandis in the Omo Forest Reserve.

3.2. Diameter-Density and Height-Density Distributions of the Hilltop and Valley-Bottom Stands

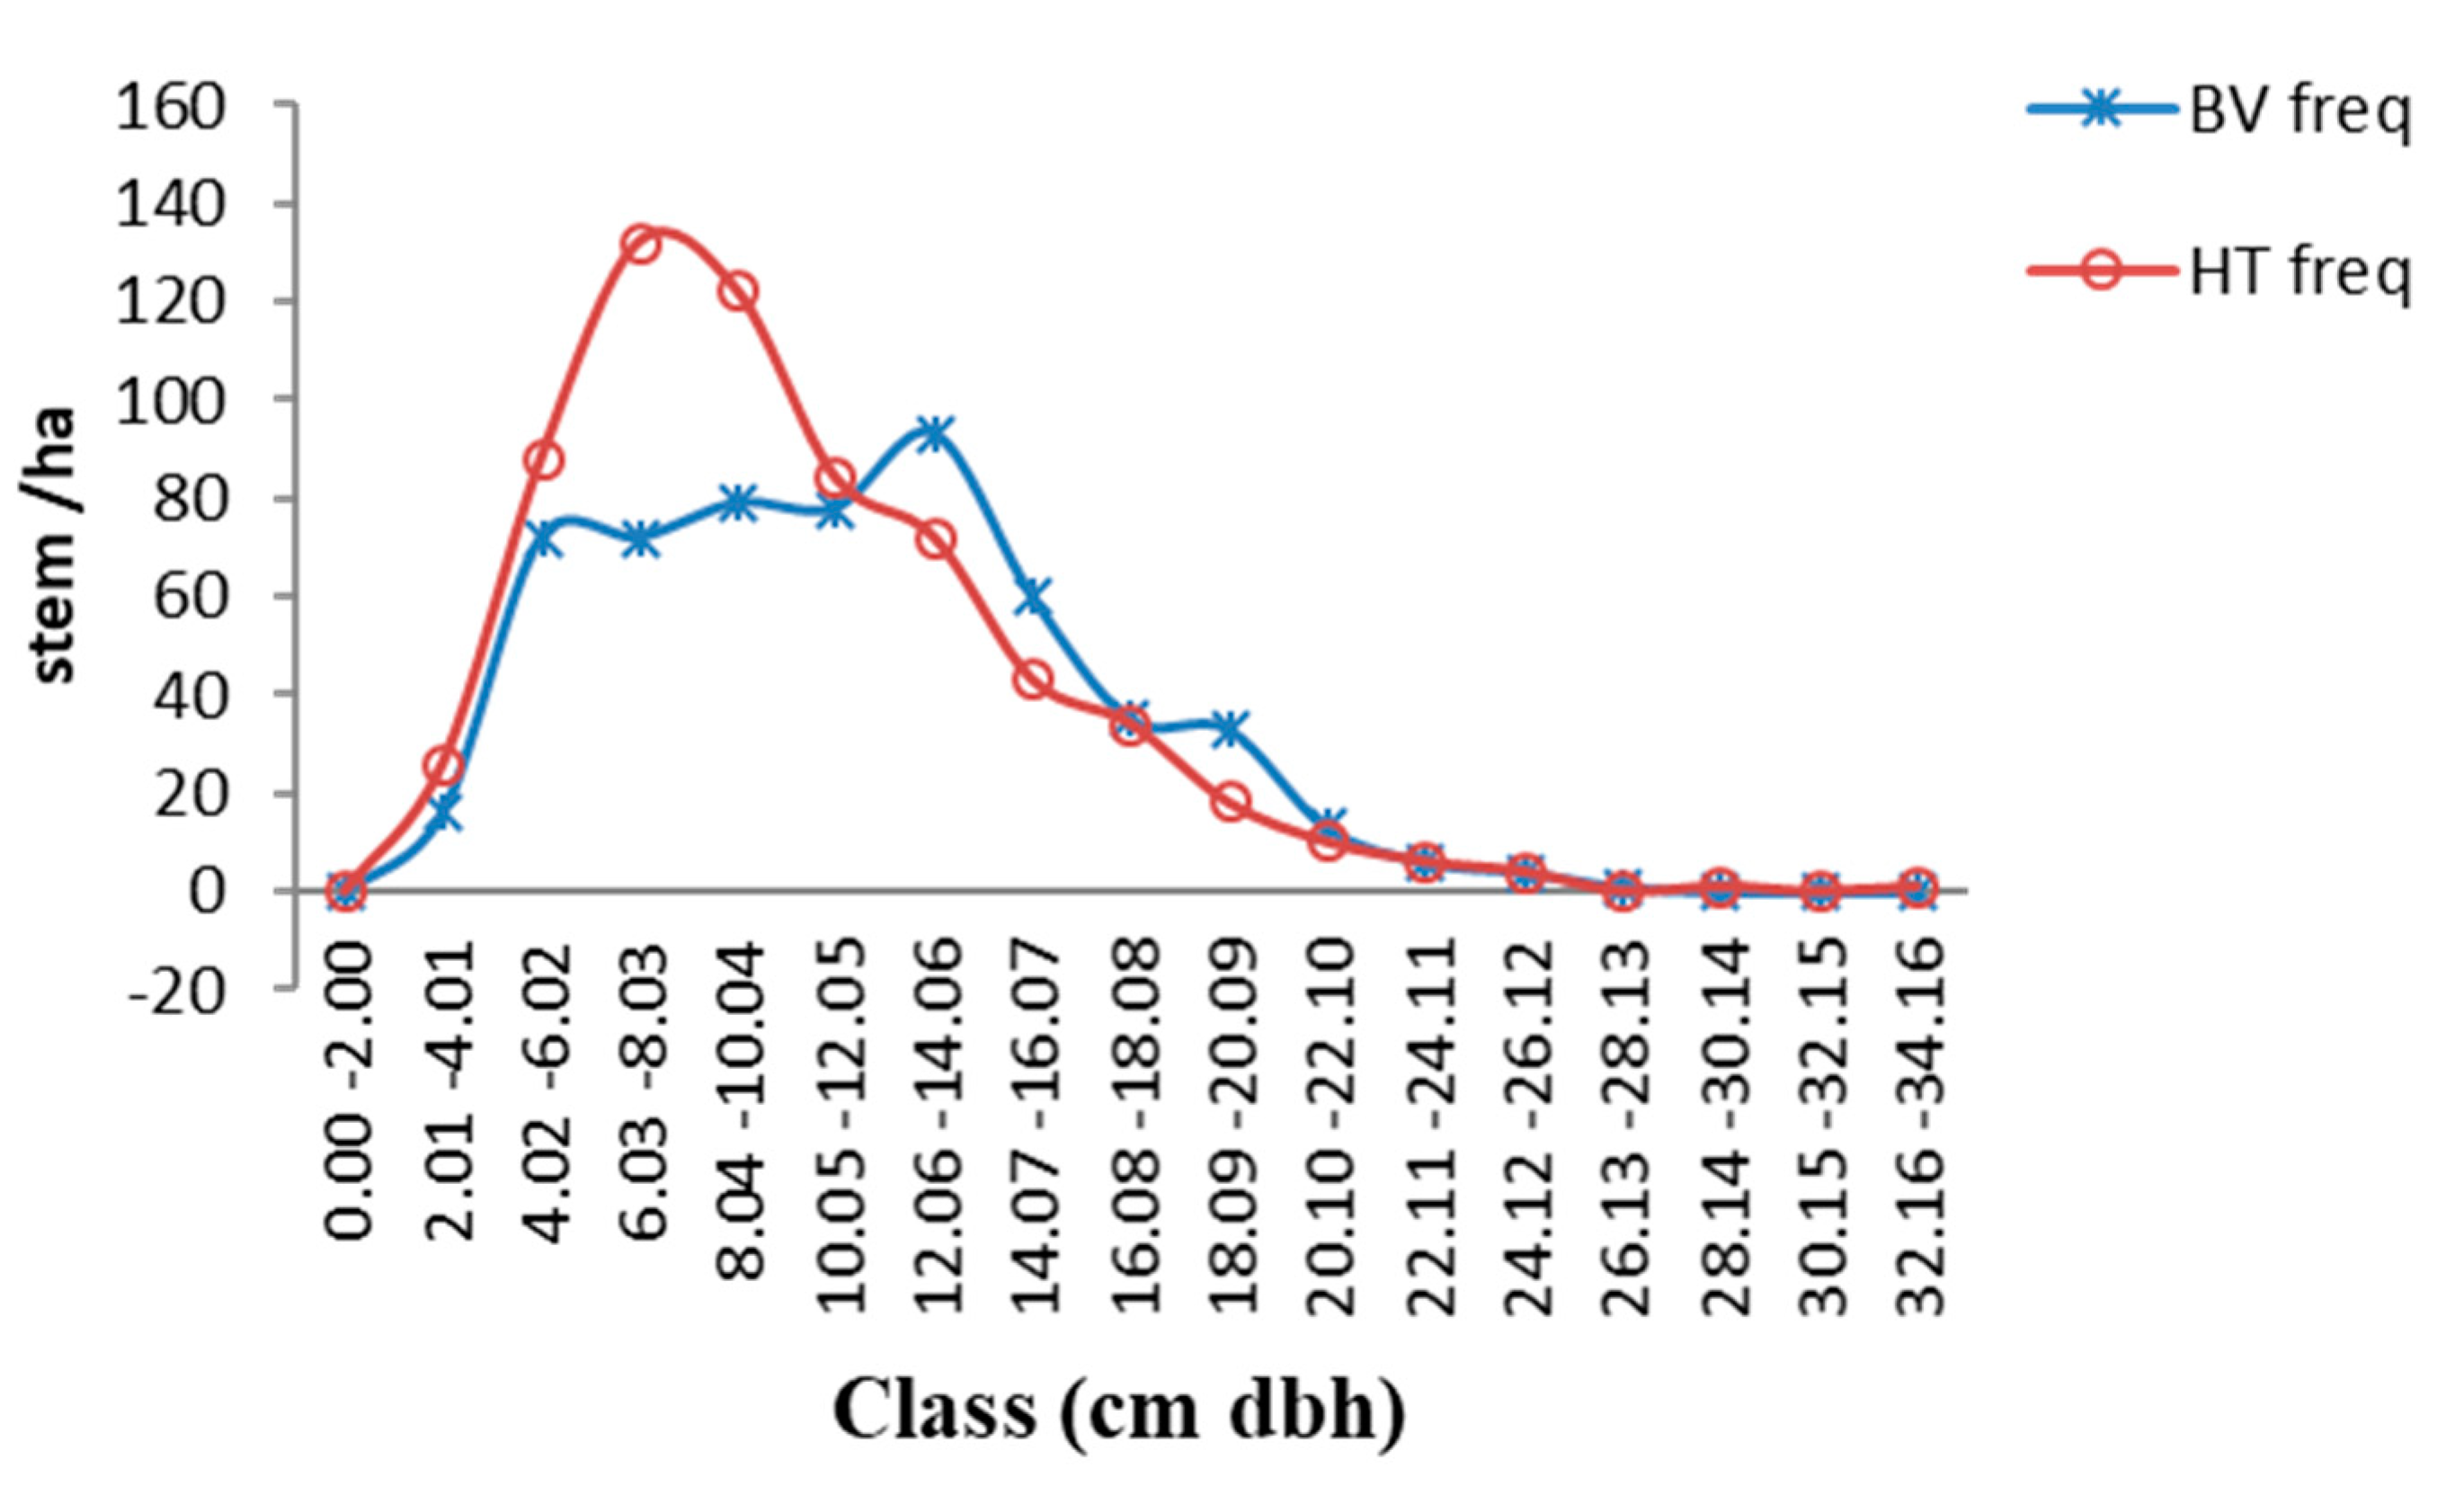
The diameter-density distribution of the Valley-Bottom stand expressed positively skewed bimodal distribution, while the diameter-density distribution of the Hilltop stand expressed positively skewed unimodal distribution (Figure 2). The diameter-density distribution of the Hilltop stand ranged from 0.00 to 34.16 cm dbh. It contained the highest stem density in the intermediate tree stem (6.03–8.03 cm dbh classes) (Figure 2 and Table 1). Conversely, the diameter-density distribution of the Valley-Bottom stand had two peaks at 8.04–10.04 and 12.06–14.06 cm dbh classes (Figure 2). The diameter-density distribution of the Valley-Bottom stand ranged from 0.00 to 26.12 cm dbh (Table 1). The mean of the stem diameter in the Hilltop stand was significantly different from the mean of the stem diameter in the Valley-Bottom stand (10.19 ± 4.62 vs. 11.30 ± 4.82 cm dbh; t-test = 4.06, p = 0.000).
The inequality of stem height and diameter was evaluated by the Gini-Coefficient (GC), Coefficient of Variation (CV) and Skewness Coefficient (SC). Therefore, the inequality of the stem diameter and height distribution of the Hilltop stand was higher than the inequality of the Valley-Bottom stand (Table 1 and Table 2). Additionally, the stand density of the Hilltop stand (1431.00 stems/ha) was higher than the Valley-Bottom stand (1251.00 stems/ha) (Table 1 and Table 2).
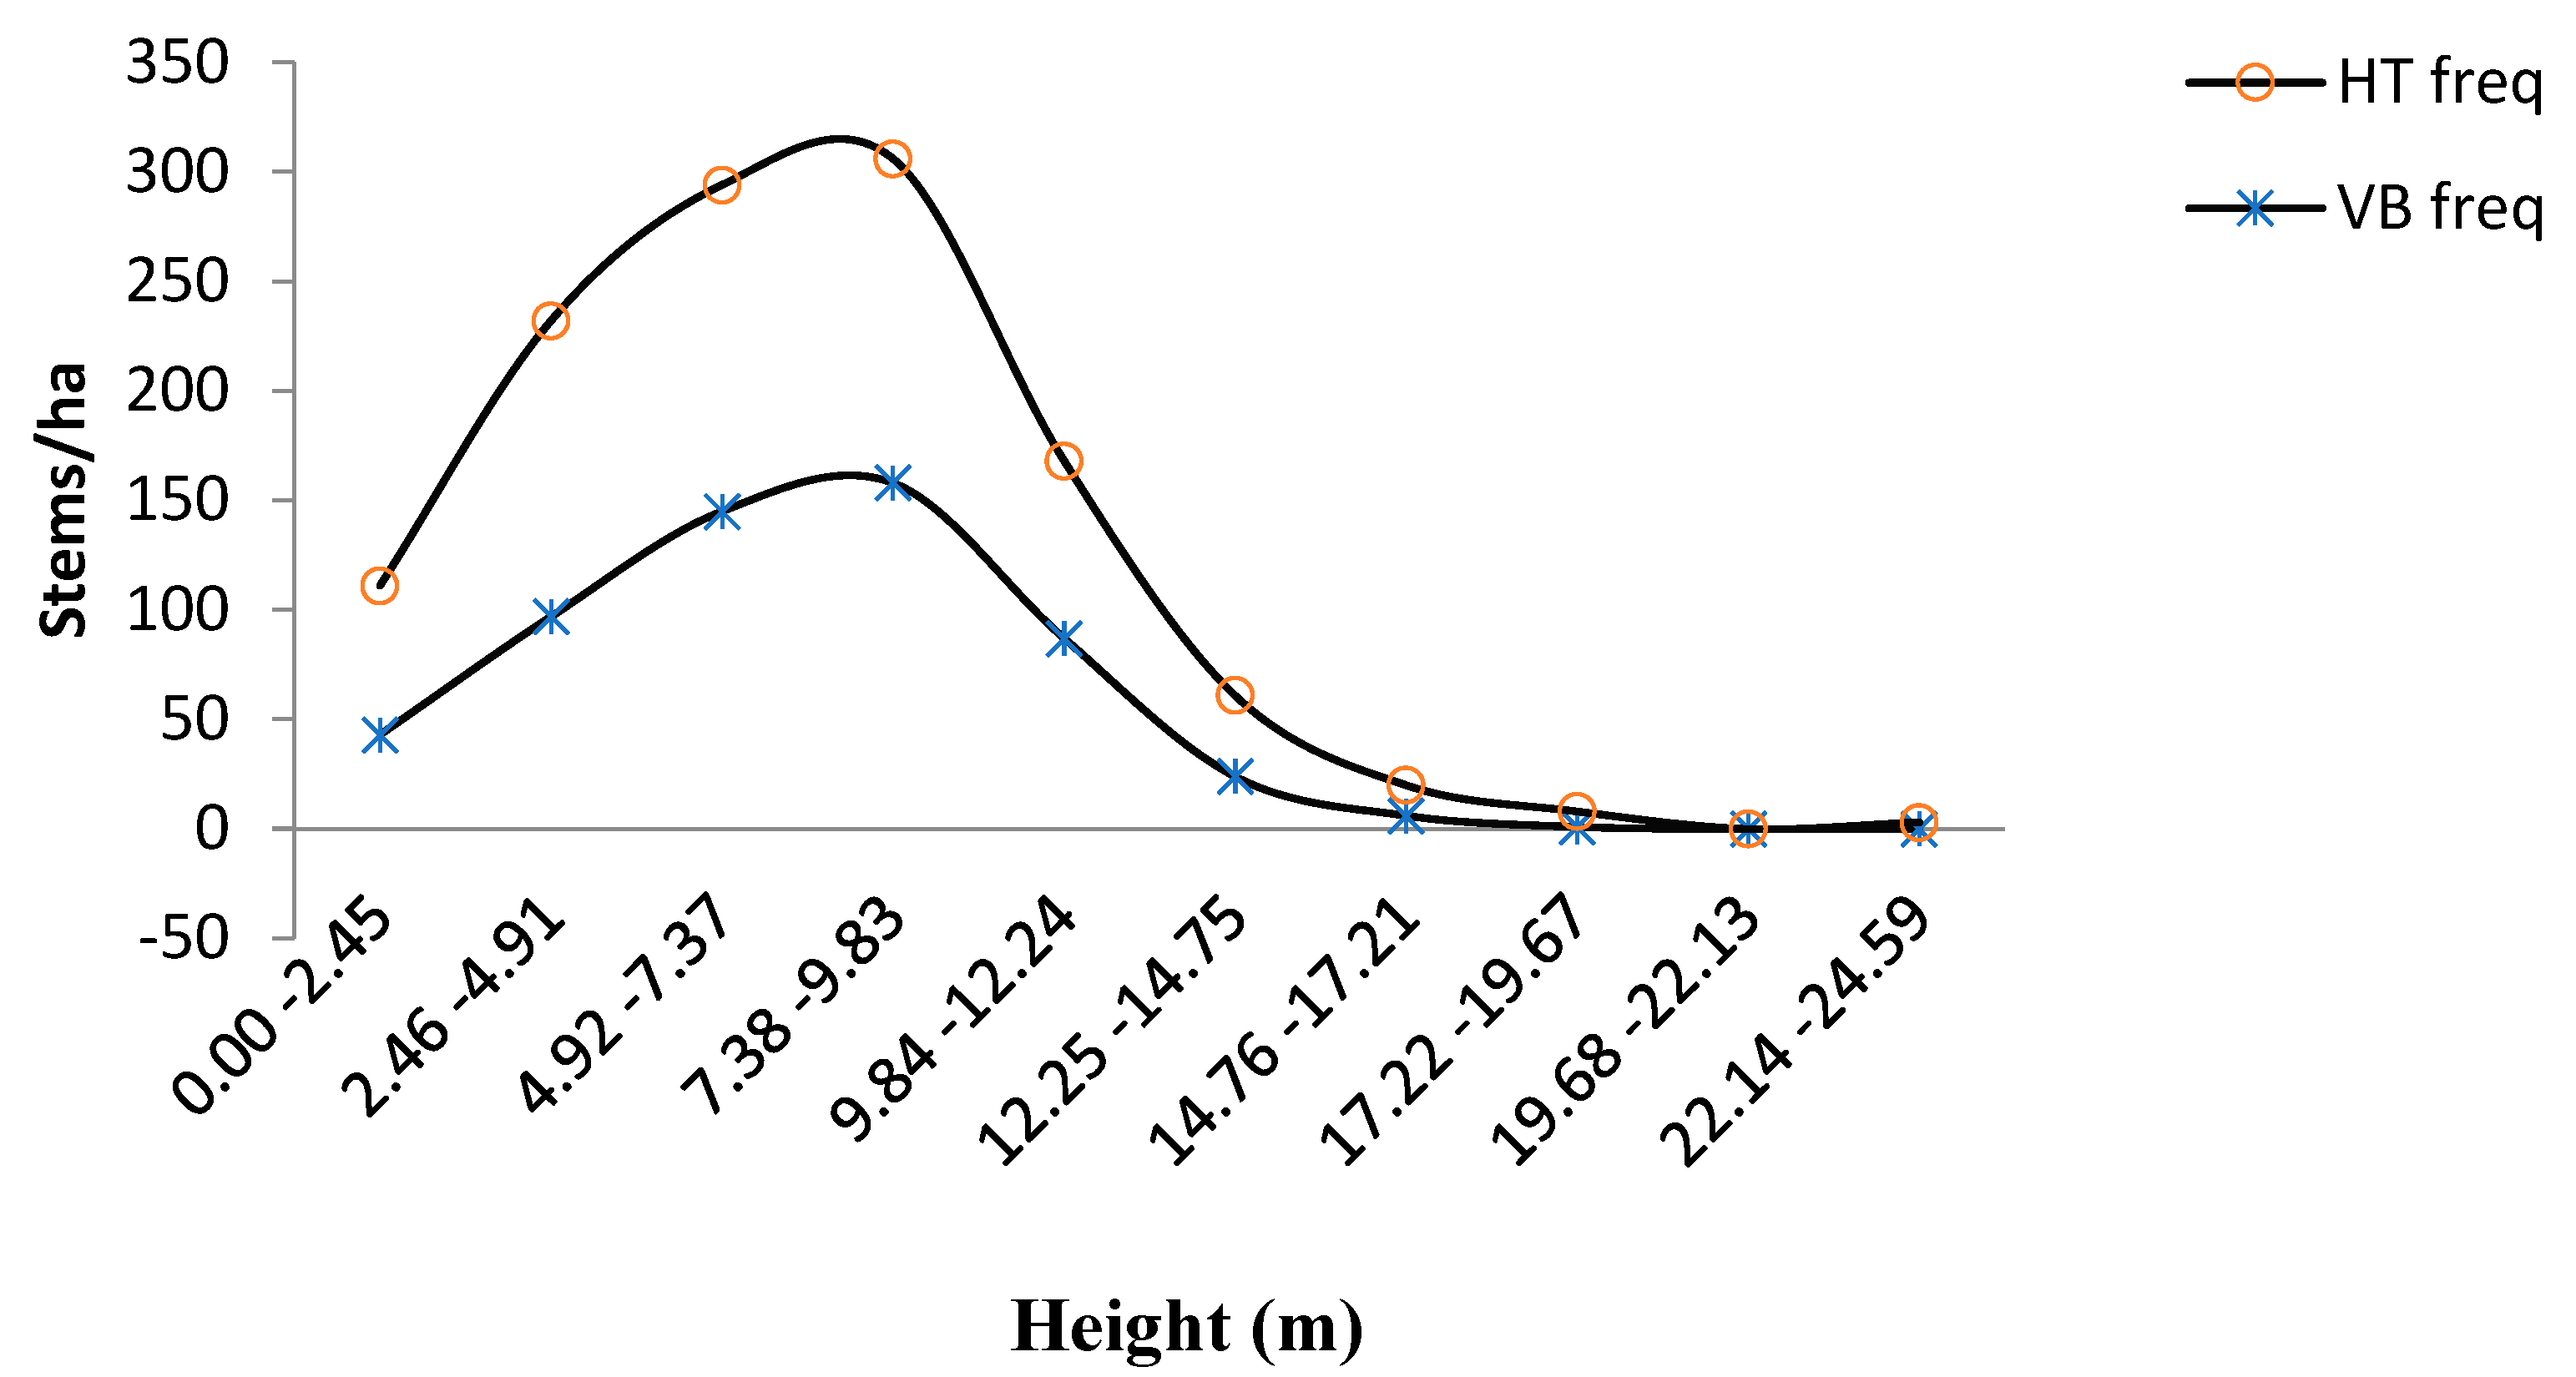
Additionally, the mean of the stem height of the Hilltop stand was not significantly different from the mean height of the Valley-Bottom stand (7.12 ± 3.88 vs. 7.26 ± 3.21 m; t-test = 0.67, p = 0.500). The stem height distribution of the Hilltop and Valley-Bottom stands expressed positively skewed unimodal distribution. The height-density distribution of both Valley-Bottom and Hilltop had the highest density at 7.38–9.83 m and decreased steadily to 3 stems/ha at 22.14–24.59 m (Figure 3).

3.3. Relationship between Inequality Measures and Diversity Indices of the Stem Diameter

There was significantly positive correlation between the Simpson diversity index and Margalef index (r = 0.956, p = 0.011) at a 0.05 significance level in the Hilltop stand (Table 3). Additionally, Evenness and Equitability of the diameter was significantly positively correlated (r = 0.955, p = 0.011) at a 0.05 significance level in the Hilltop stand. Furthermore, Skewness coefficient was significantly positive correlated with the Margalef index (r = 0.936, p = 0.019), Simpson diversity index (r = 0.932, p = 0021) and Shannon index (r = 0.905, p = 0.034) at a 0.05 significance level in the Hilltop stand. The Evenness and Margalef index of diameter distribution were significantly negative correlated in the Hilltop stand (r = −0.905, p = 0.035) at a 0.05 significance level. Therefore, measures of diameter inequality were strongly correlated with the diameter diversity in the Hilltop stand of the Omo Forest Reserve.
Mean diameter was significantly positively correlated with the Simpson diversity index (r = 0.915, p = 0.029) and significantly negatively correlated with the Stem density (r = −0.913, p = 0.030) for the diameter distribution in the Valley-Bottom stand (Table 4). Additionally, the stem density and Shannon index were significantly negatively correlated (r = −0.917, p = 0.029) at a 0.05 significance level in the Valley-Bottom stand. Therefore, measures of the diameter inequality and stand attributes were strongly correlated with each other in the Valley-Bottom stand (Table 4).

3.4. Relationship between Inequality Measures and Diversity Indices of the Stem Height

The Simpson diversity index was significantly positively correlated with the Equitability index (r = 0.953, p = 0.012) and Evenness index (r = 0.918, p = 0.028) in the Hilltop stand (Table 5). Therefore, measures of height diversity were strongly associated with each other in the Hilltop stand of the Omo Forest Reserve.
There was a significantly positive correlation between the Gini-Coefficient and Shannon diversity index (r = 0.945, p = 0.015), Skewness coefficient (r = 0.930, p = 0.022), Margalef index (r = 0.915, p = 0.029) and Simpson index (r = 0.878, p = 0.050) at a 0.05 probability level for height in Valley-Bottom stand. Additionally, the Coefficient of Variation was significantly positive correlated with the Margalef index (r = 0.945, p = 0.016), Simpson index (r = 0.931, p = 0.022) and Skewness coefficient (r = 0.901, p = 0.037) in the Valley-Bottom stand. Furthermore, the Skewness coefficient had positive correlation with the Margalef diversity index (r = 0.944, p = 0.016) and Shannon diversity index (r = 0.883, p = 0.047) at a 0.05 probability level in the Valley-Bottom stand (Table 6). Therefore, measures of height inequality were strongly correlated with the height diversity in Valley-Bottom stand of Omo Forest Reserve.

4. Discussion

4.1. The H-D Allometry of the Hilltop and Valley-Bottom Stands

The relationship between tree height and diameter is an indicator of stem form [7], and therefore, it was examined in the Hilltop and Valley-Bottom stands. The relationship of the height-diameter allometries is useful in order to identify competitive effect of tree stems on their morphological features, since the relationship between height and diameter depends on site conditions [8]. Therefore, a regression model was used to determine the H-D allometry of Teak in the Hilltop and Valley-Bottom stands. The results showed that the variability of the H-D allometry in the Valley-Bottom stand was higher than in the Hilltop stand. The stem height growth was more than the diameter growth rate. Therefore, the Hilltop stand had trees that allocated more biomass to tree height growth than stem diameter growth. Conversely, the relative height growth of most tree stems was almost equal to the relative diameter growth in the Valley-Bottom stand. Tree stems in the Hilltop stand had increased height growth compared to diameter growth. Therefore, the Hilltop stand displayed higher canopy stature than the Valley-Bottom stand. The rapid apical growth in trees is a trait that shows strong adaptation where inter-tree competition for space is very important. This is contrary to the report of [9], which stated that tree growth and competition for light declined with elevation. Therefore, the effect of stem density is more significant on tree growth than the effect of elevation in the Omo Forest Reserve. This suggested that the stem form differs among trees of different sizes [7] and elevations. Reference [5] stated that the allocation of biomass to stem diameter is likely to occur when greater inter-tree competition or environmental disturbance is present. A difference in the H-D relationship was found in the two stands. Stem density probably caused a difference in the allometric equation of the two sites. Initially, the Hilltop and Valley-Bottom stands were established using 2.0 m × 3.0 m spacing, but a lot of forked stems were observed in the Hilltop stand, probably due to water stress at seedling stage. Evidence of flooding and water logging were noticed in the Valley-Bottom stand. Flooding and water logging during the rainy season may reduce the rate of plant growth of large tree stems in the Valley-Bottom stand. Therefore, size hierarchy is influenced by water availability and duration of water availability. Competition may be primarily symmetric when water availability is low and asymmetric when water availability is high [4,10]. The difference in stem form between the Valley-Bottom and Hilltop stands may be caused by water logging during rainy season as a consequence of difference in elevation.

4.2. Diameter-Density and Height-Density Distribution of the Hilltop and Valley-Bottom Stands

Histogram of frequency distribution allows a visual estimate of the shape of distribution to be made [11]. The diameter-density distribution of the Valley-Bottom stand expressed positively skewed bimodal distribution, while the Hilltop stand expressed positively skewed unimodal distribution. Therefore, the Valley-Bottom stand had a second maximum in the middle size class in addition to positive skewness. The diameter-density distribution of the Valley-Bottom stand indicated an unequal decline in the relative growth rates across plant size classes with decreasing stem density. Ref. [12] suggested that the bimodality distribution was the consequence of a disjunct distribution of relative growth rates in the population, where individuals share limited resources disproportionately in relation to their relative sizes. The diameter classes of the Hilltop stand contained higher stem density (stems/ha) than the Valley-Bottom stand, except at class 12.06–14.06 and 14.07–16.07 cm dbh. Therefore, the diameter structure of the Hilltop stand was higher than the Valley-Bottom stand. The expression of the two peaks of the diameter distribution of the Valley-Bottom stand suggests the development of a two-tiered canopy of large and small tree stems. Therefore, the Valley-Bottom stand produced a bimodal frequency distribution of the plant size. This described a segregation of Tectona grandis tree stems into suppressed and dominant trees. The segregation occurs before the occurrence of self-thinning in monoculture stands [13]. The large diameter trees had higher relative growth rates than small diameter trees. Moreover, [13] reported that segregation occurs when large plants intercept a disproportionately large portion of available light as their canopies overlap those of the smaller trees. The difference between diameter-density distribution of the Hilltop and Valley-Bottom stands was the number of stems in the mid-classes of the diameter distribution. The major difference between the Hilltop and Valley-Bottom stands was the stem density of intermediate stems (4.02–14.02 cm dbh). This partially supports the report of [14], which stated that vigorous mid-class growth may produce a sigmoid distribution.
Positive skewness showed that a few large trees suppressed the growth of numerous small stems [15]. The high coefficient of variation indicates a higher height growth rate relative to stem diameter growth rate [16] in the Hilltop stand. Although there was significant difference in the stem diameter of Hilltop and Valley-Bottom stands, the tree stems of a relatively small diameter occupied the Valley-Bottom stand because experimental thinning was done on big stems just before this study. The skewness of diameter-density distribution of Hilltop stand was higher than in the Valley-Bottom stand. According to [17], skewness indicates interference among the tree stems. Inter-tree competition caused the interference among the tree stems of the Hilltop stand.
The stem diameter inequality of the Hilltop stand was higher than in the Valley-Bottom stand. Therefore, the stem diameter inequality was greater at a higher tree density [18]. Size-asymmetric inter-tree competition is more applicable in the Hilltop stand than the size-symmetric competition. It was proposed that skewness can be used as a measure of interference [17]. Additionally, size asymmetry refers to skewness within the size-frequency distribution, while size inequality refers to the uneven allocation of mass among individuals in a population [19]. The difference in the inequality of the diameter distribution of the Hilltop and Valley Bottom stands could be a consequence of the elevation gradient, while the difference in skewness may be caused by the difference in the stem density. The difference in the stem density may be a consequence of the elevation gradient. A significant number of forked stems were encountered in the Hilltop stand, probably due to water stress at seedling stage. The presence of resource depletion increases the skewness and variance of the distributions of plant size [20]. Size inequality in plant communities arises when a few large individuals suppress the growth of the other tree stems [15]. The height inequality and variation were greater in the Hilltop stand than the Valley-Bottom stand. The size variability increases with the stem density [19]. This suggested that the inter-tree competition intensity was greater in the Hilltop stand than in the Valley Bottom stand, because inter-tree competition for resources increases the size inequality in tree populations.
The height-density distribution of the Hilltop and Valley-Bottom stands had a single peak shape. The number of trees decreased rapidly with the increase in height of the trees. Trees with a small stem height dominated the Valley-Bottom stand because experimental thinning was done on big stems just before this study. The Hilltop stand contained a slightly greater proportion of stems of intermediate height, which decreased with an increase in stem height.

4.3. Correlation between the Inequality and Diversity Measures

Significant positive correlation between the Skewness coefficient and diversity indices (Margalef, Simpson and Shannon) were the most prominent correlation in the diameter distribution of the Hilltop stand. This indicated that the positive correlation between inequality and diversity is responsible for the diameter structure of the Hilltop stand. Additionally, a significant positive correlation between the Simpson index and Mean diameter was the most statistically significant, with the highest correlation in the diameter distribution of the Valley-Bottom stand. This indicated that the positive correlation between the diversity and stand attributes is responsible for the diameter structure of the Valley-Bottom stand.
Furthermore, the correlation between the Simpson index and Equitability and Evenness was the most statistically significant, with the highest correlation in the height distribution of the Hilltop stand. This indicated that the positive correlation among the diversity indices is responsible for the height structure of the Hilltop stand. The positive correlations between the Gini Coefficient and Shannon index and between the Coefficient of Variation and Margalef index were the most statistically significant, with the highest correlation in the Valley-Bottom stand. This indicated that the positive correlation between the inequality and diversity measures is responsible for the height structure of the Valley-Bottom stand.
Therefore, the same mechanism was responsible for the diameter structure of the Hilltop stand and the height structure of the Valley-Bottom stand. This mechanism expressed unequal allocation of biomass to the stem, which is associated with an unequal proportion of stems in the diameter classes of the Hilltop stand and the height classes of the Valley-Bottom stand. This mechanism may have occurred due to equal stem spacing (2.0 × 3.0 m2) during the establishment of the Teak plantation. Conversely, different mechanisms were responsible for the diameter structure of the Valley-Bottom stand and the height structure in the Hilltop stand of the Omo Forest Reserve.

5. Conclusions

The variation in the height-diameter allometry between the Hilltop and Valley-Bottom stands was caused by a difference in the stand density and could be a precursor of the effect of the elevation gradient. Therefore, the stem form differs among trees of different sizes and elevations. The diameter-density distribution of the Hilltop and Valley-Bottom stands were unimodal and bimodal, respectively. The difference in the inequality of the diameter distribution of the Hilltop and Valley Bottom stands could be a consequence of the different moisture regimes and probably caused through elevation gradient, while the difference in skewness may be caused by the difference in stem density. The same mechanism was responsible for the diameter structure of the Hilltop stand and the height structure of the Valley-Bottom stand. However, different mechanisms were responsible for the diameter structure of the Valley-Bottom stand and the height structure of the Hilltop stand.

Author Contributions

Conceptualization, O.F.F.; methodology, O.F.F.; validation, O.F.F. and S.B.O.; formal analysis, O.F.F. and S.B.O.; investigation, S.B.O.; data curation, O.F.F. and S.B.O.; writing—original draft preparation, O.F.F.; writing—review and editing, O.F.F.; supervision, O.F.F.; project administration, O.F.F.; funding acquisition, O.F.F. and S.B.O. All authors have read and agreed to the published version of the manuscript.

Funding

This research received no external funding.

Institutional Review Board Statement

Not applicable.

Informed Consent Statement

Informed consent was obtained from all subjects involved in the study.

Data Availability Statement

Not applicable.

Conflicts of Interest

The authors declare no conflict of interest.

References

  1. Weiner, J. Asymmetric competition in plant populations. Trends Ecol. Evol. 1990, 5, 360–364. [Google Scholar] [CrossRef]
  2. Schwinning, S.; Weiner, J. Mechanisms determining the degree of size asymmetry in competition among plants. Oecologia 1998, 113, 447–455. [Google Scholar] [CrossRef] [PubMed]
  3. Sumata, B. Relationship between size hierarchy and density of trees in a tropical dry deciduous forest of Western India. J. Veg. Sci. 2010, 18, 389–394. [Google Scholar] [CrossRef]
  4. Wichmann, L. Annual variations in competition symmetry in Even-aged Sitka spruce. Ann. Bot. 2001, 88, 145–151. [Google Scholar] [CrossRef] [Green Version]
  5. Kroon, J.; Anderson, B.; Mullin, T.J. Genetic variation in the diameter-height relationship Scot pine (Pinus sylvestris). Can. J. For. Res. 2008, 38, 1493–1503. [Google Scholar] [CrossRef]
  6. Ojo, L.O. The fate of a tropical rainforest in Nigeria: Abeku sector of Omo Forest Reserve. Glob. Nest Int. J. 2004, 6, 116–130. [Google Scholar]
  7. Bi, H.; Turvey, N. Competition in mixed stands of Pinus radiata and Eucalyptus oblique. J. Appl. Ecol. 1996, 33, 87–99. [Google Scholar] [CrossRef]
  8. Fulton, M.R. Patterns in height-diameter relationship for selected tree species and site in Eastern Texas. Can. J. For. Res. 1999, 29, 1445–1448. [Google Scholar] [CrossRef]
  9. Coomes, D.A.; Allen, R.B. Effects of size, competition and altitude on tree growth. J. Ecol. 2007, 95, 1084–1097. [Google Scholar] [CrossRef]
  10. Hara, T. Dynamics of size structure in plant populations. Trends Ecol. Evol. 1988, 3, 129–133. [Google Scholar] [CrossRef]
  11. Ford, E.D. Competition and stand structure in some even-aged plant monocultures. J. Ecol. 1975, 63, 311–333. [Google Scholar] [CrossRef]
  12. Ford, E.D.; Newbould, P.J. Stand structure and dry weight production through the sweet chestnut (Castanea sativa Mill.) coppice cycle. J. Ecol. 1970, 58, 275–296. [Google Scholar] [CrossRef]
  13. West, P.W.; Borough, C.J. Tree suppression and the self-thinning rule in a monoculture of Pinus radiate D. Don. Ann. Bot. 1983, 52, 149–158. [Google Scholar] [CrossRef]
  14. Golf, F.G.; West, D.C. Canopy-understory interaction effects on forest population structure. For. Sci. 1975, 21, 98–108. [Google Scholar]
  15. Blend, M.; Lussier, J.-M.; Bergeron, Y.; Longpre, M.-H.; Beland, M. Structure, spatial distribution and competition in mixed jack pine (Pinus banksiana) stands on clay soils of eastern Canada. Ann. For. Sci. 2003, 60, 609–617. [Google Scholar] [CrossRef] [Green Version]
  16. Mendez-Alonzo, R.; Hernandez-Trejo, H.; Lope-Portillo, J. Salinity contrains size inequality and allometry in two contrasting mangrove habitats in the Mexico. J. Trop. Ecol. 2012, 28, 171–179. [Google Scholar] [CrossRef]
  17. Higgins, S.S.; Bendel, R.B.; Mack, R.N. Assessing competition among skewed distributions of plant biomass: An application of the Jackknife. Biometrics 1984, 40, 131–137. [Google Scholar] [CrossRef]
  18. Knox, R.G.; Peet, R.K.; Christensen, N.L. Population dynamics in Loblolly Pine stands: Changes in Skewness and size inequality. Ecology 1989, 70, 1153–1167. [Google Scholar] [CrossRef]
  19. Newton, P.F.; Jolliffe, P.A. Aboveground dry matter partitioning, size variation, and competition processes within second-growth black spruce stands. Can. J. For. Res. 1993, 23, 1917–1929. [Google Scholar] [CrossRef]
  20. Turner, M.D.; Rabinowitz, D. Factors affecting frequency distributions of plant mass: The absence of dominance and suppression in competing and monocultures of Festuca paradoxa. Ecology 1983, 64, 469–475. [Google Scholar] [CrossRef]
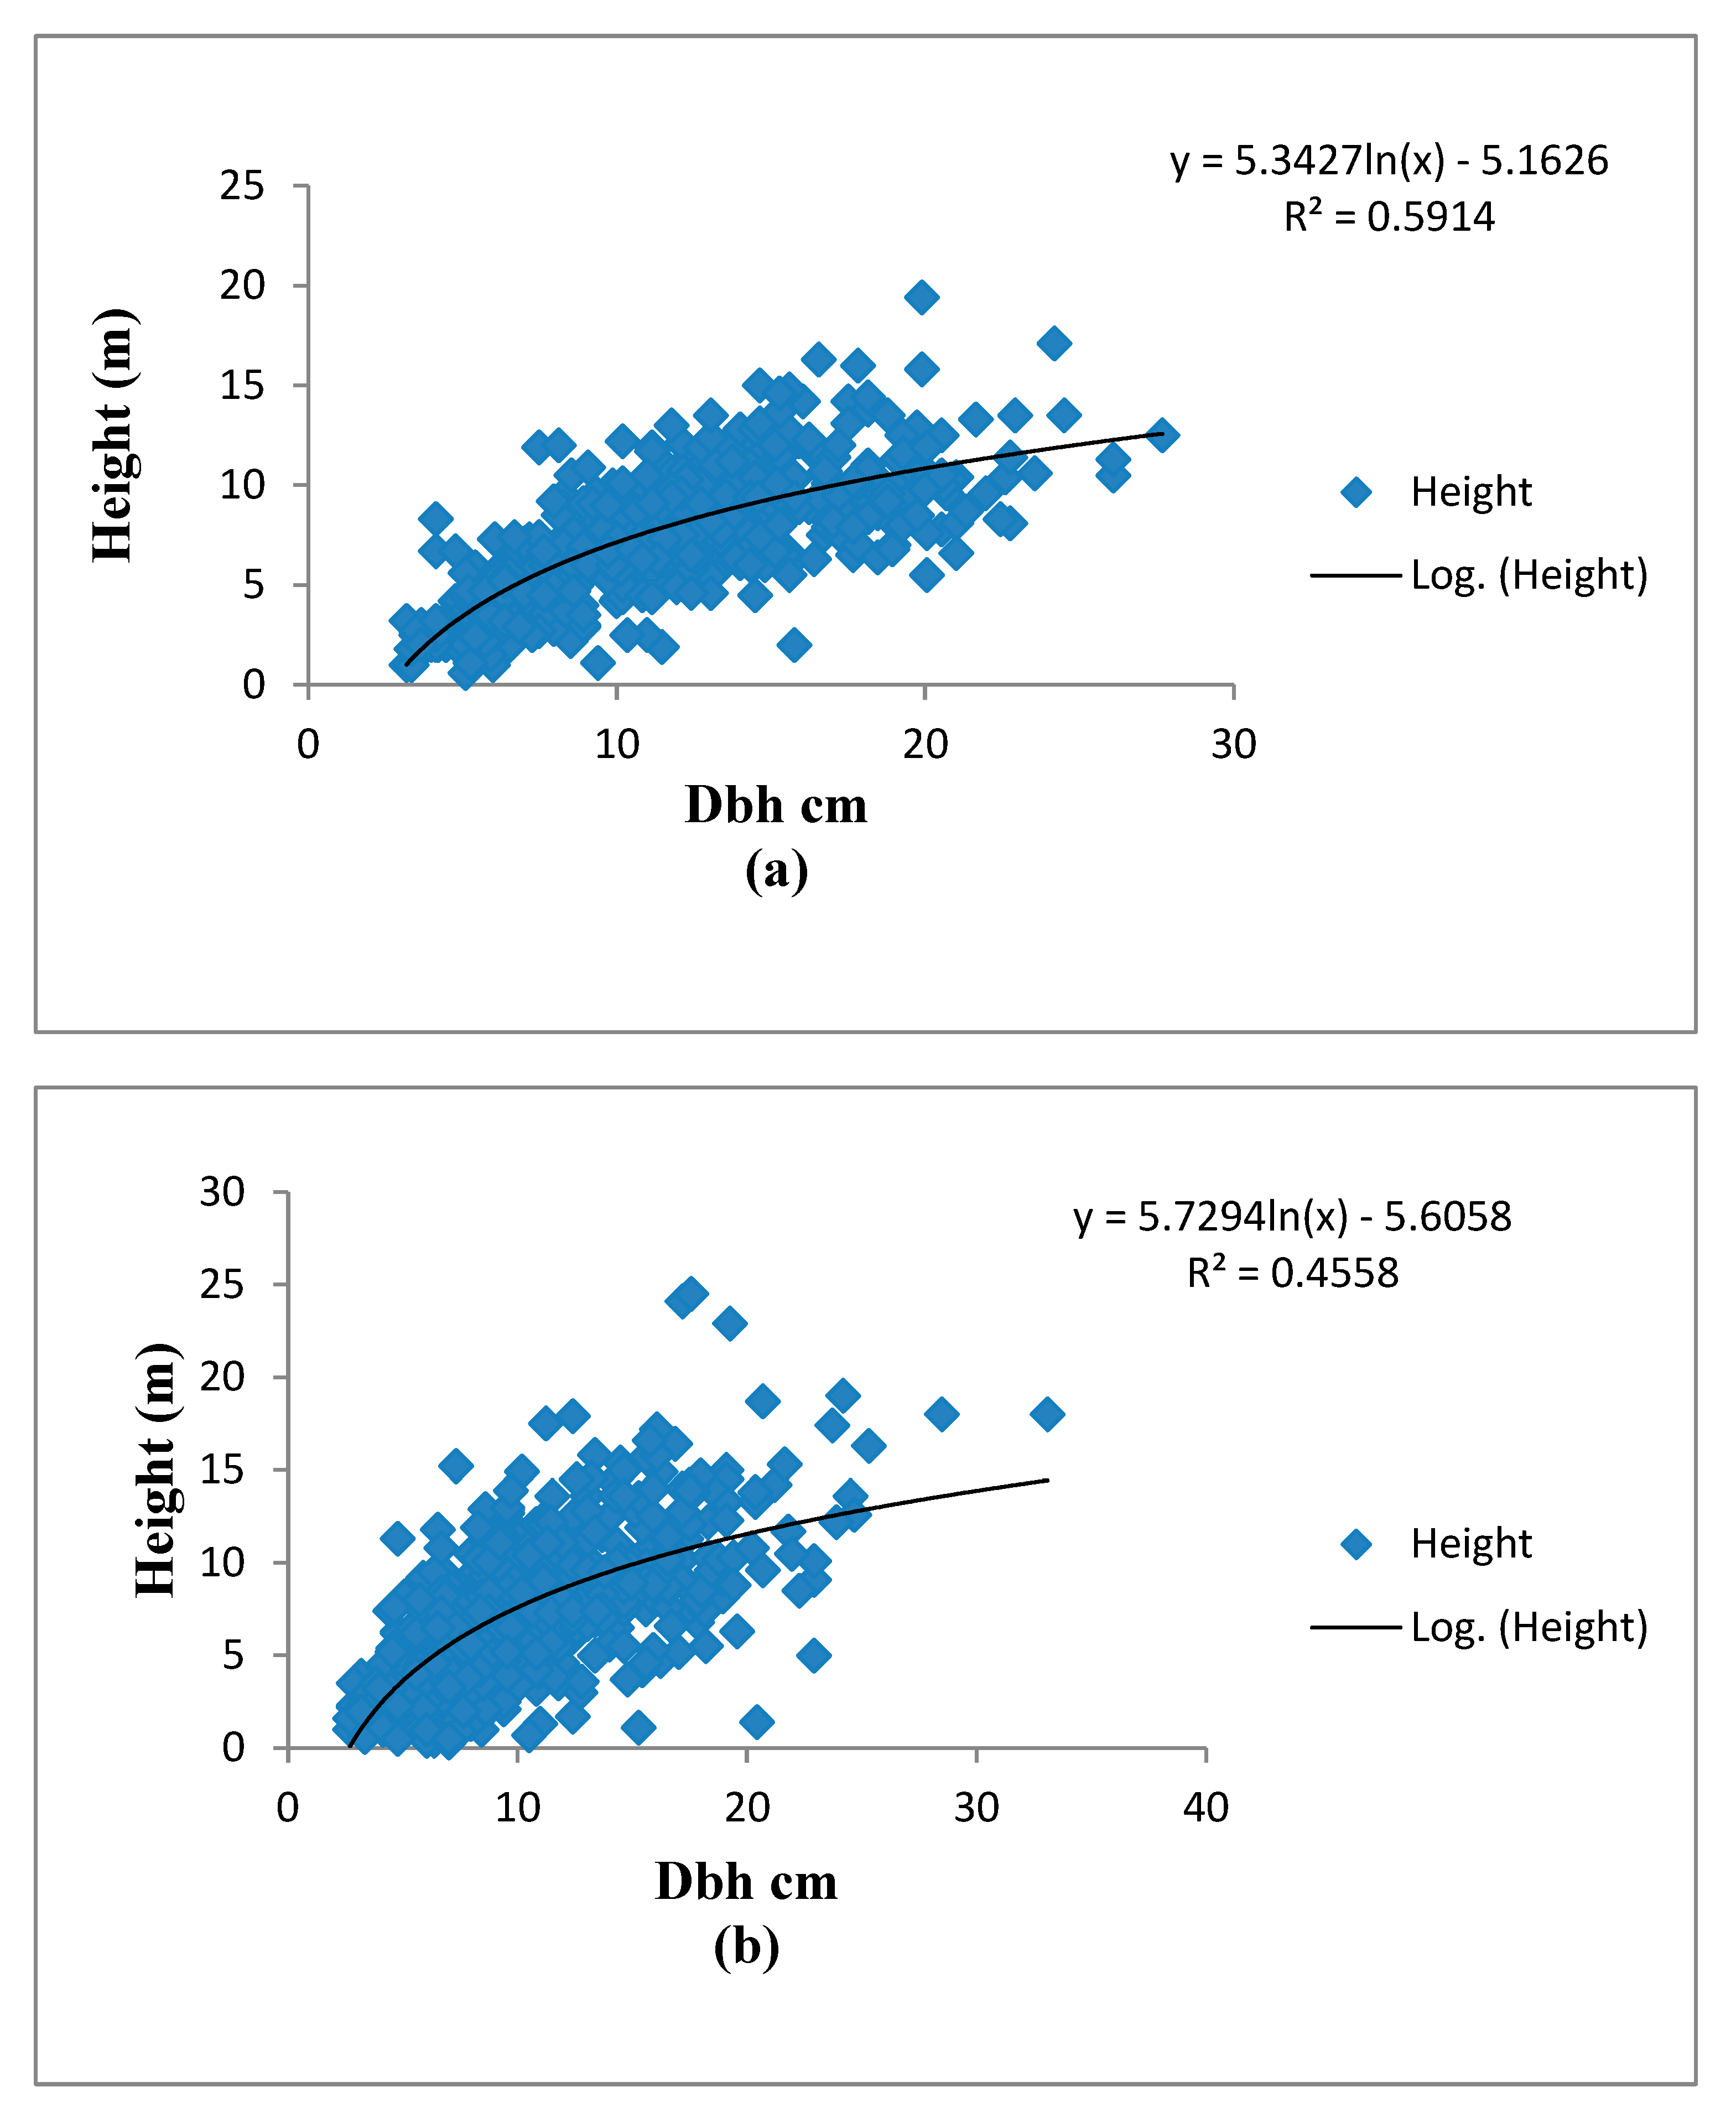
Figure 1. (a). Height-Diameter Allometry of the Teak stands in the Valley-Bottom stand of the Omo Forest Reserve. (b) Height-Diameter Allometry of the Teak stands in the Hilltop stand of the Omo Forest Reserve.
Environsciproc 13 00021 g001
Figure 2. Diameter distribution of the Teak stand in the Valley-Bottom and Hilltop stands in the Omo Forest reserve.
Environsciproc 13 00021 g002
Figure 3. Height-density distribution of the Teak stand of the Valley-Bottom and Hilltop stands in the Omo Forest Reserve.
Environsciproc 13 00021 g003
Table 1. Statistics of the diameter distributions of the Tectona grandis stand in the Valley-Bottom and Hilltop habitats of the Omo Forest Reserve.
StandMinimum
(cm dbh)
Maximum
(cm dbh)
Mean ± Std
(cm dbh)
GiniCV
(%)
SkewnessKurtosisSD
(Stems/ha)
Hilltop2.7123.1010.19 ± 4.620.2445.370.971.181431.00
Valley-Bottom3.1824.6811.30 ± 4.820.2442.680.470.471251.00
Coefficient of Variation; CV, Gini-Coefficient; Gini, Skewness-Coefficient; Skewness.
Table 2. Statistics of the height distributions of the Teak stand in Valley-Bottom and Hilltop in the Omo Forest Reserve.
StandMinimum (m)Maximum (m)Mean ± Std (m)GiniCV (%)SkewnessKurtosisSD (Stems/ha)
Hilltop0.3024.507.12 ± 3.880.2954.510.771.111431.00
Valley-Bottom1.0019.407.26 ± 3.210.2544.300.22−0.211251.00
Coefficient of Variation; CV, Gini-Coefficient; Gini, Skewness-coefficient; Skewness.
Table 3. Correlation statistics of the diameter inequality and diversity measures in the Hilltop stand of the Omo Forest Reserve.
Index 1Index 2Correlation ValueAt 0.05 Level
Simpson indexMargalef index0.9560.011
EvennessEquitability0.9550.011
Skewness coefficientMargalef index0.9360.019
Skewness coefficientSimpson index0.9320.021
Skewness coefficientShannon index0.9050.034
EvennessMargalef index−0.9050.035
Table 4. Correlation statistics of the diameter inequality and diversity measures in the Valley-Bottom stand of the Omo Forest Reserve.
Index 1Index 2Correlation ValueAt 0.05 Level
Mean_DSimpson 0.9150.029
Mean_DStem_density−0.9130.030
Stem_densityShannon-Weiner−0.9170.029
Table 5. Correlation statistics of the height inequality and diversity measures in the Hilltop stand of the Omo Forest Reserve.
Index 1Index 2Correlation ValueAt 0.05 Level
SimpsonEquitability0.9530.012
SimpsonEvenness0.9180.028
Table 6. Correlation statistics of the height inequality and diversity measures in the Valley-Bottom of the Omo Forest Reserve.
Index 1Index 2Correlation ValuesAt 0.05 Level
Gini-CoefficientShannon index0.9450.015
Coefficient of VariationMargalef index0.9450.016
Skewness coefficientMargalef index0.9440.016
EvennessEquitability0.9410.017
Coefficient of VariationSimpson-index0.9310.022
Gini-CoefficientSkewness coefficient0.9300.022
Gini-CoefficientMargalef index0.9150.029
Simpson indexMargalef index0.9140.030
Coefficient of VariationSkewness coefficient0.9010.037
Skewness coefficientShannon-index0.8830.047
Gini-CoefficientSimpson index0.8780.050
Publisher’s Note: MDPI stays neutral with regard to jurisdictional claims in published maps and institutional affiliations.