Proceeding Paper

Wildfire Pollution Exposure and Human Health: A Growing Air Quality and Public Health Issue †

1
Department of Statistics, North Carolina State University, Raleigh, NC 27695, USA
2
Department of Marine, Earth, and Atmospheric Sciences, North Carolina State University, Raleigh, NC 27695, USA
3
Department of Surgery, School of Medicine, Duke University, Durham, NC 27710, USA
*
Author to whom correspondence should be addressed.
Presented at the 5th International Electronic Conference on Atmospheric Sciences, 16–31 July 2022; Available online: https://ecas2022.sciforum.net/.
Environ. Sci. Proc. 2022, 19(1), 59; https://doi.org/10.3390/ecas2022-12809
Published: 14 July 2022
(This article belongs to the Proceedings of The 5th International Electronic Conference on Atmospheric Sciences)

Abstract

:
Wildfires emit large quantities of air pollutants into the atmosphere. As wildfires increase in frequency, intensity, duration, and coverage area, such emissions have become a significant health hazard for residential populations, particularly vulnerable groups. This health hazard is exacerbated by two factors: first, wildfires are expected to increase in frequency as a result of climate change and, second, human health is adversely impacted by fine particulate matter produced from wildfires. Recent toxicological studies suggest that wildfire particulate matter may be more toxic than equal doses of ambient PM2.5. The role of ammonia emissions from wildfires on PM2.5 is examined. The impact of poor air quality on human health is examined and some strategies are discussed to forecast the burden of diseases associated with exposures to wildfire events, both short and long term, and help develop mitigation strategies.

1. Introduction

During the last few decades, wildfire activity has been increasing. Moreover, climate change will enhance wildfire activity, resulting in increased human exposure to wildfire pollutants [1]. Acute and chronic exposures to wildfire particulate matters (PMs) are associated with premature mortalities, predominantly cardiovascular and respiratory [2]. Recent evidence suggests that PM2.5 from wildfires causes an enhanced adverse impact on human health when compared to PM2.5 exposure from other sources [3]. Increased daily mortality has been observed from air pollution exposure associated with dust storms and biomass burning [4,5]. Wildfire smoke contributes to high levels of air pollutants, which are risk factors for adverse cardiovascular effects, especially in vulnerable populations, and significantly contribute to morbidity and mortality in communities with health disparity, especially minority populations [6].
Research is needed for human health exposure studies from wildfire [7]. The role of climate change on human health impacts in the future needs to be examined, which will allow mitigation policies to be implemented. To improve our ability to predict the public-health burden of wildfire emissions, we need to forecast air pollutant and particulate emissions from active fires. Emissions depend on a number of variables, such as burned area, biomass, meteorology, ground conditions, soil moisture, etc. However, most of these variables are difficult to measure or even forecast for active fires.

2. Results

Pollutant emissions, e.g., NH3 and PM2.5 emissions, from wildfires are calculated using Equation (1) [8,9,10,11]:
E i = B ( x ) BA ( x , t ) EF j FB
where:
Ei is the species’ emissions (g),
B(x) is the biomass loading at location x (g/m2),
BA(x,t) is the burned area at location x and time t (m2),
EFj is the emission factor for species j (g species g−1 biomass burned), and
FB is the fraction of biomass burned.
Wiedinmyer et al. [11] published biomass loading (B(x)) values for different regions. Collection 5 MODIS Global Land Cover Type product (MCD12Q1; 500 m) Version 6 for 2018 was utilized to estimate land cover classification [12]. Burn area, (BA(x,t)), is determined using the Moderate Resolution Imaging Spectroradiometer (MODIS)/Aqua+Terra [13]). Wiedinmyer et al. [10,11] provided the fraction of biomass burned (FB). This methodology is summarized by [14,15]. The pollutant emission average emission factors (EFs), for example, PM2.5 and NH3, are obtained from the literature [10,11]. The most important parameter in estimating wildfire emissions (Equation (1)) is burn area [16].
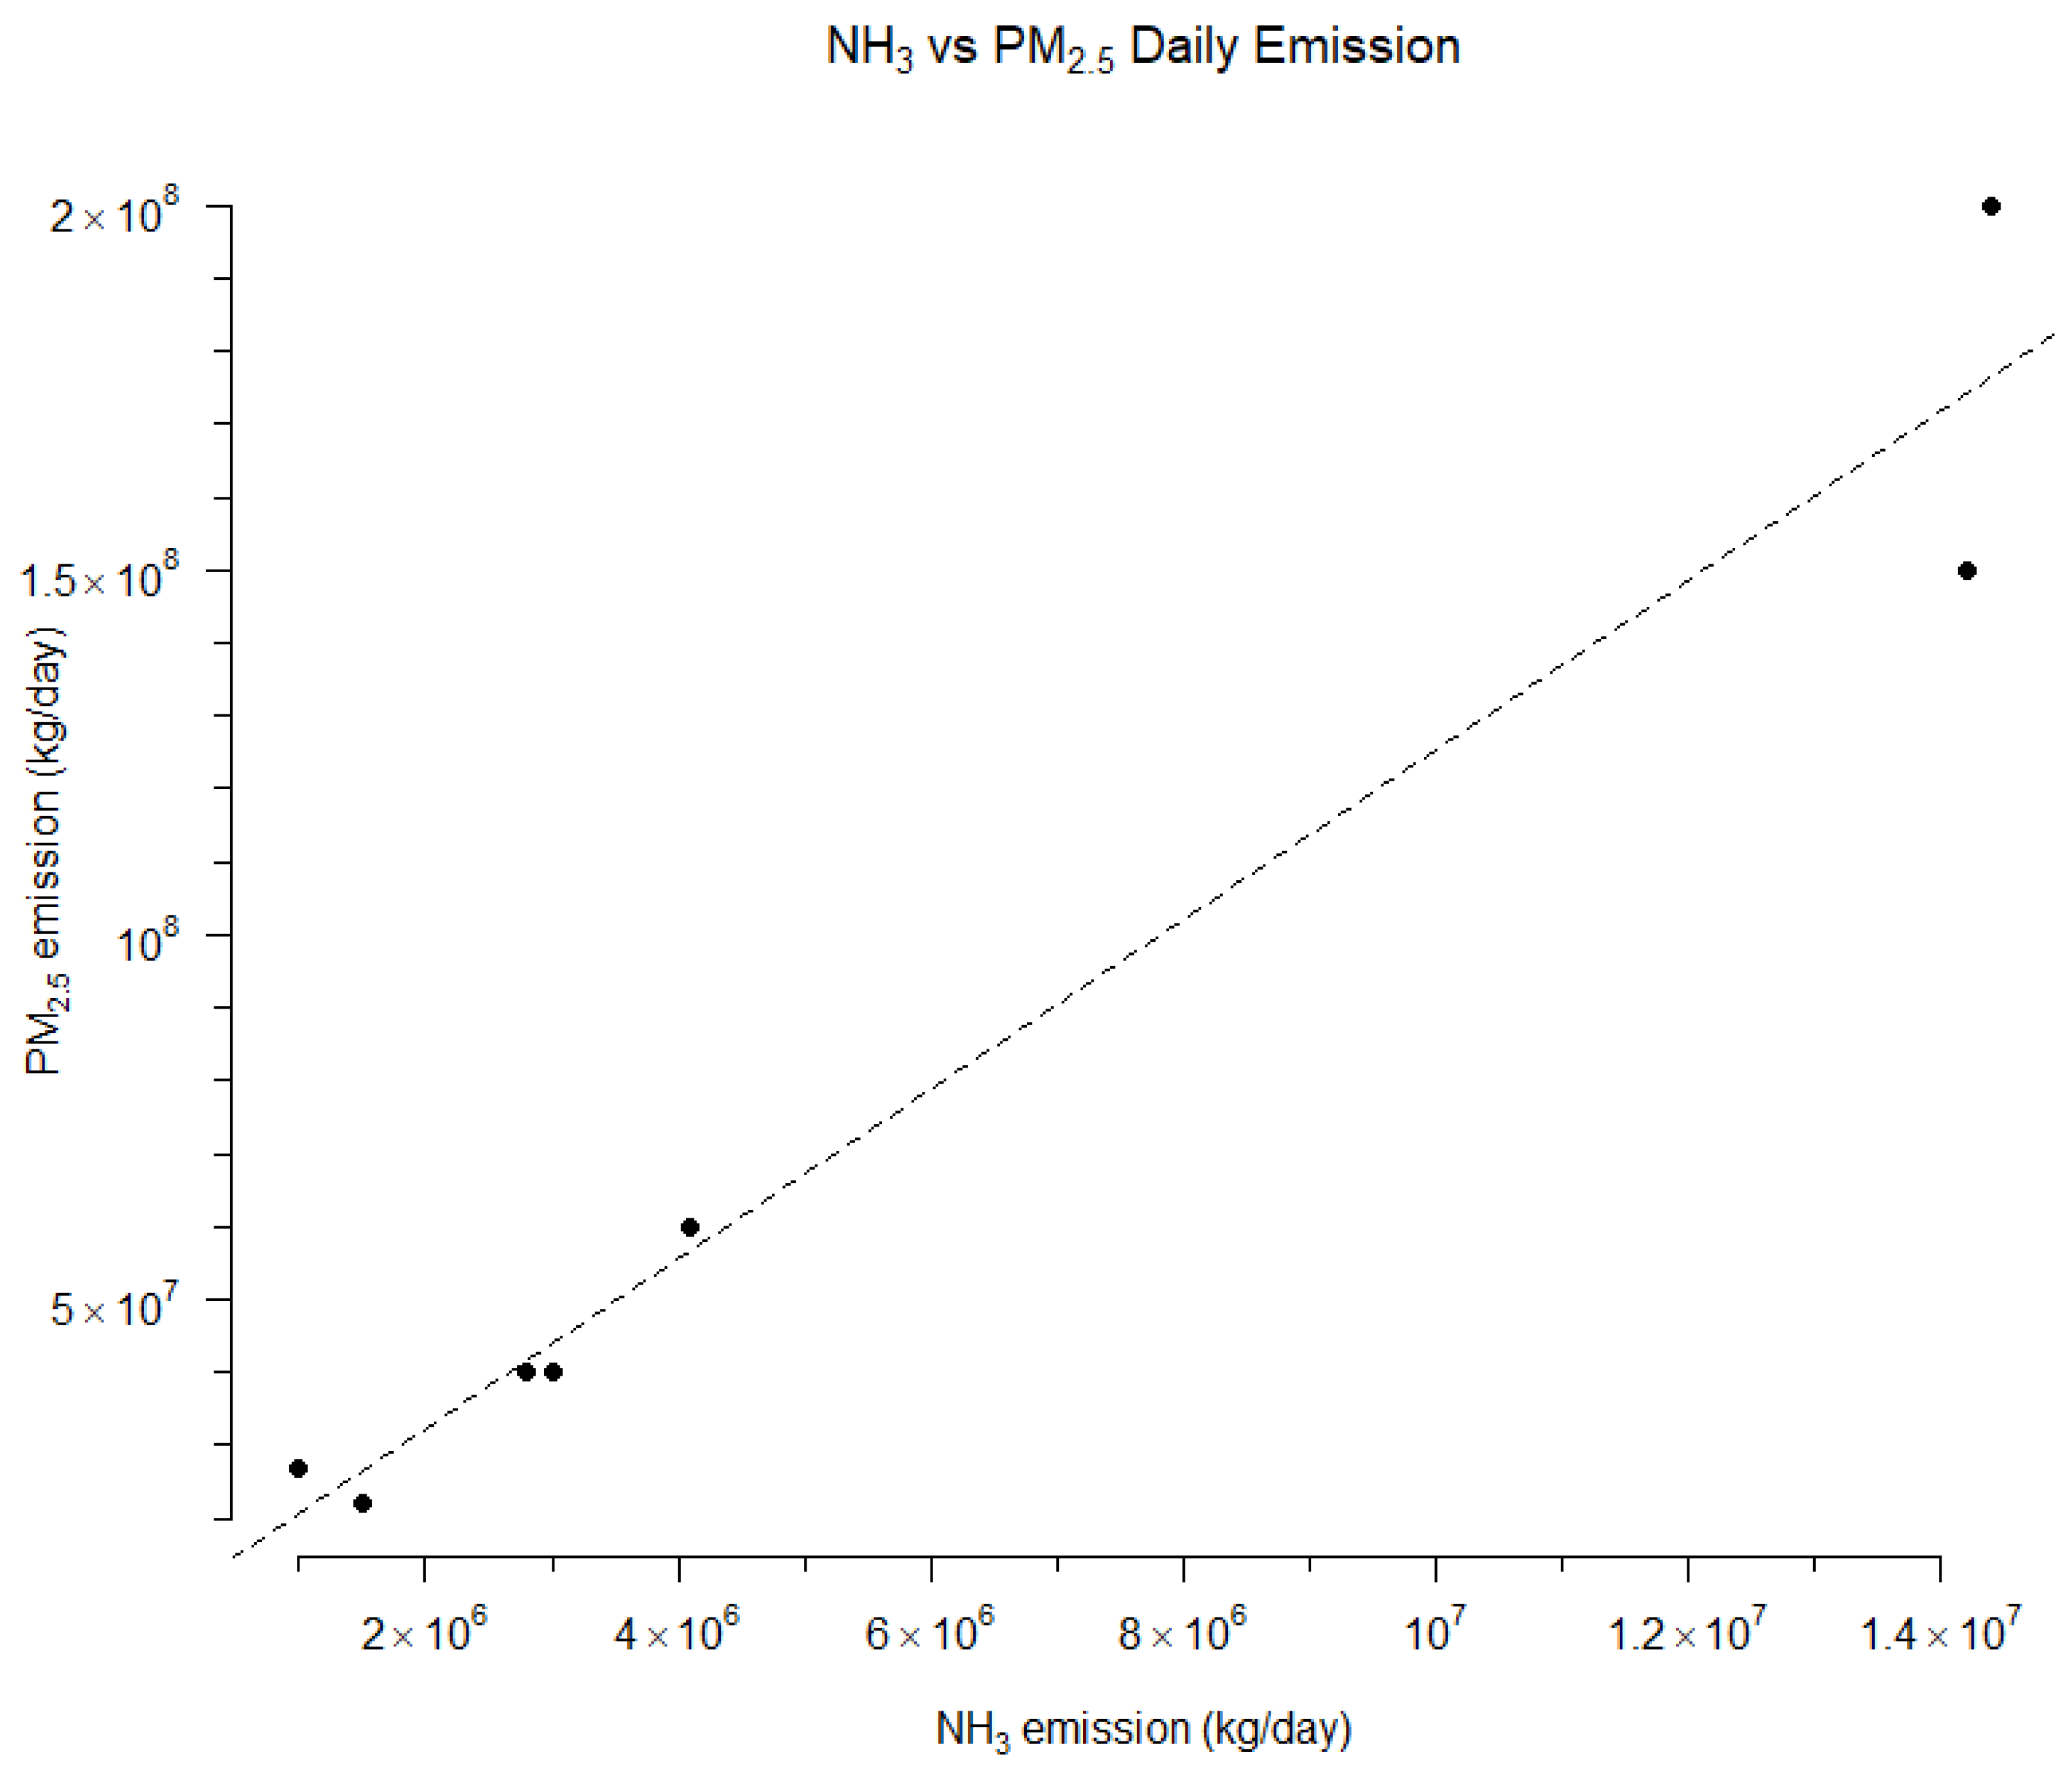
Since ammonia is a precursor in the formation of PM2.5, we observe (Figure 1) that the emission patterns of ammonia and PM2.5 are similar. A plot of ammonia emissions versus PM2.5 emissions (Figure 2) in Southeast Australia provides the role of ammonia in secondary PM2.5 formation in wildfire. The linear equation: y = 8.94 × 10⁶ + 11.62x with adjusted R-squared: 0.95 further supports this conclusion. Moreover, the intercept of the linear regression provides insight into the possible background PM2.5 emission of 8.94 × 10⁶ kg per year.
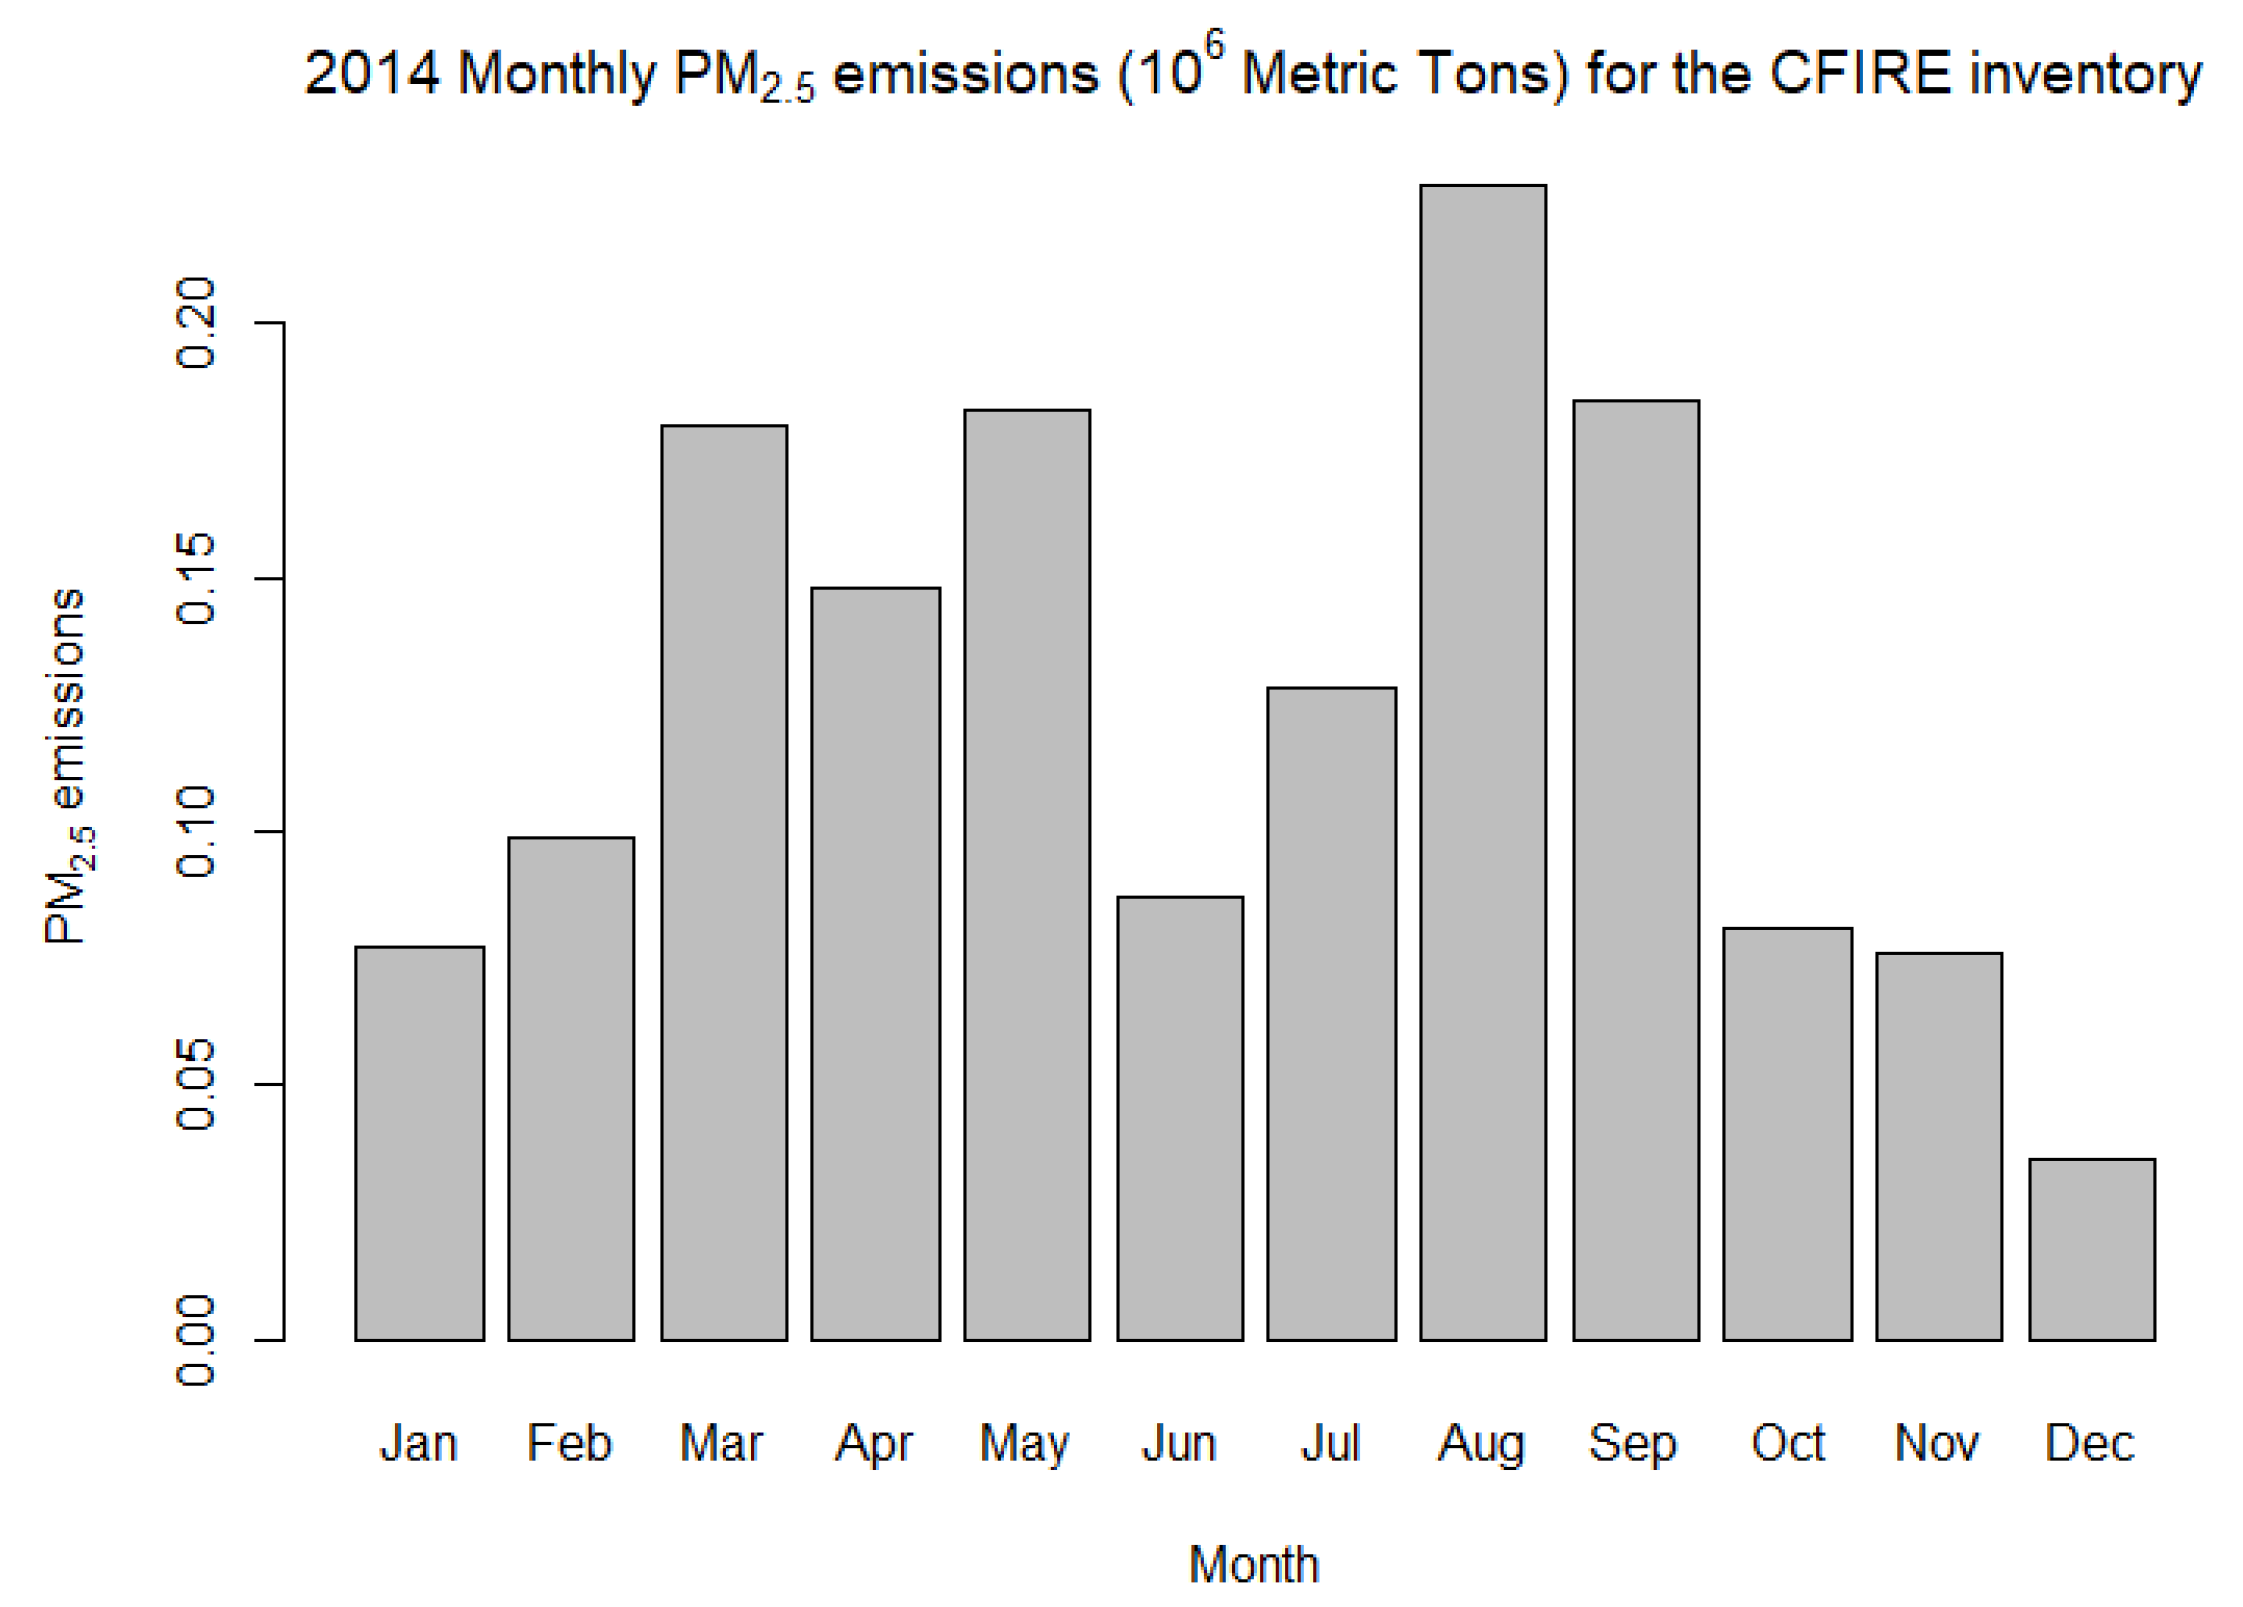
On a US national scale, CONUS, ammonia emissions from wildfires are estimated at approximately 5.4 × 10⁸ ± 3.3 × 10⁸ kg/year for 2005–2015 and the emissions of air pollutants have continued to increase. Moreover, the average annual PM2.5 emissions (both primary and secondary) from biomass burning on a US national scale emission in 2014 is approximately 1507 × 106 kg per year. In general, NH3 emissions and PM2.5 emissions (Figure 3) reach their maxima in the summer months. Summer months, in general, are dryer and warmer and are, therefore, conducive to wildland fire activities coupled with covering a larger burn area, especially in the Western US.

3. Discussion

Health outcomes in residential population: Wildfire emissions have impacts on human health. There needs to be statistical analysis of the patterns of mortality and morbidity for respiratory, cardiovascular, neurocognitive, chronic kidney, and other diseases in counties affected by wildfires using the Centers for Disease Control and Prevention wide-ranging online data for epidemiologic research (CDC WONDER) database and the Agency for Healthcare Research and Quality datafiles, by looking into the months/years when wildfires were the most active in respective regions. Using these results, researchers can develop a strategy on health data to be included in the forecasting model of wildfires to predict health outcomes in the most vulnerable population groups and to forecast the burden of diseases associated with exposures to wildfire events, both short and long term. This work also added significance for the eventual consideration of standards, other than the mass-based PM2.5 NAAQS approach.
Statistical forecasting for future wildfire emissions: The physicochemical model in Equation (1) cannot be used for forecasting future emissions, as the explanatory variables cannot be measured for active wildfires. Expensive data collection procedures (e.g., using drones) are necessary for existing scientific models for predicting wildfire emissions [18,19,20]. Furthermore, these models do not have a mechanism to learn from past wildfire data. These issues make such models impractical for forecasting emissions in real-world scenarios. Physical models of wildland fire spread have also been developed [21]. These physical models typically include equations describing combustion chemistry as well as heat transfer conservation laws. Due to the high complexity and prohibitive computational cost of running these models, their use is generally limited to research purposes. For large wildfires that burn for a long time and over a large area, the use of such models is not practically feasible.
Instead, a promising approach is to use a deep-learning-based model for spatio-temporal forecasting of future emissions from active wildfires. This can be accomplished by merging recurrent neural networks, or RNNs, with convolutional neural networks, or CNNs. RNNs enable efficient modeling of time-series data by propagating and updating information from previous time steps, using non-linear, differentiable transformations [22]. On the other hand, CNNs, which are regularized versions of multilayer perceptrons, are able to capture spatial information. CNN+RNN architectures have proven to be successful in a number of similar tasks, including precipitation forecasting [23], traffic prediction in transportation networks [24], music classification [25], and video frame prediction [26].

4. Conclusions

The research will improve our understanding of wildland fire impacts on public and environmental health and will inform public-health strategies to reduce the associated risks. Anthropogenic emissions of NOx and SO2 have declined in the U. S. during the past 20 years, as a result of the Clean Air Act and its amendments, resulting in significant improvements in air quality. However, the increase in wildfire frequency and intensity threatens to reverse these achieved gains, especially in emissions of ammonia and PM2.5. The exposure of PM2.5 and other wildfire air contaminants associated with wildfire on respiratory, cardiovascular, and other disease-specific impacts will provide information that can be used by local healthcare and public-health specialists to target vulnerable groups.

Author Contributions

Conceptualization, S.S. and V.P.A.; Writing, S.S., V.P.A. and J.K. All authors have read and agreed to the published version of the manuscript.

Funding

This research was funded by NCSU Center for Human Health and the Environment, grant #ES025128.

Data Availability Statement

All data reported in this paper are taken from previous studies as cited in the figure captions.

Acknowledgments

We would like to thank Swarnali Sanyal, University of Illinois at Urbana-Champaign, for helpful discussions.

Conflicts of Interest

The authors declare no conflict of interest.

References

  1. Reid, C.E.; Maestas, M.M. Wildfire smoke exposure under climate change: Impact on respiratory health of affected communities. Curr. Opin. Pulm. Med. 2019, 25, 179. [Google Scholar] [CrossRef] [PubMed]
  2. Matz, C.J.; Egyed, M.; Xi, G.; Racine, J.; Pavlovic, R.; Rittmaster, R.; Henderson, S.B.; Stieb, D.M. Health impact analysis of PM2.5 from wildfire smoke in Canada (2013–2015, 2017–2018). Sci. Total Environ. 2020, 725, 138506. [Google Scholar] [CrossRef] [PubMed]
  3. Aguilera, R.; Corringham, T.; Gershunov, A.; Benmarhnia, T. Wildfire smoke impacts respiratory health more than fine particles from other sources: Observational evidence from Southern California. Nat. Commun. 2021, 12, 1493. [Google Scholar] [CrossRef] [PubMed]
  4. Finlay, S.E.; Moffat, A.; Gazzard, R.; Baker, D.; Murray, V. Health impacts of wildfires. PLoS Curr. 2012, 4, e4f959951cce2c. [Google Scholar] [CrossRef]
  5. Martin, K.L.; Hanigan, I.C.; Morgan, G.G.; Henderson, S.B.; Johnston, F.H. Air pollution from bushfires and their association with hospital admissions in Sydney, Newcastle and Wollongong, Australia 1994–2007. Aust. N. Z. J. Public Health 2013, 37, 238–243. [Google Scholar] [CrossRef]
  6. Chen, H.; Samet, J.M.; Bromberg, P.A.; Tong, H. Cardiovascular health impacts of wildfire smoke exposure. Part. Fibre Toxicol. 2021, 18, 2. [Google Scholar] [CrossRef]
  7. Liu, J.C.; Pereira, G.; Uhl, S.A.; Bravo, M.A.; Bell, M.L. A systematic review of the physical health impacts from non-occupational exposure to wildfire smoke. Environ. Res. 2015, 136, 120–132. [Google Scholar] [CrossRef]
  8. Bray, C.D.; Battye, W.; Aneja, V.P.; Tong, D.Q.; Lee, P.; Tang, Y. Ammonia emissions from biomass burning in the continental United States. Atmos. Environ. 2018, 187, 50–61. [Google Scholar]
  9. Oliveras, I.; Anderson, L.O.; Malhi, Y. Application of remote sensing to understanding fire regimes and biomass burning emissions of the tropical Andes. Glob. Biogeochem. Cycles 2014, 28, 480–496. [Google Scholar] [CrossRef]
  10. Wiedinmyer, C.; Quayle, B.; Geron, C.; Belote, A.; McKenzie, D.; Zhang, X.; O’Neill, S.; Wynne, K.K. Estimating emissions from fires in North America for air quality modeling. Atmos. Environ. 2006, 40, 3419–3432. [Google Scholar] [CrossRef]
  11. Wiedinmyer, C.; Akagi, S.K.; Yokelson, R.J.; Emmons, L.K.; Al-Saadi, J.A.; Orlando, J.J.; Soja, A.J. The Fire INventory from NCAR (FINN): A high resolution global model to estimate the emissions from open burning. Geosci. Model Dev. 2011, 4, 625–641. [Google Scholar] [CrossRef]
  12. Friedl, M.A.; Sulla-Menashe, D.; Tan, B.; Schneider, A.; Ramankutty, N.; Sibley, A.; Huang, X. MODIS Collection 5 global land cover: Algorithm refinements and characterization of new datasets. Remote Sens. Environ. 2010, 114, 168–182. [Google Scholar] [CrossRef]
  13. Giglio, L.; Justice, C.; Boschetti, L.; Roy, D. MCD64A1 MODIS/Terra+Aqua Burned Area Monthly L3 Global 500 m SIN Grid V006 (dataset). NASA EOSDIS Land Processes DAAC. 2015. Available online: https://doi.org/10.5067/MODIS/MCD64A1.006 (accessed on 12 January 2019).
  14. Ito, A.; Penner, J.E. Global estimates of biomass burning emissions based on satellite imagery for the year 2000. J. Geophys. Res. Atmos. 2004, 109, D14. [Google Scholar] [CrossRef]
  15. Bray, C.D.; Battye, W.H.; Aneja, V.P.; Schlesinger, W.H. Global emissions of NH3, NOx, and N2O from biomass burning and the impact of climate change. J. Air Waste Manag. Assoc. 2021, 71, 102–114. [Google Scholar] [CrossRef] [PubMed]
  16. Akdemir, E.A.; Battye, W.H.; Myers, C.B.; Aneja, V.P. Estimating NH 3 and PM 2.5 emissions from the Australia mega wildfires and the impact of plume transport on air quality in Australia and New Zealand. Environ. Sci. Atmos. 2022, 2, 634–646. [Google Scholar] [CrossRef]
  17. Larkin, N.K.; Raffuse, S.M.; Huang, S.; Pavlovic, N.; Lahm, P.; Rao, V. The comprehensive fire information reconciled emissions (CFIRE) inventory: Wildland fire emissions developed for the 2011 and 2014 US National Emissions Inventory. J. Air Waste Manag. Assoc. 2020, 70, 1165–1185. [Google Scholar] [CrossRef]
  18. Finney, M.A. FARSITE, Fire Area Simulator—Model Development and Evaluation; US Department of Agriculture, Forest Service, Rocky Mountain Research Station: Ogden, UT, USA, 1998.
  19. Forghani, A.; Cechet, B.; Radke, J.; Finney, M.; Butler, B. Applying fire spread simulation over two study sites in California lessons learned and future plans. In Proceedings of the2007 IEEE International Geoscience and Remote Sensing Symposium, Barcelona, Spain, 23–27 July 2007; pp. 3008–3013. [Google Scholar]
  20. Lin, Z.; Liu, H.H.; Wotton, M. Kalman filter-based large-scale wildfire monitoring with a system of UAVs. IEEE Trans. Ind. Electron. 2018, 66, 606–615. [Google Scholar] [CrossRef]
  21. Sullivan, A.L. Wildland surface fire spread modelling, 1990–2007. 1: Physical and quasi-physical models. Int. J. Wildland Fire 2009, 18, 349–368. [Google Scholar] [CrossRef]
  22. Boden, M. A guide to recurrent neural networks and backpropagation. Dallas Proj. 2002, 2, 1–10. [Google Scholar]
  23. Shi, X.; Chen, Z.; Wang, H.; Yeung, D.Y.; Wong, W.K.; Woo, W.C. Convolutional LSTM network: A machine learning approach for precipitation nowcasting. Adv. Neural Inf. Process. Syst. 2015, 28, 802–810. [Google Scholar]
  24. Yu, H.; Wu, Z.; Wang, S.; Wang, Y.; Ma, X. Spatiotemporal recurrent convolutional networks for traffic prediction in transportation networks. Sensors 2017, 17, 1501. [Google Scholar] [CrossRef] [PubMed]
  25. Choi, K.; Fazekas, G.; Sandler, M.; Cho, K. Convolutional recurrent neural networks for music classification. In Proceedings of the 2017 IEEE International Conference on Acoustics, Speech and Signal Processing (ICASSP), New Orleans, LA, USA, 5 March 2017; pp. 2392–2396. [Google Scholar]
  26. Hosseini, M.; Maida, A.S.; Hosseini, M.; Raju, G. Inception-inspired lstm for next-frame video prediction. arXiv 2019, arXiv:1909.05622. [Google Scholar]
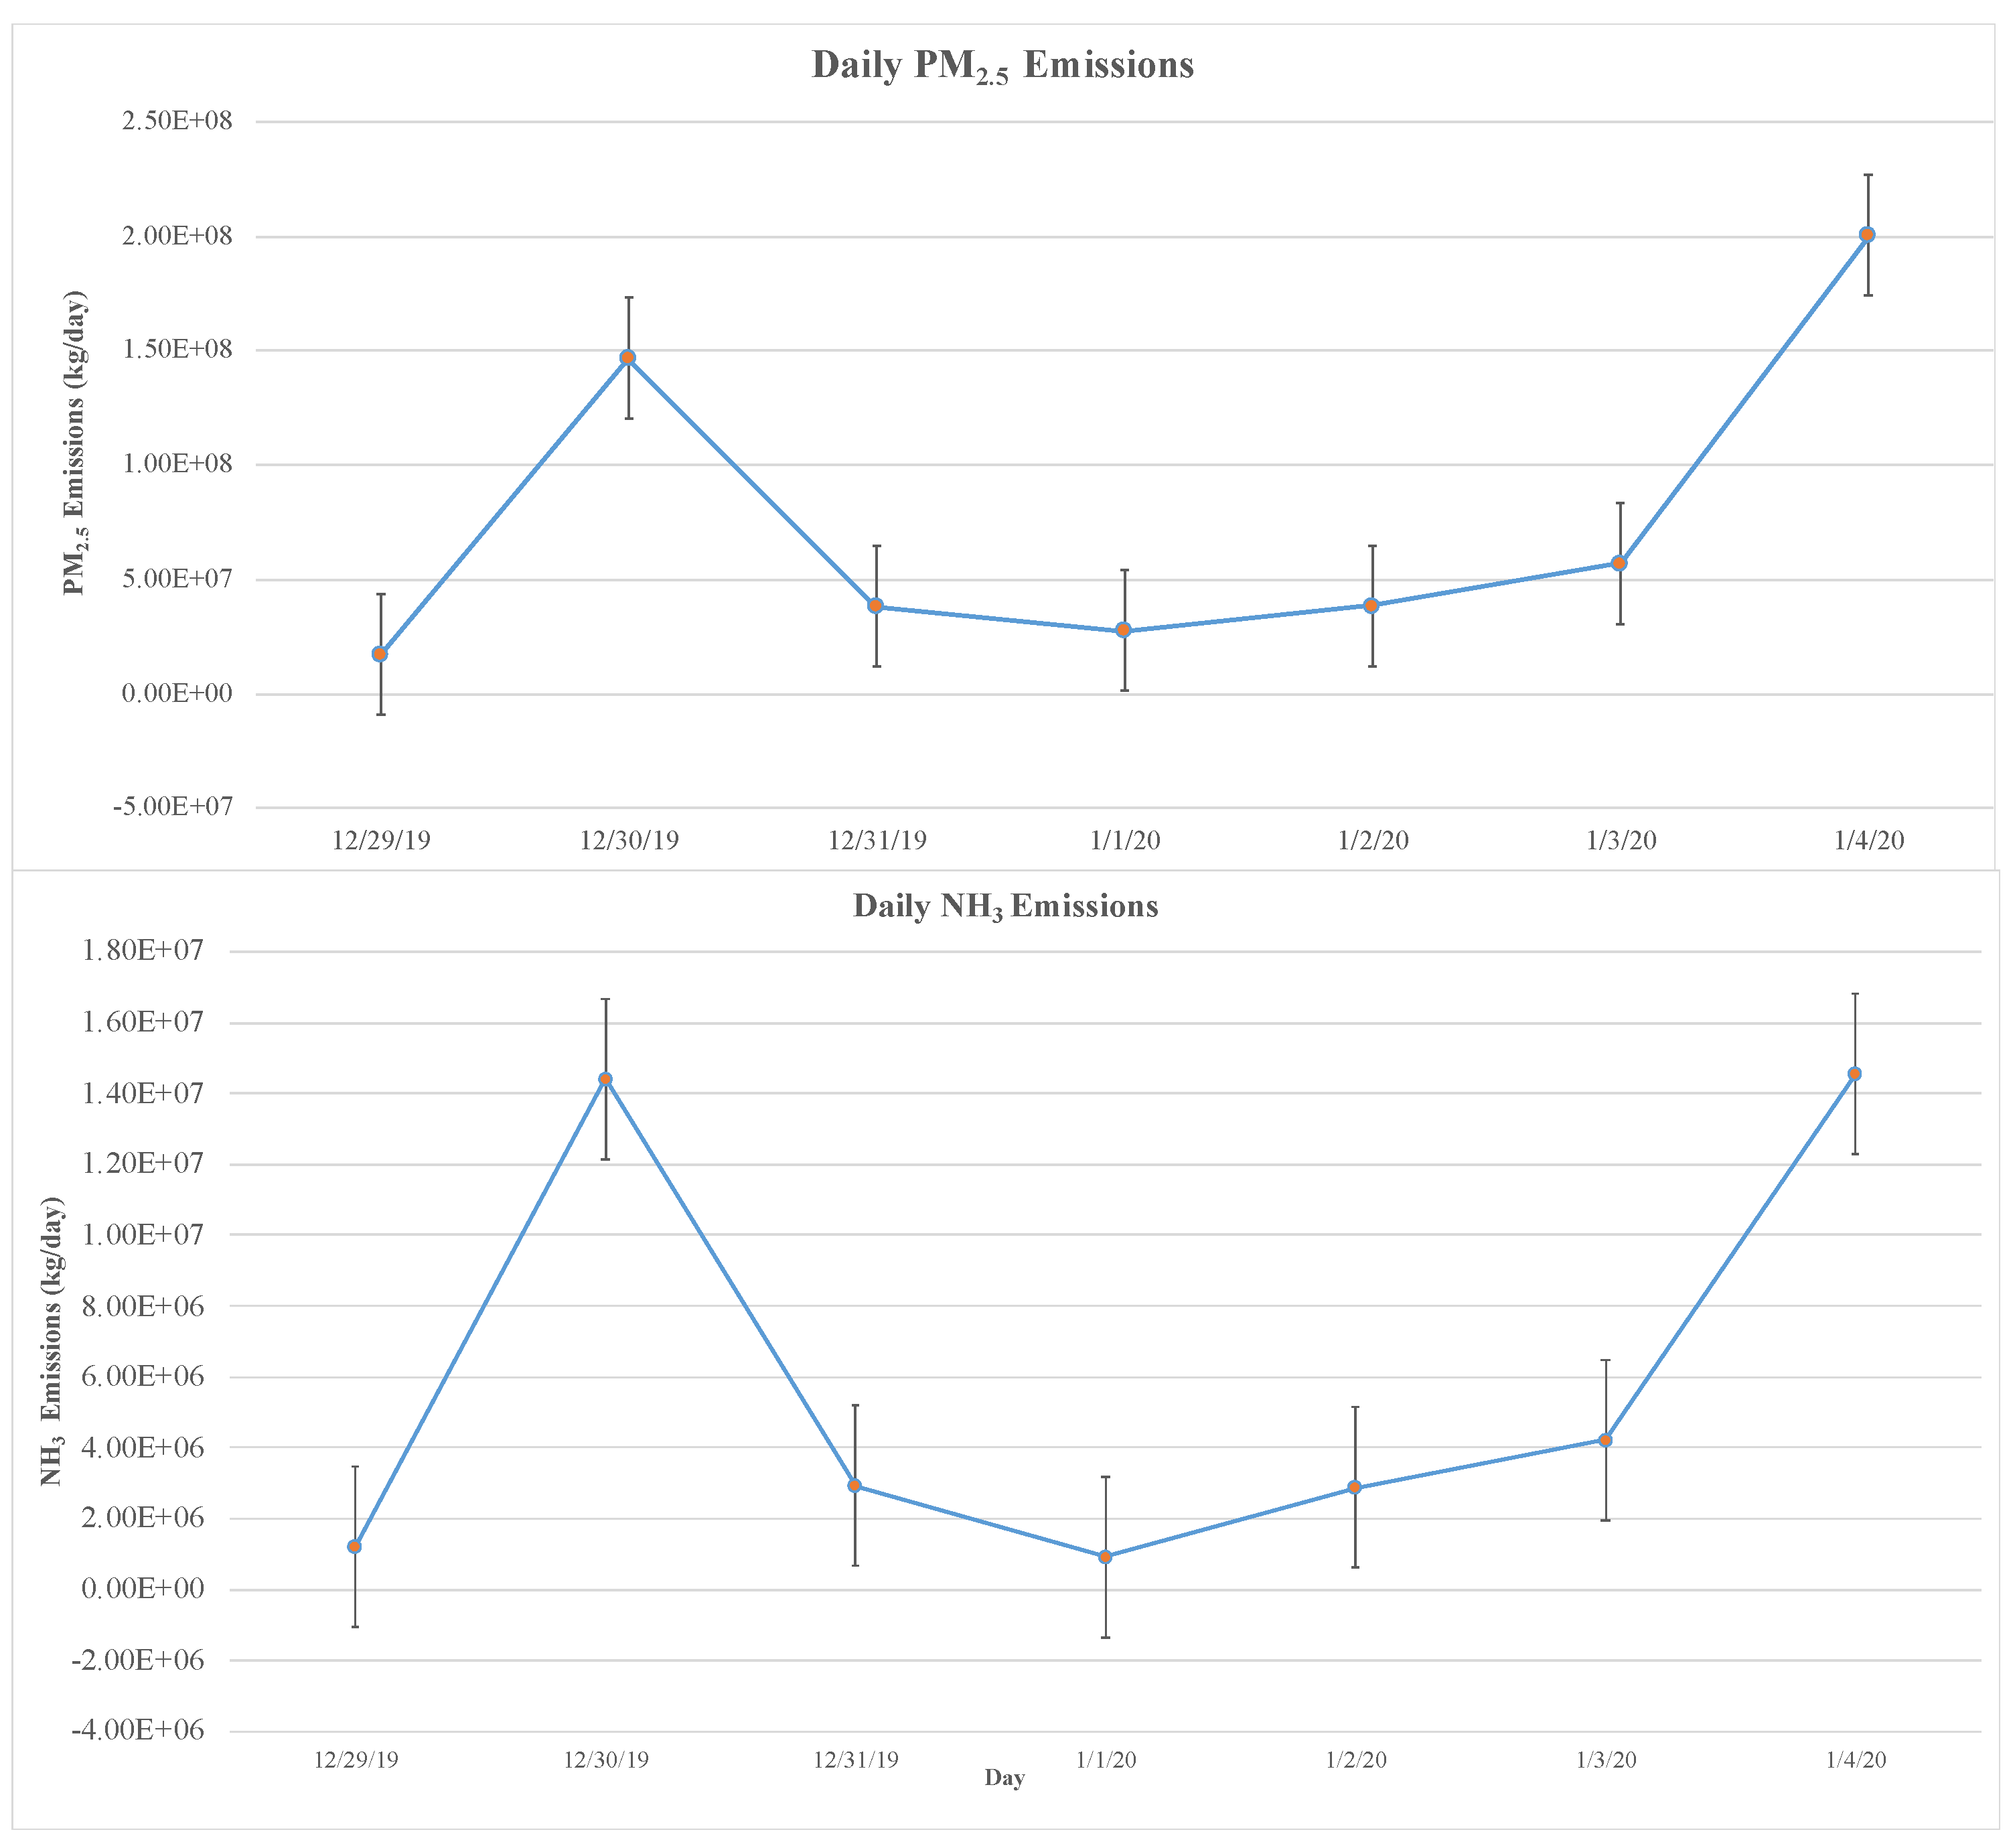
Figure 1. Daily PM2.5 emissions and NH3 emissions in Southeast Australia during (29 December 2019–4 January 2020). The circles represent PM2.5 and NH3 emissions as kg per day. The black vertical bars in the figure represent ± 1SD. (Source: [16]).
Environsciproc 19 00059 g001
Figure 2. Daily NH3 vs PM2.5 emissions in Southeast Australia during the study period (source: [16]). Linear equation: y = 8.94x × 106 + 11.62x with Adjusted R-squared: 0.95.
Environsciproc 19 00059 g002
Figure 3. Monthly PM2.5 emissions (wildfire + prescribed burn) for the CFIRE inventory (source: [17]). Total emissions in 2014 were approximately 1507 × 106 kg per year.
Environsciproc 19 00059 g003
Publisher’s Note: MDPI stays neutral with regard to jurisdictional claims in published maps and institutional affiliations.