Abstract
This research aims to understand the temporal variation of concentrations of equivalent black carbon (eBC) and to calculate the fossil fuel (BCff) and biomass combustion (BCwb) contribution to eBC during the 2020 autumn season. In-situ measurements of eBC and NO2 were performed for this aim in Sale, Morocco. The contribution of BCff and BCwb was assigned based on the spectrum dependence of BC absorption. The average eBC concentration was 1.9 ± 2.2 µg/m3 with a contribution of 13% for BCwb. The eBC was strongly correlated with NO2 (R2 = 0.63). Fossil fuel combustion is the most significant contributor to eBC and NO2 concentrations.
1. Introduction
Air pollution, mainly from traffic combustion processes, is a serious environmental problem in Salé, the second densest city in Morocco (8163 hab/km2), as in other major urban areas worldwide. Air pollution in cities leads to increased atmospheric concentrations of combustion products such as nitrogen dioxide (NO2) and particulate matter (PM). The latter includes primary particles generated by combustion, secondary particles, and mineral dust particles. Black carbon (BC) is identified as a large amount of carbonaceous aerosols, and consequently, the fine PM2.5 [1] comes mainly from the combustion of fossil fuels and biomass [2].
Studies [3,4] stated that BC concentrations are proportional to traffic emissions, which allows inferring BC levels from traffic. However, the contribution of biomass-burning activities may affect both the daily cycles of BC and the BC/NO2 ratios.
Among the methods of apportionment techniques based on observation, the aethalometer model has been adopted in different studies [5,6] to assess the contributions of fossil fuel and biomass combustion to equivalent black carbon (eBC) by analyzing light absorption at multiple wavelengths.
In this context, the goal of this research is to look at the influence of biomass burning vs. fossil fuel consumption on the Salé air pollution during the 2020 autumn season.
2. Materials and Methods
2.1. Sampling Site
The Médersa of Mérinides (34°02′23.4″ N 6°49′38.5″ W) was built in 1341 JC/733 h by the mérinide sultan Abou’l Hassan, and it represents the architectural masterpiece of the medina of Salé. It offers a unique decoration including Andalusian excellence in architecture and spatial organization as shown in Figure 1. A preliminary census campaign outlined two types of anthropogenic sources of pollution that may be identified during the measurement: (1) Fixed sources implemented inside the Medina, including traditional hammams (Moroccan public bathhouses) and ovens (use of combustion wood); and (2) Mobile sources (cars, trucks, buses, motorcycles, etc.) circulating inside the city and in the surrounding area parallel to the historical wall of the medina.
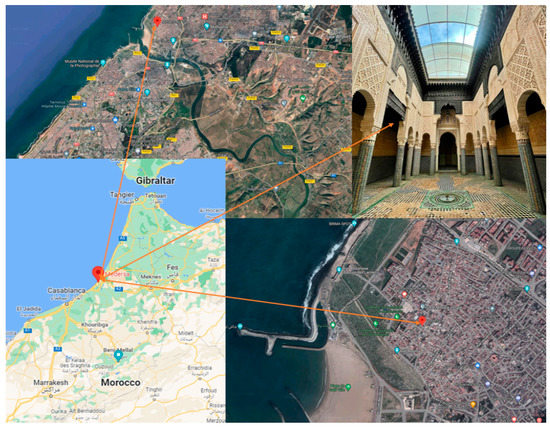
Figure 1.
Location map of the measurement site at The Médersa of Mérinides in Salé.
2.2. Data Collection
The field campaign in Salé was performed from 14 October to 27 November 2020. Black carbon continuous measurements were carried out using a multiple spectrum carbon analyzer (The BC1054 by Met One Instruments, USA) on the terraced roof of Mderssa at the height of around 12 m-agl. The BC1054 analyzer automatically measures optical transmission at ten wavelengths ranging from 370 nm to 950 nm through a filter on which particles have been deposited. The absorption at 880 nm in the near-infrared computes the equivalent black carbon (eBC) content.
ENVEA Cairpol’s low-cost electrochemical sensors were employed for continuous and high-resolution temporal NO2 monitoring. For each gas measurement, the uncertainty was on the order of +/−25 to 30%.
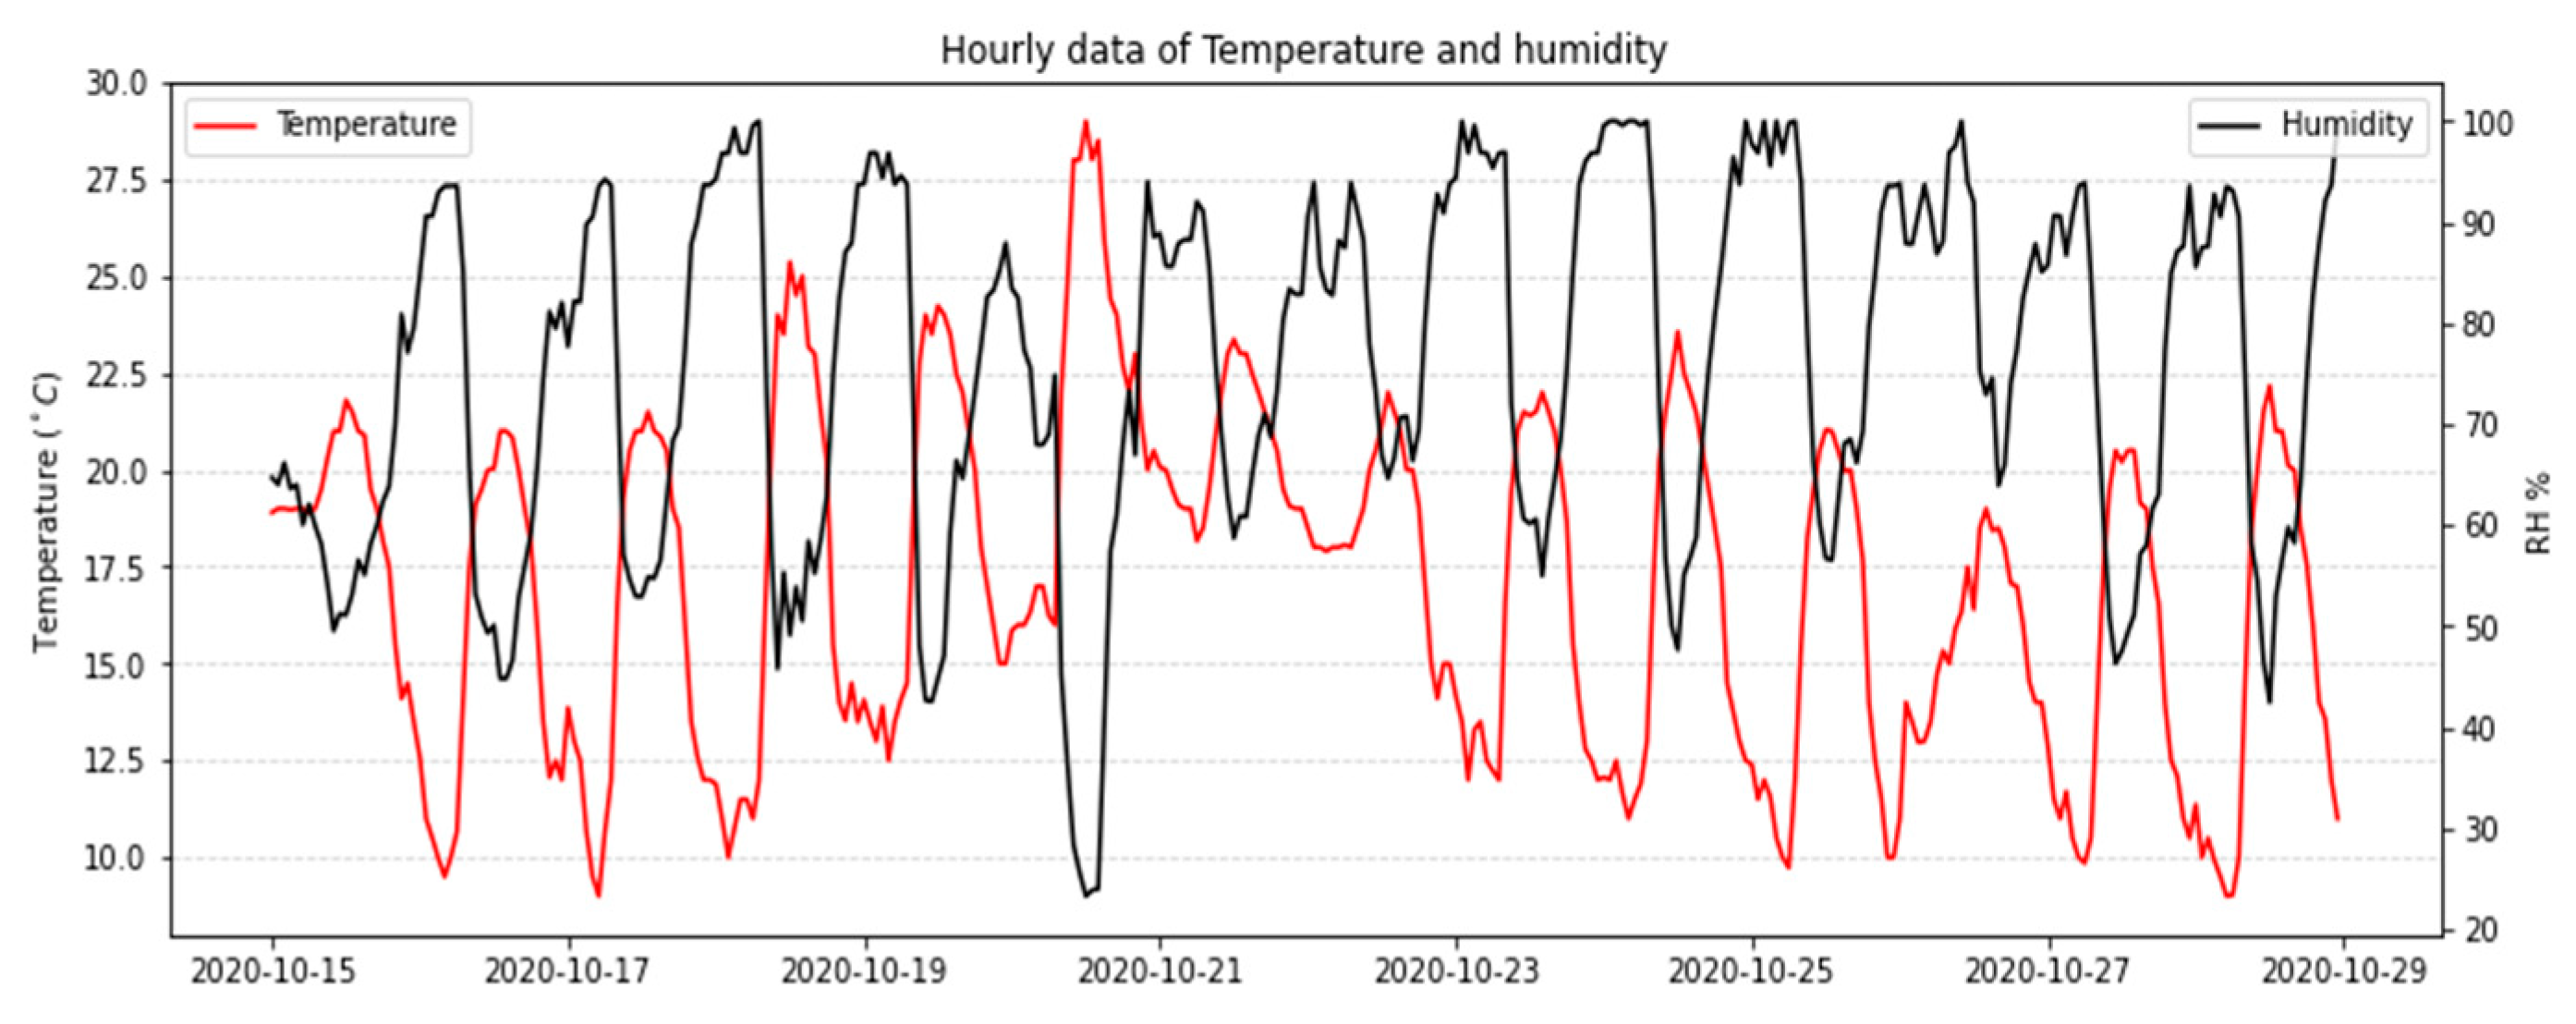
Meteorological data, such as temperatures, wind speed, and direction, were collected from the International Meteorology website (http://www.wunderground.com (accessed on 7 March 2022) and from (NOAA Air Resources Laboratory) with processing by R software [7]. Wind rose and hourly change in temperature and humidity in October and November 2020 are illustrated in Figure 2 and Figure 3, respectively.
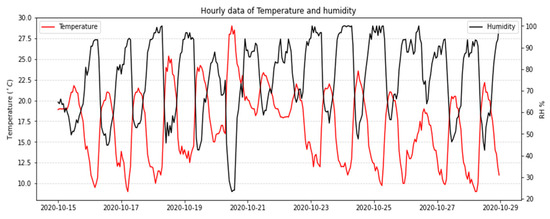
Figure 2.
Temporal variation of Hour mean temperature and relative humidity (RH) at Salé during sampling period.
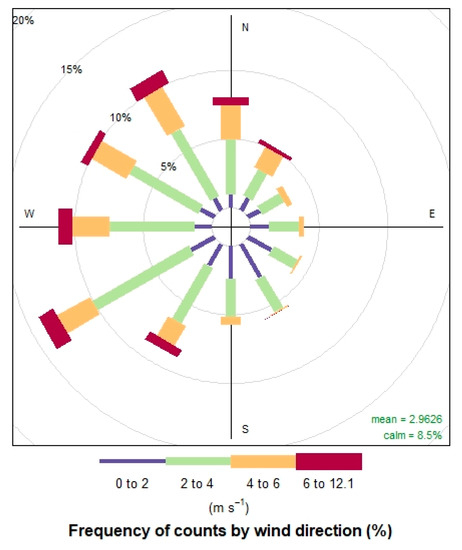
Figure 3.
Wind rose diagram at Salé during the sampling period.
3. Results and Discussion
3.1. Characteristics of eBC and NO2 Concentrations and Sources
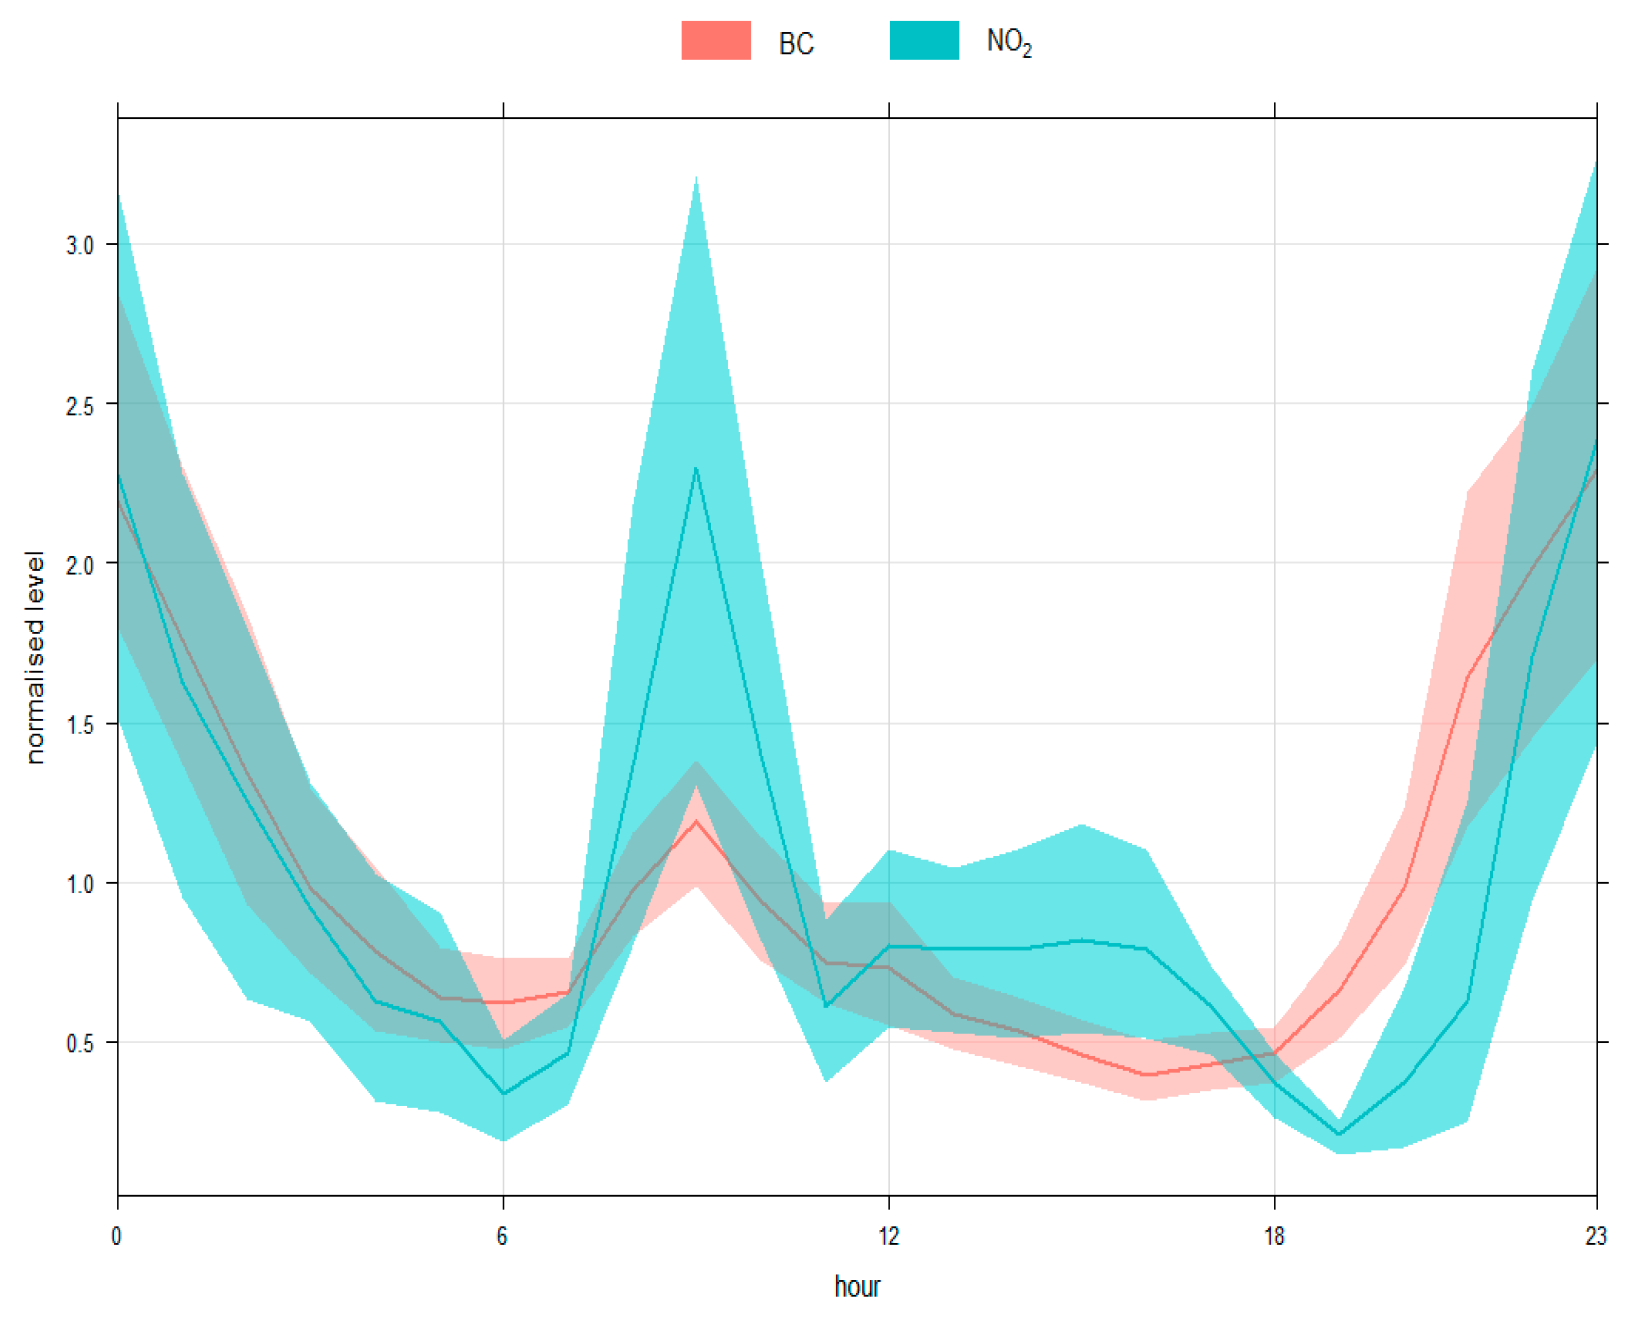
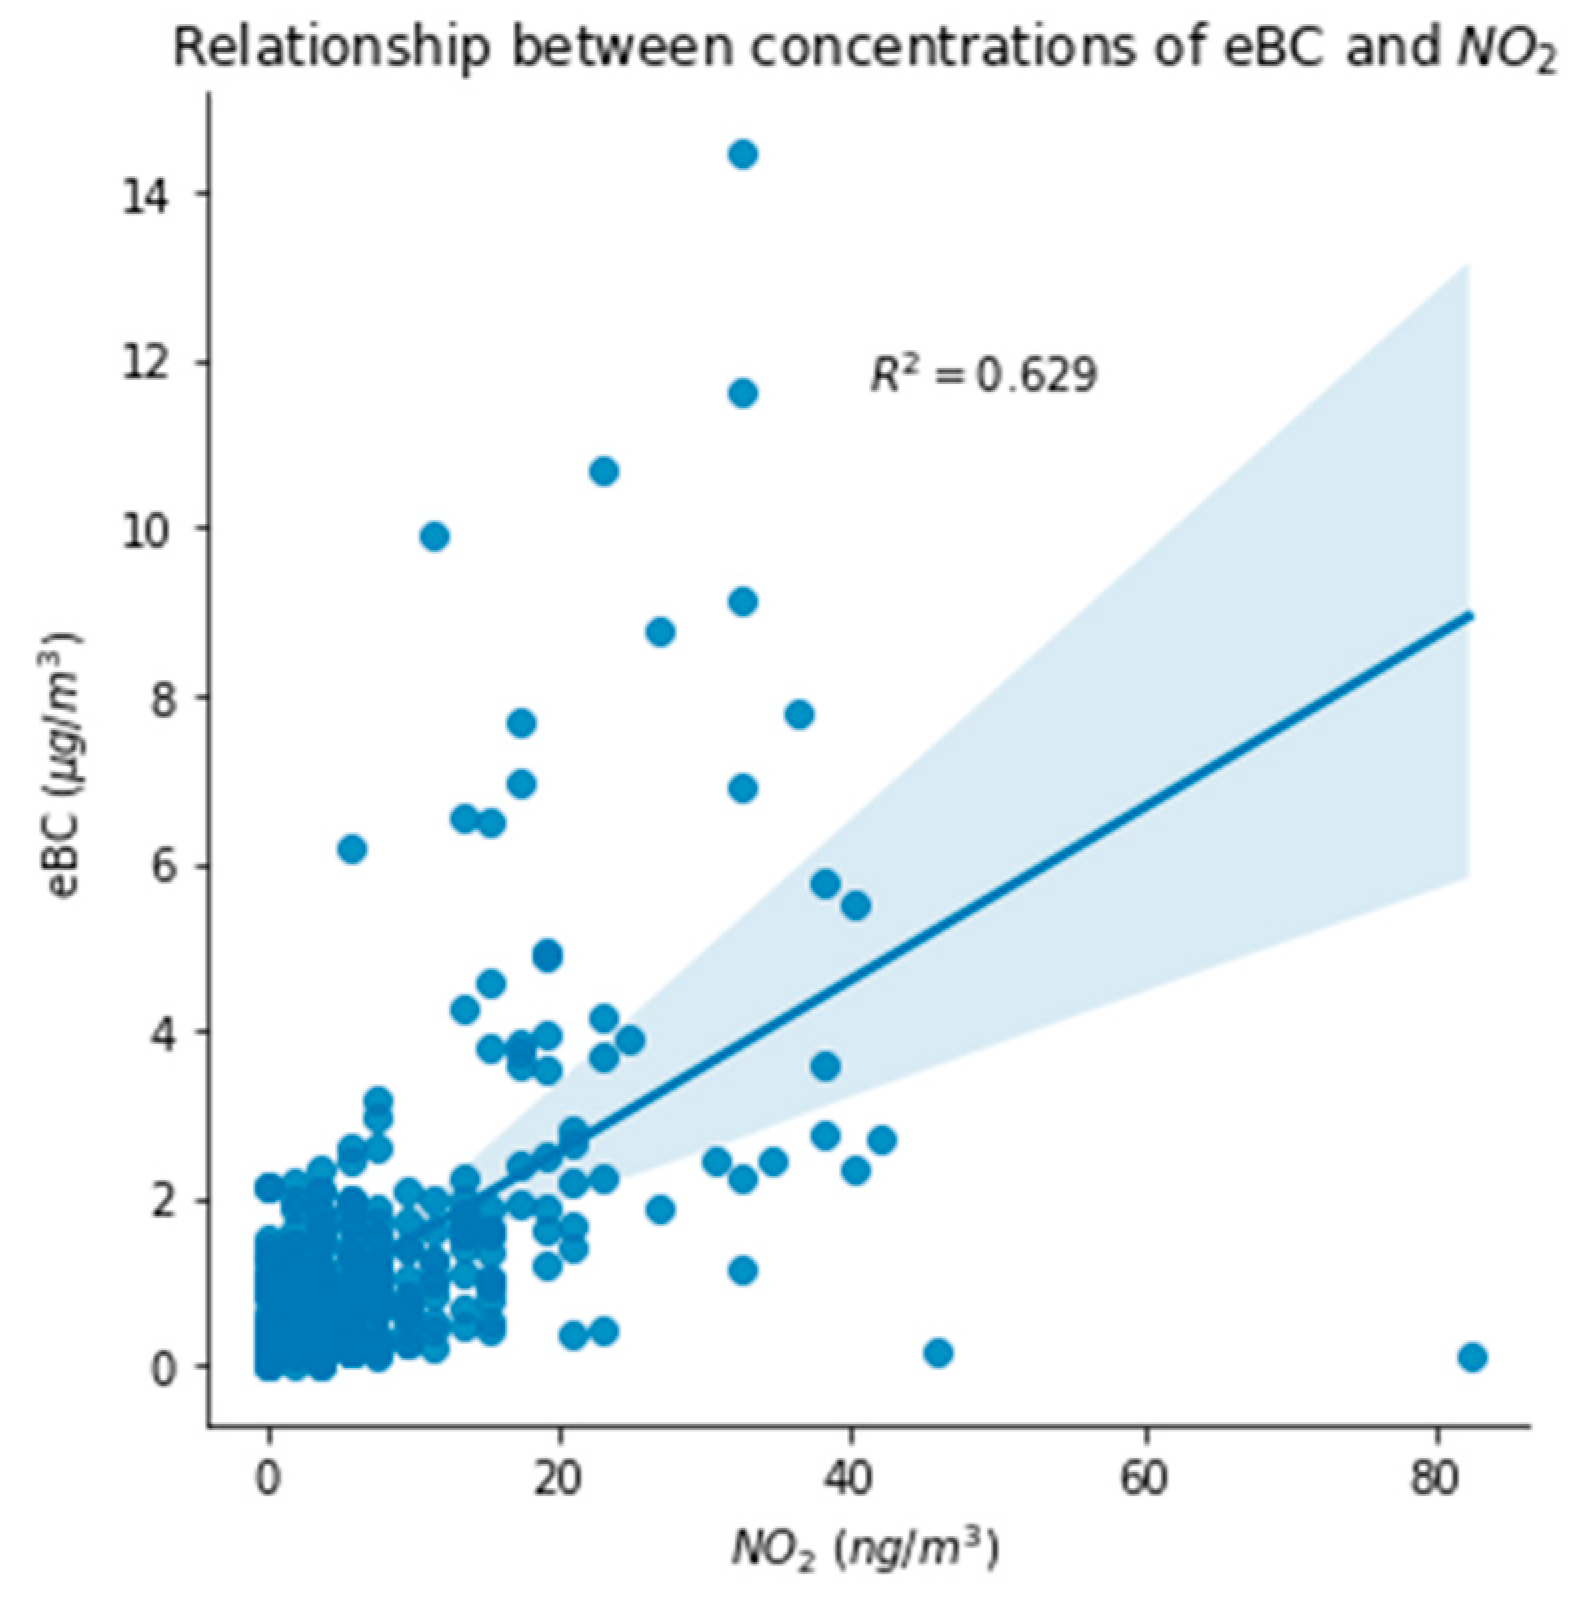
Numerous studies have shown that BC concentration is related to the site type (urban, suburban, rural, downtown) [8,9] and prevailing weather conditions [6,8]. The first method used in this study to apportion the sources of eBC is based on the correlations between eBC and traffic combustion tracer NO2. Figure 4 shows the hourly variation of BC and NO2, and Figure 5 shows their linear regression. A strong relationship between eBC and NO2 was observed during this study (R2 ≈ 0.63), close to the values reported in Malaysian (R2 = 0.71) [10] and English (R2 = 0.88) [1] suburban areas, as shown in Table 1. The ratio between eBC and NO2 is 0.17, equivalent to a value of 0.14 according to the results obtained in Doha, Qatar [2], characterizing diesel fuel. The average eBC values recorded during this study were 1.9 ± 2.2 µg/m3, which are comparable to the values recorded at an urban site in Milan, Italy (1.92 ± 0.88 µg/m3) [11] and during periods of winter biomass burning (1.89 ± 0.5 µg/m3) at residential urban areas in Kwadela, South Africa [12].

Figure 4.
Hourly mean variation of eBC and NO2.

Figure 5.
Relationship between eBC and NO2.

Table 1.
Comparison of eBC values measured in Salé and worldwide cities. The table covers the type of sites, study period, measurement techniques, and the eBC concentrations. The table is ordered according to eBC mass concentration.
The eBC pollutant rose shown in Figure 6 indicates that the highest levels of eBC concentrations are recorded when the wind speed is low (not exceeding 3 m/s) and comes from the southeast. Daily and hourly pollutant rose diagrams (not shown), show that eBC concentrations peaked at midnight (~23:00 h–00:00 h) when the winds were from the south and southeast.
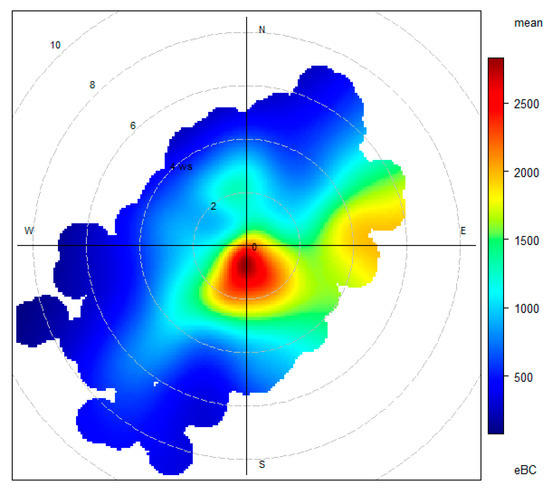
Figure 6.
Rose pollutant of eBC depicting the relationships between mean eBC concentrations (ng/m3), wind speed, and wind direction over the study period.
3.2. eBC Source Apportionment
Significant day-night variation in eBC levels was observed during the sampling period (mean night/day ratio = 1.4). This variability could be due to two processes: (a) the atmospheric boundary layer is shallower at night and retains pollutants in a smaller volume, and (b) the transport of emissions from fossil fuels produced at the local scale by the nighttime land breeze (Figure 6). A third option is the higher emissions from fossil fuels during the night (possibly due to transportation engines). To discuss these hypotheses involved in the observed eBC changes and to assess eBC source apportionment, the exponent of the absorption Ångström was used as a source-specific parameter to distinguish between wood combustion (BCwb) and fossil fuel (BCff) aerosols [17]. In this study, we used absorption Ångström exponents of 1.0 and 2.0 for pure traffic (αff) and wood burning (αwb), respectively.
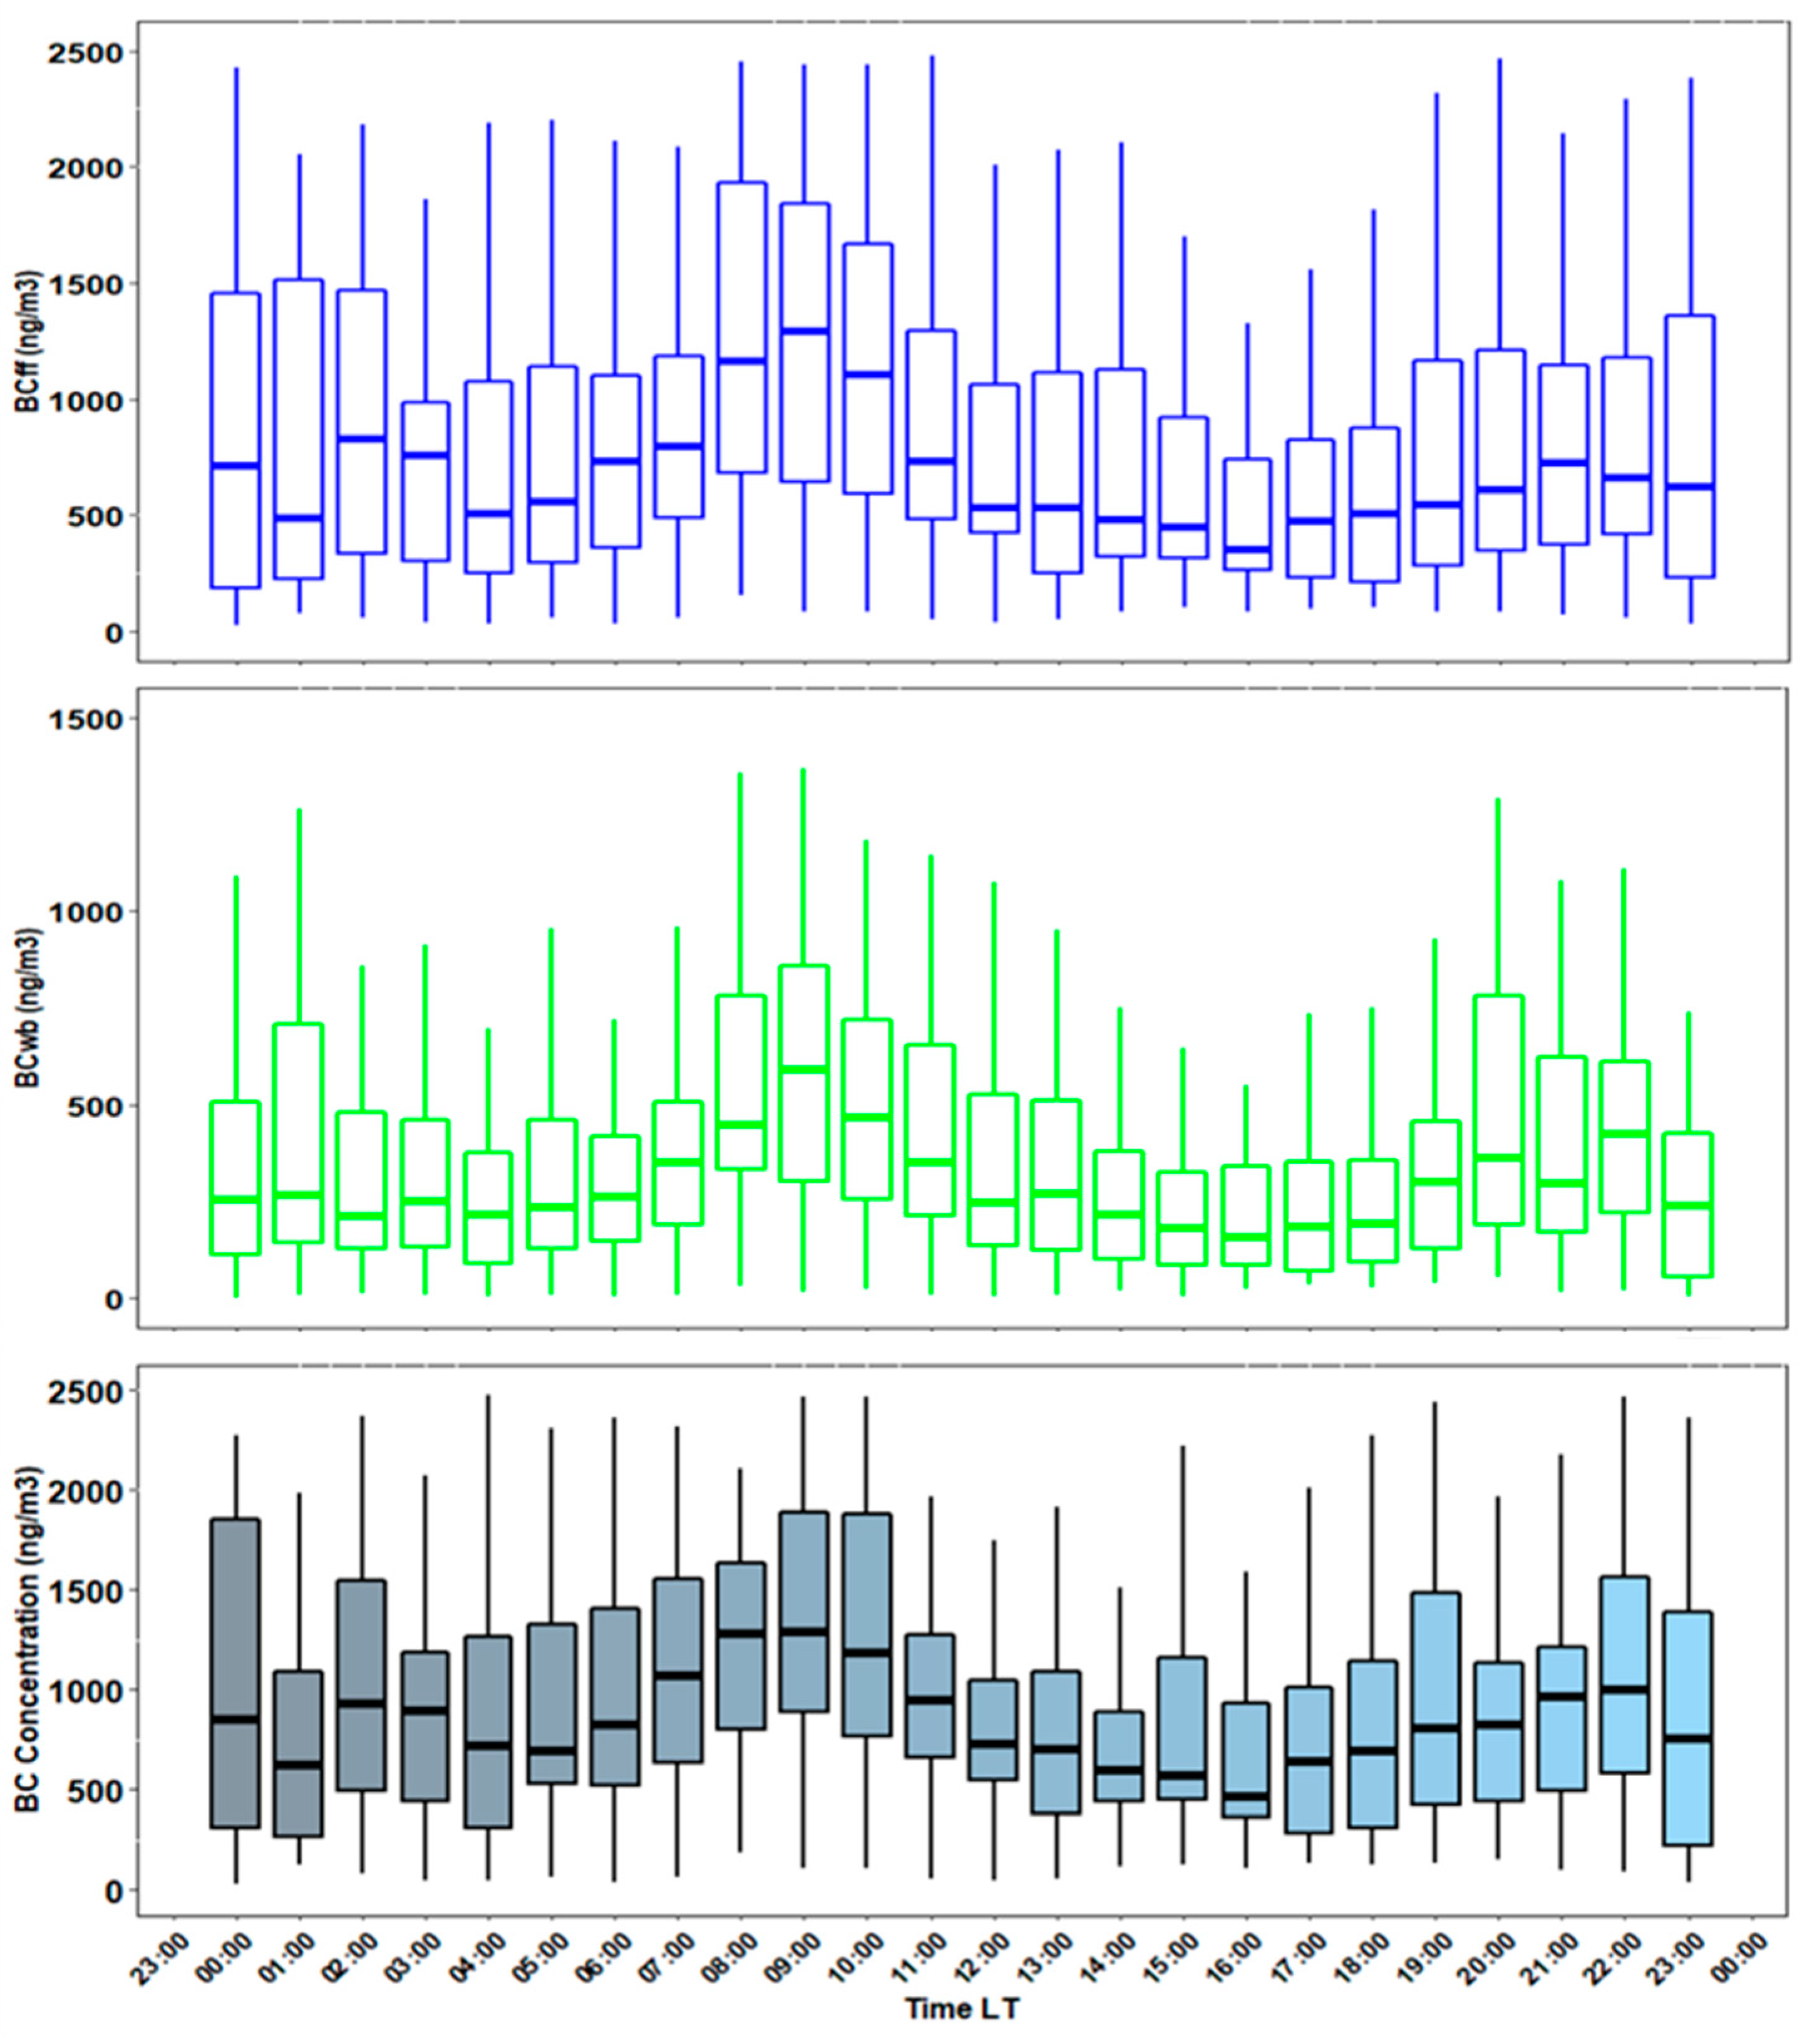
We tracked the evolution of concentrations of the eBC, BCff, and BCwb by studying their hourly changes during the period October 14 to 27 November 2020. The diurnal variations of the mean values are presented in Figure 7. Significant diurnal cycles in eBC and BCwb and BCff concentration were recorded with two peaks, around 8 a.m. and 11 p.m. For non-reactive pollutants like BC, the concentration increases at night when the boundary layer gets shallower than it is throughout the day [1]. Average eBC, BCff, and BCwb values range from 1.9 ± 2.2, 1.6 ± 2.5, and 0.25 ± 0.72 μg/m3, respectively.
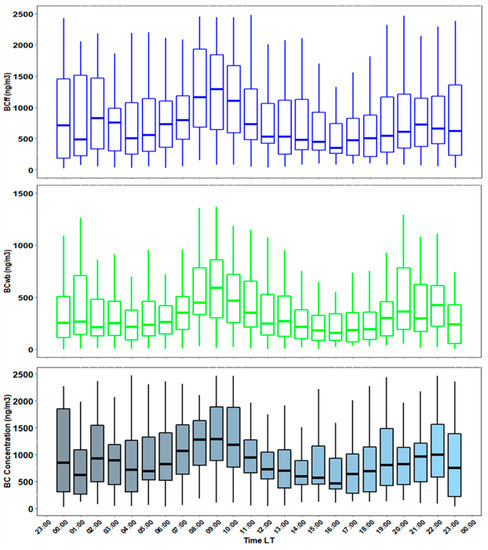
Figure 7.
The diurnal distribution of BC, BCff, and BCwb. The horizontal lines represent the medians; the limits of the boxes are the 1st and 3rd quartiles. The whiskers extend to one and a half times the interquartile range. Hours are in local time, LT.
The primary contribution to BC concentrations in this study is fossil fuel use, with more than 86%, particularly in the morning and evening hours. Although our census campaign outlined 12 ovens and eight traditional hammams within a radius of 400 m of the sampling site, biomass burning makes a non-significant contribution of about 13% to autumn-time eBC.
4. Conclusion
This study demonstrated that the concentration of black carbon comes from a large percentage of vehicle fuel combustion. The contribution of biomass burning and hammams located around the Médersa site of Salé was evaluated by 13%. The average values of eBC, BCff, and BCwb ranged from 1.9 ± 2.2, 1.6 ± 2.5, and 0.25 ± 0.72 μg/m3. It was also determined that the increase in the concentration of eBC remains local and not related to wind gusts. There is a significant correlation between eBC concentration and NO2 with a value of 0.63 and an inverse asymmetric relationship with the atmospheric boundary layer.
Author Contributions
Conceptualization, A.O. and A.B.; methodology, A.B., A.O. and A.L.; validation, All; formal analysis, A.O. and A.L.; investigation, A.O. and A.L.; resources, All; data curation, A.O.; writing—original draft preparation, A.O. and A.L.; writing—review and editing, A.B.; visualization, A.O. and A.L.; supervision, A.B. and E.M.C.; project administration, A.B. All authors have read and agreed to the published version of the manuscript.
Funding
The research received no external funding.
Institutional Review Board Statement
Not applicable.
Informed Consent Statement
Not applicable.
Data Availability Statement
Not applicable.
Conflicts of Interest
The authors declare no conflict of interest.
References
- Wyche, K.; Cordell, R.L.; Smith M, L.; Smallbone, K.L.; Lyons, P.; Hama, S.M.L.; Monks, P.S.; Staelens, J.; Hofman, J.; Stroobants, C.; et al. The spatio-temporal evolution of black carbon in the North-West European ‘air pollution hotspot’. Atmospheric Environ. 2020, 243, 117874. [Google Scholar] [CrossRef]
- Alfoldy, B.; Mahfouz, M.M.; Gregorič, A.; Ivančič, M.; Ježek, I.; Rigler, M. Atmospheric concentrations and emission ratios of black carbon and nitrogen oxides in the Arabian/Persian Gulf region. Atmospheric Environ. 2021, 256, 118451. [Google Scholar] [CrossRef]
- Isiugo, K.; Jandarov, R.; Cox, J.; Chillrud, S.; Grinshpun, S.A.; Hyttinen, M.; Yermakov, M.; Wang, J.; Ross, J.; Reponen, T. Predicting indoor concentrations of black carbon in residential environments. Atmospheric Environ. 2019, 201, 223–230. [Google Scholar] [CrossRef] [PubMed]
- Reche, C.; Querol, X.; Alastuey, A.; Viana, M.; Pey, J.; Moreno, T.; Rodríguez, S.; González, Y.; Fernández-Camacho, R.; de la Rosa, J.; et al. New considerations for PM, Black Carbon and particle number concentration for air quality monitoring across different European cities. Atmospheric Chem. Phys. 2011, 11, 6207–6227. [Google Scholar] [CrossRef]
- Deng, J.; Guo, H.; Zhang, H.; Zhu, J.; Wang, X.; Fu, P. Source apportionment of black carbon aerosols from light absorption observation and source-oriented modeling: An implication in a coastal city in China. Atmospheric Chem. Phys. 2020, 20, 14419–14435. [Google Scholar] [CrossRef]
- Mousavi, A.; Sowlat, M.H.; Lovett, C.; Rauber, M.; Szidat, S.; Boffi, R.; Borgini, A.; De Marco, C.; Ruprecht, A.A.; Sioutas, C. Source apportionment of black carbon (BC) from fossil fuel and biomass burning in metropolitan Milan, Italy. Atmospheric Environ. 2019, 203, 252–261. [Google Scholar] [CrossRef]
- R Core Team. R: A Language and Environment for Statistical Computing; R Foundation for Statistical Computing: Vienna, Austria, 2020; Available online: https://www.R-project.org/ (accessed on 1 March 2022).
- Yang, J.; Sakhvidi, M.J.Z.; de Hoogh, K.; Vienneau, D.; Siemiatyck, J.; Zins, M.; Goldberg, M.; Chen, J.; Lequy, E.; Jacquemin, B. Long-term exposure to black carbon and mortality: A 28-year follow-up of the GAZEL cohort. Environ. Int. 2021, 157, 106805. [Google Scholar] [CrossRef] [PubMed]
- Liu, B.; Ma, Y.; Gong, W.; Zhang, M.; Shi, Y. The relationship between black carbon and atmospheric boundary layer height. Atmospheric Pollut. Res. 2019, 10, 65–72. [Google Scholar] [CrossRef]
- Ezani, E.; Dhandapani, S.; Heal, M.; Praveena, S.; Khan, F.; Ramly, Z. Characteristics and Source Apportionment of Black Carbon (BC) in a Suburban Area of Klang Valley, Malaysia. Atmosphere 2021, 12, 784. [Google Scholar] [CrossRef]
- Invernizzi, G.; Ruprecht, A.; Mazza, R.; De Marco, C.; Močnik, G.; Sioutas, C.; Westerdahl, D. Measurement of black carbon concentration as an indicator of air quality benefits of traffic restriction policies within the ecopass zone in Milan, Italy. Atmospheric Environ. 2011, 45, 3522–3527. [Google Scholar] [CrossRef]
- Xulu, N.A.; Piketh, S.J.; Feig, G.T.; Lack, D.A.; Garland, R.M. Characterizing Light-absorbing Aerosols in a Low-income Settlement in South Africa. Aerosol Air Qual. Res. 2020, 20, 1812–1832. [Google Scholar] [CrossRef]
- Healy, R.M.; Wang, J.M.; Sofowote, U.; Su, Y.; Debosz, J.; Noble, M.; Munoz, A.; Jeong, C.-H.; Hilker, N.; Evans, G.J.; et al. Black carbon in the Lower Fraser Valley, British Columbia: Impact of 2017 wildfires on local air quality and aerosol optical properties. Atmospheric Environ. 2019, 217, 116976. [Google Scholar] [CrossRef]
- Cheng, Y.-H.; Huang, Y.-C.; Pipal, A.S.; Jian, M.-Y.; Liu, Z.-S. Source apportionment of black carbon using light absorption measurement and impact of biomass burning smoke on air quality over rural central Taiwan: A yearlong study. Atmospheric Pollut. Res. 2022, 13, 101264. [Google Scholar] [CrossRef]
- Helin, A.; Niemi, J.V.; Virkkula, A.; Pirjola, L.; Teinilä, K.; Backman, J.; Aurela, M.; Saarikoski, S.; Rönkkö, T.; Asmi, E.; et al. Characteristics and source apportionment of black carbon in the Helsinki metropolitan area, Finland. Atmospheric Environ. 2018, 190, 87–98. [Google Scholar] [CrossRef]
- Gatari, M.J.; Kinney, P.L.; Yan, B.; Sclar, E.; Volavka-Close, N.; Ngo, N.S.; Gaita, S.M.; Law, A.; Ndiba, P.K.; Gachanja, A.; et al. High airborne black carbon concentrations measured near roadways in Nairobi, Kenya. Transp. Res. Part D: Transp. Environ. 2019, 68, 99–109. [Google Scholar] [CrossRef]
- Shirmohammadi, F.; Sowlat, M.H.; Hasheminassab, S.; Saffari, A.; Ban-Weiss, G.; Sioutas, C. Emission rates of particle number, mass and black carbon by the Los Angeles International Airport (LAX) and its impact on air quality in Los Angeles. Atmospheric Environ. 2017, 151, 82–93. [Google Scholar] [CrossRef]


Publisher’s Note: MDPI stays neutral with regard to jurisdictional claims in published maps and institutional affiliations. |
© 2022 by the authors. Licensee MDPI, Basel, Switzerland. This article is an open access article distributed under the terms and conditions of the Creative Commons Attribution (CC BY) license (https://creativecommons.org/licenses/by/4.0/).