Abstract
The COVID-19 pandemic and the consequent containment policies have changed people’s habits, with numerous implications in all fields. The restrictions also had consequences on drinking water consumption. This work analyzes this influence in the Soccavo district of Naples (Campania), in Italy, during the two periods of the strongest restrictions: the national lockdown (11 March–3 May) and the autumn red zone (16 November–6 December) in 2020. Thanks to a smart water grid acquisition system, the analysis of a large amount of data measured in the years 2019 (considered the average reference year) and 2020 was carried out. Data of the same meters in the two consecutive years were preliminarily filtered by identification and elimination of anomalies and outliers, as well as of anomalous annual patterns, through clustering and classification. The comparison was performed for the two years considering the daily and weekly average hourly patterns; the average daily patterns of midweek days, Saturdays, and Sundays, respectively; and the total daily volumes. The results showed a general increase in residential water consumption and a modification in usage patterns as a consequence of the COVID-19 pandemic containment measures.
1. Introduction
1.1. Aim of the Research
In order to limit the spread of the pandemic, starting from 11 March 2020, when COVID-19 was defined as a pandemic by the WHO, most of the world’s countries implemented lockdown policies consisting of limiting all non-essential activities and to oblige the population, as far as possible, to stay at home. In particular, in Italy, from 11 March to 3 May, a national lockdown was established, which imposed the closure of all retail commercial activities and catering services, the suspension of all educational activities of all levels, and a ban on leaving one’s own municipality except for proven work reasons of absolute urgency or health needs. This emergency situation has obviously changed the habits and customs of the population, with consequences in all sectors of society.
The second wave in autumn led the Campania region to again tighten the measures with respect to the national easing, establishing the red zone in the period from 15 November to 6 December 2020, with some changes in the restrictions compared with the first lockdown, but with the substantial closure of the main activities considered non-essential (commercial, educational, and leisure), the prohibition of travel outside the municipality of residence if not necessary, and the curfew from 10 p.m. to 5 a.m.
The aim of the present research work is to understand the changes in water demand profiles of users caused by the pandemic, tracking the effect of the different restriction levels imposed during 2020. Specifically, this work analyzes the influence of the restrictions on residential drinking water consumption in the Soccavo district of Naples (Campania), in Italy.
The comparison of a large amount of data measured through a smart water network (SWN) acquisition system in the years 2019 (considered the average reference year) and 2020 was performed: the data were preliminarily filtered by identifying and eliminating anomalies and outliers and, subsequently, subjected to clustering and classification processes, with the aim of excluding anomalous annual patterns. In order to be able to examine the same population, the same meters were selected in the two consecutive years. In accordance with the existing literature, to verify user behavior during lockdown periods, the average daily and weekly hourly patterns were obtained, identifying, in addition to the average daily pattern over the entire period, the average daily patterns of midweek days, Saturdays, and Sundays. Finally, the total daily volumes were analyzed to verify the eventual change in water consumption during restriction times.
1.2. Water Demand
The water demand in an urban context is extremely variable and depends on multiple causes, such as socio-economic factors, water cost, climate, geographical conditions, air temperature, and rainfall. It changes from user to user based on the following: lifestyle habits, conditions of the water distribution system, and house composition. Lastly, the water demand of the individual user varies during the days, weeks, and seasons, and is different on weekdays and holidays, day and night hours, and hot and cold seasons.
Drinking water demand in an urban environment is made of two components:
- Domestic consumption, i.e., physiological demand, for food preparation, personal and stuff washing, and any external use [1];
- Collective consumption, consisting of public consumption (schools, hospitals, public buildings in general, sports centers, fountains, parks, and so on) and commercial consumption (shops, supermarkets, hotels, restaurants, car washes, construction sites, industrial uses included in the urban context, and so on).
In recent decades, water demand has become a central topic of European policies and directives, with the aim of guaranteeing the population safe access to drinking water and the use of basic sanitation. The modeling of drinking water demand is crucial for efficient water management in an urban context. It allows water companies to correctly plan water supply; to estimate losses in the distribution network; and to develop criteria, innovative approaches, and attractive plans for users [2]. This interest has led to the implementation of SWNs, which allow for the recording (smart metering) and storage of water flow data of a significant portion of consumers. From the raw data, it is easy to obtain other information, such as the total daily volume, minimum hourly flow, and monthly and average daily flow rates, among others. Moreover, the projection of water demand in distribution systems in the short, medium, and long term is of fundamental importance.
1.3. Literature Analysis of Previous Studies on the Effect of COVID on Water Demand
COVID-19 has significantly affected the daily use of water by end users. The literature offers different studies on the relationship between COVID-19 and water demand. An interesting review was published by Cahill et al. [3].
A quantitative study on the increase in water volumes of the individual users compared with the pre-pandemic period was conducted in Bangladesh [4]. A study carried out in Poland [5] uses clustering to identify daily patterns of water needs, showing, in the period of the pandemic compared with previous times, an increased use of water between 2 and 4 p.m., a decrease in evening consumption, a shift in the morning peak from 7 to 9 a.m. during working days, and an increase in the consumed water volumes. A British study [6] identifies four patterns of daily hourly consumption that do not vary with the lockdown, whereas the percentage of homes present in clusters and the average daily consumption changed (+46%). Another work promoted by the Santa Catarina State University [7] analyzes consumption data from the city of Joinville in southern Brazil for residential, commercial, public, and industrial uses, showing a sharp decrease in consumption in the industrial (−53%), commercial (−42%), and public (−30%) sectors, linked to the suspension of all non-essential activities, as opposed to an increase of 11% for residential consumption and a 17% decrease in total city consumption during the COVID-19 lockdown period. Research conducted in Germany [8] also notes an increase (+14.3%) in drinking water consumption in the first wave of the pandemic throughout the day, compared with the same period in previous years, and one shift of the morning peak from 7 to 9 a.m. The article also investigates, through the results produced by a previous study [9], the possible causes of this increase in consumption; that is, time (the change in time of the use of services), place (the use of services, located exclusively in the home), intensity (the fear of contagion, with a consequent greater care for personal and home hygiene, as well as the increase in recreational activities), efficiency (the consumption of water in the workplace is lower than at home, as it is spread over more people), new activities during the lockdown (e.g., gardening), and persistence (identifies the permanence of the new habits, once the emergency is over). An analysis carried out on a complex of 280 houses in Cornwall, England [10] revealed a total increase of 17% in water consumption. Another study [11] deals with the tourism–water demand nexus for the city of Liege, which has more outgoing tourists than incoming ones in summer, when journeys intensify. In 2020, the city underwent an increase in demand compared with 2019, unlike cities that had strong incoming tourism, which showed a decrease in water demand. A study conducted by the University of Bari [12] deals with the data of five cities in Puglia in the periods between 1 January and 30 April of the years 2019 and 2020, which showed the shift of the peak and a stronger impact of the lockdown for large cities than for small ones. Another Italian study [13], on data from the Rovigo city, showed a 18% increase in domestic consumption, with a delay of the morning peak of about 2–3 h. In the city of Dubai, in the United Arab Emirates [14], it was found that daily consumption during lockdown periods increased in all apartment complexes, except those with predominantly foreign residents, thus highlighting that the type of user affects the demand. A Serbian study [15] analyzed domestic drinking consumption according to the age of the inhabitants, noting that, in the houses where elderly people live, there was a greater consumption of water. Similarly, in California [16], the greatest increase was observed in houses with children. Finally, some studies have analyzed the influence of anomalous phenomena. In particular, Li et al. [17] compared urban water consumption data from Southern and Northern California; in the North, residential water consumption was at its peak during the lockdown, whereas in the South, there was an increase in rainfall of 267% in April 2020, compared with the average of the previous 30 years, which resulted in an overall decrease in water consumption.
In conclusion, from the analysis of the bibliography consulted, it emerges that the containment measures of the COVID-19 pandemic have generated the following:
- An increase in residential consumption;
- A decrease in industrial, commercial, and public consumption;
- A shift of the morning peak of 2–2.5 h on midweek days;
- A decrease in the evening peak;
- An increase in consumption due to the absence of departures for holidays;
- A decrease in consumption due to the absence of incoming tourism.
2. Materials and Methods
The data processed in this work derive from the SWN created for the Soccavo district of Naples as part of the larger “waterGRID” project, developed in collaboration by the Special Company ABC—Acqua Bene Comune di Napoli, DICEA (Department of Civil, Architectural and Environmental Engineering) of the University ”Federico II” of Naples, and IBM—International Business Machines Corporation Italy.
The Soccavo macro-area, in the western peripheral area of the municipality of Naples, is approximately 3.7 km2. Details about the administrative, technical, and hydraulic features of the district are well described by [2,17].
The annual flow data of all the meters from 1 January 2019 to 31 December 2020 were provided by the smart metering, collected on an hourly basis. The remote reading system allows for all meters, through a radio module they are equipped with, to transmit the twenty-four hourly flow rates and all eventual daily alarms. The daily data are transmitted from the radio modules to a collector, which stores them and transfers them, once a day, to the access point to which the collector is coupled, which, on its turn, transmits the data with GPRS—General Packet Radio Service communication to the central FTP—File Transfer Protocol server of the ABC company.
The meters already selected in 2016 [18] were considered in order to also evaluate the evolution of the system over time. The huge amount of data were processed with the help of MATLAB. The data were then filtered to prevent the analyses from being invalidated by database inconsistencies, determined by the following:
- technological problems: e.g., data transmission interruptions or meter malfunctions, resulting in “gaps” in time series of one or more meters;
- user behavior problems: e.g., determined either by changes in consumers or by apartments, houses, premises, and so on, permanently or temporarily uninhabited, changes that can cause long series of zeros or alterations in average consumption;
- hydraulic problems: e.g., owing to leaks that cause strong increases in consumption;
- anomalous data: e.g., the outliers (data that significantly differ from the others [19]) generated by random user behaviors.
The data filtering was carried out using the technique described in [20].
After cleaning the data, the significant annual behavior of the meters was identified, using a clustering and classification procedure. Clustering consists of dividing an initial multidimensional dataset into various fields containing objects that have similar characteristics with the aim of finding recurring patterns [21,22]. In the present work, a mixed strategy was used in which, at the first level, a SOM (self-organizing map) of variable size was applied and, at the second level, the K-means algorithm was applied to the clusters defined in the first phase [2]. Classification divides data into predetermined sets and consists of two phases: the construction of a model capable of identifying the intrinsic characteristics of each cluster and the association of unclassified data in each modeled cluster. In this work, the decision tree model was used. Three final clusters were chosen for 2019 and three for 2020, representing typical annual trends.
To evaluate the COVID effect on drinking water demand, it was necessary to consider the same meters for both years for a total number of 637 final meters.
3. Results
At the aim of evaluating the COVID-19 effect on the residential water consumption of the Soccavo SWN, the period of the first national lockdown in Italy was first examined, from 11 March to 3 May 2020. Based on the bibliographic analysis, the variation in the weekly and daily consumption patterns was first evaluated and then a volumetric analysis was made.
The graph of the average flow rates in the lockdown period and in the corresponding weeks of 2019 (Figure 1) does not show abnormal days or consumption data and the same weeks show similar trends in 2019 and 2020.
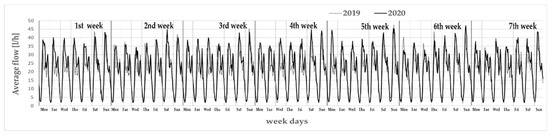
Figure 1.
Average flow rate trend in the 7 weeks of the lockdown and in the respective weeks of 2019.
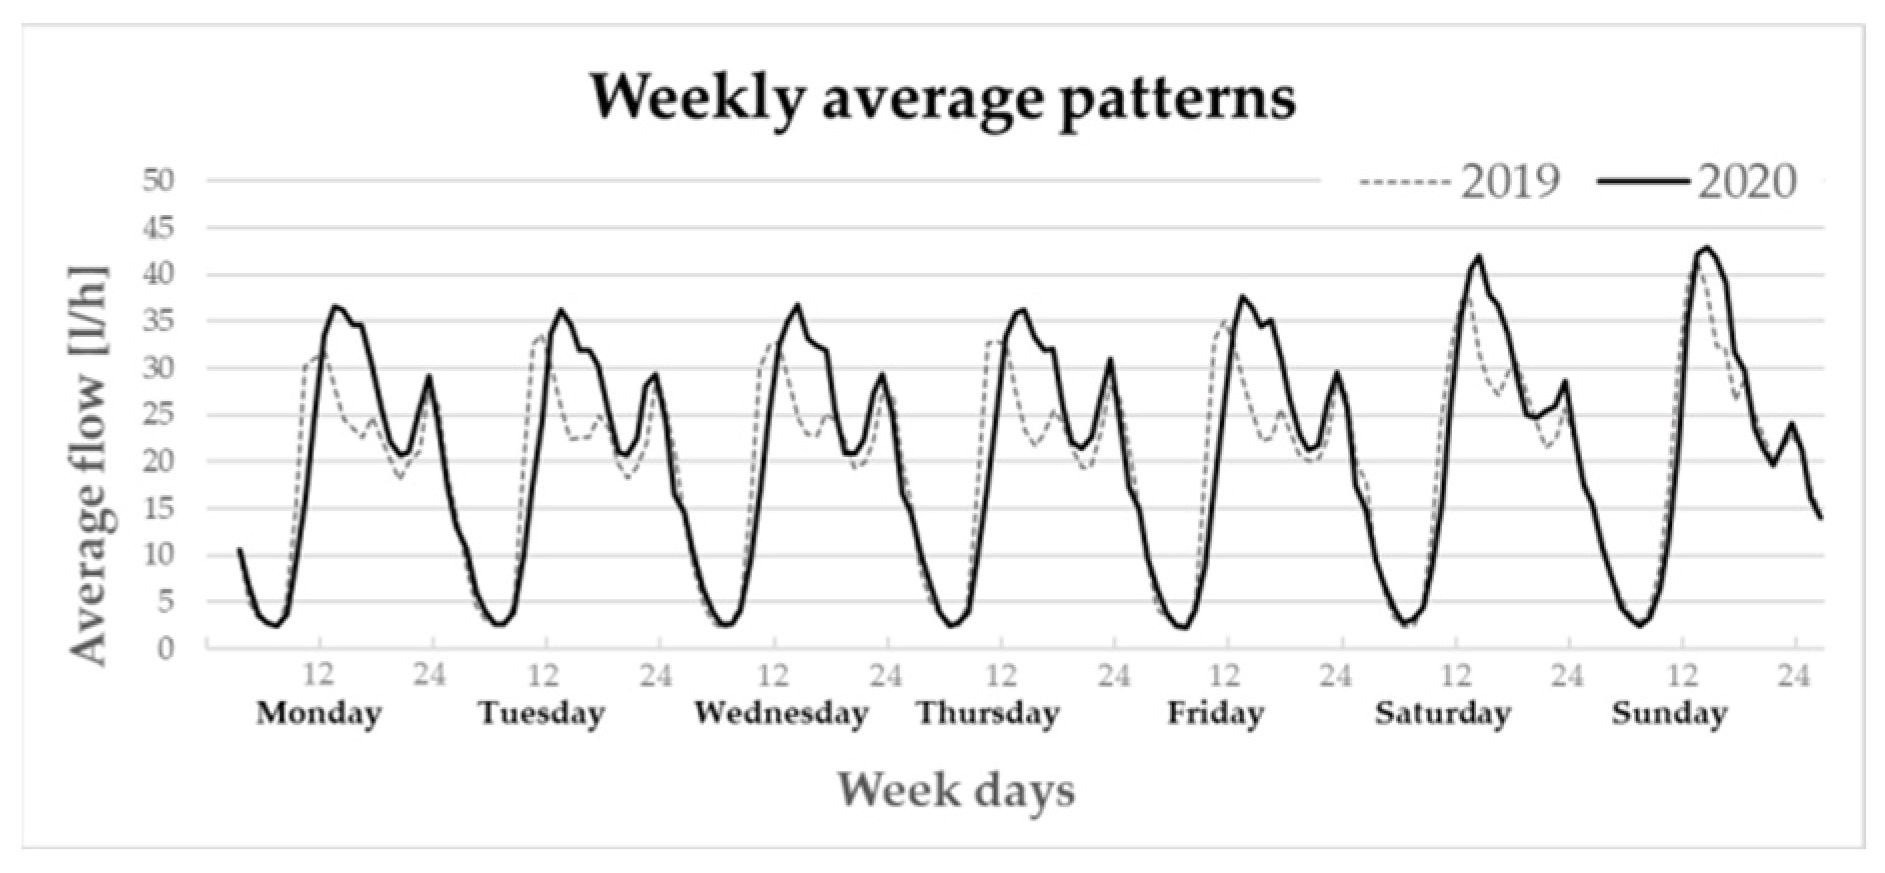
To assess the change in demand over the week, the 2019 and 2020 weekly average patterns were generated (Figure 2). For the 2020 data, compared with the 2019 data, an increase in the morning peak and a postponement of the same for all days of the week (of about 2 h on midweek days) was observed. The afternoon peak is considerably reduced until it disappears in the Sunday pattern. The evening peak is not very different on all days of the week.
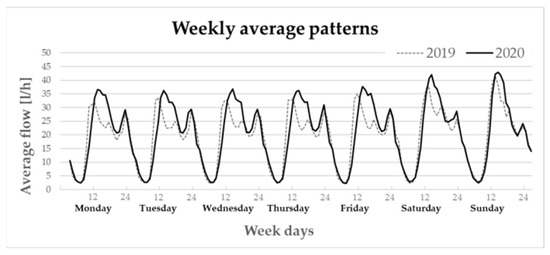
Figure 2.
Weekly average patterns for 2019 and 2020.
In order to understand the hourly variations during the day, the daily average pattern calculated on all of the days of the period in question, from March 11 to May 3, 2019 and 2020 (Figure 3), as well as the daily average patterns on weekdays, Saturdays, and Sundays, were generated (Figure 4).
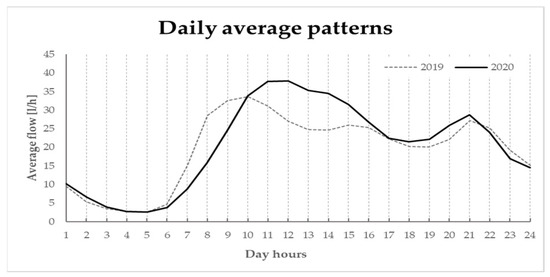
Figure 3.
Daily average patterns for 2019 and 2020.
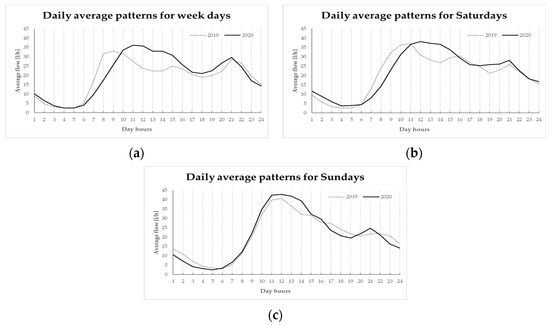
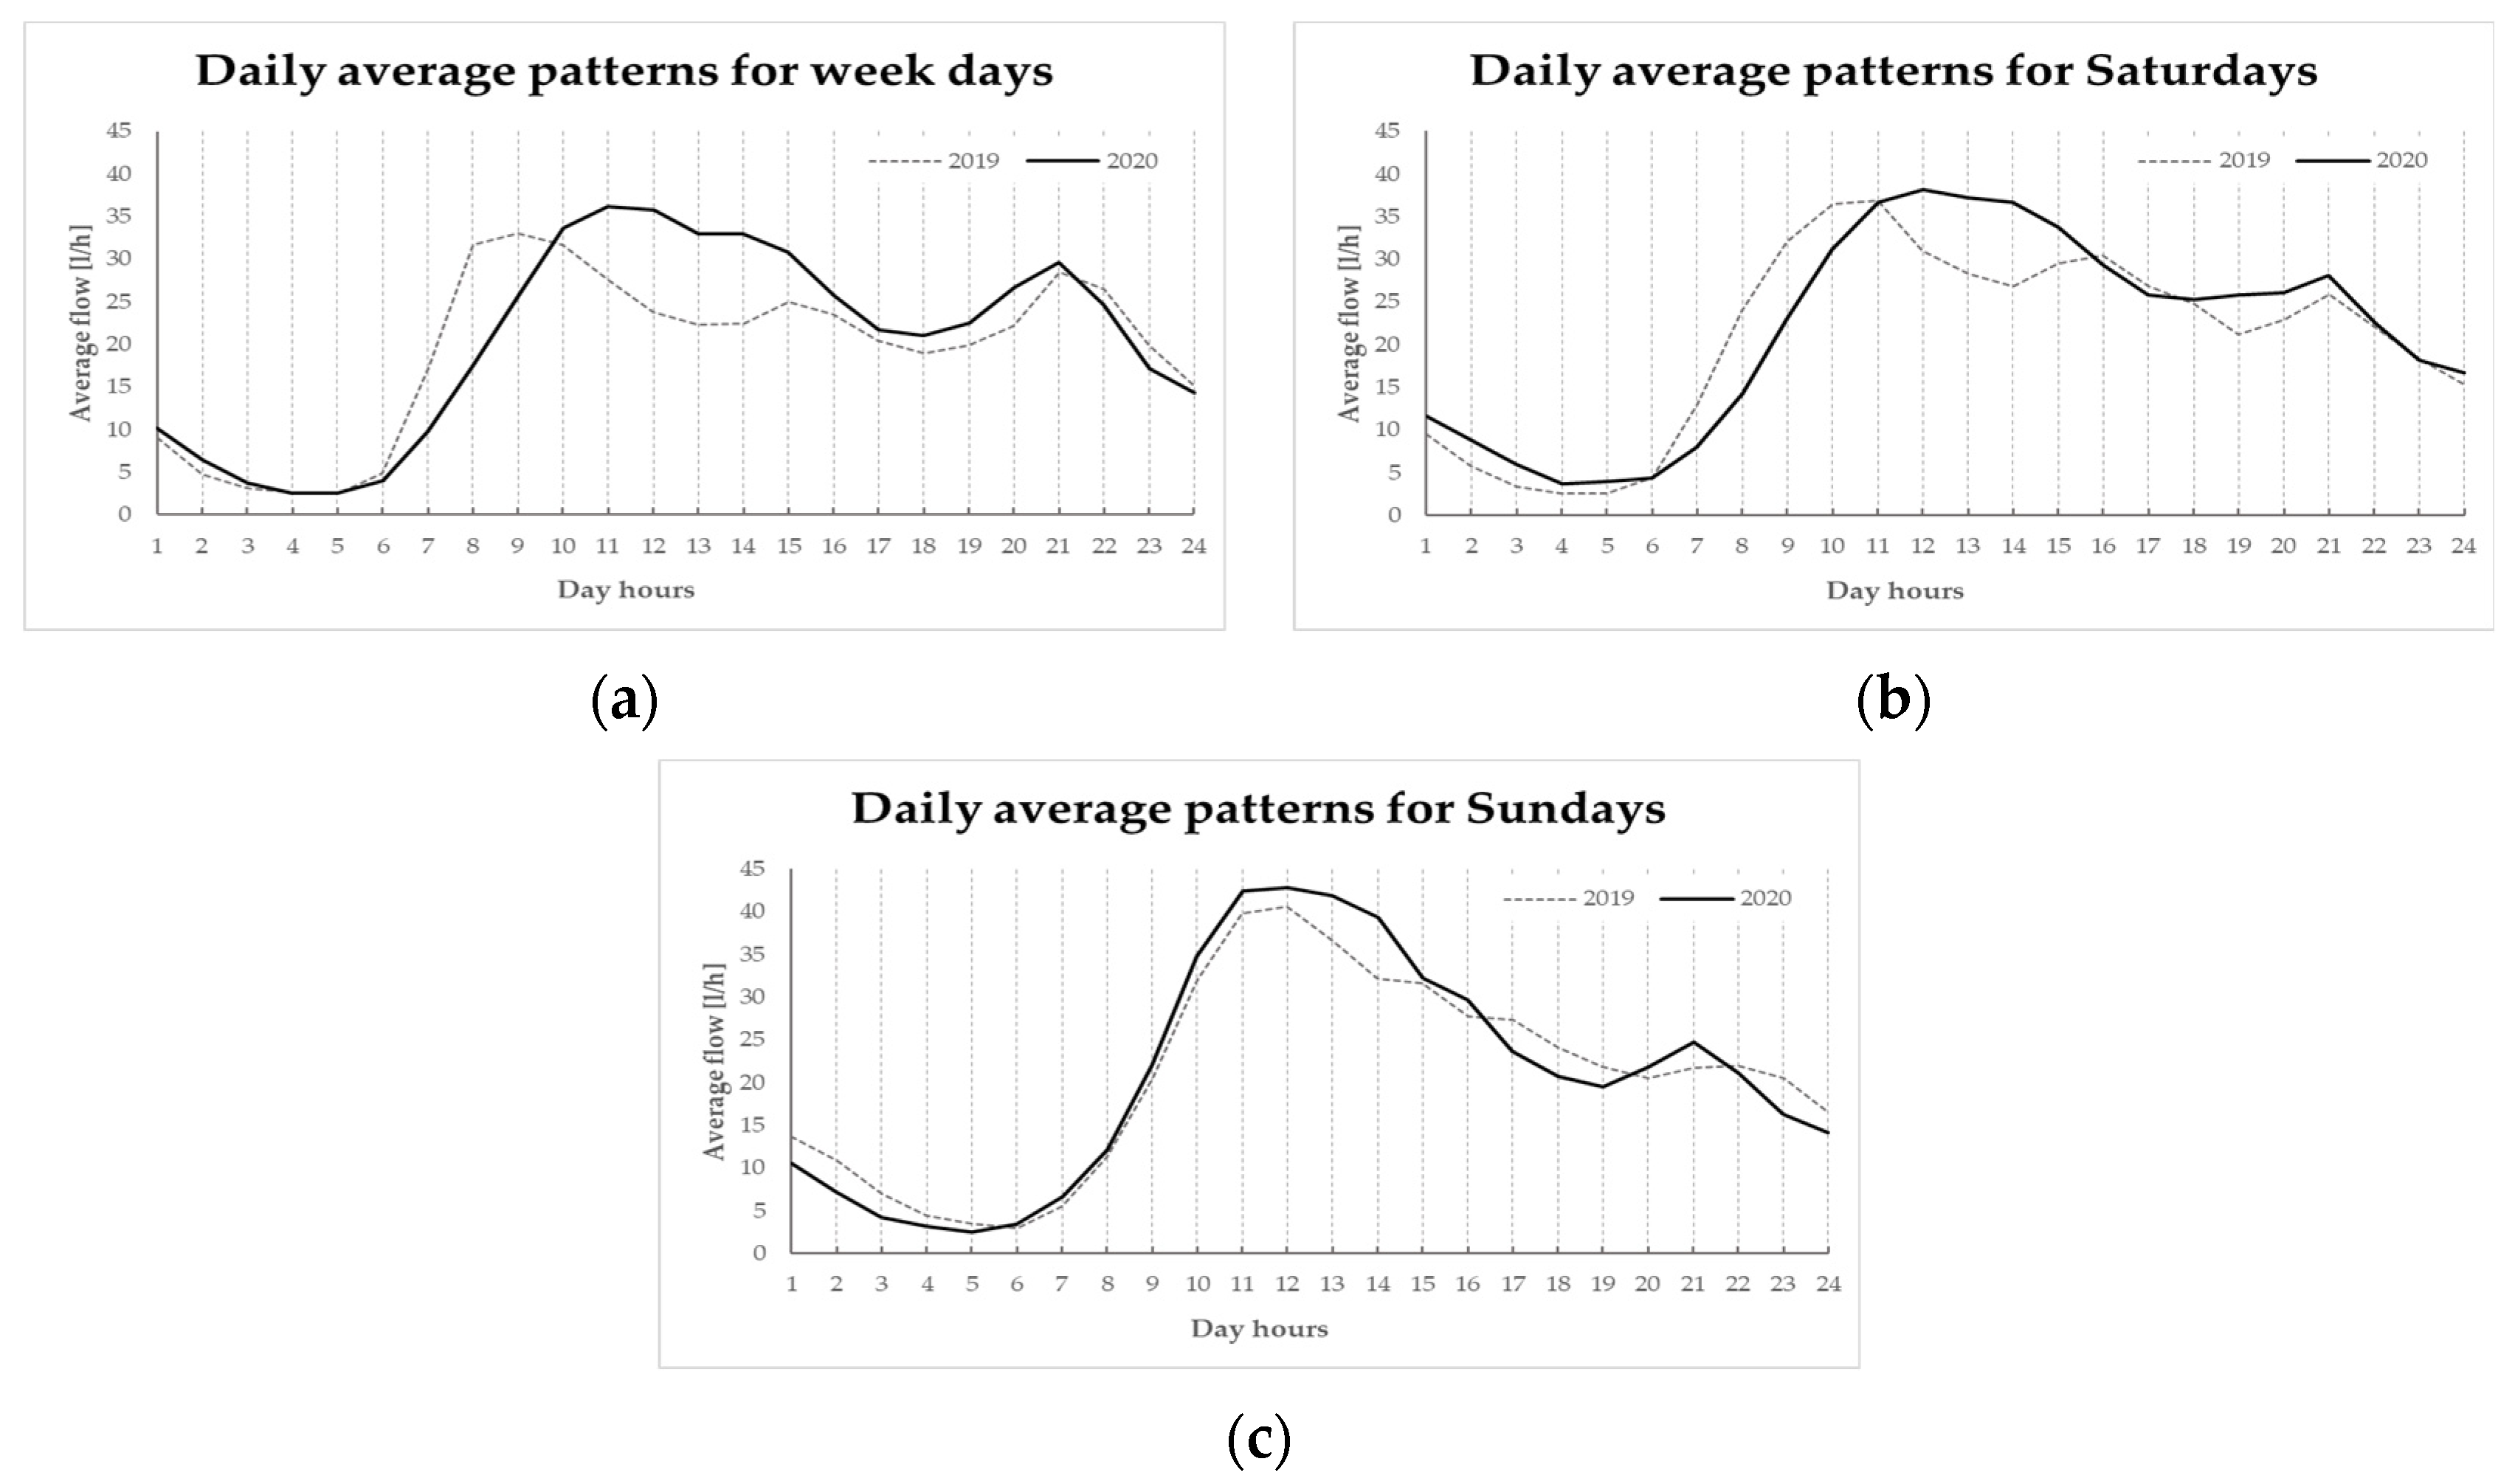
Figure 4.
Daily average patterns for 2019 and 2020 for (a) weekdays; (b) Saturdays; and (c) Sundays.
Figure 3 shows that the 2020 morning peak is higher than the 2019 peak and shifted between 10 and 11 a.m., compared to 8–9 in 2019. In 2020, there is a second morning peak from 12 to 2 p.m., a higher consumption from 9 a.m. to 8 p.m., and a lower consumption in the evening and night hours. Furthermore, in 2020, the evening peak is slightly higher than in the same period of 2019 and there is no peak in the afternoon.
From the graphs in Figure 4, it can be seen that, on midweek days, the maximum morning peak, in the lockdown period, increases and moves, from 7–8 a.m. of the similar period of 2019, to 10–11 a.m. There is a second relative peak in the morning from 12 to 2 p.m. Consumption, from 9 a.m. to 8 p.m., is higher than in the same period of 2019. The evening peak is recorded at 8 p.m. with an intensity similar as in 2019. The 2020 consumptions in the 5–9 a.m. and 8–11 p.m. intervals are minor. The afternoon peak in 2020 is not detected.
On Saturdays, there is a morning absolute peak that is higher in 2020 and it moved from 9 in the same period of 2019 to 11 a.m. Consumption is higher between 10 a.m. and 2:30 p.m. The evening peak in 2020 is higher than in 2019, while the afternoon peak is not recorded.
On Sundays, there is an almost similar trend for 2019 and 2020. There is an increase in both the morning and evening peaks in 2020 compared with 2019, as well as higher consumption in 2020 between 10 a.m. and 3:30 p.m. and lower between 4 and 7 p.m. There is no afternoon peak in either 2020 or in 2019.
Finally, for the 218 m analyzed, the total daily volume for 2019 and 2020 was calculated as the sum of all the daily meter volumes. The average daily volume was also calculated, averaging the total daily volumes from 11 March to 3 May and the total volume, adding the total daily values of the entire period under consideration.
Ultimately, the COVID-19 pandemic and the consequent containment measures caused, in the period from 11 March to 3 May 2020 compared with the same period in 2019, the following:
- An increase in the total volume of 5.8%;
- An increase in the average daily volume from 101.55 m3 to 107.37 m3;
- A higher morning peak on midweek days and shifted by 2 h in place of 8 in 2019;
- Higher morning consumptions between 10 a.m. and 2 p.m. for all days of the week;
- A second relative peak in the morning between 12 and 2 p.m. and disappearance of the afternoon peak;
- Lower afternoon consumption compared with 2019 data on weekends and higher on midweek days;
- A higher evening peak on all days of the week;
- Lower evening consumptions for all days of the week;
- A shift of the morning peak on Saturdays by one hour compared with 2019;
- A Sunday trend similar to 2019.
For the autumn red zone, from 15 November to 6 December 2020, in which measures similar (but less strict) to the national lockdown in March were adopted, the same analyses of the first lockdown were performed. Of the 637 m present in 2019 and 2020, it was necessary to carry out further filtering owing to the anomalies present in November 2019, so that 458 m were considered. For the sake of brevity, the graphs are not shown here, but only the results of the analysis, which showed that the consequences of the measures for the management of the COVID-19 pandemic during the autumn red zone, compared with the same period in 2019, caused the following:
- An increase in the total volume of 1.33%;
- An increase in the average daily volume from 194.98 m3 to 197.58 m3;
- A morning peak on midweek days, between 8 and 9 a.m., higher and shifted compared with 7 a.m. in 2019;
- Higher consumption throughout the week in the 10 a.m.–2 p.m. range;
- An afternoon peak during the week and on Saturdays;
- An evening peak of the same height on all days of the week;
- A lower nighttime consumption on all days of the week;
- A Sunday trend similar to 2019.
4. Conclusions
The goal of this work is the analysis of the COVID effect on drinking water consumption through the study of data from the smart water grid in the Soccavo district of Naples.
After data filtering, the two hourly data matrices per meter of 2019 and 2020 were intersected to have the same meters in both analyses. The period of the national lockdown (from 11 March to 3 May) and of the red zone in Campania (16 November–6 December) in 2020 were analyzed separately, comparing them with the similar periods of 2019. In general, in the two periods characterized by strong restrictions for the containment of the pandemic, the analysis of patterns and daily volumes showed the following:
- An increase in the total consumption volume (5.8% and 1.33%, respectively);
- An increase in the average daily volume;
- A morning peak on midweek days higher and shifted by 1–2 h compared to that of 2019;
- Higher morning consumptions between 10 a.m. and 2 p.m. for all days of the week;
- A higher evening peak on all days of the week;
- Lower evening consumptions for all days of the week;
- A Sunday trend similar to 2019.
The present results confirm that the containment measures of the COVID-19 pandemic have generated an increase in residential drinking water consumption and a change in usage patterns.
Author Contributions
Conceptualization, G.D.G. and R.P.; methodology, G.D.G. and R.P.; software, M.N. and R.P.; validation, formal analysis and investigation C.D.C., G.D.G., S.E., M.N. and R.P.; resources, G.D.G.; data curation, R.P.; writing—original draft preparation, M.N. and S.E.; writing—review and editing, M.N. and S.E.; visualization, M.N. and S.E.; supervision, G.D.G. All authors have read and agreed to the published version of the manuscript.
Funding
This research received no external funding.
Institutional Review Board Statement
Not applicable.
Informed Consent Statement
Not applicable.
Data Availability Statement
The data presented in this study are proprieties of ABC Acqua Bene Comune—Napoli and are available from the authors with the permission of ABC Acqua Bene Comune—Napoli.
Acknowledgments
The authors would like to thank ABC Acqua Bene Comune—Napoli, who installed the telemetry system and provided for consumption data.
Conflicts of Interest
The authors declare no conflict of interest.
References
- Lamberti, P.; Maiolo, M.; Mazzola, M.R.; Veltri, P. Rapporto sui Consumi Idropotabili in Italia sul Finire degli Anni 80; CUEN: Naples, Italy, 1994. [Google Scholar]
- Padulano, R.; Del Giudice, G. A mixed strategy based on self-organizing map for water demand pattern profiling of large-size smart water grid data. Water Resour. Manag. 2018, 32, 3671–3685. [Google Scholar] [CrossRef]
- Cahill, J.; Hoolohan, C.; Lawson, R.; Browne, A.L. COVID-19 and water demand: A review of literature and research evidence. Wiley Interdiscip. Rev. Water 2022, 9, e1570. [Google Scholar] [CrossRef]
- Sayeed, A.; Rahman, H.; Bundschuh, J.; Herath, I.; Ahmed, F.; Bhattacharya, P.; Tariq, M.R.; Rahman, F.; Joy, T.I.; Abid, M.T.; et al. Handwashing with 79 soap: A concern for overuse of water amidst the COVID-19 pandemic in Bangladesh. Groundw. Sustain. Dev. 2021, 13, 100561. [Google Scholar] [CrossRef] [PubMed]
- Dzimińska, P.; Drzewiecki, S.; Ruman, M.; Kosek, K.; Mikołajewski, K.; Licznar, P. The Use of Cluster Analysis to Evaluate the Impact of COVID-19 Pandemic on Daily Water Demand Patterns. Sustainability 2021, 13, 5772. [Google Scholar] [CrossRef]
- Abu-Bakar, H.; Williams, L.; Hallett, S.H. Quantifying the impact of the covid-19 lockdown on household water consumption patterns in England. Npj Clean Water 2021, 3, 1–9. [Google Scholar] [CrossRef]
- Kalbusch, A.; Henning, E.; Brikalski, M.P.; Vieira de Luca, F.; Konrath, C.A. Impact of coronavirus (COVID-19) spread-prevention actions on urban water consumption. Resour. Conserv. Recycl. 2020, 163, 105098. [Google Scholar] [CrossRef] [PubMed]
- Lüdtke, D.U.; Luetkemeier, R.; Schneemann, M.; Liehr, S. Increase in daily household water demand during the first wave of the covid-19 pandemic in Germany. Water 2021, 13, 260. [Google Scholar] [CrossRef]
- Alda-Vidal, C.; Smith, R.; Lawson, R.; Browne, A.L. Understanding Changes in Household Water Consumption Associated with COVID-19. Available online: https://artesia.shinyapps.io/Artesia-Reports/ (accessed on 14 March 2021).
- Menneer, T.; Qi, Z.; Taylor, T.; Paterson, C.; Tu, G.; Elliott, L.R.; Morrissey, K.; Mueller, M. Changes in domestic energy and water usage during the UKCOVID-19 lockdown using high-resolution temporal data. Int. J. Environ. Res. Public Health 2021, 18, 6818. [Google Scholar] [CrossRef] [PubMed]
- Bich-Ngoc, N.; Teller, J. Potential effects of the covid-19 pandemic through changes in outbound tourism on water demand: The case of Liege (Belgium). Water 2020, 12, 2820. [Google Scholar] [CrossRef]
- Balacco, G.; Totaro, V.; Iacobellis, V.; Manni, A.; Spagnoletta, M.; Piccinni, A.F. Influence of COVID-19 spread on water drinking demand: The case of Puglia region (southern Italy). Sustainability 2020, 12, 5919. [Google Scholar] [CrossRef]
- Alvisi, S.; Franchini, M.; Luciani, C.; Marzola, I.; Mazzoni, F. Effects of the COVID-19 Lockdown on Water Consumptions: Northern Italy Case Study. J. Water Resour. Plan. Manag. 2021, 147, 11. [Google Scholar] [CrossRef]
- Rizvi, S.; Rustum, R.; Deepak, M.; Wright, G.B.; Arthur, S. Identifying and analysing residential water demand profile; including the impact of COVID-19 and month of Ramadan, for selected developments in Dubai, United Arab Emirates. Water Supply 2020, 21, 1144–1156. [Google Scholar] [CrossRef]
- Cvetkovic, D.; Nešovic, A.; Terzic, I. Impact of people’s behaviour on the energy sustainability of the residential sector in emergency situations caused by COVID-19. Energy Build. 2021, 230, 110532. [Google Scholar] [CrossRef] [PubMed]
- Zanocco, C.; Flora, J.; Rajagopal, R.; Boudet, H. Exploring the effects of California’s COVID-19 shelter-in-place order on household energy practices and intention to adopt smart home technologies. Renew. Sustain. Energy Rev. 2021, 139, 110578. [Google Scholar] [CrossRef] [PubMed]
- Li, D.; Engels, R.A.; Ma, X.; Porse, E.; Kaplan, J.D. Stay-at-home orders during the COVID-19 pandemic reduced urban water use. Environ. Sci. Technol. Lett. 2021, 8, 421–436. [Google Scholar] [CrossRef]
- Padulano, R.; Del Giudice, G. Pattern detection and scaling laws of daily water demand by SOM: An application to the WDN of Naples, Italy. Water Resour. Manag. 2019, 33, 739–755. [Google Scholar] [CrossRef]
- Barnett, V.; Lewis, T. Outliers in Statistical Data, 3rd ed.; John Wiley & Sons: Hoboken, NJ, USA, 1994; Volume XVII, 582p. [Google Scholar]
- Padulano, R.; Del Giudice, G. A nonparametric framework for water consumption data cleansing: An application to a smart water network in Naples (Italy). J. Hydroinforma. 2020, 22, 666–680. [Google Scholar] [CrossRef]
- Zhou, K.; Yang, S.; Shen, C. A review of electric load classification in smart grid environment. Renew. Sustain. Energy Rev. 2013, 24, 103–110. [Google Scholar] [CrossRef]
- Sancho-Asensio, A.; Orriols-Puig, A.; Golobardes, E. Robust on-line neural learning classifier system for data stream classification tasks. Soft Comput. 2014, 18, 1–21. [Google Scholar] [CrossRef]


Publisher’s Note: MDPI stays neutral with regard to jurisdictional claims in published maps and institutional affiliations. |
© 2022 by the authors. Licensee MDPI, Basel, Switzerland. This article is an open access article distributed under the terms and conditions of the Creative Commons Attribution (CC BY) license (https://creativecommons.org/licenses/by/4.0/).