Proceeding Paper

Experimental Study of the Effects of Heating or Cooling on the Water Surface in an Open Channel †

by
Alexandros Leousidis
1,
George Pechlivanidis
2,
Evangelos Keramaris
1,* and
Yiannis Savvidis
2
1
Department of Civil Engineering, University of Thessaly, Pedion Areos, 38334 Volos, Greece
2
Department of Environmental Engineering, International Hellenic University, 57400 Sindos, Greece
*
Author to whom correspondence should be addressed.
Presented at the International Conference EWaS5, Naples, Italy, 12–15 July 2022.
Environ. Sci. Proc. 2022, 21(1), 60; https://doi.org/10.3390/environsciproc2022021060
Published: 30 October 2022

Abstract

:
In the present study, the effects of heating or cooling of the water surface in an open channel were investigated experimentally. The experiments were performed in a horizontal open channel, which was filled with water, to study the temperature and density fields of water, when a part of the surface receives or loses energy (heating or cooling). Initially, the effect of the water surface heating was investigated. The intensity of the thermal radiation was adjusted with the help of a dimmer and the produced velocities were measured in a two-dimensional field with the help of a camera and a dye (rhodamine). This method determined the range of flow velocities at different times in selected areas. This field will be time-varying until thermal equilibrium is reached and the flow becomes steady. The effect of the water surface cooling was then investigated in a similar way. The flow field in this case remains variable until the refrigerant load (ice columns) is finished. A waterproof digital pin thermometer was used to measure the temperature field and water density was measured by a densimeter. The results showed that the flow velocities developed by heating are much lower than those developed by cooling.

1. Introduction

The effects of heating and cooling on the water surface were studied experimentally. The development of velocities under the application of thermal or cooling load on the fluid (water) was observed. The fluid flow develops due to temperature differences in different areas in the mass of the water. More specifically, considering a basin with average temperatures T1 and T2, movement of fluid from region (1) to region (2) and vice versa (Figure 1) was observed. This movement creates a distributed temperature field due to current velocities, which will be variable in the transitional stage and later permanent, provided that the amount of heat or cooling supplied to the area (T1) remains constant.
The effects of suction/injection and variable physical properties on a constant natural flow of transport through a channel were studied by Ajibade et al. The study found that an increase in suction (S > 0) through the heated plate causes a decrease in temperature, velocity and concentration of the liquid [1]. Another study experiment focused on the effect of the fractal square grid (FSG) iteration number (N) parameter on heat transfer. Using four different FSGs with four different Ns, the experiment was conducted using a closed system water tunnel. Results indicated that FSG4 introduces higher heat transfer enhancement in general than SSG, while SSG outperforms FSG4 in heat transfer enhancement for relatively close distances from the cylinder [2]. The flow of river water around large woody debris (LWD) creates pressure gradients along the river bed that drive river–groundwater mixing, or hyporheic exchange, and heat transport within the hyporheic zone. Researchers attempted to improve vertical connectivity in rivers and increase thermal patchiness within the hyporheic zone. However, hyporheic exchange near LWD may not impact diel surface water temperatures at the reach scale [3]. The mainstream model uses heat budget components to calculate the heat exchange between stream water and the atmosphere. The sensitivity analysis gives quantitative evidence that stream water temperature is more sensitive to air temperature and solar radiation than to other weather and bed parameters [4]. Hester et al. noted the effect of heat from the inflow of a small stream during the summer into a dam area. The time-varying impacts of fluctuations in the water surface’s height, temperature, and salinity were observed [5]. Grace et al. conducted a study into water level measurements with seasonal temperatures in a river area of California. This study assessed hydraulic conductivity in a flow-aquifer system [6]. Kazemi et al. experimented on the heat transfer to liquids, determining the temperature field near the interface of the evaporating water [7]. The published results of experiments relating to heat transfer in two-dimensional microchannels are affected by a significant scatter, owing to the various conditions used in the experiments, and, most likely, owing to the difficulty of measurements at micronic scales [8]. Blythman examined the hydrodynamics and heat transfer of a laminar flow in a rectangular channel. The temperature profile is formed mainly by fluid displacement versus the axial gradient of temperature. However, noticeable thermal diffusion occurs for low Prandtl numbers and long-time scales [9]. Lyubimova et al. researched the effect in different densities on the confluence of two rivers without taking into account the contribution of heat. There was an overlap in water flows upstream and downstream of the junction. Numerical simulation was used to analyze the phenomenon [10].
In the present laboratory research, the phenomenon of fluid motion is studied, which is created exclusively under the influence of thermal energy and cooling load. The average fluid velocities for each flow depth and the movement length of the heated or cooled mass were approximated. The above study can be applied to many fields, of which we indicatively mention:
  • In a basin for water supply of an area, where it is very useful to know where the water intake should be placed so that high temperature water is not drained.
  • Knowledge of any height change in water temperature of a heated basin by solar radiation.
  • The study of dispersion of liquid waste pollutants in water recipients (lakes, seas, etc).

2. Materials and Methods

2.1. Experimental Setup

The effect of heating and cooling on a stationary mass of water with water surface area T1 (Figure 1) and the results it brings to the rest of the water surface were studied in a laboratory.
The hydraulic effect was simulated in an open channel. The experiments were conducted in the open channel of the Hydraulics Laboratory of the Department of Environmental Engineering in Alexander Campus of the International Hellenic University (IHU). The channel was 1000 cm long, 50 cm wide and 50 cm high with a horizontal bottom slope. The location of the experiment application was chosen to be at 3.20 m from one end of the channel and not in the middle, because while the phenomenon under investigation is expected to be effective in both directions of the heating area (upstream–downstream), with this position it is possible to investigate at a longer measuring length (6.8 m) than the zero position X = 0.00 m (Figure 2).
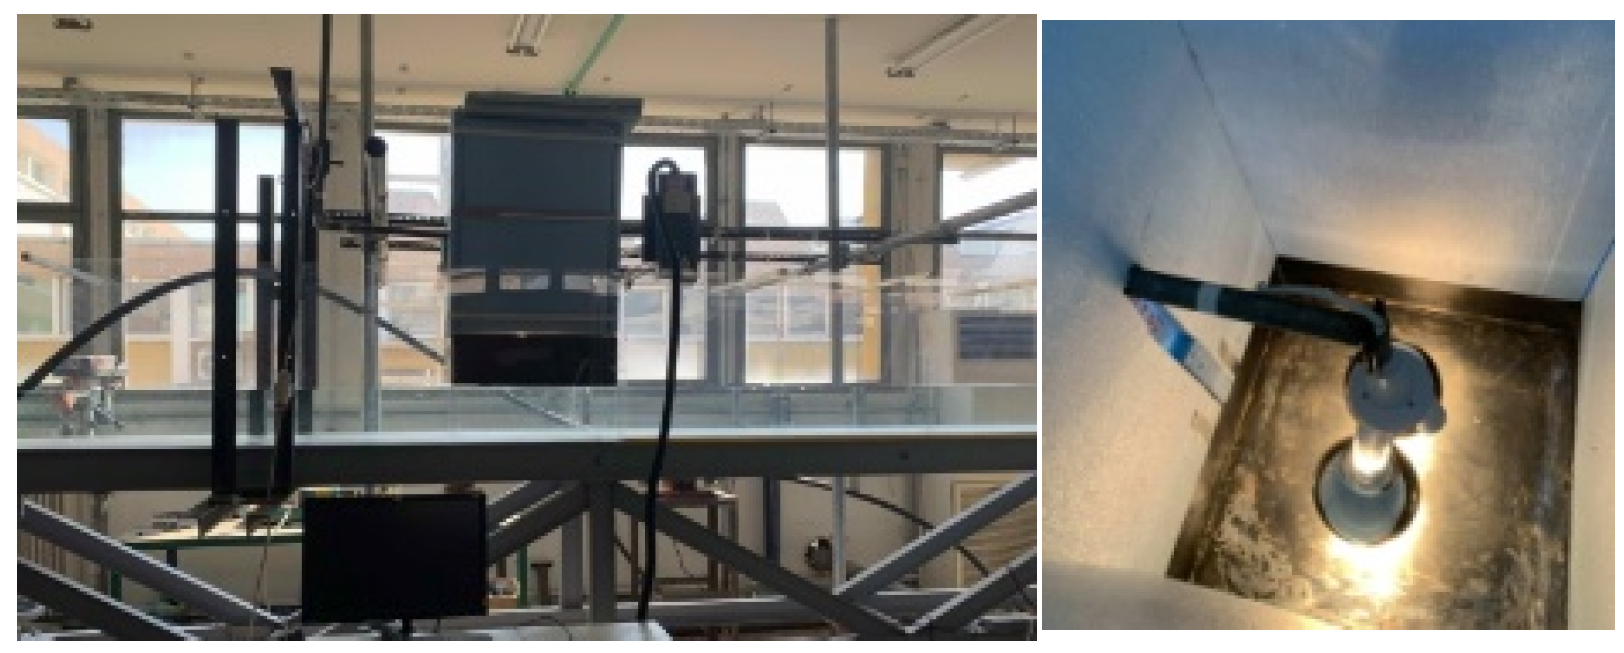
The experimental heating device consists of a metal frame, from which a bracket is attached to place the lamp holder, where it is possible to move it vertically. Two 250 W bulbs are connected to the lamp holder, connected to a dimmer (volume adjustment i). The lamps are placed in a metal box with a base of 50 cm × 50 cm and a height of 15 cm. The bulbs are 10 cm from the bottom of the box. The whole system is insulated using a fibrin insulating box (Figure 3 and Figure 4) to reduce heat loss to the environment.
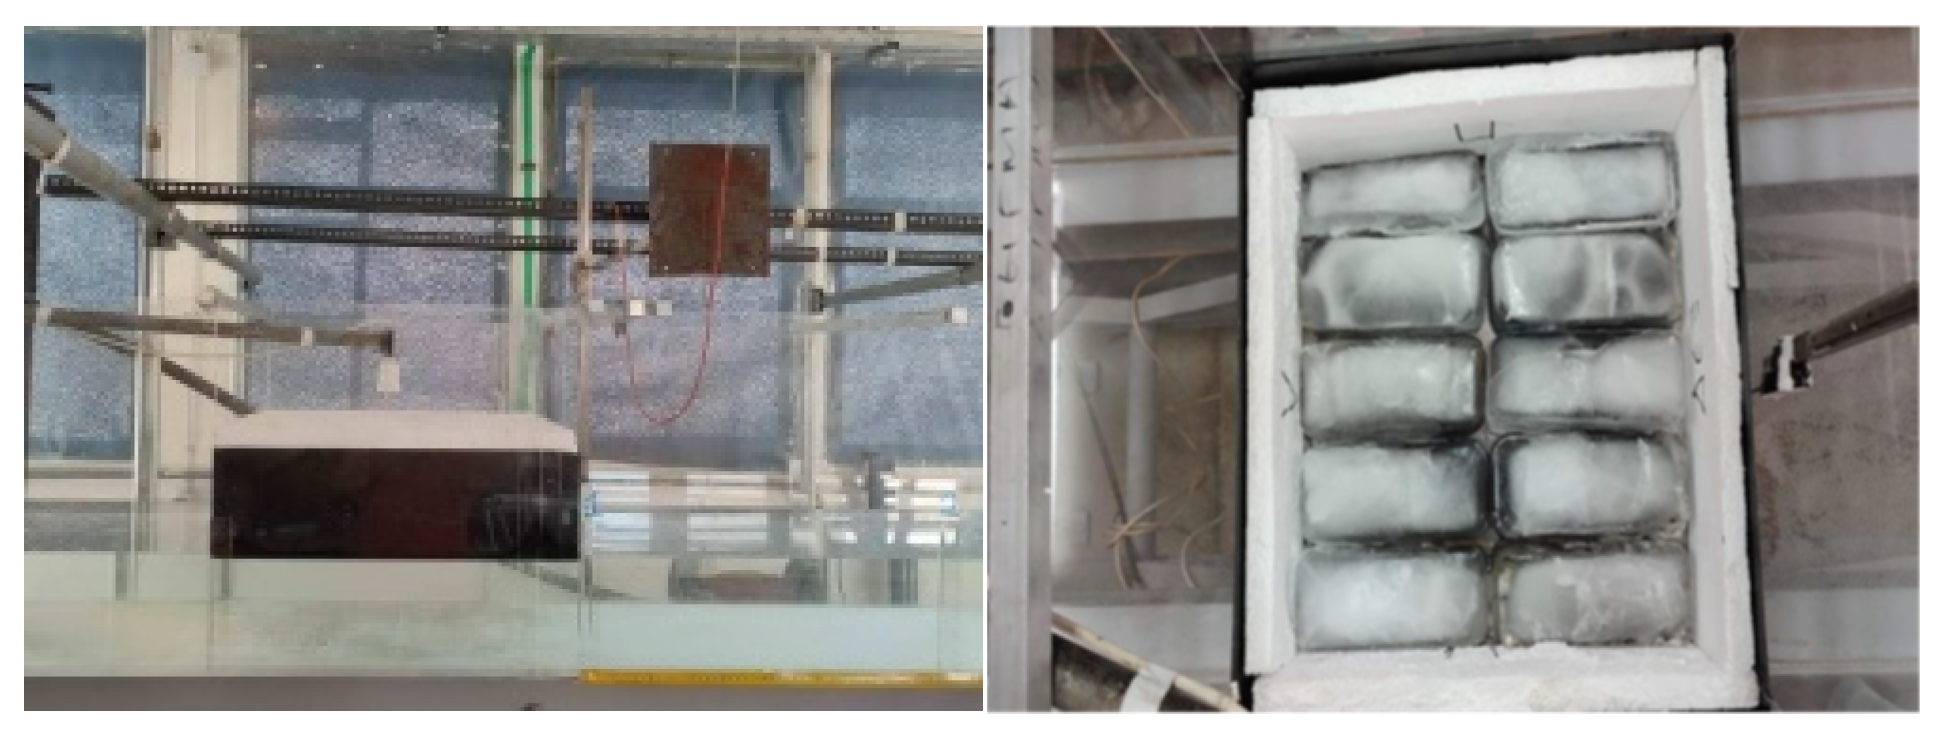
The experimental cooling device consists of a base metal box 50 cm × 50 cm and a height of 15 cm, which is fixed using galvanized wire to vertical metal rods which are placed perpendicular to the head of the channel cross-section. The metal box has insulated lined sides on the inside and a lid made of insulating material on the roof to prevent the refrigerant from escaping to the environment (Figure 3 and Figure 4).

2.2. Experiments

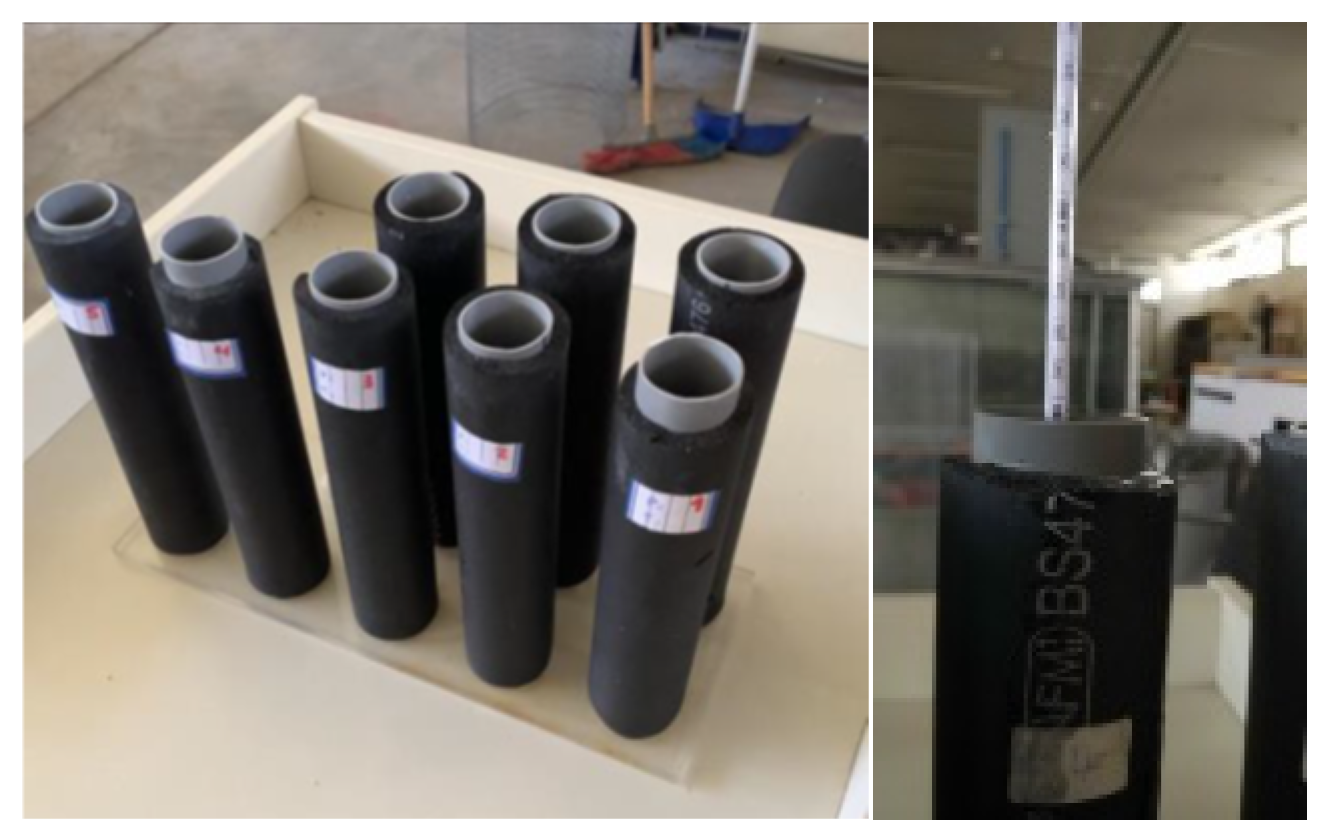
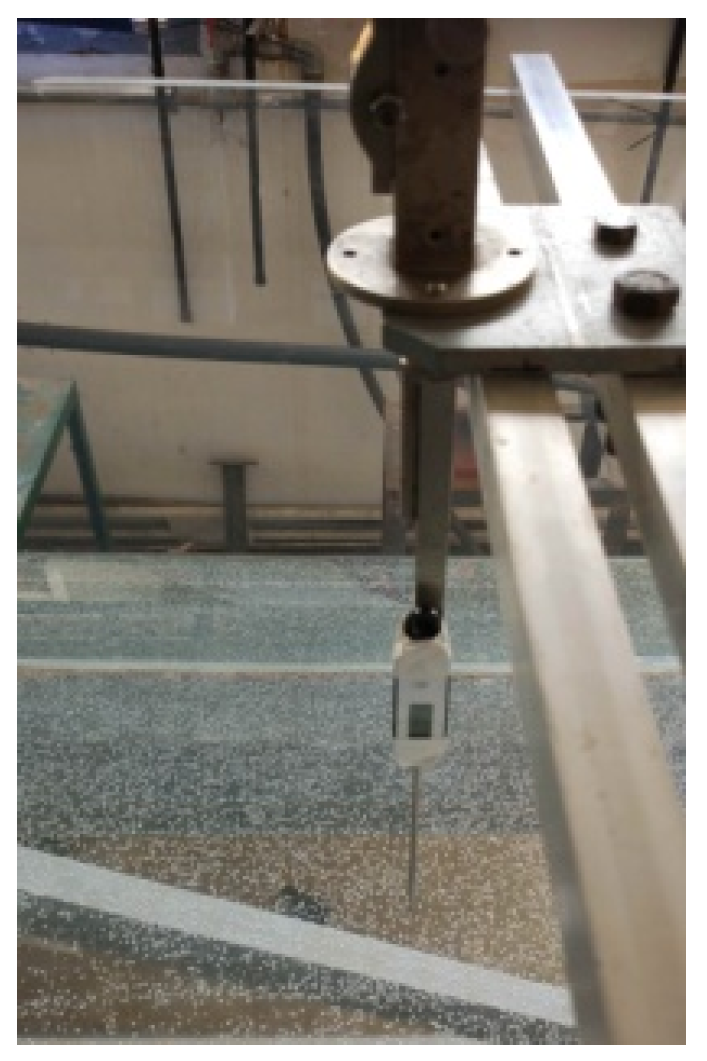
The parameter that was measured initially concerned the density of the supply water from which a depth of 20 cm was filled in the open channel. The temperature field per 50 cm cross-section was then measured along the entire channel length, and finally, the average values of the velocity fields were determined. The measurement of water density values was performed in insulating containers (Figure 5), in which water (supply) was filled, in order to find the relationship between density (ρ) and temperature (T). The purpose of the p-T relation is to correlate then with the depth (h) and temperature (T) relations. The next step was to fill the channel with 5, 10, 15, and 20 cm water depth. A total of twenty (20) different temperature field experiments were performed to determine the thermal wedge (thermal radiation) with five (5) different intensity values (i) of the dimmer for each flow depth. To investigate the effect of refrigerant load, a total of the four (4) experiments were performed, one (1) for each flow depth; due to the use of an ice column, we had a refrigerant load intensity. The measurements of the temperature field were performed on the channel axis (X-axis) starting at position X = 0.00 m, that is, the end of the edge of the metal box (0.50 m × 0.50 m and in sections every 0.50 m up to 4.00 m with additional positions at +5.50 m and +6.80 m (end of the channel) Temperature measurements (Figure 6) in each section are taken on the vertical axis (Z) as shown in Figure 7. Finally, using the dye (rhodamine), the average values of the velocities developed in the channel were measured, from the measurements of its motion in the unit of time (Figure 8 and Figure 9).
The present work aims to determine the length of heat or cooling transfer to the remaining stationary mass of the fluid, the rate of change of temperature at each cross-section per 50 cm in the hydraulic channel, to approximate the fluid motion, created by the temperature difference and hence the difference in density of the fluid, and finally the determination of the final length of motion of heated or cooled masses, a position in which the phenomenon becomes permanent and thermal equilibrium is restored.

3. Measurements

The values of water density are presented in detail in Table 1 below.
According to the above measurements, the diagram is obtained:
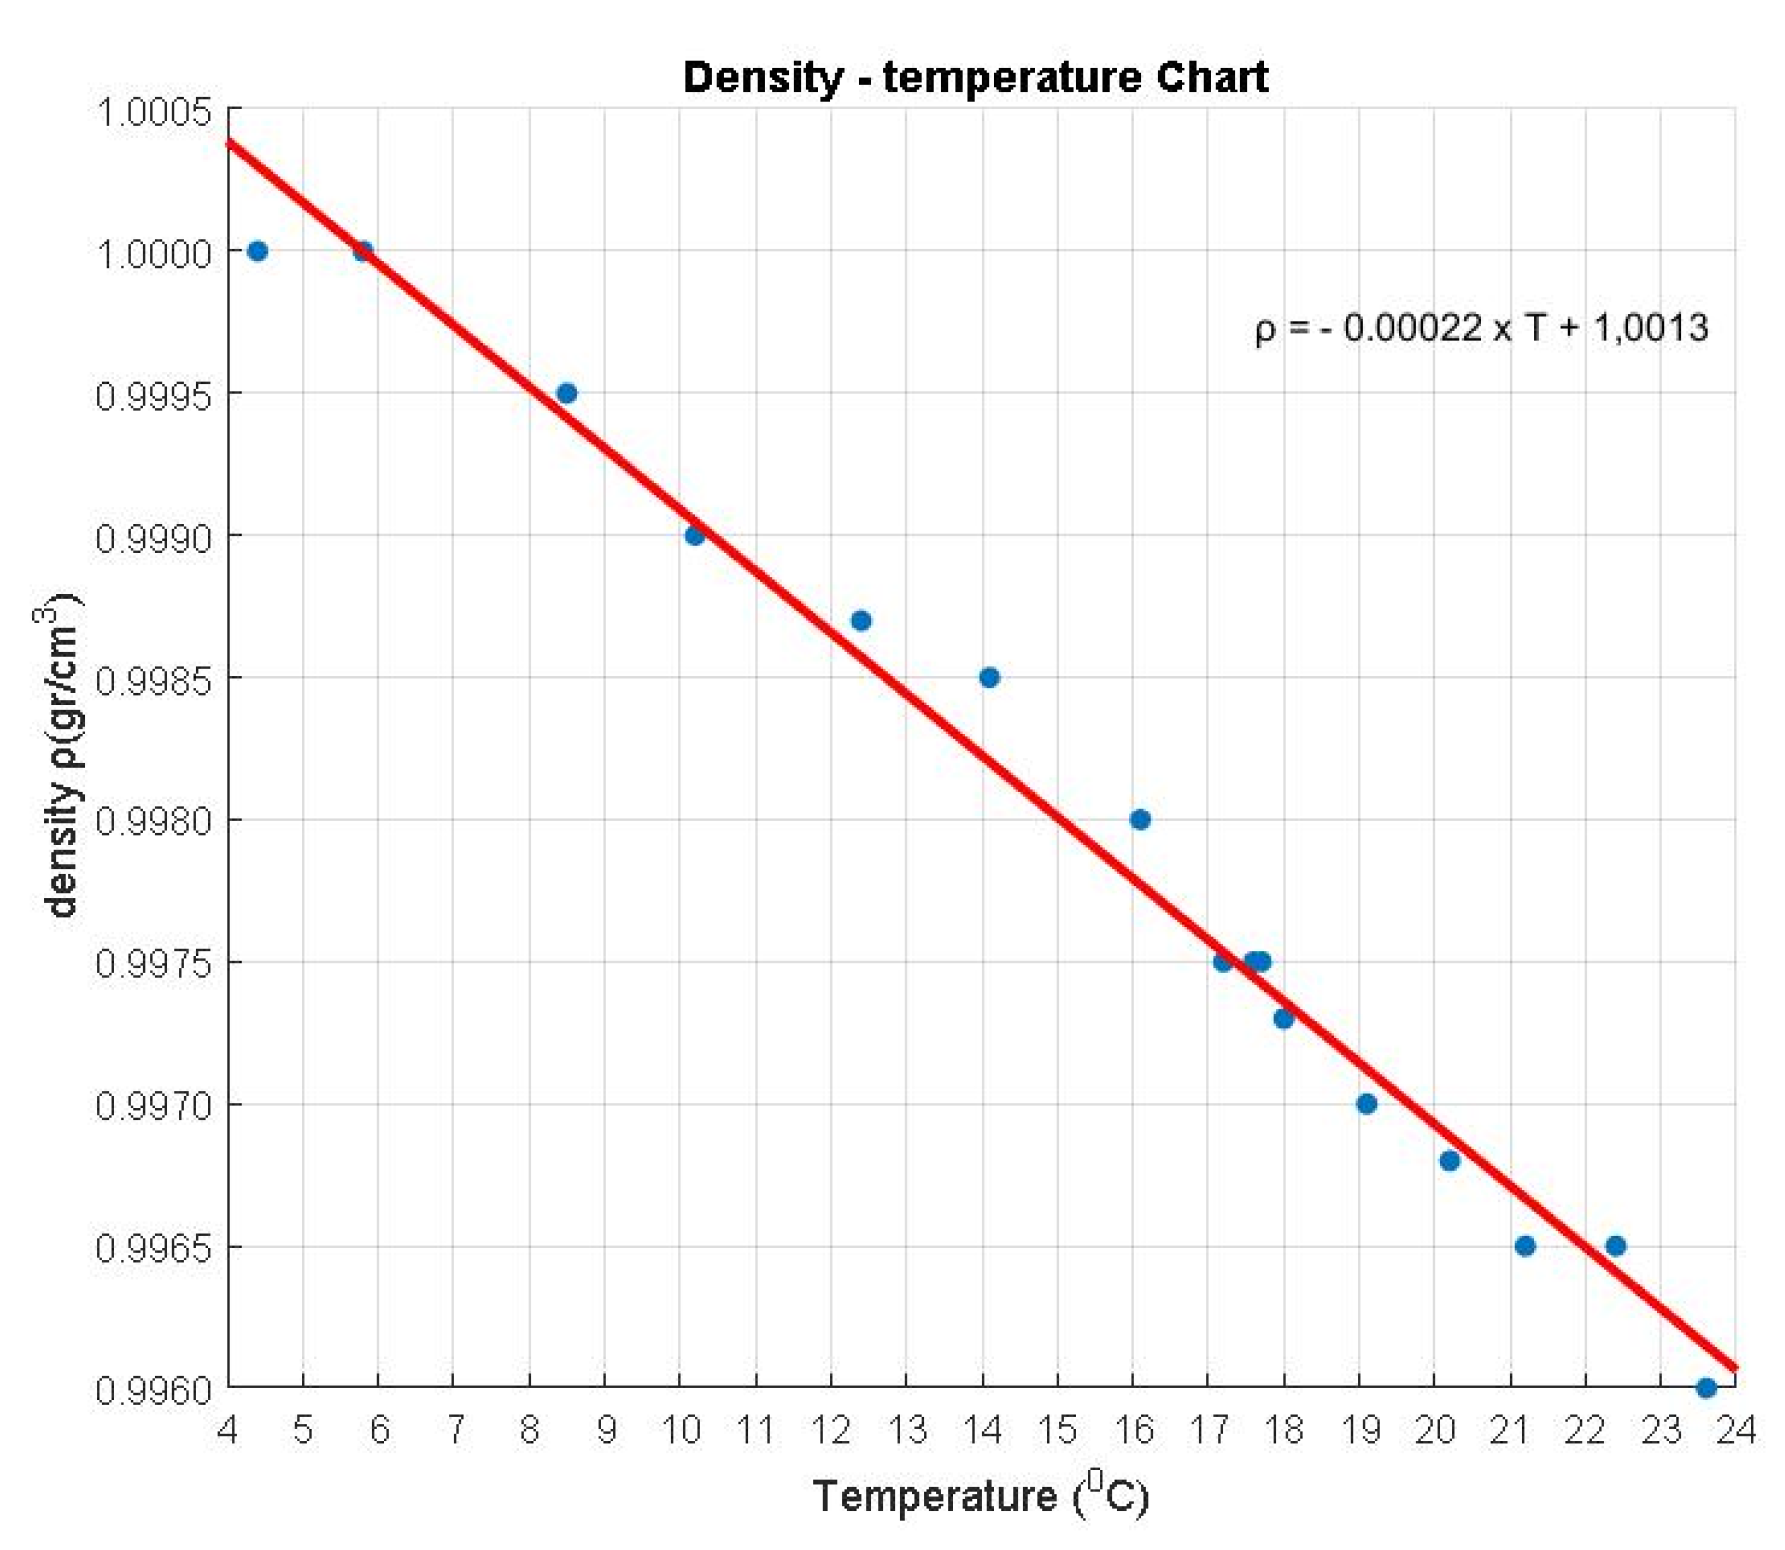
The diagram in Figure 10 shows the relationship between density (ρ) and temperature (T):
ρ = −0.00022 × Τ + 1.0013
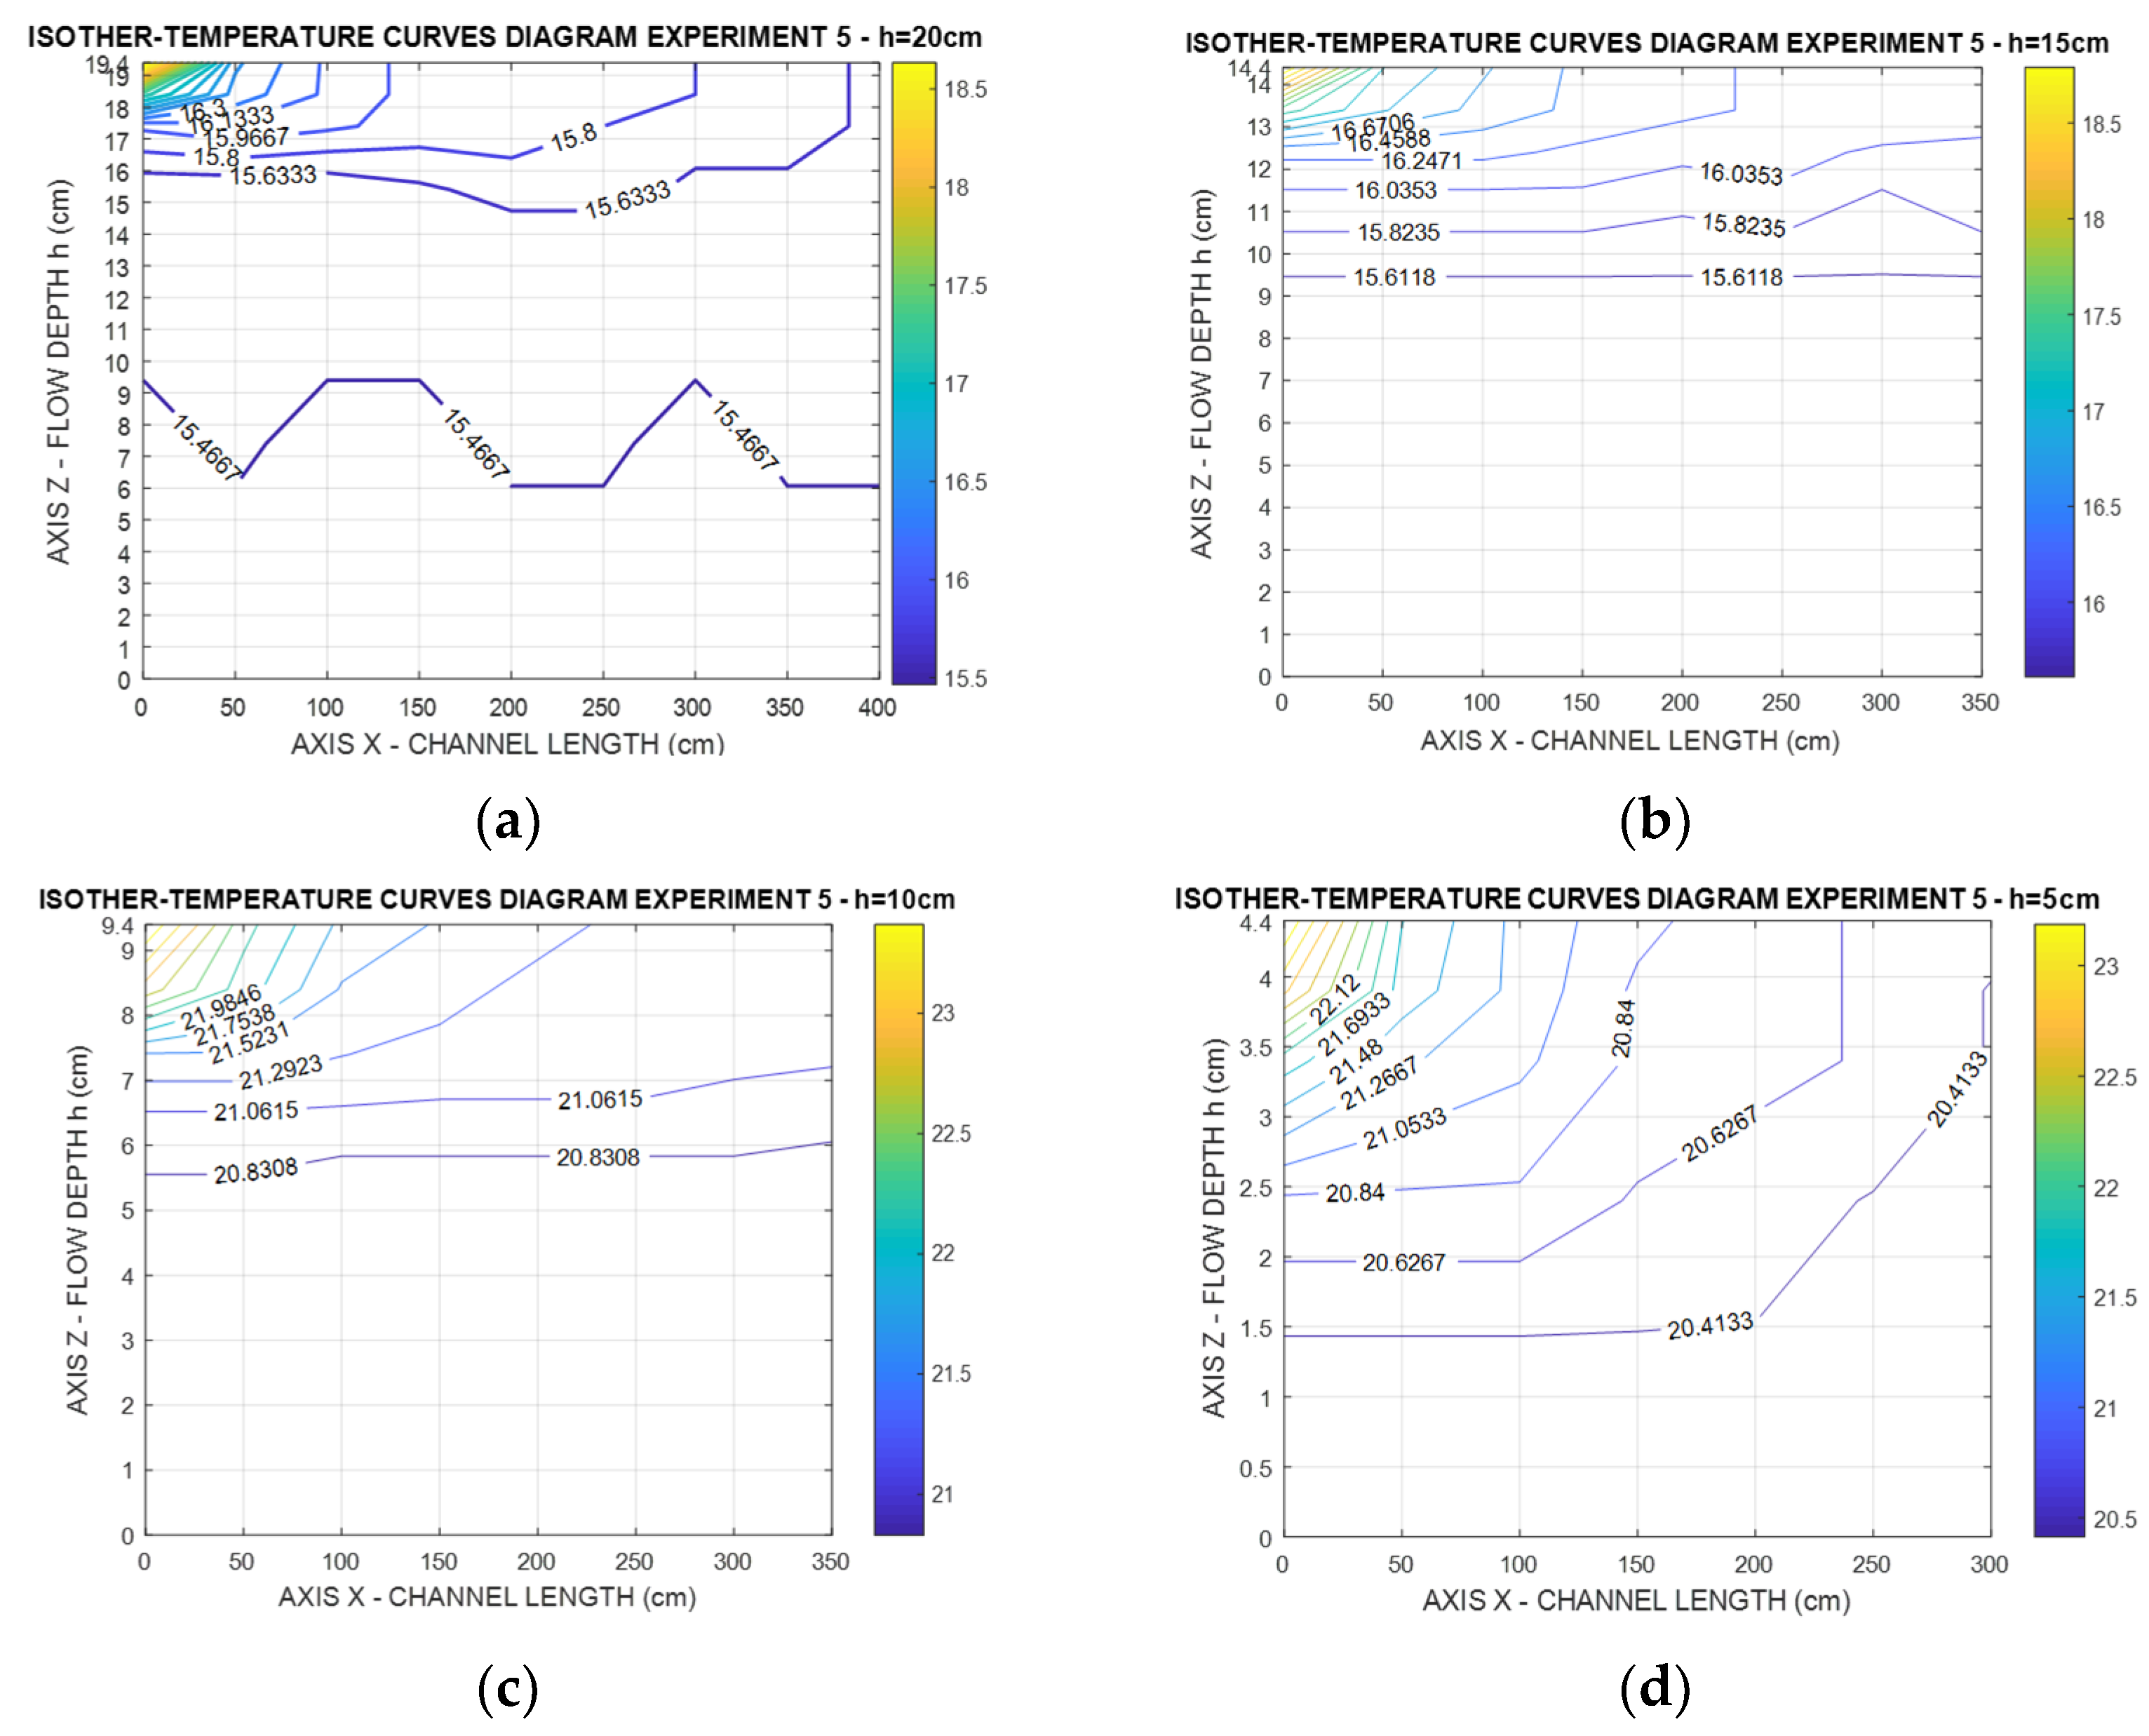
From the temperature field measurements with the effect of thermal radiation per cross-section in the hydraulic channel, the following diagrams of isothermal curves are obtained; they are presented indicatively (Figure 11):
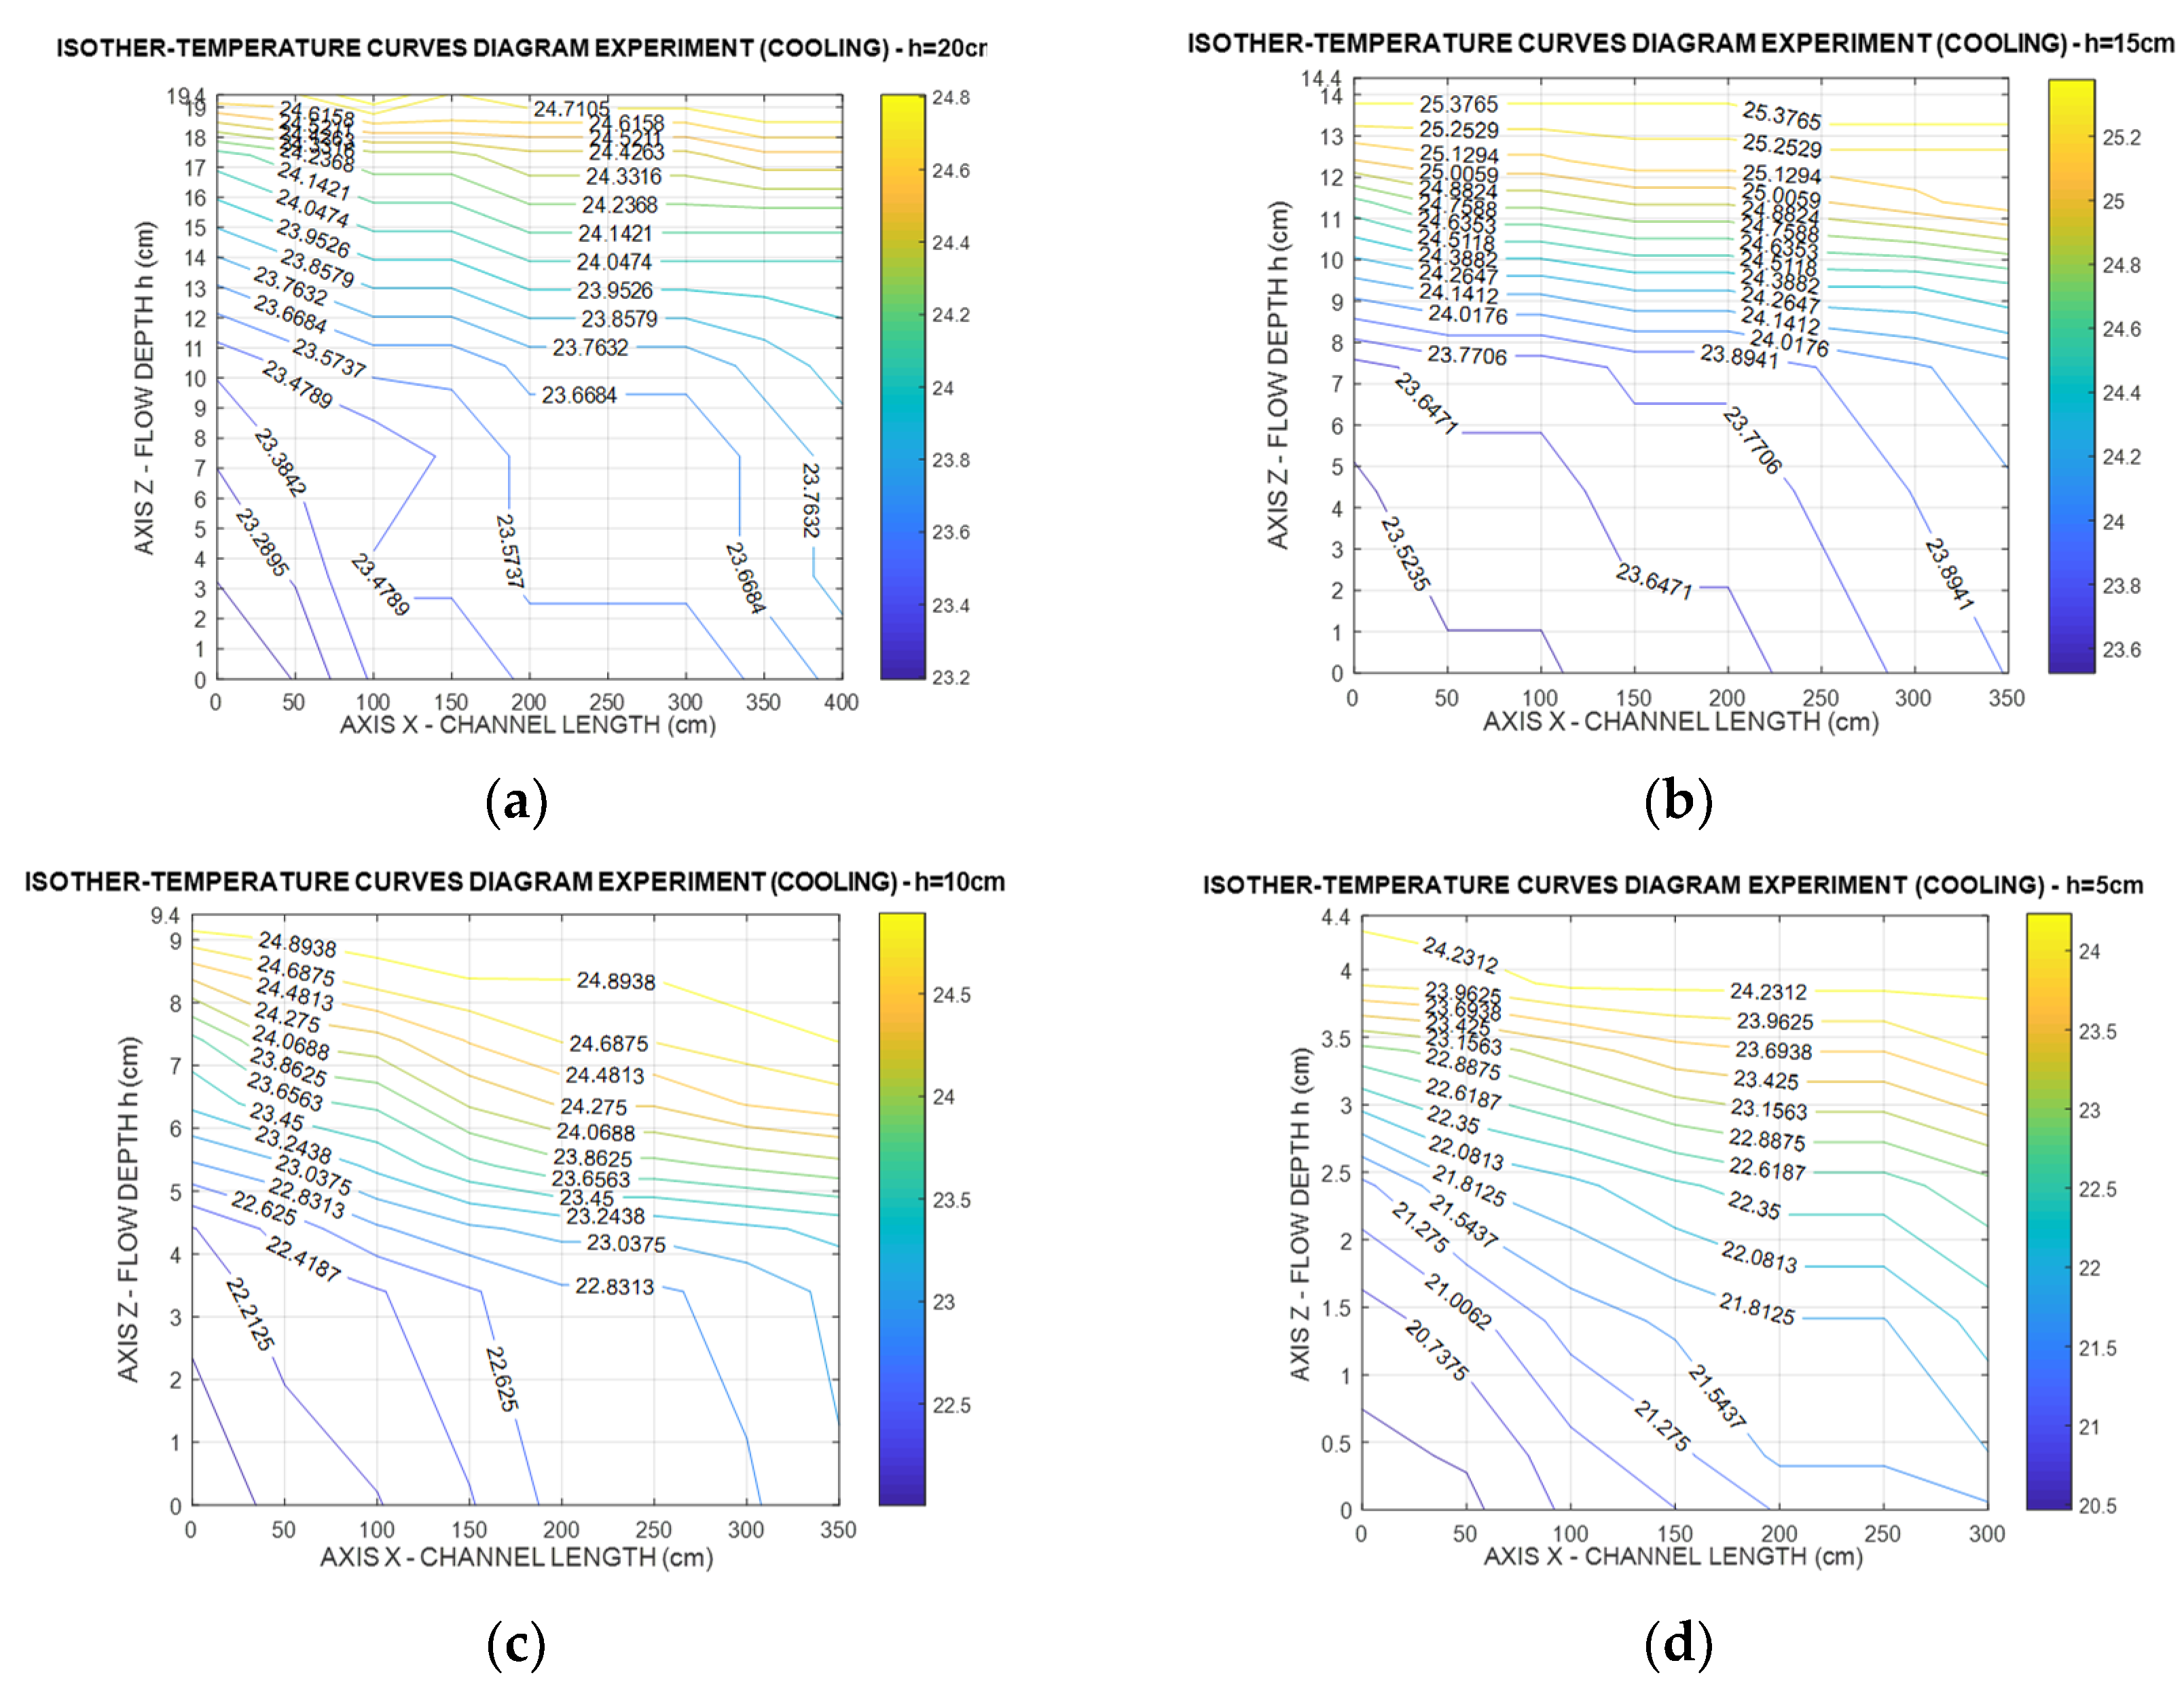
From the temperature field measurements with the effect of refrigerant load per section in the hydraulic channel, the following diagrams of isothermal curves are obtained (Figure 12):
At the end of the heating experiments’ temperature field measurements, the velocity measurements were performed by pouring rhodamine into a known position in the channel (Figure 8 and Figure 9). Then its transport along the channel’s main axis (u = cm/s) was recorded. Recording gave a first approximation of the mean values on the channel axis (X).

4. Results

The diagrams (Figure 13) show the velocity equations u (cm/s) in the corresponding order, under the thermal effect about the length of the channel (L), (Table 2):
From the diagrams (Figure 14), the equations of velocity u (cm/s) under the influence of the refrigerant load about the length of the channel (L) are obtained (Table 3):
Table 4 displays the experimental measurements: the initial temperature of water Tν (before the effect of heat), the temperature T0 of the free surface at position X = 0.00 cm under the influence of heat and when it occurs in thermal equilibrium, its length thermal wedge L (heat transfer), and finally the thickness b of the thermal mass-produced at the initial position of the experiment. Thermal wedge and thermal mass thickness measurements were derived from isothermal curve diagrams (Figure 11) and velocity diagrams (Figure 13).
According to the data in Table 4, the following diagram (Figure 15) is obtained. The length (L) of the mass transfer due to the effect of temperature T0 and the initial water temperature Tv were determined.
From the diagram (Figure 15), the equations of the form Y = a × x emerge; for the determination of the coefficient and about the flow depth, the value pairs will emerge:
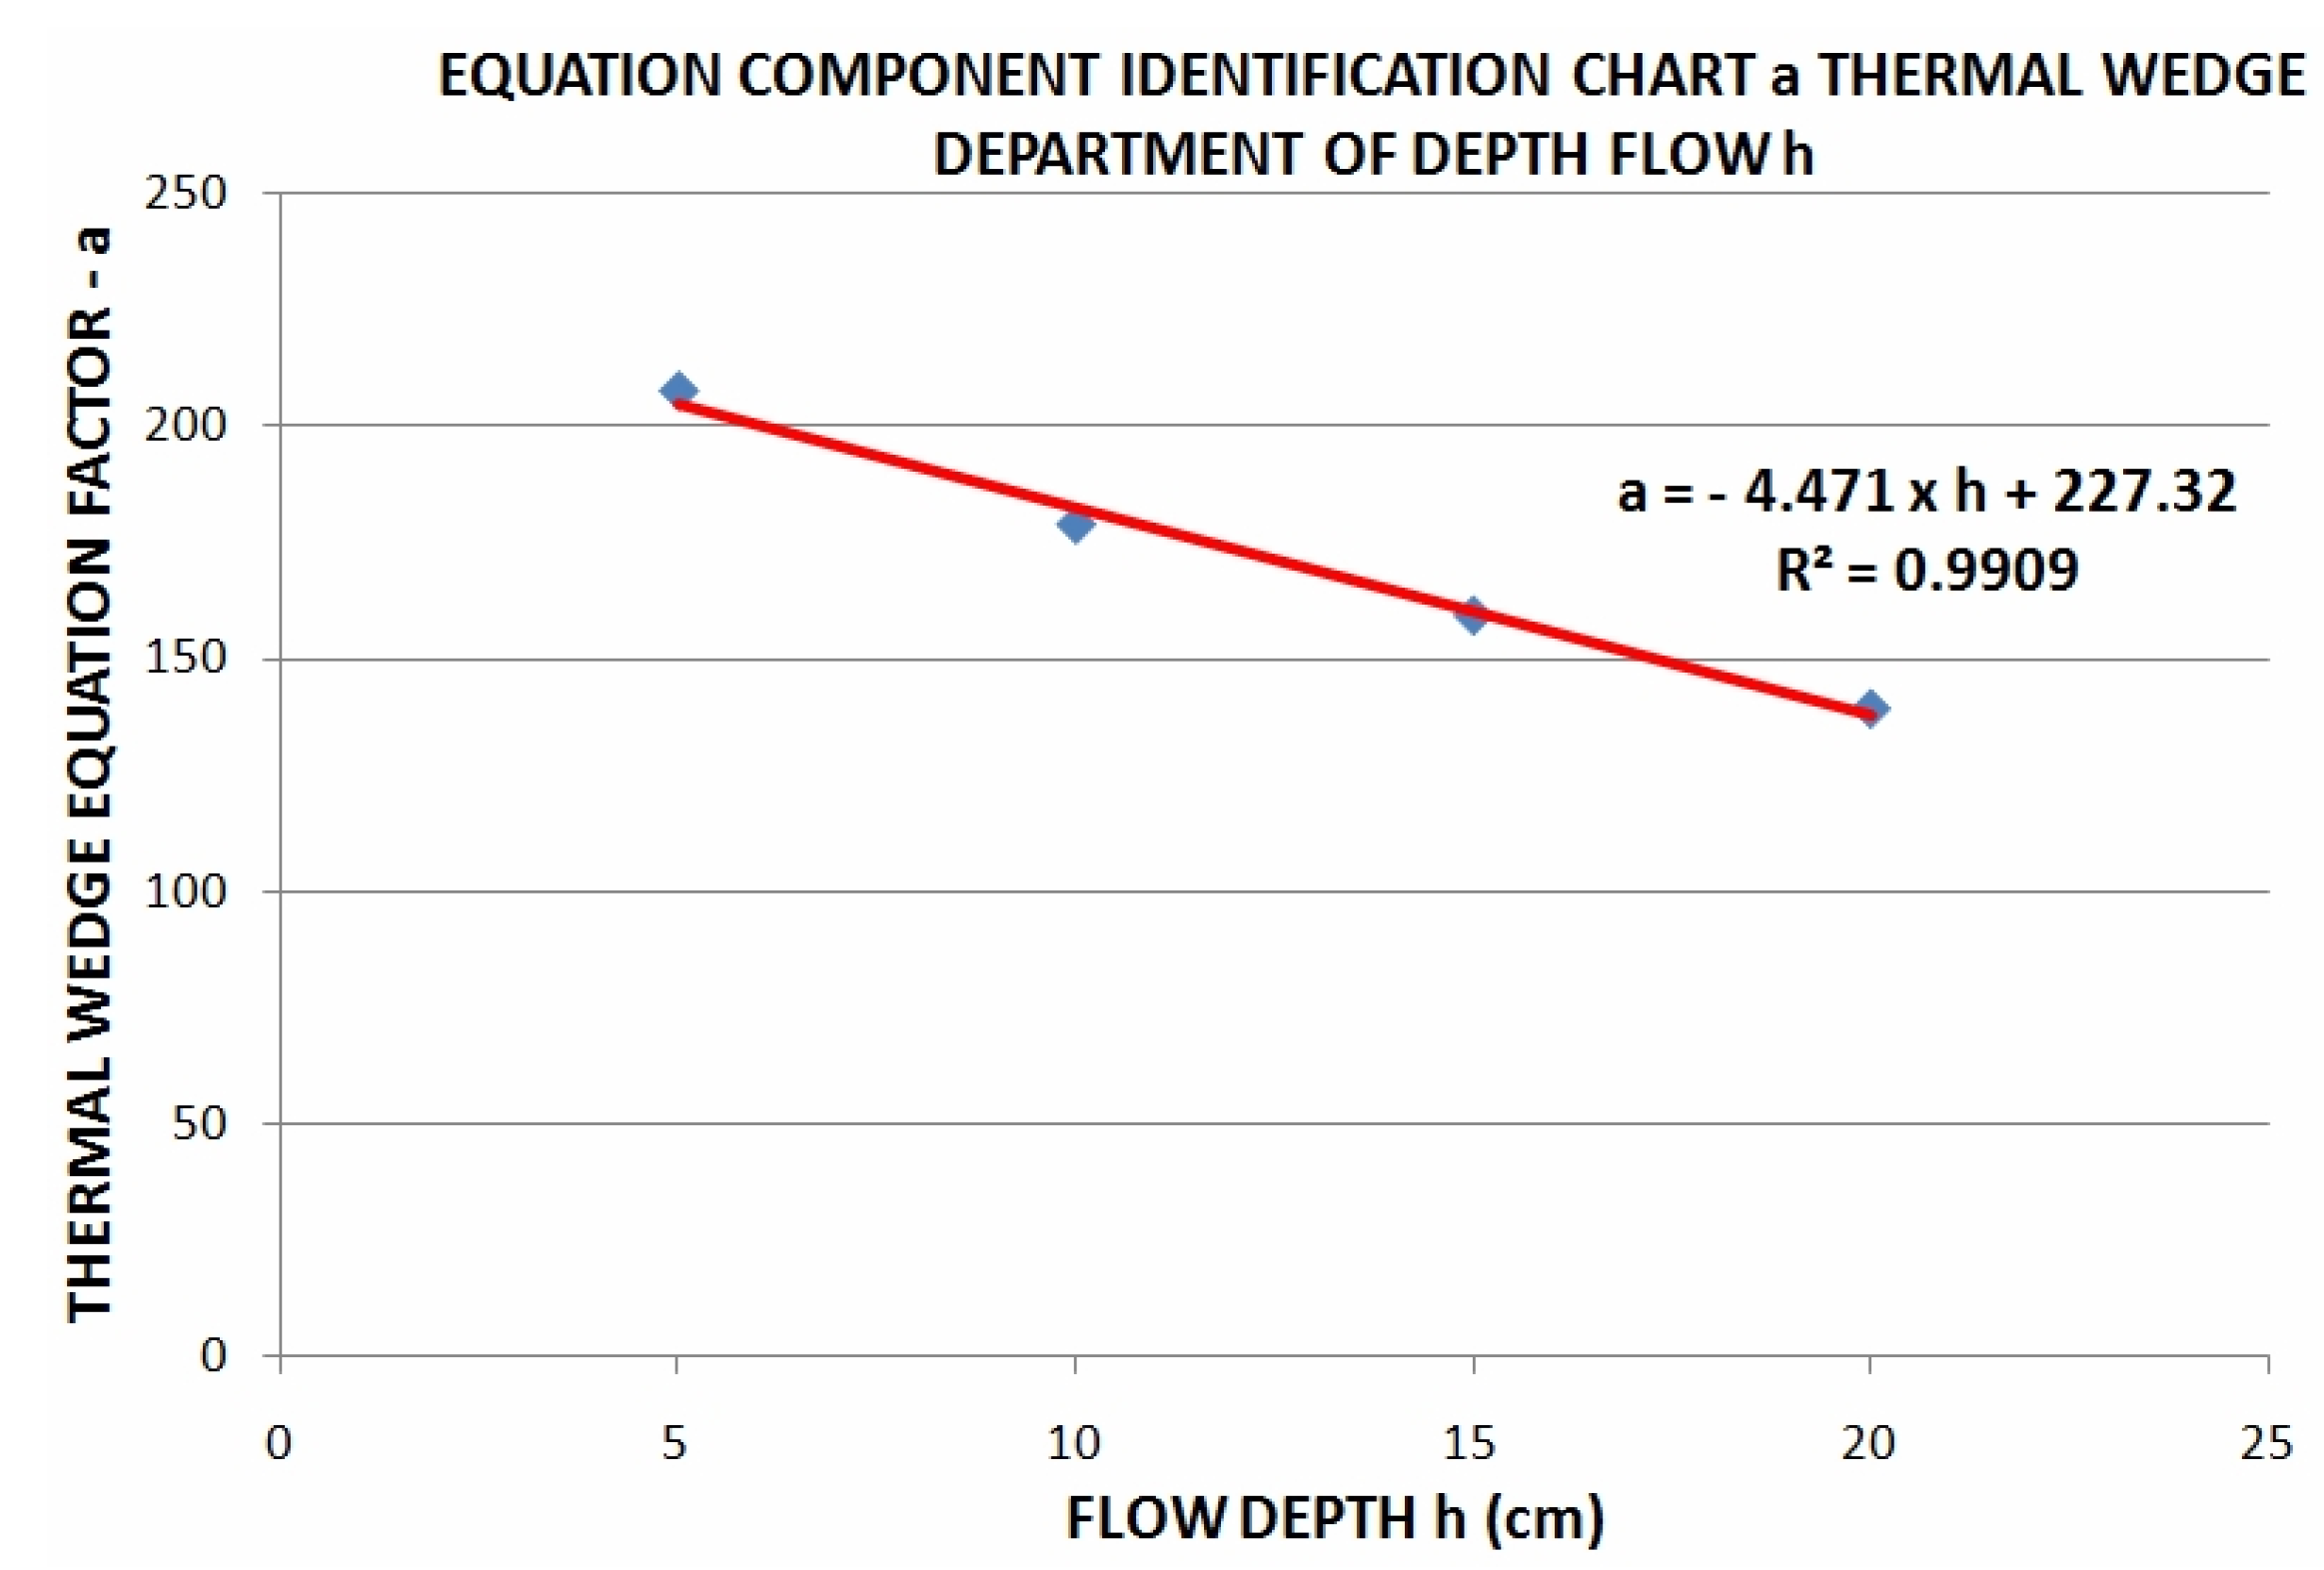
According to Table 5, the following diagram (Figure 16) is obtained:
Figure 16 shows the relationship of the coefficient of the equation as a function of flow depth h. Substituting the coefficient a in the equation of Figure 15 (Y = a × x), a new equation for determining the length of the wedge L (under the influence of heating) results, which combines the flow depth h with the temperature difference ΔΤ:
L = (−4.471 × h + 227.32) × ΔΤ (cm),
The coolant wedge and coolant thickness measurements, which are recorded in Table 4, were derived from the isothermal curve diagrams (Figure 12) and the velocity diagrams (Figure 14):
According to the data in Table 6, the following diagram is obtained (Figure 17), in which the difference between the temperature effect of temperature T0 and the initial water temperature Tv results in the transfer length of mass L for each flow depth, due to the effect of refrigerant load.

5. Discussion and Conclusions

The diagram of the isothermal curves under the influence of heating (Figure 11) shows the motion of the heated mass depending on the amount of heat given; in addition, the isothermal curves develop towards the free surface of the water due to the reduction of density. In the diagram of the isothermal curves under the influence of cooling (Figure 12), the isothermal curves are developed at the bottom of the channel due to the increase of the density of the water molecules. In cases where the isothermochromatic curves have the parallel voltage towards the axis of the channel, they show the temperature of the water in the channel without the influence of heating or cooling load. Another finding is that the net heat flow due to heating or cooling occurs at the beginning of the heated or cooled area, at this point the onset the motion of fluid begins (velocity). In this position, the thickness of the thermal or cold mass can be determined. From the velocity diagrams, the start point of the motion in the fluid is shown, the length of the thermal wedge is derived, while then the diffusion prevails. Finally, the equations of the velocities regarding the distance X from the source of the thermal radiation or the cooling load (position X = 0.00 cm) were determined. In addition, higher velocities are developed under the influence of the cooling load than those under the influence of heating. The thermal wedge temperature-length change diagrams have determined the equation of the length of the thermal wedge (mass transfer), which is imparted to the water’s surface in relation to its original temperature (ΔΤ) and depth of flow h. To determine the equation of the length of the cold wedge needs more experimentation. In addition to the diagrams, it is observed that the length of the thermal wedge increases for smaller flow depths, while the size of the cold wedge is more extended for more large flow depths. At a smaller mass, we have a greater heating thickness than the free surface of the water, as opposed to cooling, where at the greater depths, the cold wedge is trapped at the bottom of the channel in a larger mass of water and thus a more extended wedge length is obtained. The present hydraulic phenomenon requires further investigation with more accurate methods of determining the fields of velocities (e.g., field measurement of velocities with particle image velocimetry).

Author Contributions

Conceptualization and methodology, G.P. and E.K.; formal analysis and experiment, A.L.; writing—original draft preparation, A.L., E.K. and Y.S.; supervision and writing—review and editing, E.K. All authors have read and agreed to the published version of the manuscript.

Funding

This research received no external funding.

Institutional Review Board Statement

Not applicable.

Informed Consent Statement

Informed consent was obtained from all subjects involved in the study.

Data Availability Statement

Not applicable.

Conflicts of Interest

The authors declare no conflict of interest.

References

  1. Ajibade, A.O.; Ojeagbase, P.O. Steady natural convection heat and mass transfer flowt hrough a vertical porous channel with variable viscosityand thermal conductivity. Eng. Rep. 2020, 2, e12268. [Google Scholar] [CrossRef]
  2. Almutairi, K.S.M. Employing the Concept of Fractal Shape to Enhance Heat Transfer. Ph.D. Thesis, Cleveland State University, Cleveland, OH, USA, 2017. [Google Scholar]
  3. Sawyer, A.H.; Cardenas, M.B.; Buttles, J. Hyporheic temperature dynamics and heat exchange near channel-spanning logs. Water Resour. Res. 2012, 48, W01529. [Google Scholar] [CrossRef]
  4. Sinokrot, B.A.; Stefan, H.G. Stream Water-Temperature Sensitivity to Weather and Bed Parameters. J. Hydraul. Eng. 1994, 120, 722–736. [Google Scholar] [CrossRef]
  5. Hester, E.T.; Doyle, M.W.; Poole, G.C. The influence of in-stream structures on summer water temperatures via induced hyporheic exchange. Limnol. Oceanogr. 2009, 54, 355–367. [Google Scholar] [CrossRef]
  6. Grace, W.; Jasperse, J.; Seymour, D.; Constantz, J. Estimation of Hydraulic Conductivity in an Alluvial System Using Temperatures. Ground Wat. 2004, 42, 890–901. [Google Scholar] [CrossRef]
  7. Kazemi, M.A. Experimental and Numerical Study on Evaporation of Water at Low Pressures. Ph.D. Thesis, University of Alberta, Edmonton, AB, Canada, 2017. [Google Scholar]
  8. Gao, P.; Le Person, S.; Favre-Marinet, M. Scale effects on hydrodynamics and heat transfer in two-dimensional mini and microchannels. Int. J. Therm. Sci. 2002, 41, 1017–1027. [Google Scholar] [CrossRef] [Green Version]
  9. Blythman, R. Hydrodynamics and Heat Transfer of Laminar Pulsating Flow in a Rectangular Channel. Ph.D. Thesis, University of Dublin, Dublin, Ireland, 2017. [Google Scholar]
  10. Lyubimova, T.; Lepikhin, A.; Konovalov, V.; Parshakova, Y.; Tiunov, A. Formation of the density currents in the zone of confluence of two rivers. J. Hydr. 2014, 508, 328–342. [Google Scholar] [CrossRef]
Figure 1. Basin with fluid of different temperatures in different areas.
Environsciproc 21 00060 g001
Figure 2. The general layout of the experiment in the hydraulic channel.
Environsciproc 21 00060 g002
Figure 3. The layout of the heating experiment.
Environsciproc 21 00060 g003
Figure 4. The layout of the cooling experiment.
Environsciproc 21 00060 g004
Figure 5. Density measuring device.
Environsciproc 21 00060 g005
Figure 6. Temperature measurement.
Environsciproc 21 00060 g006
Figure 7. The measurement positions on Z-axis.
Environsciproc 21 00060 g007
Figure 8. The rhodamine in the heating.
Environsciproc 21 00060 g008
Figure 9. The rhodamine in the cooling.
Environsciproc 21 00060 g009
Figure 10. Density–temperature diagram.
Environsciproc 21 00060 g010
Figure 11. (a) Diagram of isotherms curves (thermal load), depth = 20, exp.5. (b) Diagram of isotherms curves (thermal load), depth = 15, exp.5. (c) Diagram of isotherms curves (thermal load), depth = 10, exp.5. (d) Diagram of isotherms curves (thermal load), depth = 5, exp.5.
Environsciproc 21 00060 g011
Figure 12. (a) Diagram of isotherms curves (cooling load), 20 cm. (b) Diagram of isotherms curves (cooling load), 15 cm. (c) Diagram of isotherms curves (cooling load), 10 cm. (d) Diagram of isotherms curves (cooling load), 5 cm.
Environsciproc 21 00060 g012
Figure 13. (a) Chart of mean heating velocity fields u (cm/s) on the channel axis (X) for depth = 20 cm. (b) Chart of mean heating velocity fields u (cm/s) on the channel axis (X) for depth = 15 cm. (c) Chart of mean heating velocity fields u (cm/s) on the channel axis (X) for depth = 10 cm. (d) Chart of mean heating velocity fields u (cm/s) on the channel axis (X) for depth = 5 cm.
Environsciproc 21 00060 g013
Figure 14. Chart of cooling speed fields u (cm/s) on the channel axis (X) depth = 5, 10, 15, 20 cm.
Environsciproc 21 00060 g014
Figure 15. Thermal wedge change chart as a function of temperature difference.
Environsciproc 21 00060 g015
Figure 16. Equation component identification chart a thermal wedge department of depth flow.
Environsciproc 21 00060 g016
Figure 17. Cold wedge change chart as a function of temperature difference.
Environsciproc 21 00060 g017
Table 1. Measurements of supply water density.
TankTemperature °CDensity ρ (gr/cm3)TankTemperatureDensity ρ (gr/cm3)
measurement 117.20.9975measurement 917.70.9975
measurement 217.60.9975measurement 1016.10.9985
measurement 318.00.9975measurement 1114.10.9985
measurement 419.10.9970measurement 1212.40.9990
measurement 520.20.9970measurement 1310.20.9990
measurement 621.20.9965measurement 148.50.9995
measurement 722.40.9965measurement 155.81.0000
measurement 823.60.9960measurement 164.41.0000
Table 2. Mean velocity equations under the influence of heating.
DepthEquationDepthEquationDepthEquation
20 cmu = −0.033 × ln(L) + 0.192015 cmu = −0.017 × ln(L) + 0.145710 cmu = −0.017 × ln(L) + 0.0996
20 cmu = −0.021 × ln(L) + 0.114315 cmu = −0.018 × ln(L) + 0.13855 cmu = −0.043 × ln(L) + 0.3000
20 cmu = −0.021 × ln(L) + 0.162115 cmu = −0.016 × ln(L) + 0.12055 cmu = −0.028 × n(L) + 0.2198
20 cmu = −0.017 × ln(L) + 0.133110 cmu = −0.009 × ln(L) + 0.18175 cmy = −0.025 × ln(L) + 0.1934
20 cmu = −0.042 × ln(L) + 0.346710 cmu = −0.030 × ln(L) + 0.21715 cmu = −0.022 × ln(L) + 0.1755
15 cmu = −0.030 × ln(L) + 0.223710 cmu = −0.032 × ln(L) + 0.21345 cmu = −0.034 × ln(L) + 0.2018
15 cmu = −0.024 × ln(L) + 0.181210 cmu = −0.018 × ln(L) + 0.1111
Table 3. Medium velocity equations under the influence of refrigerant load.
DepthEquationDepthEquation
20 cmu = −0.293 × ln(x) + 2.449310 cmu = −0.245 × ln(x) + 1.8618
15 cmu = −0.236 × ln(x) + 2.05075 cmu = −0.133 × ln(x) + 0.9225
Table 4. Temperature changes and thermal wedge.
Heat TransferFlow Depth (cm)Initial Water Temperature Τν (°C)Thermal Equilibrium Temperature Τo the Position Χ = 0.0 cm (°C)Experiment Thermal Wedge Length L (cm)b–Thermal Mass Thickness in Place X = 0.0 (cm)
experiment 12015.516.31702.6
experiment 22015.717.52604.0
experiment 32015.417.93205.0
experiment 42015.518.33806.2
experiment 52015.318.850010.5
experiment 11518.920.22002.2
experiment 21516.018.22802.5
experiment 31515.618.54002.8
experiment 41515.418.65003.0
experiment 51515.419.06803.5
experiment 11019.420.43001.3
experiment 21018.120.44001.6
experiment 31019.422.46002.2
experiment 41018.822.46502.6
experiment 51019.423.66803.0
experiment 1521.021.51501.7
experiment 2519.921.93202.4
experiment 3520.222.54303.0
experiment 4520.322.95803.4
experiment 5520.423.46803.8
Table 5. Pair of flow depth values and coefficient a of the equation of thermal wedge L.
Flow Depth (cm)Coefficient a
5207.59
10179.04
15159.52
20139.58
Table 6. Temperature changes and cooling wedge.
Cooling Flow Depth (cm)Initial Water Temperature Τν (°C)Thermal (°C) Equilibrium Temperature Τo the Position Χ = 0.0 cmExperiment Cooling Coil Length
L (cm)
* Length Estimation from Gear Chart
*L (cm)
b–Coolant Thickness in Place X = 0.0 (cm)
experiment 12024.423.2680230014.0
experiment 21525.523.468021009.0
experiment 31023.621.868013006.5
experiment 4524.120.26808003.0
* Calculated the length of the wedge until it attained zero velocity.
Publisher’s Note: MDPI stays neutral with regard to jurisdictional claims in published maps and institutional affiliations.