Abstract
Understanding the importance of factors intervening in the breakdown of water distribution networks and their service connections can help in the decision-making process of where to invest resources in infrastructure rehabilitation or water loss control. The present contribution seeks to present some results on the application of machine learning models in service connection databases as a tool to help understand the importance of the factors that act in the deterioration of the infrastructure. The results found indicated that such tools can collaborate with the exploration and understanding of the breakdown process in the service connections in water systems.
1. Introduction
Bursting and leaks in network components of water supply systems reduce the continuity and regularity of service provision, in addition to increasing water losses, and operating and maintenance costs. Therefore, an important approach in the management of a water supply infrastructure is understanding the contributing factors to the occurrence of bursting and leaks. Consequently, decisions could be supported by data to contribute to the improvement of water systems performance. Different approaches have been used to predict bursting and leaks in water distribution networks, such as statistical models, probabilistic models, and machine learning. Thus, the objective of this study is to analyze and propose machine learning models to predict the bursting and leaks in water connections, since a significant portion of water leakage occurs in those connections.
Over the last years, machine learning (ML) methods have been used to predict water distribution network (WDN) failures, investigating the intervening factor relationships between the variables that explain the complex pipe failure process, due to their potential to indicate accurate predictions, as well as studies on data validation and improvement [1]. An ML-data-driven approach identifies the relationships among input and output variables, despite the probabilistic and deterministic models, which need the definition of covariate relationships. These models, applied to WDN failures, include artificial neural networks [2,3,4,5,6,7], dynamic Bayesian networks [8], logistic regression models [9], evolutionary polynomial regression [10], machine learning algorithms such as Random Forest and XGBoost [11,12,13], genetic programming models [14,15], evolutionary polynomial regression [16,17,18], support vector machine [19], support vector classification [20], and extreme machine learning [21].
The following methods were used to predict and classify water connection vulnerability to ruptures and leaks: Logistic regression, K-nearest neighbors, support vector machine, decision tree classifier, naive Bayes, random forest, AdaBoost, gradient boosting, and XGBoost. The data used in this study were collected from water supply systems in Brasília, the capital of Brazil. Altogether, the cadastral base investigated has 543,168 water service connections and 5.7 thousand kilometers of water distribution network, consisting of materials such as high-density polyethylene, cast iron, and polyvinyl chloride. The infrastructure has been implemented since the 1960s. The historical database on ruptures and leaks in water connections/water service lines covers the period between January 2015 and April 2020. Data regarding trigger deterioration factors was compilated, such as material, diameter, network implantation year, and water connection installation year, in addition to the operational pressures of the water distribution network (minimum and maximum pressures, besides pressure range).
The best model obtained a score of 0.61, presenting the potential for a further investigation looking for opportunities to achieve better predictions. Moreover, the ML models delivered the importance of the analyzed features, which can contribute to the WDN’s asset management process. In addition, the performances obtained from different machine learning (ML) models were compared.
2. Materials and Methods
The investigation using ML to predict leaks in water service connections used data from Caesb’s WDN, the water and wastewater services provider in Brasília/Distrito Federal, the capital of Brazil. Figure 1 shows Brasília’s location and identifies the areas included in the study case; it depicts an example of operational data used, and the maximum operating pressure.
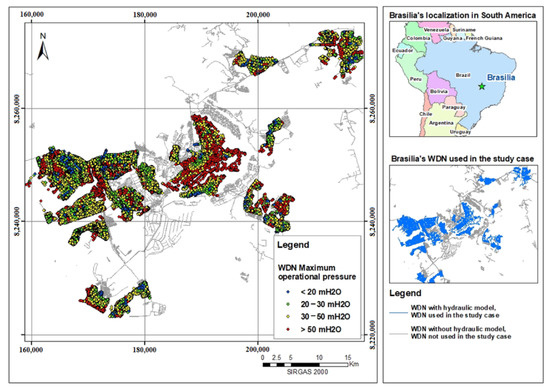
Figure 1.
Brasília/Distrito Federal, Brazil’s capital, localization. Example of data used.
The study case uses 5.7 thousand WDN kilometers and 543,168 water service connections, which represent 60% of the total WDN. The selected WDN were chosen where there is a hydraulic model built into the networks in Epanet and InfoWater, which allows the use of simulated operational data to compose parameters in ML models.
By using hydraulic models, operational data from pressure (maximum pressure, minimum pressure, average pressure, and pressure range) were used; moreover, cadastral information from the infrastructure was used, such as pipe material, pipe extension, pipe diameter, pipe age, and service connection age. Then, those features were applied to investigate leaked and non-leaked water service connections.
The database is composed of 38 variables grouped into four groups according to the variable’s origin, including operational aspects (10 variables), physical aspects (07), commercial aspects (04), and environmental aspects (17). The variable “LEAK” is the categorical target variable used in the models, corresponding to (i.) water service connections that did not have a visible leak repaired, and (ii.) water service connections that had a visible leak repaired. Table 1 depicts the variables used and their descriptions.

Table 1.
Variables applied to machine learning models.
The database was processed in two scenarios, with and without the use of variables obtained through hydraulic simulation, to assess the possible gain in accuracy using such data. The models were applied in 14 different distribution reservoirs throughout the city for the customized identification of failure predictors in those regions.
Initially, linear support vector machine, radial support vector machine, logistic regression, K-nearest neighbors, decision tree, naive Bayes, and random forest were used for prediction. Furthermore, ensemble learning techniques were applied in these models for score improvement. Finally, the best model was processed with hyperparameter tuning and cross-validation for final score enhancement.
Therefore, the data frame was built using the information provided by hydraulic models and the cadastral data in a geographic information system (GIS) and then analyzed using ML models. All data processing was done using Python 3.7 libraries, such as NumPy, Pandas, Matplotlib, Seaborn, SKLearn, and Imblearn.
3. Results and Discussion
The model that presented the best performance was the AdaBoost, performing at 57.88% average accuracy for all reservoir distribution areas without the use of hydraulic data. With the use of hydraulic variables obtained by the simulation of distribution networks, the average accuracy obtained was 59.23%.
The AdaBoost Machine Learning model presented the highest accuracy; thus, it was submitted to hyperparameter optimization to provide a marginal performance increment. Table 2 summarizes the four AdaBoost application scenarios with and without hyper-parameterization, with and without hydraulic data in the database. After processing by hyper-parameterization, AdaBoost achieved an average accuracy of 59.70% using hydraulic data.
Table 2.
Average accuracy of AdaBoost and AdaBoost after hyperparameter optimization.
In general terms, without the application of hydraulic data, the variables age of the connection and the slope of the land under the distribution network that provides a derivation to the connection are highlighted. In sequence, the age and diameter of the network perform as relevant variables. In general, when the database is processed with hydraulic variables, the main failure predictors are connection age, maximum operating pressure, and pressure variation. Furthermore, the application of machine learning models according to the service areas of distribution networks allowed the differences between the conditions of water connections in these areas to be compared.
One of the outputs of the models is the relevance obtained for the variables used in the database. Figure 2 shows the weight of the variables calculated by the AdaBoost, XGBoost, gradient boost, and random forest models, as a comparison between the weights given by these models, for one of the studied areas.
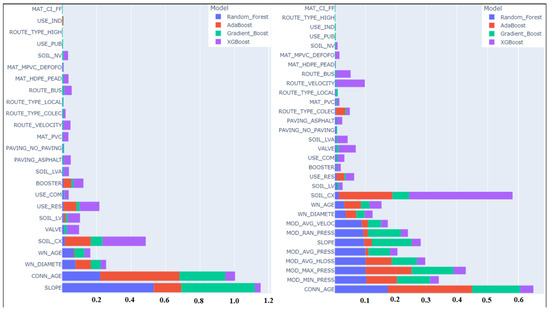
Figure 2.
Relevance of predictor variables in a given WDN. On the left, processing without hydraulic data from the networks. On the right, results of the relevance of the variables in processing considering the hydraulic data.
Through Figure 2, it can be inferred that the actions to replace the water service connections should prioritize areas with greater slope, old connections, and settled in a haplic cambisol. With the use of hydraulic variables to increase accuracy, the variables related to operating pressures can refine the targeting of actions for infrastructure management or leak location.
As for the predictor variables, it is concluded that without hydraulic data, the age of the connection and the slope of the land under the pipe distribution network pipe are the most relevant variables. Regarding the application considering hydraulic variables, there is a significant prediction through high operating pressures and the age of the network and water connection. Such considerations reiterate that pressure reduction, one of the methods for reducing losses, mitigates the occurrences of structural failure of the pipes. The other operational, physical, environmental, and commercial variables make up the detail in the classification of the models. It was observed that the regionalized analysis by distribution reservoir allows the relevance of different materials and soils to add accuracy to the process.
Author Contributions
Conceptualization, C.G. and A.S.; methodology, C.G.; software, C.G.; validation, C.G.; formal analysis, A.S.; investigation, C.G.; resources, C.G.; data curation, C.G.; writing—original draft preparation, C.G.; writing—review and editing, A.S.; visualization, C.G.; supervision, A.S.; project administration, A.S. All authors have read and agreed to the published version of the manuscript.
Funding
This research received no external funding.
Institutional Review Board Statement
Not applicable.
Informed Consent Statement
Not applicable.
Data Availability Statement
The data presented in this study are available on request from the first author. The data are not publicly available due to the policy on access to information of the water utility.
Conflicts of Interest
The authors declare no conflict of interest.
References
- Snider, B.; McBean, E.A. Watermain breaks and data: The intricate relationship between data availability and accuracy of predictions. Urban Water J. 2020, 17, 163–176. [Google Scholar] [CrossRef]
- Achim, D.; Ghotb, F.; McManus, K.J. Prediction of Water Pipe Asset Life Using Neural Networks. J. Infrastruct. Syst. 2007, 13, 26–30. [Google Scholar] [CrossRef]
- Ahn, J.; Lee, S.; Lee, G.; Koo, J. Predicting Water Pipe Breaks Using Neural Network. Water Sci. Technol. Water Supply 2005, 5, 159–172. [Google Scholar] [CrossRef]
- Asnaashari, A.; McBean, E.A.; Gharabaghi, B.; Tutt, D. Forecasting Watermain Failure Using Artificial Neural Network Modelling. Can. Water Resour. J. 2013, 38, 24–33. [Google Scholar] [CrossRef]
- Jafar, R.; Shahrour, I.; Juran, I. Application of Artificial Neural Networks (ANN) to Model the Failure of Urban Water Mains. Math. Comput. Model. 2010, 51, 1170–1180. [Google Scholar] [CrossRef]
- Tabesh, M.; Soltani, J.; Farmani, R.; Savic, D. Assessing Pipe Failure Rate and Mechanical Reliability of Water Distribution Networks Using Data-Driven Modeling. J. Hydroinform. 2009, 11, 1–17. [Google Scholar] [CrossRef]
- Zangenehmadar, Z.; Moselhi, O. Assessment of Remaining Useful Life of Pipelines Using Different Artificial Neural Networks Models. J. Perform. Constr. Facil. 2016, 30, 04016032. [Google Scholar] [CrossRef]
- Demissie, G.; Tesfamariam, S.; Sadiq, R. Prediction of pipe failure by considering time-dependent factors: Dynamic Bayesian belief network model. ASCE-ASME J. Risk Uncertainty Eng. Syst. Part A Civ. Eng. 2017, 3, 04017017. [Google Scholar] [CrossRef]
- Kaushik, G.; Manimaran, A.; Vasan, A.; Sarangan, V.; Sivasubramaniam, A. Cracks under pressure? Burst prediction in water networks using dynamic metrics. In Proceedings of the 29th AAAI Conference on Innovative Applications, Association for the Advancement of Artificial Intelligence, San Francisco, CA, USA, 4–9 February 2017. [Google Scholar]
- Farmani, R.; Kakoudakis, K.; Behzadian, K.; Butler, D. Pipe failure prediction in water distribution systems considering static and dynamic factors. Procedia Eng. 2017, 186, 117–126. [Google Scholar] [CrossRef]
- Winkler, D.; Haltmeier, M.; Kleidorfer, M.; Rauch, W.; Tscheikner-Gratl, F. Pipe Failure Modelling for Water Distribution Networks Using Boosted Decision Trees. Struct. Infrastruct. Eng. 2018, 14, 1402–1411. [Google Scholar] [CrossRef]
- Kumar, A.; Rizvi, S.A.; Brooks, B.; Vanderveld, R.A.; Wilson, K.H.; Kenney, C.; Edelstein, S.; Finch, A.; Maxwell, A.; Zuckerbraun, J.; et al. Using Machine Learning to Assess the Risk of and Prevent Water Main Breaks. In Proceedings of the 24th ACM SIGKDD International Conference on Knowledge Discovery and Data Mining, London, UK, 19–23 August 2018. [Google Scholar] [CrossRef]
- Snider, B.; McBean, E.A. Improving Time to Failure Predictions for Water Distribution Systems Using Gradient Boosting Algorithm. In Proceedings of the WDSA/CCWI Joint Conference Proceedings, Kingston, ON, Canada, 23–25 July 2018. [Google Scholar]
- Xu, Q.; Chen, Q.; Li, W. Application of Genetic Programming to Modeling Pipe Failures in Water Distribution Systems. J. Hydroinform. 2011, 13, 419–428. [Google Scholar] [CrossRef]
- Xu, Q.; Chen, Q.; Li, W.; Ma, J. Pipe Break Prediction Based on Evolutionary Data-Driven Methods with Brief Recorded Data. Reliab. Eng. Syst. Saf. 2011, 96, 942–948. [Google Scholar] [CrossRef]
- Berardi, L.; Kapelan, O.; Giustolisi, O.; Savic, D. Development of Pipe Deterioration Models for Water Distribution Systems Using EPR. J. Hydroinform. 2008, 10, 113–126. [Google Scholar] [CrossRef]
- Savic, D.; Giustolisi, O.; Laucelli, D. Asset Deterioration Analysis Using Multi-Utility Data and Multi-Objective Data Mining. J. Hydroinform. 2009, 11, 211–224. [Google Scholar] [CrossRef]
- Laucelli, D.; Rajani, B.; Kleiner, Y.; Giustolisi, O. Study on Relationships between Climate-Related Covariates and Pipe Bursts Using Evolutionary-Based Modelling. J. Hydroinform. 2014, 16, 743. [Google Scholar] [CrossRef]
- Aydogdu, M.; Firat, M. Estimation of Failure Rate in Water Distribution Network Using Fuzzy Clustering and LS-SVM Methods. Water Resour. Manag. 2015, 29, 1575–1590. [Google Scholar] [CrossRef]
- Robles-Velasco, A.; Cortés, P.; Muñuzuri, J.; Onieva, L. Prediction of pipe failures in water supply networks using logistic regression and support vector classification. Reliab. Eng. Syst. Saf. 2020, 196, 106754. [Google Scholar] [CrossRef]
- Sattar, A.M.; Ertuğrul, Ö.F.; Gharabaghi, B.; McBean, E.; Cao, J. Extreme learning machine model for water network management. Neural Comput. Appl. 2019, 31, 157–169. [Google Scholar] [CrossRef]


Publisher’s Note: MDPI stays neutral with regard to jurisdictional claims in published maps and institutional affiliations. |
© 2022 by the authors. Licensee MDPI, Basel, Switzerland. This article is an open access article distributed under the terms and conditions of the Creative Commons Attribution (CC BY) license (https://creativecommons.org/licenses/by/4.0/).