Proceeding Paper

Hydraulic Behavior Assessment of Type A and Type B Piano Key Weirs from Experimental and Numerical Results †

by
Guadalupe Torre-Gómez
1,2,*,
Sebastien Erpicum
3,
Francesco Pugliese
2 and
Maurizio Giugni
2
1
Instrumentación Geotécnica y Estructural, INGE S.L., 33192 Asturias, Spain
2
Department of Civil, Architectural and Environmental Engineering, University of Naples Federico II, 80125 Naples, Italy
3
Hydraulics in Environmental and Civil Engineering (HECE), University of Liege, B-4000 Liège, Belgium
*
Author to whom correspondence should be addressed.
Presented at the International Conference EWaS5, Naples, Italy, 12–15 July 2022.
Environ. Sci. Proc. 2022, 21(1), 84; https://doi.org/10.3390/environsciproc2022021084
Published: 17 January 2023

Abstract

:
Since their development, as a result of an improvement of labyrinth weirs, Piano Key Weirs (PKWs) have been implemented as (a) a flood safety structure for gravity dams, allowing to also increase their storage volume, and (b) in river systems to increase the water level for hydropower or navigation purposes. The rectangular folded crest, consistent with apexes inclined by turns in the upstream and in the downstream direction, turns the PKW a device with a high discharge capacity, especially useful during wet extreme events. Nevertheless, several modifications have been implemented in the PKW geometry, capable to improve and, in some cases, worsen their efficiency. Herein, an experimental and numerical assessment, using the ANSYS Fluent Computational Fluid Dynamics (CFD) software, of the discharge coefficient is presented for two PKW configurations, evaluating the specific discharge over the upstream, downstream, and lateral crests, the velocity in the inlet and outlet keys, and the water surface profile, as well. The investigated configurations are a symmetric type A, designed following the recommended optimal values, and a type B model, with the same geometric features as type A. Results showed that for the specific geometries, the type B is more efficient for lower head; however, once the filling of the outlet key occurs, the type B efficiency is reduced, leading to type A becoming more efficient.

1. Introduction

Labyrinth weirs were developed with the purpose of increasing the crest print length for a given space, which increases the discharge capacity. Afterwards, the Piano Key Weir (PKW) was proposed by Lemperiere and Ouamane [1], aimed at limiting the base of a labyrinth weir. The PKW planform is defined by a rectangular shape, but their apexes are inclined alternately in both upstream and downstream directions. The reduced footprint makes the PKW more suitable to be installed on the top of a dam, working as the spillway structure and increasing the discharge capacity and storage volume.
Due to the complex geometry of the PKW, Pralong et al. [2] defined a specific nomenclature, reported in Table 1.
Likewise, to improve the knowledge of the discharge capacity of a PKW, plenty of authors [3,4,5,6,7,8,9,10,11] have carried out experimental and numerical studies to assess which parameters mainly affect the discharge efficiency of this device. The outcomes of these studies showed that, aiming to maximize the discharge capacity, the following dimensionless ratios should be considered: P/Wu = 1.33, Wi/Wo = 1.25 ÷ 1.5, Bo/Bi ≥ 1. Nonetheless, from an economic viewpoint, an optimal value for the P/Wu ratio can be selected equal to 0.83.
In [1,2,3,4,5,6,7,8,9,10,11], four types of PKW were defined according to their overhangs: type A having symmetric overhangs, type B with a single upstream overhang, type C with a single downstream overhang, and type D which does not present overhangs [12]. After several PKW types, Noui and Ouamane [3] and Cicero and Delisle [13] observed that type B was more efficient than type A [13], whereas type C resulted to be less efficient than the type A. Machiels et al. [14] tested several Bo/Bi ratios and found out that for low heads, the type B configuration (Bo/Bi = ∞) is the most efficient. Nevertheless, this efficiency decreases for a higher head, rendering the type A more efficient. These results contradicted previous studies, proving the necessity of further comparison between the discharge efficiency of type A and type B in different ranges of dimensionless ratios.
Therefore, the purpose of this paper is to assess the hydraulic efficiency of both configurations, PKWA and PKWB, depending on the upstream head, aiming at clarifying previous results [3,13,14]. The assessment will evaluate the discharge efficiency of each specific crest, namely, upstream, downstream, and lateral crests by investigating experimentally and numerically two types of PKW. The former, a symmetric type A, PKWA, designed following the dimensionless ratios presented while considering an intermediate value for P/Wu, and the latter, a type B model, PKWB, with the same height and crest trace but with a Bo/Bi ratio equal to ∞ (Table 2).
Specifically, the procedure consisted of testing experimentally and numerically the PKWA, whereas only numerically investigating the PKWB type. Coupling the numerical and the experimental approaches allowed collecting information for a wider range of Hup/P.

2. Materials and Methods

2.1. Experimental Setup

The experiments were carried out at the Hydraulic Laboratory of the Department of Civil, Architectural and Environmental Engineering, University of Naples Federico II. The experimental setup test range was fixed to limit scale effects by setting a minimum upstream head Hup > 3 cm [15]. A Perspex test channel 3.6 m long, 0.455 m wide, and 1 m high was built up to carry out the experimental research. The upstream side of the channel was located inside an open tank 4 m long, 1.92 m wide, and a maximum water level of about 0.59 m, with two 1 m long walls of the same width as the channel. The intake is a tank 1 m long and 4 m wide. The pump installed can provide a maximum flow of 80 L/s, establishing an upper limit for the discharge of the experimental tests. The connection between the two tanks was a grid that, in addition to the convergent walls, ensured uniform flow conditions. The longitudinal slope of the channel was equal to zero.
Upstream flow water depth data were taken with a gauge of a ±1 mm reading accuracy while the tank inflow was measured with a diaphragm flow meter with an average value of accuracy of ±1.79%. The accuracy of measurements was estimated using the Error Propagation Method [16], considering the individual variable uncertainty of each measurement method applied in the laboratory. The upstream mean velocity was calculated as:
v = Q W · h
where Q is the inflow (m3/s), W is the width of the channel which corresponds to the PKW width (m), and h is the water level upstream measured with the gauge (m). To calculate the discharge capacity, the discharge coefficient, CPKW, has been computed using the Poleni discharge equation:
C P K W = Q P K W W 2 g H u p 3
where CPKW is the discharge coefficient for a PKW (-), QPKW is the discharge of a PKW (m3/s) and Hup the head upstream the weir (m), calculated as:
H u p = h P + v 2 / 2 g
where P is the PKW height (m) and v 2 / 2 g is the kinetic term (m). A total of 21 flowrates were tested, setting the smallest flowrate of the range to obtain a minimum head above 3 cm. The range of Hup/P experimentally tested was 0.059 ≤ Hup/P ≤ 0.131 for PKWA.

2.2. Numerical Model
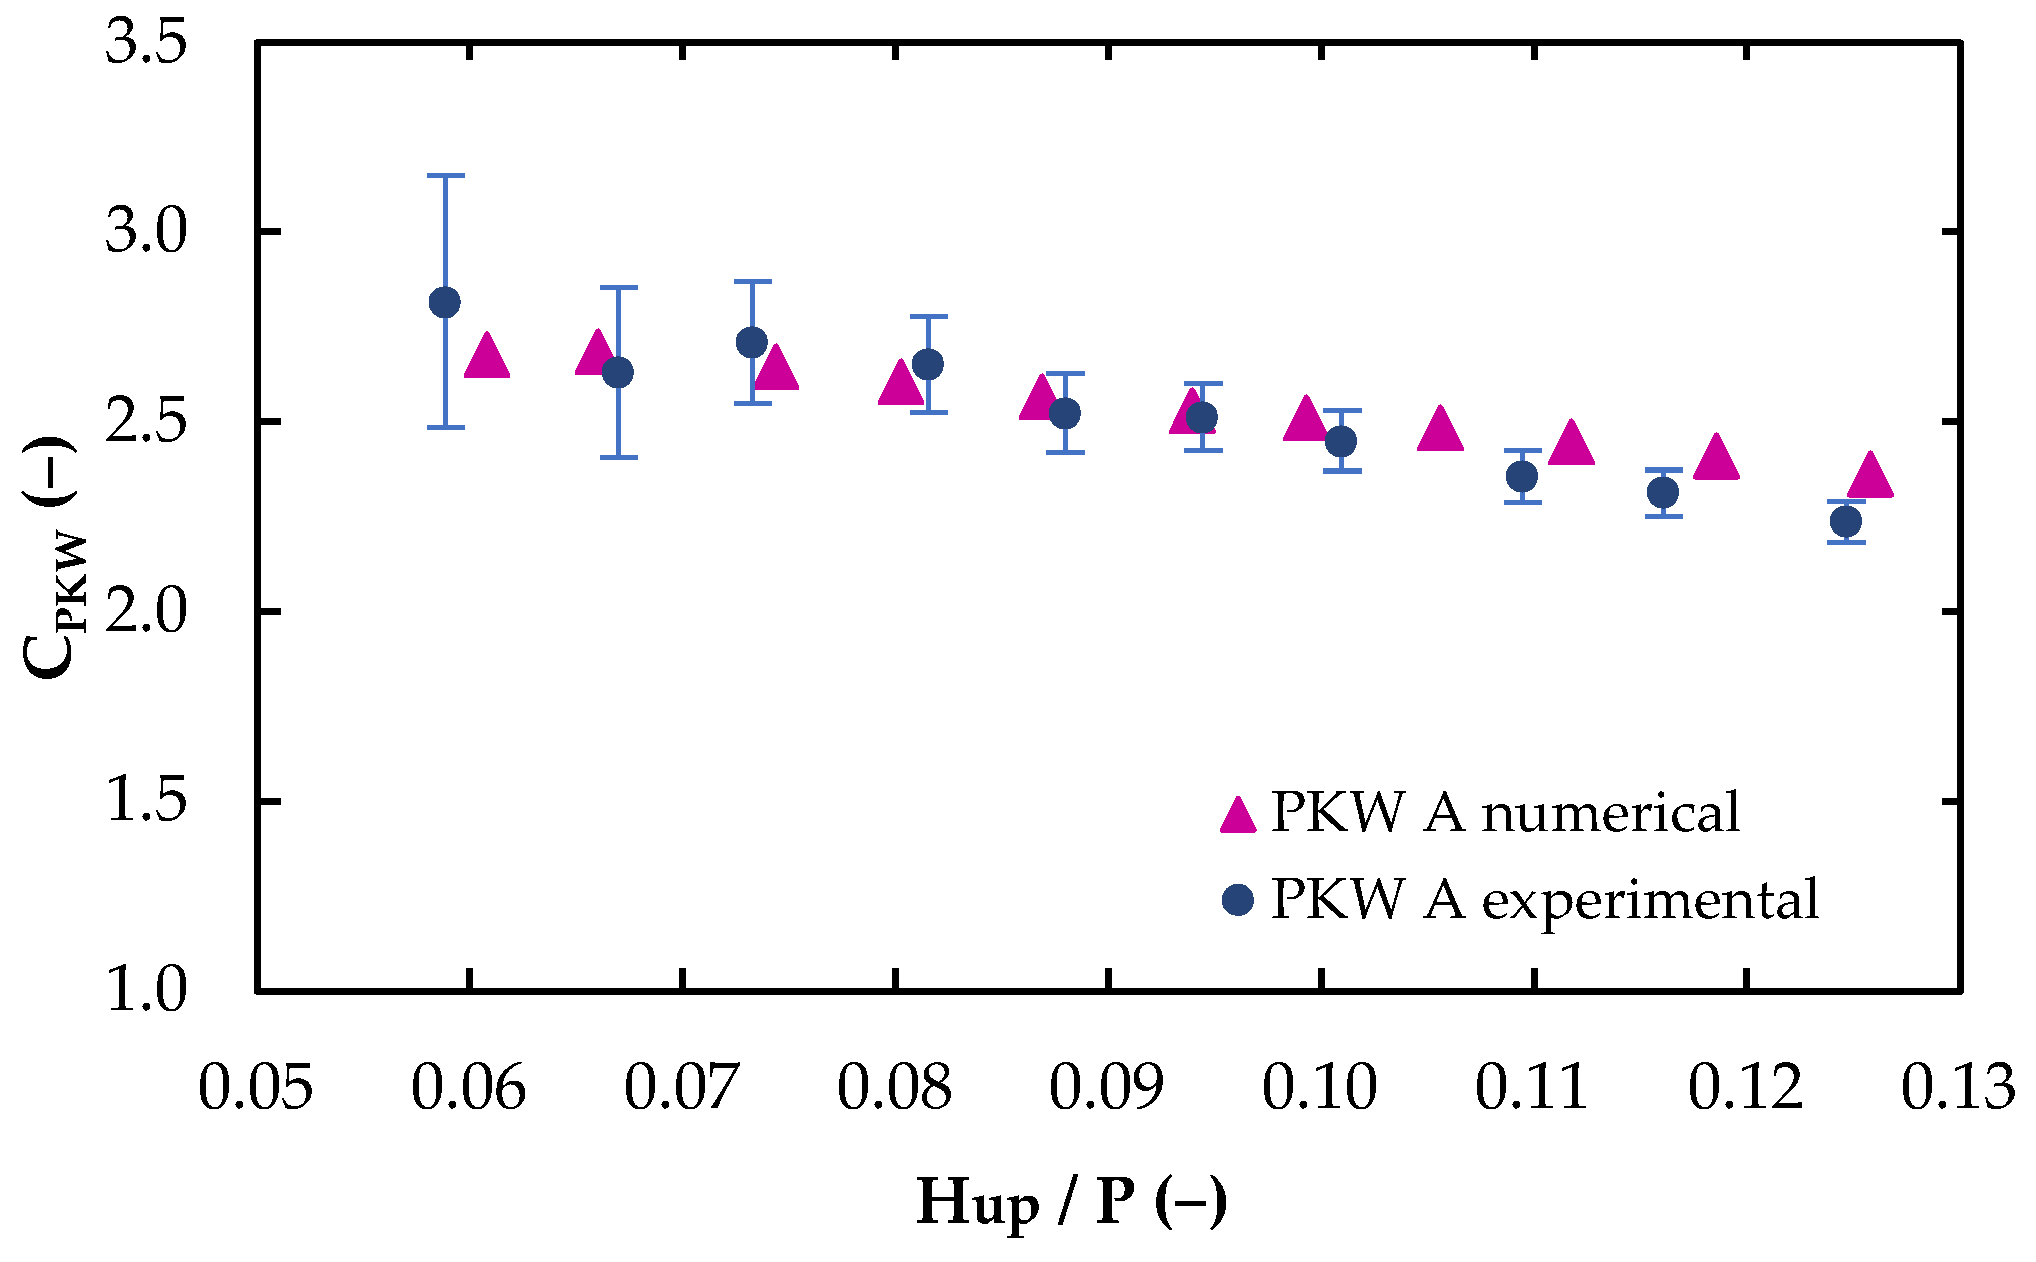
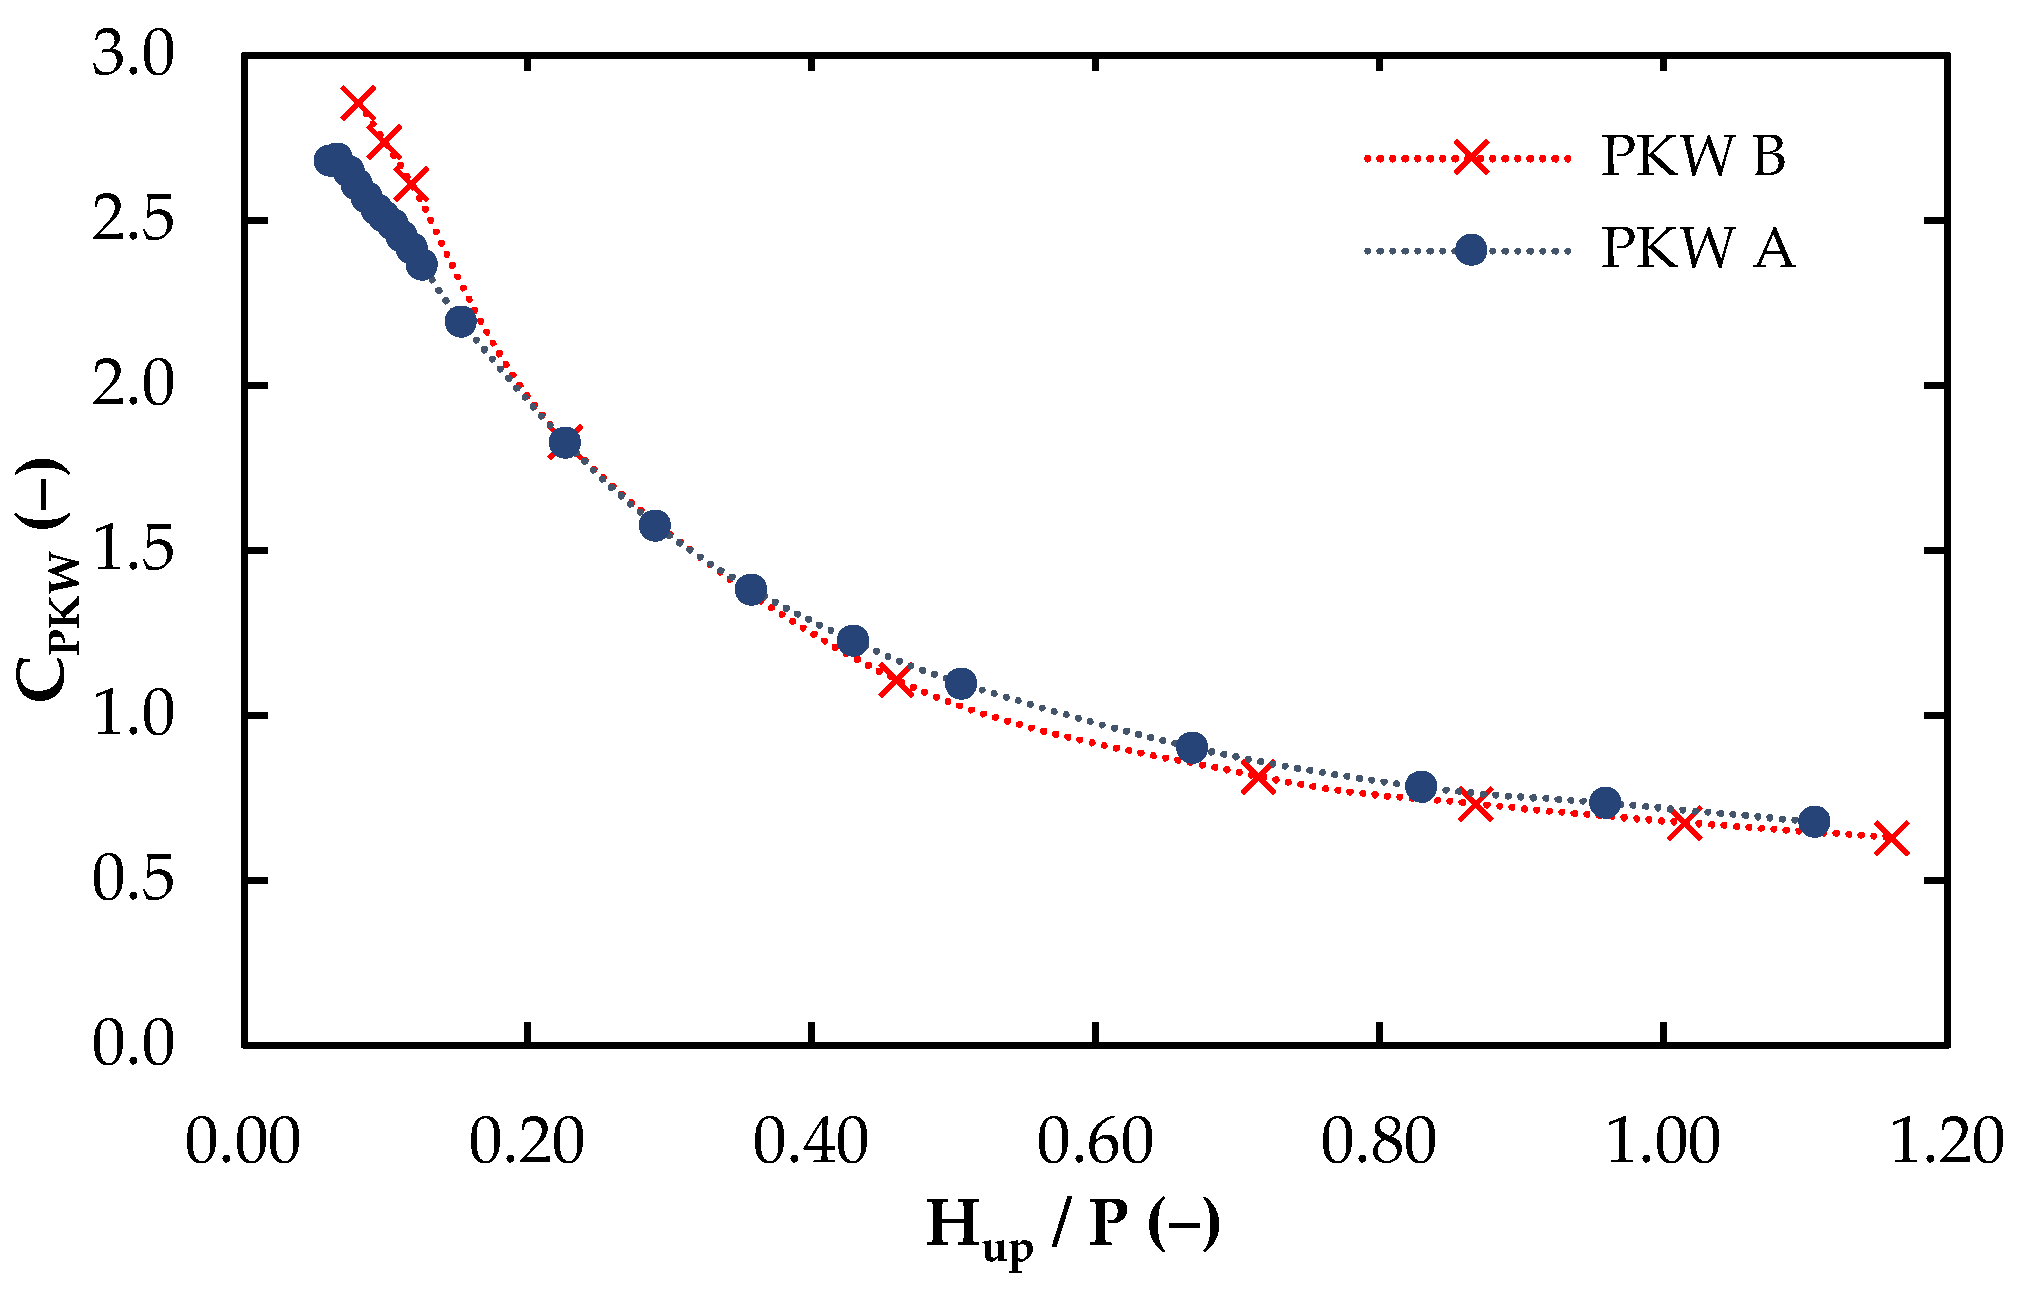
The selected geometries were modelled using Ansys Fluent Software [17]. The multiphase Volume Of Fluid (VOF) was selected to model the interaction between air and water phases. To model the turbulence, the Reynolds-Averaged Navier–Stokes (RANS) equations were selected in addition to the Renormalized Group (RNG) k-ε turbulence model, consistent with Pralong et al. [4] and Crookston et al. [18] studies. A surface tension interaction between the primary phase (water) and the secondary phase (air) with a specific value of 0.072 N/m was accounted for.
The pressure-based solver was selected to solve the simulations, with the implicit formulation. Likewise, First-Order Implicit Transient Formulation was set and the Semi-Implicit Method for Pressure-Linked Equations (SIMPLE) algorithm was used to model the Pressure–Velocity coupling, established by the RANS equations. As recommended for VOF computations, the Pressure Interpolation Scheme was selected. Second-Order Upwind discretization was implemented to solve Momentum, Turbulent Kinetic Energy, and Dissipation Rate. The Spatial Discretization was based on the Least Square Cell-Based gradient and the Compressive method was selected to solve the Volume Fraction equation. Lastly, the Time Step Size was calculated for each simulation according to the mesh size and the maximum expected velocity that ensured a Courant Number not greater than 1.
In terms of boundary conditions, a uniform velocity distribution at inlet and a static pressure at outlet were set (Figure 1), respectively. For each simulation, the velocity magnitude was set at inlet surface and a relative static pressure equal to 101,325 Pa was set at the outlet surface. The upper surfaces were set in a symmetrical fashion while lateral and bottom surfaces were considered as rigid walls. The numerical domain was discretized into six blocks; therefore, ten matching interfaces were added to solve the non-conformal mesh.
A sensitivity analysis was performed based on the calculation of the Grid Convergence Index (GCI), following the Celik et al. [19] methodology. Four mesh resolutions were considered, by varying the mesh applied in the surrounding area of the PKW (volumes 3, 4, and 5) while maintaining the mesh size constant for volumes 1, 2, and 6. Volume 1 was set with a mesh size equal to 2.5 cm (∼4.8% P) and volume 2 with 5 cm (∼9.6% P). Volume 6 was set with a mesh equal to 5 cm (∼9.6% P) and a refinement corresponding to the bottom of the channel with a variable mesh size resolution. In greater detail, the specific mesh size for volumes 3, 4, and 5, as well as the inflation factor for volume 6 are summarized in Table 3, with the total number of cells for each mesh and the computational time required to achieve the time convergence. A value of GCICPKW21 = 0.53% was achieved between mesh h1 and h2 in terms of discharge coefficient, thus accounting for mesh h1 for the simulations.

3. Results

The non-dimensional rating curves CPKW (Hup/P) of the PKWA from the experimental and numerical tests are given in Figure 2, with error bars showing the measurement uncertainties. Results showed a good agreement between both set of results, with a mean absolute error, MAE, equal to 3.81%.
Aiming to assess the difference in discharge efficiency between PKWA and PKWB, several flowrates were computed, resulting in the rating curve CPKW (Hup/P) presented in Figure 3. Results show that PKWB is more efficient than PKWA for a lower head. Conversely, PKWA turned to be more efficient at increasing the head. This change in efficiency occurred at Hup/P ≅ 0.3, when the PKWB discharge coefficient decreases more rapidly than the corresponding discharge coefficient from PKWA. These results agree with the observations by Machiels et al. [9], which showed that for a higher head, type B started to be less efficient than type A.

4. Discussion

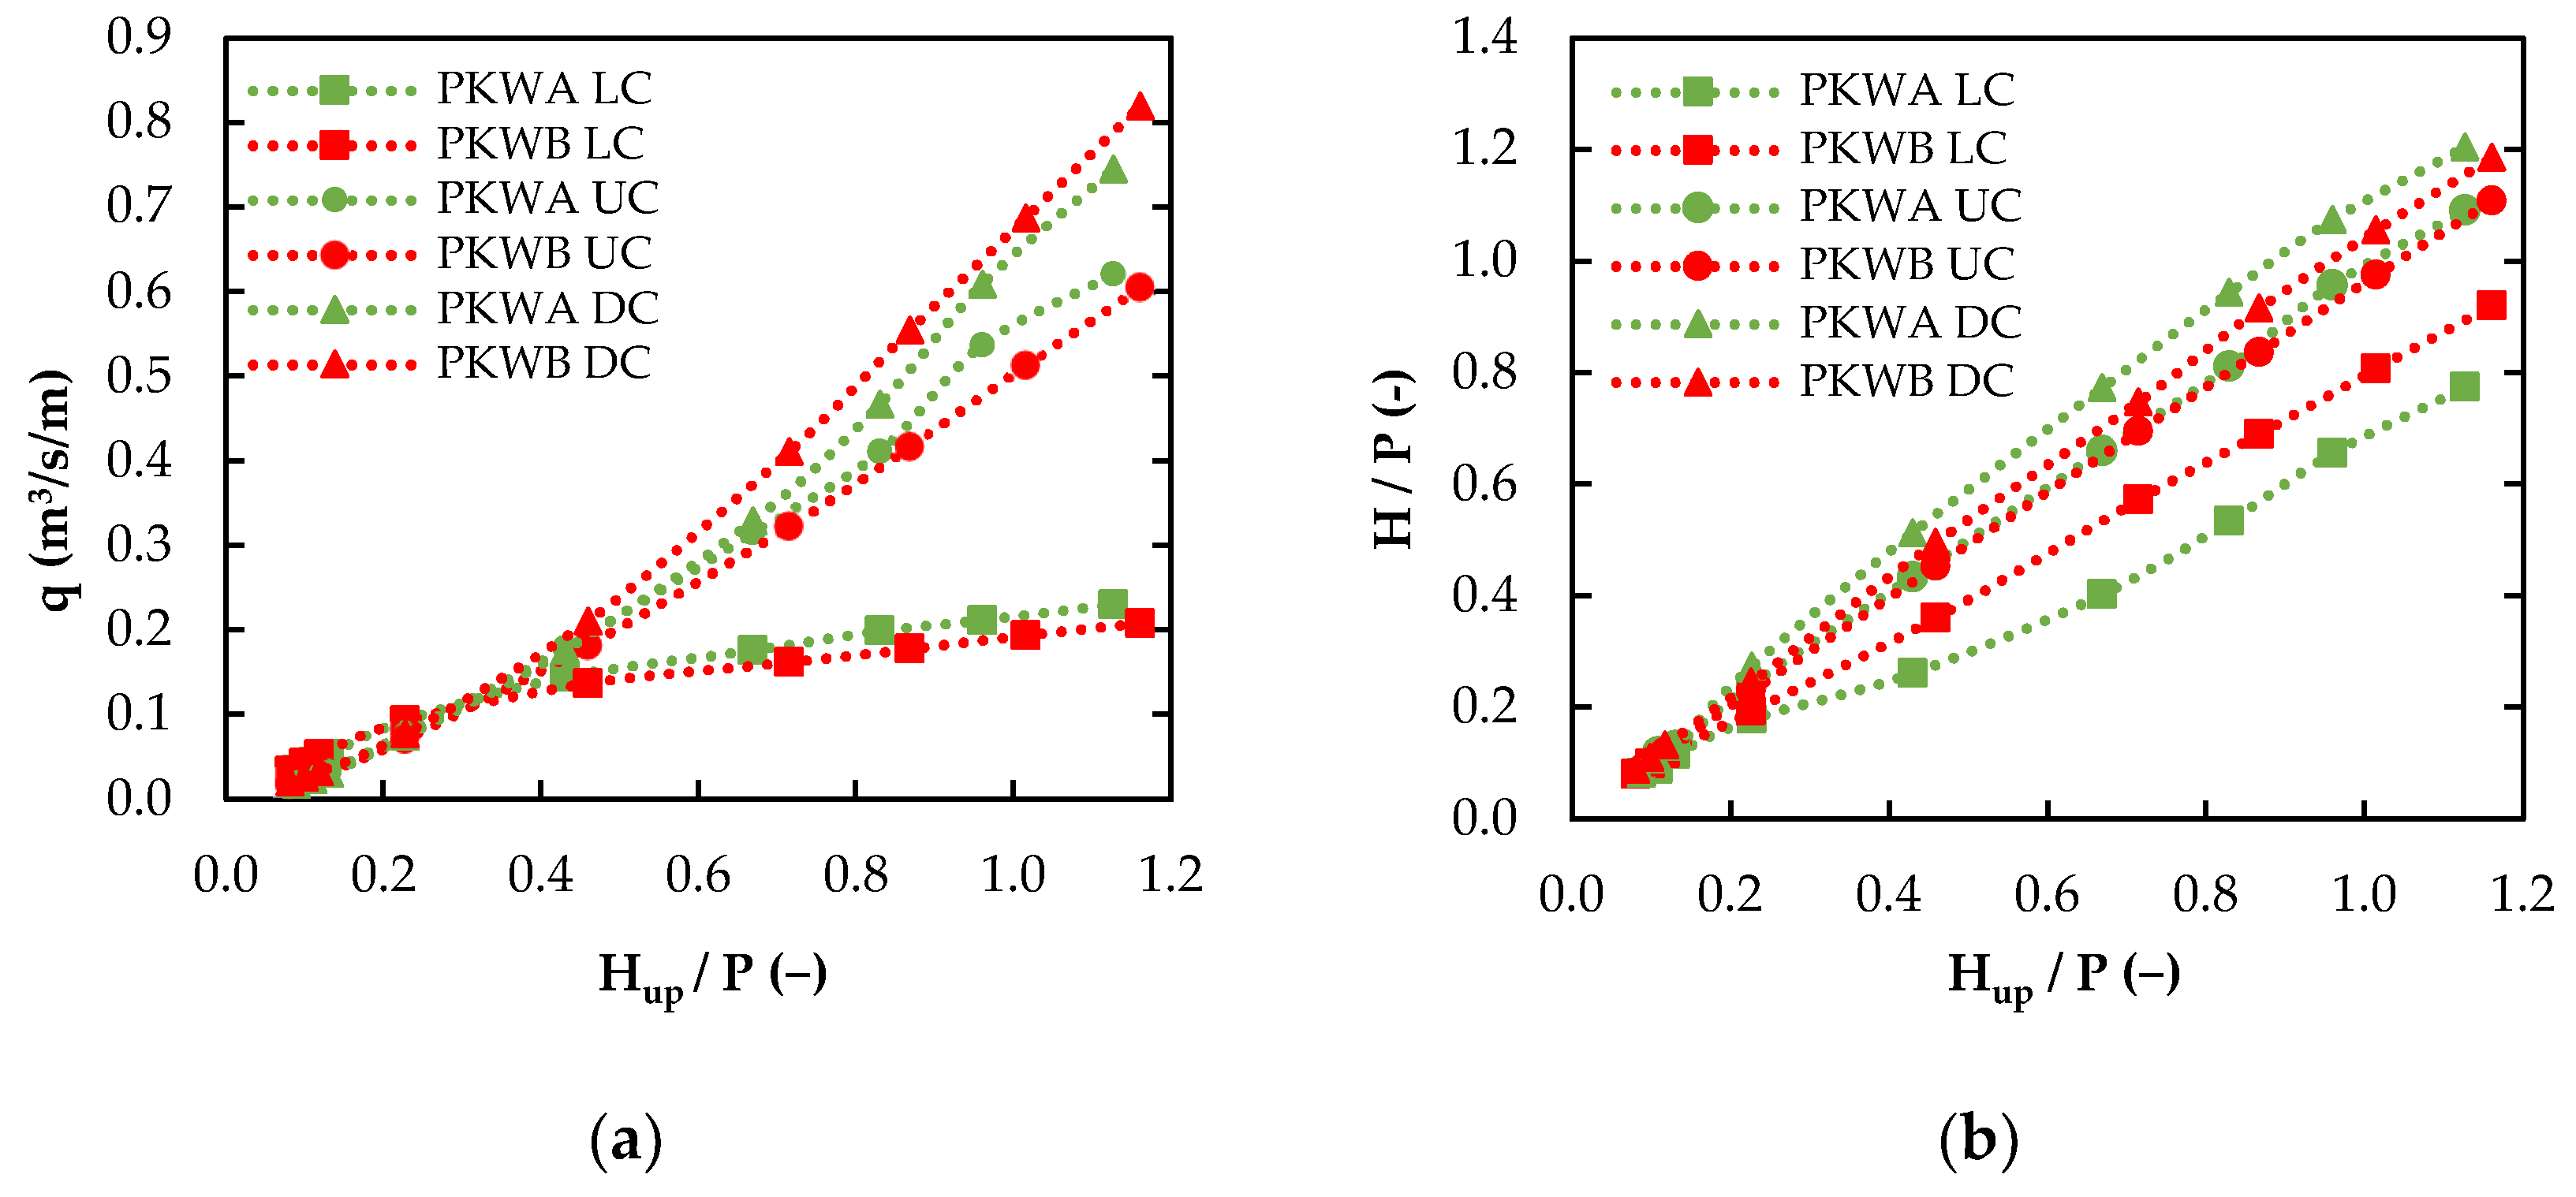
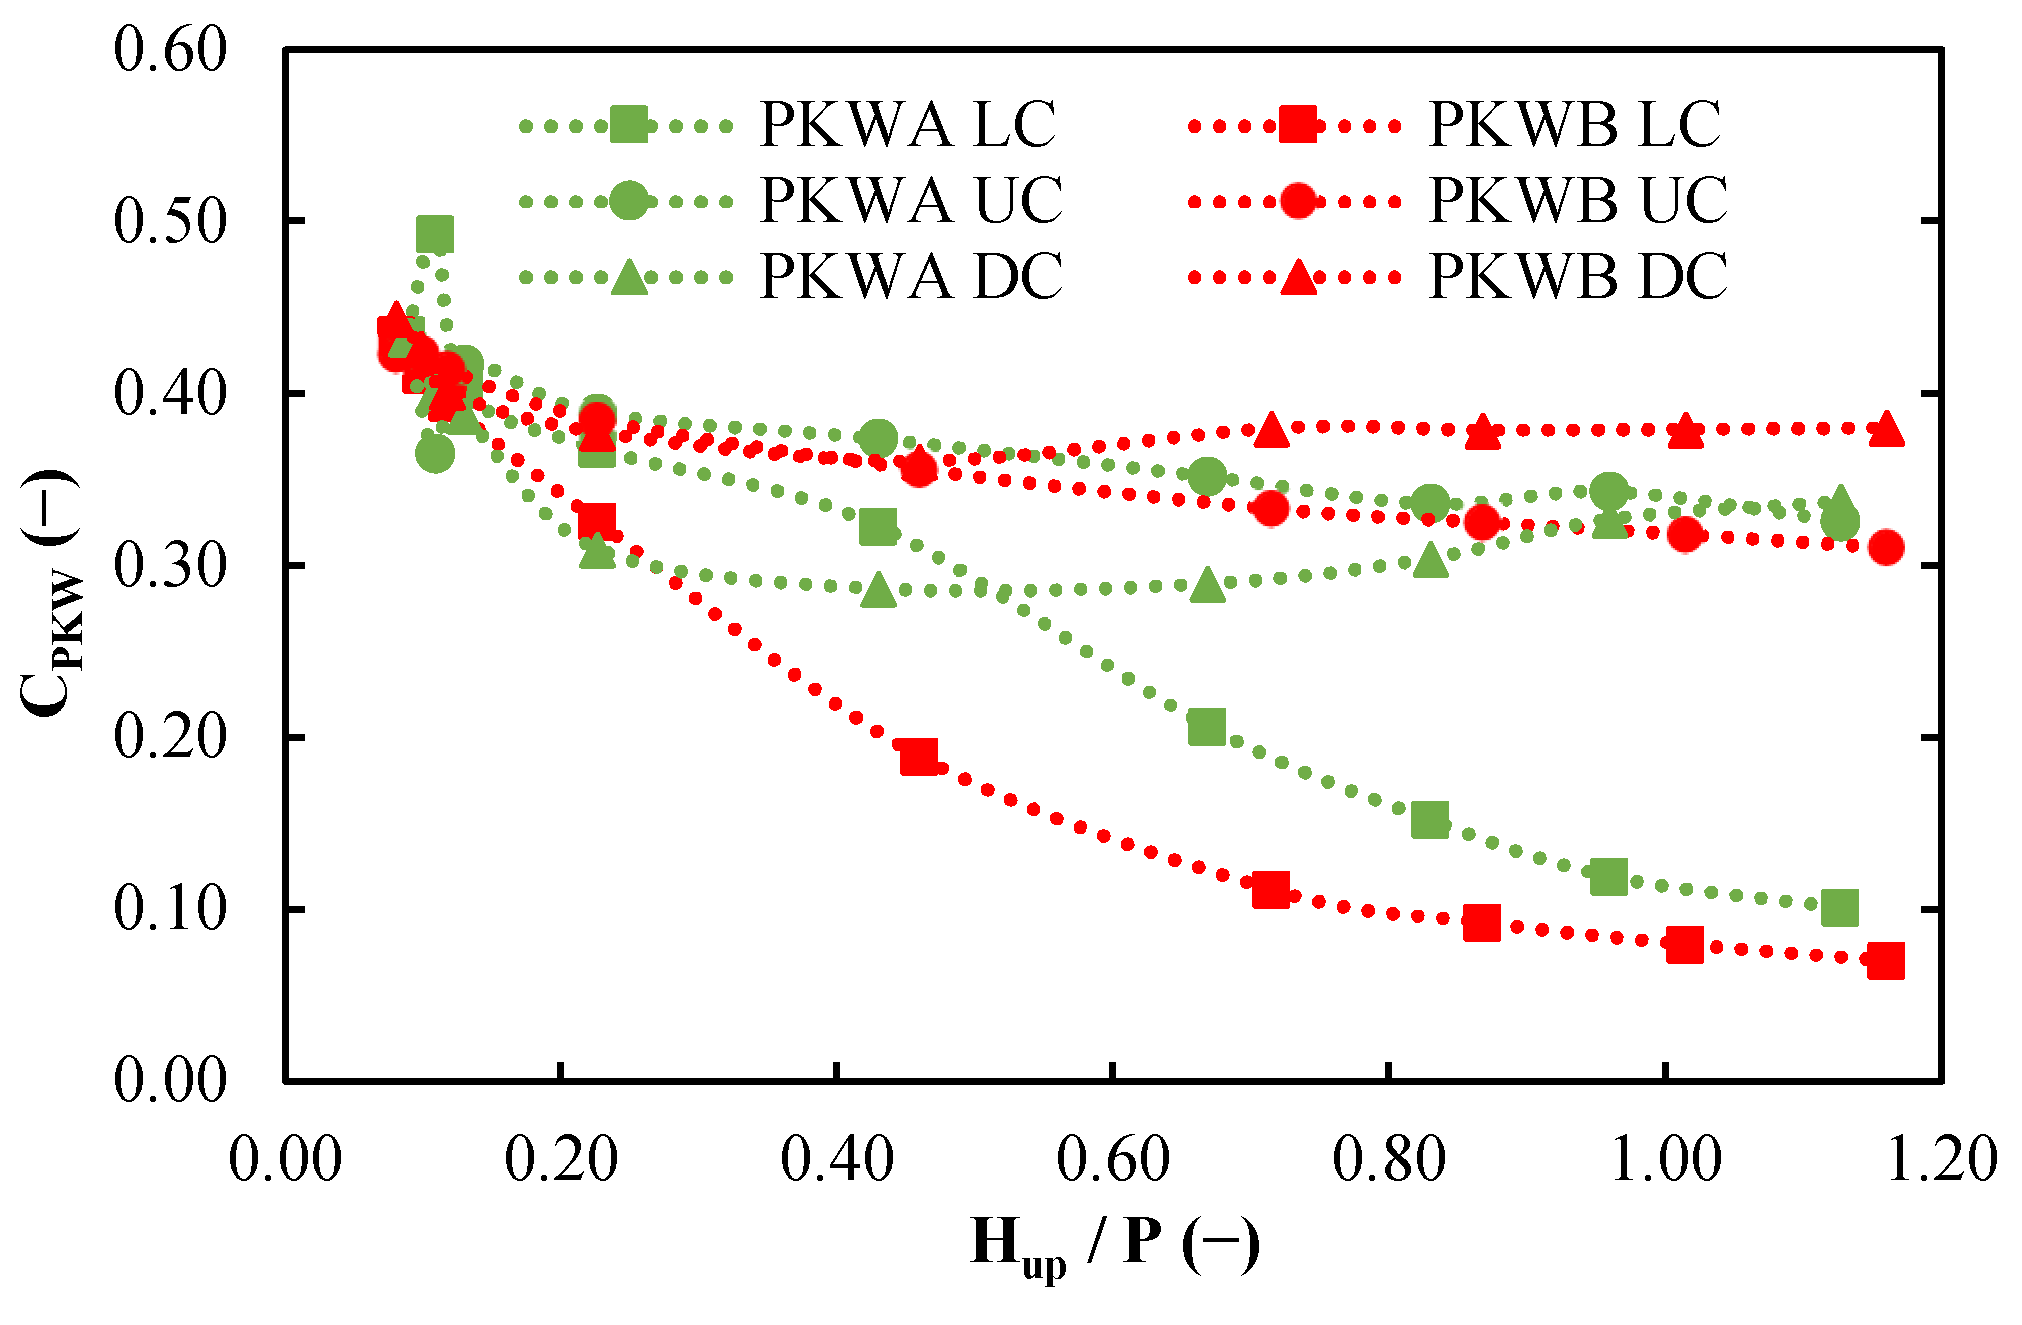
Discharge and Head Distribution over the Upstream, Downstream, and Lateral Crests

For evaluating the variation in efficiency, the specific discharge, q, and head, H, over each single crest was computed for both PKWA and PKWB. Results presented in Figure 4a show that for Hup/P ≲ 0.3, the specific discharge over the upstream, downstream, and lateral crests of both PKWA and PKWB is comparable. For Hup/P ≳ 0.3, the lateral and downstream crests of PKWA are characterized by a higher specific discharge, while the upstream crest specific discharge of PKWB is higher. For all Hup/P values, the specific discharge of the downstream crest is higher, followed by the upstream and the lateral crests’ specific discharges.
Furthermore, the comparison of the total head between the upstream, downstream, and lateral crests of both configurations is shown in Figure 4b. Results show that the head at the downstream crest from the PKWA is greater, whereas the head on lateral crests is higher for PKWB. The head at the upstream crest is comparable between both geometries.
Therefore, the upstream crest of PKWA is more efficient because it discharges more water for a certain head. Regarding the downstream crest, the lower head and the higher discharge of PKWB result in a higher discharge coefficient. In addition, the lateral crest of PKWA is more efficient due to the higher discharge and lower head values. Finally, the discharge coefficients of each crest are presented in Figure 5, where it is worth noting that the upstream and downstream crests of both configurations vary narrowly whereas the lateral crest discharge coefficient decreases remarkably, and even more rapidly on the PKWB.

5. Conclusions

An experimental and numerical investigation was performed to assess the discharge efficiency of two PKW geometries, by studying the discharge capacity and behavior of each individual crest. The geometries tested were a symmetric type A, PKWA, and a type B model, PKWB, with the same crest print and height as PKWA (L, P, Wi, Wo, Bb, Bh). The PKWA was experimentally and numerically tested while the PKWB was only tested numerically. The comparison between numerical and experimental results showed the effectiveness of the numerical model. Furthermore, a mesh size of ∼9.6% P can numerically predict the discharge coefficient with reasonable accuracy, obtaining a GCI of 0.53%.
In terms of discharge capacity, the tested PKWB resulted to be more efficient for lower head (Hup/P ≲ 0.35) than PKWA; however, when increasing the upstream head, the PKWA model proved to be more efficient. This change in efficiency can be explained because of the crests’ behavior of both configurations. The downstream crest of PKWB is more efficient due to the smaller velocities in the inlet section, meaning more favorable inflow conditions, which explains why the discharge coefficient of the tested PKWB was higher for Hup/P ≲ 0.35. Nevertheless, the discharge efficiency of the lateral crests of the PKWB is remarkably reduced in comparison with the PKWA, which results in a change in efficiency at Hup/P = 0.35. For Hup/P > 0.35, the PKWA is more efficient because the PKWB is not able to compensate the higher upstream and lateral discharge efficiency of the PKWA, although the downstream crest is more efficient for all the Hup/P-tested values.

Author Contributions

Conceptualization, G.T.-G.; methodology, G.T.-G., S.E. and F.P.; software, G.T.-G. and F.P.; validation, G.T.-G., S.E. and F.P.; formal analysis, S.E. and F.P.; investigation, G.T.-G. and S.E.; resources, F.P. and M.G.; data curation, G.T.-G., S.E. and F.P.; writing—original draft preparation, G.T.-G.; writing—review and editing, F.P. and M.G.; supervision, S.E., F.P., M.G.; project administration, M.G. All authors have read and agreed to the published version of the manuscript.

Funding

This research received no external funding.

Conflicts of Interest

The authors declare no conflict of interest.

References

  1. Lempérière, F.; Ouamane, A. The Piano Keys weir: A new cost-effective solution for spillways. Int. J. Hydropower Dams 2003, 10, 144–149. [Google Scholar]
  2. Pralong, J.; Vermeulen, J.; Blancher, B.; Laugier, F.; Erpicum, S.; Machiels, O.; Pirotton, M.; Boillat, J.; Ribeiro, M.; Schleiss, A. A naming convention for the Piano Key Weirs geometrical parameters. In Proceedings of the International Conference Labyrinth and Piano Key Weirs, Liège, Belgium, 9–11 February 2011; pp. 271–278. [Google Scholar] [CrossRef] [Green Version]
  3. Noui, A.; Ouamane, A. Study of optimization of the Piano key weir. In Proceedings of the International Conference Labyrinth and Piano Key Weirs–PKW, Liège, Belgium, 9–11 February 2011; pp. 175–182. [Google Scholar] [CrossRef]
  4. Pralong, J.; Montarros, F.; Blancher, B.; Laugier, F. A sensitivity analysis of Piano Key Weirs geometrical parameters based on 3D numerical modeling. In Proceedings of the International Conference Labyrinth and Piano Key Weirs–PKW, Liège, Belgium, 9–11 February 2011; pp. 133–139. [Google Scholar] [CrossRef]
  5. Ribeiro, M.; Boillat, J.; Schleiss, A.; Doucen, O.; Laugier, F. Experimental parametric study for hydraulic design of PKWs. In Proceedings of the International Conference on Labyrinth and Piano Key Weirs (PKW 2011), Liège, Belgium, 9–11 February 2011; CRC Press, Taylor & Francis Group: Boca Raton, FL, USA, 2011; pp. 183–190. [Google Scholar] [CrossRef]
  6. Machiels, O.; Erpicum, S.; Pirotton, M. Experimental analysis of PKW hydraulic performance and geometric parameters optimum. In Proceedings of the International workshop on Piano Key Weir for In-stream Storage and Dam Safety—PKWISD-2012, New Delhi, India, 30 May–1 June 2012. [Google Scholar]
  7. Anderson, R.M.; Tullis, B.P. Influence of Piano Key Weir geometry on discharge. In Proceedings of the Labyrinth and Piano Key Weirs—PKW 2011, Liège, Belgium, 9–11 February 2011; pp. 75–80. [Google Scholar]
  8. Lefebvre, V.; Vermeulen, J.; Blancher, B. Influence of geometrical parameters on pk-weirs discharge with 3d numerical analysis. In Proceedings of the 2nd International Workshop on Labyrinth and Piano Key Weirs 2013, Paris, France, 20–22 November 2013. [Google Scholar] [CrossRef] [Green Version]
  9. Machiels, O.; Pirotton, M.; Pierre, A.; Dewals, B.; Erpicum, S. Experimental parametric study and design of Piano Key Weirs. J. Hydraul. Res. 2014, 52, 326–335. [Google Scholar] [CrossRef]
  10. Bremer, F.; Oertel, M. Numerical investigation of wall thickness influence on Piano Key Weir discharge coefficients: A preliminary study. In Proceedings of the 3rd International Workshop on Labyrinth and Piano Key Weirs (PKW 2017), Qui Nhon, Vietnam, 22–24 February 2017; pp. 101–108. [Google Scholar] [CrossRef]
  11. Laugier, F.; Pralong, J.; Blancher, B. Influence of structural thickness of sidewalls on PKW spillway discharge capacity. In Proceedings of the International Conference on Labyrinth and Piano Key Weirs (PKW 2011), Liège, Belgium, 9–11 February 2011; pp. 159–165. [Google Scholar] [CrossRef]
  12. Erpicum, S.; Archambeau, P.; Dewals, B.; Pirotton, M. Hydraulics of Piano Key Weirs: A review. In Proceedings of the 3rd International Workshop on Labyrinth and Piano Key Weirs (PKW 2017), Qui Nhon, Vietnam, 22–24 February 2017; pp. 27–36. [Google Scholar]
  13. Cicero, G.; Delisle, J. Discharge characteristics of Piano Key weirs under submerged flow. In Proceedings of the second International Workshop on Labyrinth and Piano Key Weirs 2013, Paris, France, 20–22 November 2013; pp. 101–109. [Google Scholar]
  14. Machiels, O. Experimental Study of the Hydraulic Behaviour of Piano Key Weirs. Ph.D. Thesis, University of Liège, Liège, Belgium, 2012. [Google Scholar]
  15. Erpicum, S.; Tullis, B.P.; Lodomez, M.; Archambeau, P.; Dewals, B.J.; Pirotton, M. Scale effects in physical piano key weirs models. J. Hydraul. Res. 2016, 54, 692–698. [Google Scholar] [CrossRef] [Green Version]
  16. Abernethy, R.; Thompson, J.J. Uandbook, Uncertainty in Gas Turbine Measurements. In Proceedings of the 9th Propulsion Conference, Las Vegas, NV, USA, 5–7 November 1973. [Google Scholar]
  17. ANSYS Fluent 12.0 User’s Guide; Ansys Inc.: Washington County, PA, USA, 2019.
  18. Crookston, B.; Anderson, R.; Tullis, B. Free-flow discharge estimation method for Piano Key weir geometries. J. Hydro-Environ. Res. 2018, 19, 160–167. [Google Scholar] [CrossRef]
  19. Celik, I.B.; Ghia, U.; Roache, P.J.; Freitas, C.J.; Coleman, H.; Raad, P.E. Procedure for estimation and reporting of uncertainty due to discretization in CFD applications. J. Fluids Eng. Trans. ASME 2008, 130, 0780011–0780014. [Google Scholar] [CrossRef]
Figure 1. Volumes implemented in the CFD model and inlet and outlet boundary conditions.
Environsciproc 21 00084 g001
Figure 2. PKWA discharge coefficient curve CPKW (Hup/P).
Environsciproc 21 00084 g002
Figure 3. PKWA and PKWB discharge coefficient curves CPKW (Hup/P) obtained from numerical results.
Environsciproc 21 00084 g003
Figure 4. (a) Specific discharge and (b) Head over the upstream, downstream, and lateral crests of the PKWA and PKWB.
Environsciproc 21 00084 g004
Figure 5. Outlet key, inlet key, and lateral crest discharge coefficient curves CPKW (Hup/P) for PKWA and PKWB.
Environsciproc 21 00084 g005
Table 1. Fundamental parameters of an entire PKW.
PKW ParameterSymbolPKW ParameterSymbol
Inlet HeightPiInlet WidthWi
Outlet HeightPoOutlet WidthWo
Height of the basePbWall thicknessTs
Crest height PInlet SlopeSi
Total Lateral LengthBOutlet SlopeSo
Outlet LengthBoUnit WidthWu = Wi + Wo + 2·Ts
Inlet Length BiUnit LengthLu = 2·Bh + Wu
Length of the baseBbTotal developed lengthL = Nu·Lu
Number of unitsNuTotal width of the PKWW = Nu·Wu
Table 2. Geometry parameters for PKWA and PKWB.
P0.522 mWi0.255 m
B1.254 mWo0.170 m
Bo0.628 mWu0.455 m
Bi0 mLu2.963 m
Bb0.626 mTs0.15 m
PKWABo = 0.314 m; Bi = 0.314 m
PKWBBo = 0.628 m; Bi = 0 m
Table 3. Mesh resolutions tested for the Mesh Convergence Method.
MeshVolumeNumber of CellsComputational Time
3456
h12.0 cm3.0 cm2.0 cminflation of 2.0 cm696,799∼4 days
h21.5 cm2.0 cm1.5 cminflation of 1.5 cm1,521,601∼10 days
h31.15 cm1.3 cm1.15 cminflation of 1.15 cm3,569,820∼25 days
h40.8 cm1.0 cm0.8 cminflation of 0.8 cm9,503,531∼40 days
Disclaimer/Publisher’s Note: The statements, opinions and data contained in all publications are solely those of the individual author(s) and contributor(s) and not of MDPI and/or the editor(s). MDPI and/or the editor(s) disclaim responsibility for any injury to people or property resulting from any ideas, methods, instructions or products referred to in the content.

