Proceeding Paper

The Detection of Plastic and Petroleum Hydrocarbon Pollution at Sea with Laser-Induced Fluorescence †

1
Department of Surveying and Geoinformatics Engineering, University of West Attica, 12243 Athens, Greece
2
Department of Naval Architecture, University of West Attica, 12243 Athens, Greece
*
Author to whom correspondence should be addressed.
Presented at the 16th International Conference on Meteorology, Climatology and Atmospheric Physics—COMECAP 2023, Athens, Greece, 25–29 September 2023.
Environ. Sci. Proc. 2023, 26(1), 12; https://doi.org/10.3390/environsciproc2023026012
Published: 23 August 2023

Abstract

:
Plastic and oil pollutants’ distribution and composition quantifications are vital to better understanding their effects on marine life. We present preliminary experimental results to evaluate the potential of a compact Laser-Induced Fluorescence (LIF) apparatus for the detection of plastics and oil pollutants. The apparatus is based on a comparatively inexpensive method utilizing a 405 nm laser for sample excitation in water. Fluorescence spectra are recorded from known sources of microplastic pollutants, such as polyethylene, polypropylene, polystyrene and PMMA, as well as several petroleum substances. A novel identification indicator is proposed for classifying the pollutant type in realistic environmental conditions.

1. Introduction

In recent years, the increasing abundance of plastic and oil pollutants at sea has become a growing concern worldwide. Oil pollution is mainly caused by wastewater discharged from factories and offshore oil leakage [1], while polymers like polyethylene (PE), polypropylene (PP) and polystyrene (PS) have been identified as a major source of microplastics in the western Mediterranean Sea [2]. Microplastics can accumulate in the food chain and cause negative effects on living organisms, due to their carcinogenic and toxic properties [3]. This has motivated many scientists to investigate new and compact methods for the detection and identification of plastics, usually present in the form of microplastics, and trace amounts of oils in natural waters.
There are several detection techniques available that can be used to identify plastic litter [4,5]. Generally, non-destructive spectroscopic techniques, like Fourier-Transform Infrared Spectroscopy (FTIR) or Raman Spectroscopy, are advantageous as they allow cross-validation with other analytical tools. Analytical methods such as pyrolysis/gas chromatography [6] and vibrational and mass spectrometry are precise and selective, but are expensive and time-consuming. As plastic and oil pollutants are hazardous and rapidly modified in the environment, it is necessary to develop a rapid screening and fingerprinting method to identify unknown pollutants products for timely responses [7]. Photoluminescence spectroscopy and LIF are proposed as an alternative for microplastics monitoring, as they are inexpensive and compact methods that can be used by UAVs, USVs or other vessels to estimate the type of pollutants in the water [8,9].
In this work, we present preliminary experimental results to evaluate the potential of a compact LIF apparatus, similar to that proposed in [8], for the detection of plastic pollutants and microplastics in real time. Oil pollution originating from the shipping industry is also studied. We propose a new material identification indicator, which can be utilized in the future for the accurate determination of different material pollutants in marine waters in real time.

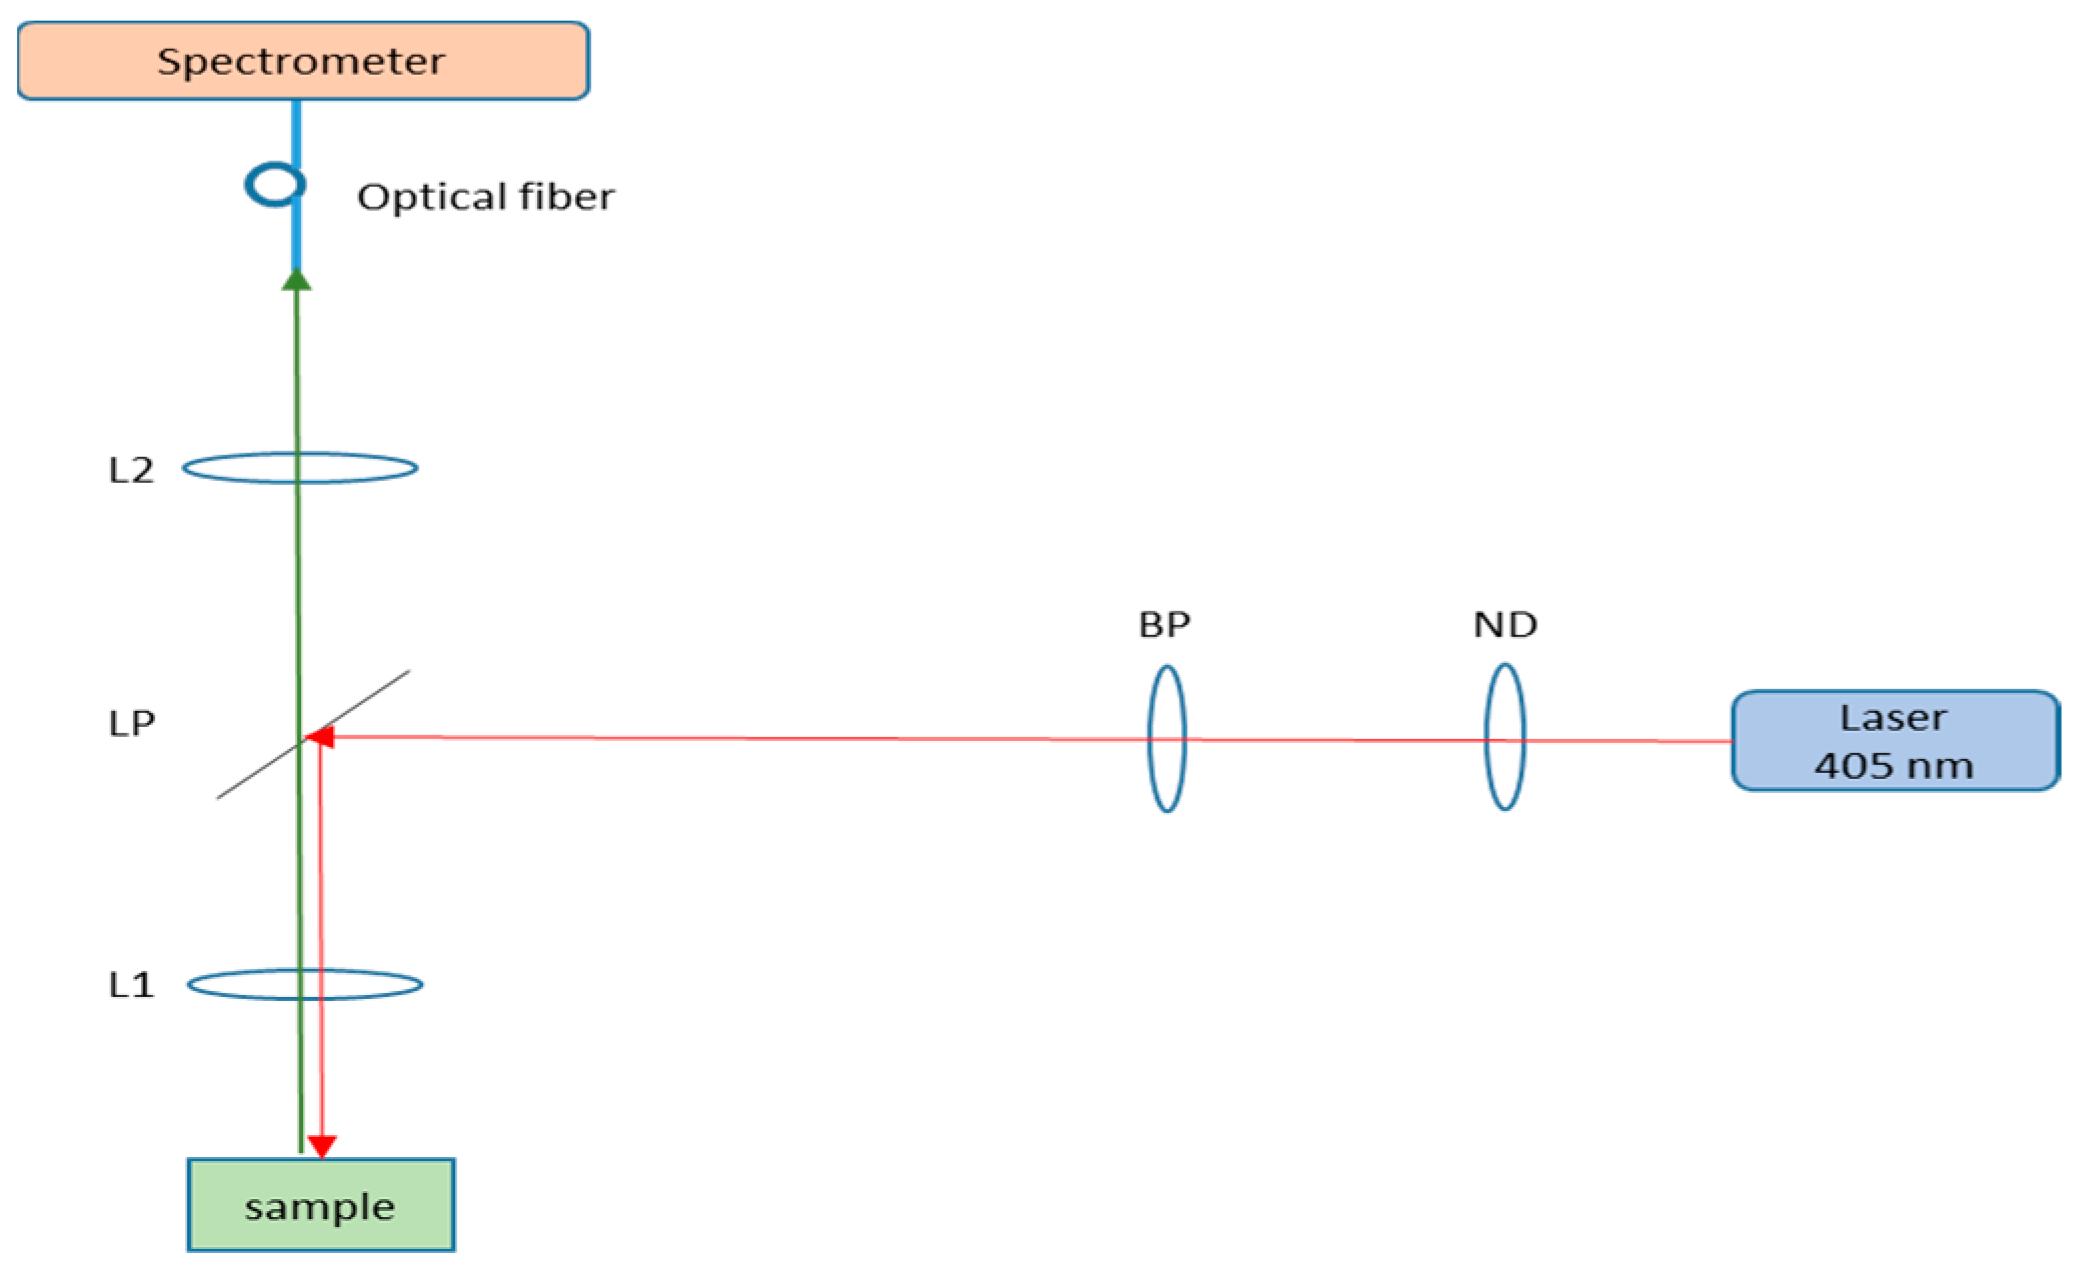
2. Materials and Methods

A simplified experimental setup is shown in Figure 1. A 405 nm CW laser diode system with a maximum output power of 100 mW was utilized as an excitation laser source. Neutral Density (ND) filters were used to decrease maximum power when necessary to prevent saturation of the observed spectra. A band-pass filter at 405 nm filtered the laser diode output from possible amplified spontaneous emissions. A long-pass filter with a cut-on wavelength of 420 nm reflected the filtered laser light to an achromatic lens L1. The asymmetric beam profile of the diode laser system used was estimated using beam-scanning techniques [10]. The full angle beam divergence was approximately 1.5 mrad/3 mrad (horizontal/vertical), so the focal spot diameter was estimated to be approximately 60 μm × 120 μm. The samples (water surface of the cuvette, see below) were positioned on the focal plane of the lens and the generated LIF signal became collimated due to lens L1 and was also filtered to cut any laser reflection by the long-pass filter. The fluorescence signal was coupled into a multimode optical fiber by a second 40 mm lens L2 and a compact spectrometer was utilized to record the spectra (Ocean Optics S2000 from Ocean Insights, Orlando, FL, USA, ~2 nm resolution).
In order to simulate measurements in seawater realistically, the samples were prepared in the laboratory by adding small quantities (~0.3 g) of the pollutants in 40 mL of water inside a glass cuvette with open top. Microplastics were prepared by breaking down the plastic materials into particles with variable sizes smaller than 1 mm (both industrial grade and retail product plastics were used). The samples were stirred before each measurement to slightly homogenize the content, because different concentrations of microplastics and oils are required to simulate realistic scenarios. The pollutants’ concentration is higher close to the surface of the water in most cases. For each sample, 20 measurements were taken to capture spectral variations due to sample inhomogeneity, particles’ concentration and laser intensity variation. Each measurement was acquired from different parts of the sample by moving the cuvette in all three axes after averaging 10 spectra recorded for 50 ms integration time.
The various plastic and oil pollutants studied in this work are shown in Table 1. Natural materials such as seaweed (Posidonia Oceanica), wood and olive oil were also examined for making a comparison.

3. Results and Discussion

Some representative LIF spectra are shown in Figure 2. Background emission with the laser deactivated was always subtracted from the fluorescence signal. The spectra were smoothed with a Savitzky–Golay filter function of order 2 using a frame length of 27, due to relatively high noise. Spectra with a signal-to-noise ratio less than 10 were excluded from the study. The recorded spectra were normalized, since the measured intensity was highly variable between measurements for the same material, a fact that is also expected in a realistic scenario where material density, laser intensity and focal spot at different depths are highly fluctuating parameters. In addition to a fluorescence peak that was observed for all plastic materials around 500 nm, Raman emissions were also observed at 427 nm and 462 nm, similar to the spectra recorded in [8], although Raman or other peaks’ intensities varied due to different experimental conditions (i.e., spot size) that may have enhanced or suppressed different emission mechanisms in our study. Posidonia Oceanica and olive oil showed another intense peak close to 680 nm, which was not present in the spectra of other materials studied.
Despite some differences between our spectra and the ones in [8], which were unavoidable because of the lack of standards for measuring plastic samples and for building a fluorescence setup [9], it was obvious that every material generated different and unique spectral characteristics. Differentiation between plastic and non-plastic materials was shown to be possible in [8] by applying two classifiers, the ratio of intensity at 427 nm and 462 nm to the intensity observed at 550 nm (P1 and P2). However, the identification of different plastic materials using only P1 and P2 is not efficient and machine learning techniques with a larger number of classifiers have to be applied for adequate characterization [9]. In addition, oils were not included in [8], which may be present in the case of realistic measurements in seawater and make the identification process more complicated. Our preliminary analysis of the recorded spectra has shown that careful examination of the spectra can reveal many additional spectral characteristics, which can be used in a further classification analysis with machine learning techniques in the future. It is evident that all plastic materials showed an exponential variation in the intensity for wavelengths λ following the peak at 500 nm. For example, both PP and PS showed this characteristic in Figure 2, whereas this was not true for VLSFO oil.
In order to prove our hypothesis, the intensity between 500 nm and 650 nm is considered to be
I ( λ ) = Ι m a x · e b · λ
and exponential fitting was applied to estimate the exponential fitting coefficient b , as is shown in Figure 3 in the case of a measurement for PMMA. The exponential fitting process was applied to each one of the 20 spectra measured for every sample and the average coefficient b was derived, as well as the average R2, in order to evaluate to what degree the data fit the exponential nonlinear regression model.
The bubble chart in Figure 4 shows that for all plastic materials used in this study, the exponential fitting was well justified (R2 ≈ 1), whereas other materials showed very different behavior with high standard errors.
In Figure 5, the ratio P1/P2 of the proposed indicators in [8] is plotted versus the average calculated exponential fitting coefficient, as it is estimated by the 20 spectra for each sample. It is clear that the identification of different plastic materials is possible, as well as that of oil pollutants and natural substances.

4. Conclusions

It is shown that careful analysis of the LIF spectra can lead to additional classification quantities that are promising for the identification of microplastics, oils and natural materials present in water. The future research and application of machine learning techniques can lead to the development of a low-cost monitoring device based on photoluminescence and LIF spectroscopy for real-time measurements in seawater. Ultimately, our goal is to develop an automated LIF setup placed on a USV for the real-time detection and analysis of plastic and oil pollutants in seawater.

Author Contributions

Conceptualization, N.M.; methodology, E.D. and N.M.; software, N.M.; validation, E.D. and N.M.; investigation, E.D. and N.M.; writing—original draft preparation, E.D. and N.M; writing—review and editing, E.D., E.Z., M.S. and N.M.; Visualization, E.D. and N.M.; supervision, N.M.; project administration, N.M. All authors have read and agreed to the published version of the manuscript.

Funding

This research received no external funding.

Institutional Review Board Statement

Not applicable.

Informed Consent Statement

Not applicable.

Data Availability Statement

The datasets generated and/or analyzed during the current study are available from the corresponding author on reasonable request.

Acknowledgments

The registration fees for N.M. were totally covered by the University of West Attica.

Conflicts of Interest

The authors declare no conflict of interest.

References

  1. Cheng, P.; Zhu, Y.; Cui, C.; Wang, F.; Pan, J. Determination of oil pollutants by three-dimensional fluorescence spectroscopy combined with improved pattern recognition algorithm. Meas. Control 2022, 55, 1078–1087. [Google Scholar] [CrossRef]
  2. De Haan, W.P.; Sanchez-Vidal, A.; Canals, M. Floating microplastics and aggregate formation in the Western Mediterranean Sea. Mar. Pollut. Bull. 2019, 140, 523–535. [Google Scholar] [CrossRef] [PubMed]
  3. Pampanin, D.M.; Sydnes, M.O. Chapter 5: Polycyclic aromatic hydrocarbons a constituent of petroleum: Presence and influence in the aquatic environment. In Hydrocarbon; Kutcherov, V., Kolesnikov, A., Eds.; Intech Open Ltd.: London, UK, 2013; pp. 83–118. Available online: https://www.intechopen.com/chapters/41885 (accessed on 1 September 2022).
  4. Shim, W.J.; Hong, S.H.; Eo, S.E. Identification methods in microplastic analysis: A review. Anal. Methods 2017, 9, 1384–1391. [Google Scholar] [CrossRef]
  5. Prata, J.C.; da Costa, J.P.; Duarte, A.C.; Rocha-Santos, T. Methods for sampling and detection of microplastics in water and sediment: A critical review. Trends Anal. Chem. 2019, 110, 150–159. [Google Scholar] [CrossRef]
  6. Zhou, F.; Wang, X.; Wang, G.; Zuo, Y.A. Rapid Method for Detecting Microplastics Based on Fluorescence Lifetime Imaging Technology (FLIM). Toxics 2022, 10, 118. [Google Scholar] [CrossRef] [PubMed]
  7. Fatemeh, S.M.; Soucy, N.; Hollebone, B.P.; Brown, C.E. Rapid fingerprinting of spilled petroleum products using fluorescence spectroscopy coupled with parallel factor and principal component analysis. Chemosphere 2018, 208, 185–195. [Google Scholar] [CrossRef]
  8. Ornik, J.; Sommer, S.; Gies, S.; Weber, M.; Lott, C.; Blazer, J.C.; Koch, M. Could photoluminescence spectroscopy be an alternative technique for the detection of microplastics? First experiments using a 405 nm laser for excitation. Appl. Phys. B 2020, 126, 15. [Google Scholar] [CrossRef]
  9. Lotter, B.; Konde, S.; Nguyen, J.; Grau, M.; Koch, M.; Lenz, P. Identifying plastics with photoluminescence spectroscopy and machine learning. Nat. Sci. Rep. 2022, 12, 18840. [Google Scholar] [CrossRef]
  10. Merlemis, N.; Kesidis, A.L.; Sianoudis, I. Measurement of laser beam spatial profile by laser scanning. Eur. J. Phys. 2020, 42, 015304. [Google Scholar] [CrossRef]
Figure 1. Illustration of the LIF experimental setup. L1, L2 are 25 mm diameter lenses of 40 mm focal length; ND are neutral density filters of various densities; BP is a bandpass filter at 405 nm (Edmund Optics); LP is a long-pass filter with a cut-on wavelength of 420 nm (Edmund Optics).
Environsciproc 26 00012 g001
Figure 2. Normalized and smoothed fluorescence spectra of polystyrene, polypropylene, VLSFO and Posidonia Oceanica. Twenty spectra are recorded for each material.
Environsciproc 26 00012 g002
Figure 3. Spectrum of PMMA and exponential fitting process between 500 nm and 650 nm.
Environsciproc 26 00012 g003
Figure 4. Bubble chart of the average R2 vs. the average fitting coefficient b . The standard error of R2 for every material determines the size of the bubbles.
Environsciproc 26 00012 g004
Figure 5. Plot of the ratio of intensities at 427 nm and 462 nm (P1/P2) vs. the calculated exponential fitting coefficient b. Error bars represent the standard error of the quantities shown.
Environsciproc 26 00012 g005
Table 1. The plastic materials, oils and natural materials found in the marine environment that were examined in this work. The olive oil was included in the study because pollution from olive oil mill wastewater into rivers may also be present in the coastal zone.
MaterialOriginMaterialOrigin
PMMA-Poly(methyl methacrylate)IndustryNaval oil SAE 40—newShipping industry
Polyethylene (PE)Industry and retailNaval oil SAE 40—usedShipping industry
Polypropylene (PP)IndustryFuel oil VLSFOShipping industry
PolystyreneIndustry and retailFuel oil HSFOShipping industry
PET-Polyethylene terephthalateretailPaint SKF9005Shipping industry
Polyurethane (PUR)retailWood (Palm tree)Natural
PVC-Polyvinyl chlorideretailOlive OilNatural
Polycarbonate (PC)retailPosidonia OceanicaNatural
BakeliteretailPEEK GF30 Glass Fibre 30%Retail
Disclaimer/Publisher’s Note: The statements, opinions and data contained in all publications are solely those of the individual author(s) and contributor(s) and not of MDPI and/or the editor(s). MDPI and/or the editor(s) disclaim responsibility for any injury to people or property resulting from any ideas, methods, instructions or products referred to in the content.

