Abstract
The polar front jet and the subtropical jet, usually separated, are rarely superposed at the same latitude over the greater Mediterranean region, resulting in intense cyclogenesis. The objective of this study is to identify the superposition of the two jets over the Mediterranean on a climatological basis and the possible association with high-impact weather events with the aid of satellite-based indicators. The results show that, indeed, the satellite indicators help in better identifying the area of possible jet superposition. Furthermore, it was found that although jet stream superposition occurs very rarely, it is mostly associated with severe weather events in the surrounding areas.
1. Introduction
Jet streams are located at tropopause breaks [1] that separate the tropopause into three sections: polar, sub-tropic, and tropic. The polar front jet (PFJ) is usually found at 40°–60° latitudes, and its position varies following the polar front at the height of about 300 hPa. The subtropical jet (STJ) is located at 30° latitude at approximately 200 hPa and follows mostly a zonal path. Although not directly associated with mid-latitude cyclones, the STJ can aid the process of releasing convective instability [2] or interact with the PFJ, affecting the formation and intensity of cyclones [3]. As the position of the PFJ varies throughout the season, its path may be found in close proximity to the STJ.
On rare occasions during the cold season, the two jet streams are found at vertical superposition resulting in a merged jet. This superposition was first described by the author of [4] and more recently by the authors of [5,6,7,8,9]. Jet superposition features a steeper tropopause break from polar to tropical tropopause as the two steps of each jet stream merge. An identification scheme for climatological research of jet stream superposition was suggested by the authors of [5], revealing three main areas where the superposition has frequency maxima at the West Pacific and North America and a smaller one in the Mediterranean.
The objective of this study is to identify the superposition of the PFJ and STJ over the Mediterranean on a climatological basis (2004–2022) and thereafter examine the relationship of this superposition with high-impact weather events in the vicinity of the superposition with the satellite images and indicators and other data sources.
2. Data and Methodology
In this study, data from the ECMWF ERA-5 reanalysis 0.25° × 0.25° dataset were used for the region which spans from latitude 0° to 70° N and from longitude −30° to 50° W. The data include wind speed from 400 hPa to 100 hPa and potential vorticity at 320 K and 350 K surface from November to March 2004–2022 at 6 h intervals. Also, rainfall data from the same source were used for specific dates as will be explained later.
Similar to the study of [5], superposition cases in this study were considered when the 1–2 PVU values for the respective isotheta surface were found at the same location along with PVU gradients greater than 0.64 × 10⁻⁵ PVU/m and vertically integrated wind speed between 400 hPa and 100 hPa exceeding 30 m/s. Rather than using full isentropes ranges for each jet as in [5], the two representative isotheta surfaces of 320 K and 350 K contained in the ERA-5 dataset were utilized. Also, since the 2PVU surface is considered the dynamical tropopause and the jets usually reside at the low edge of the tropopause, the 1–2 PVU range was examined instead of the 1–3 PVU.
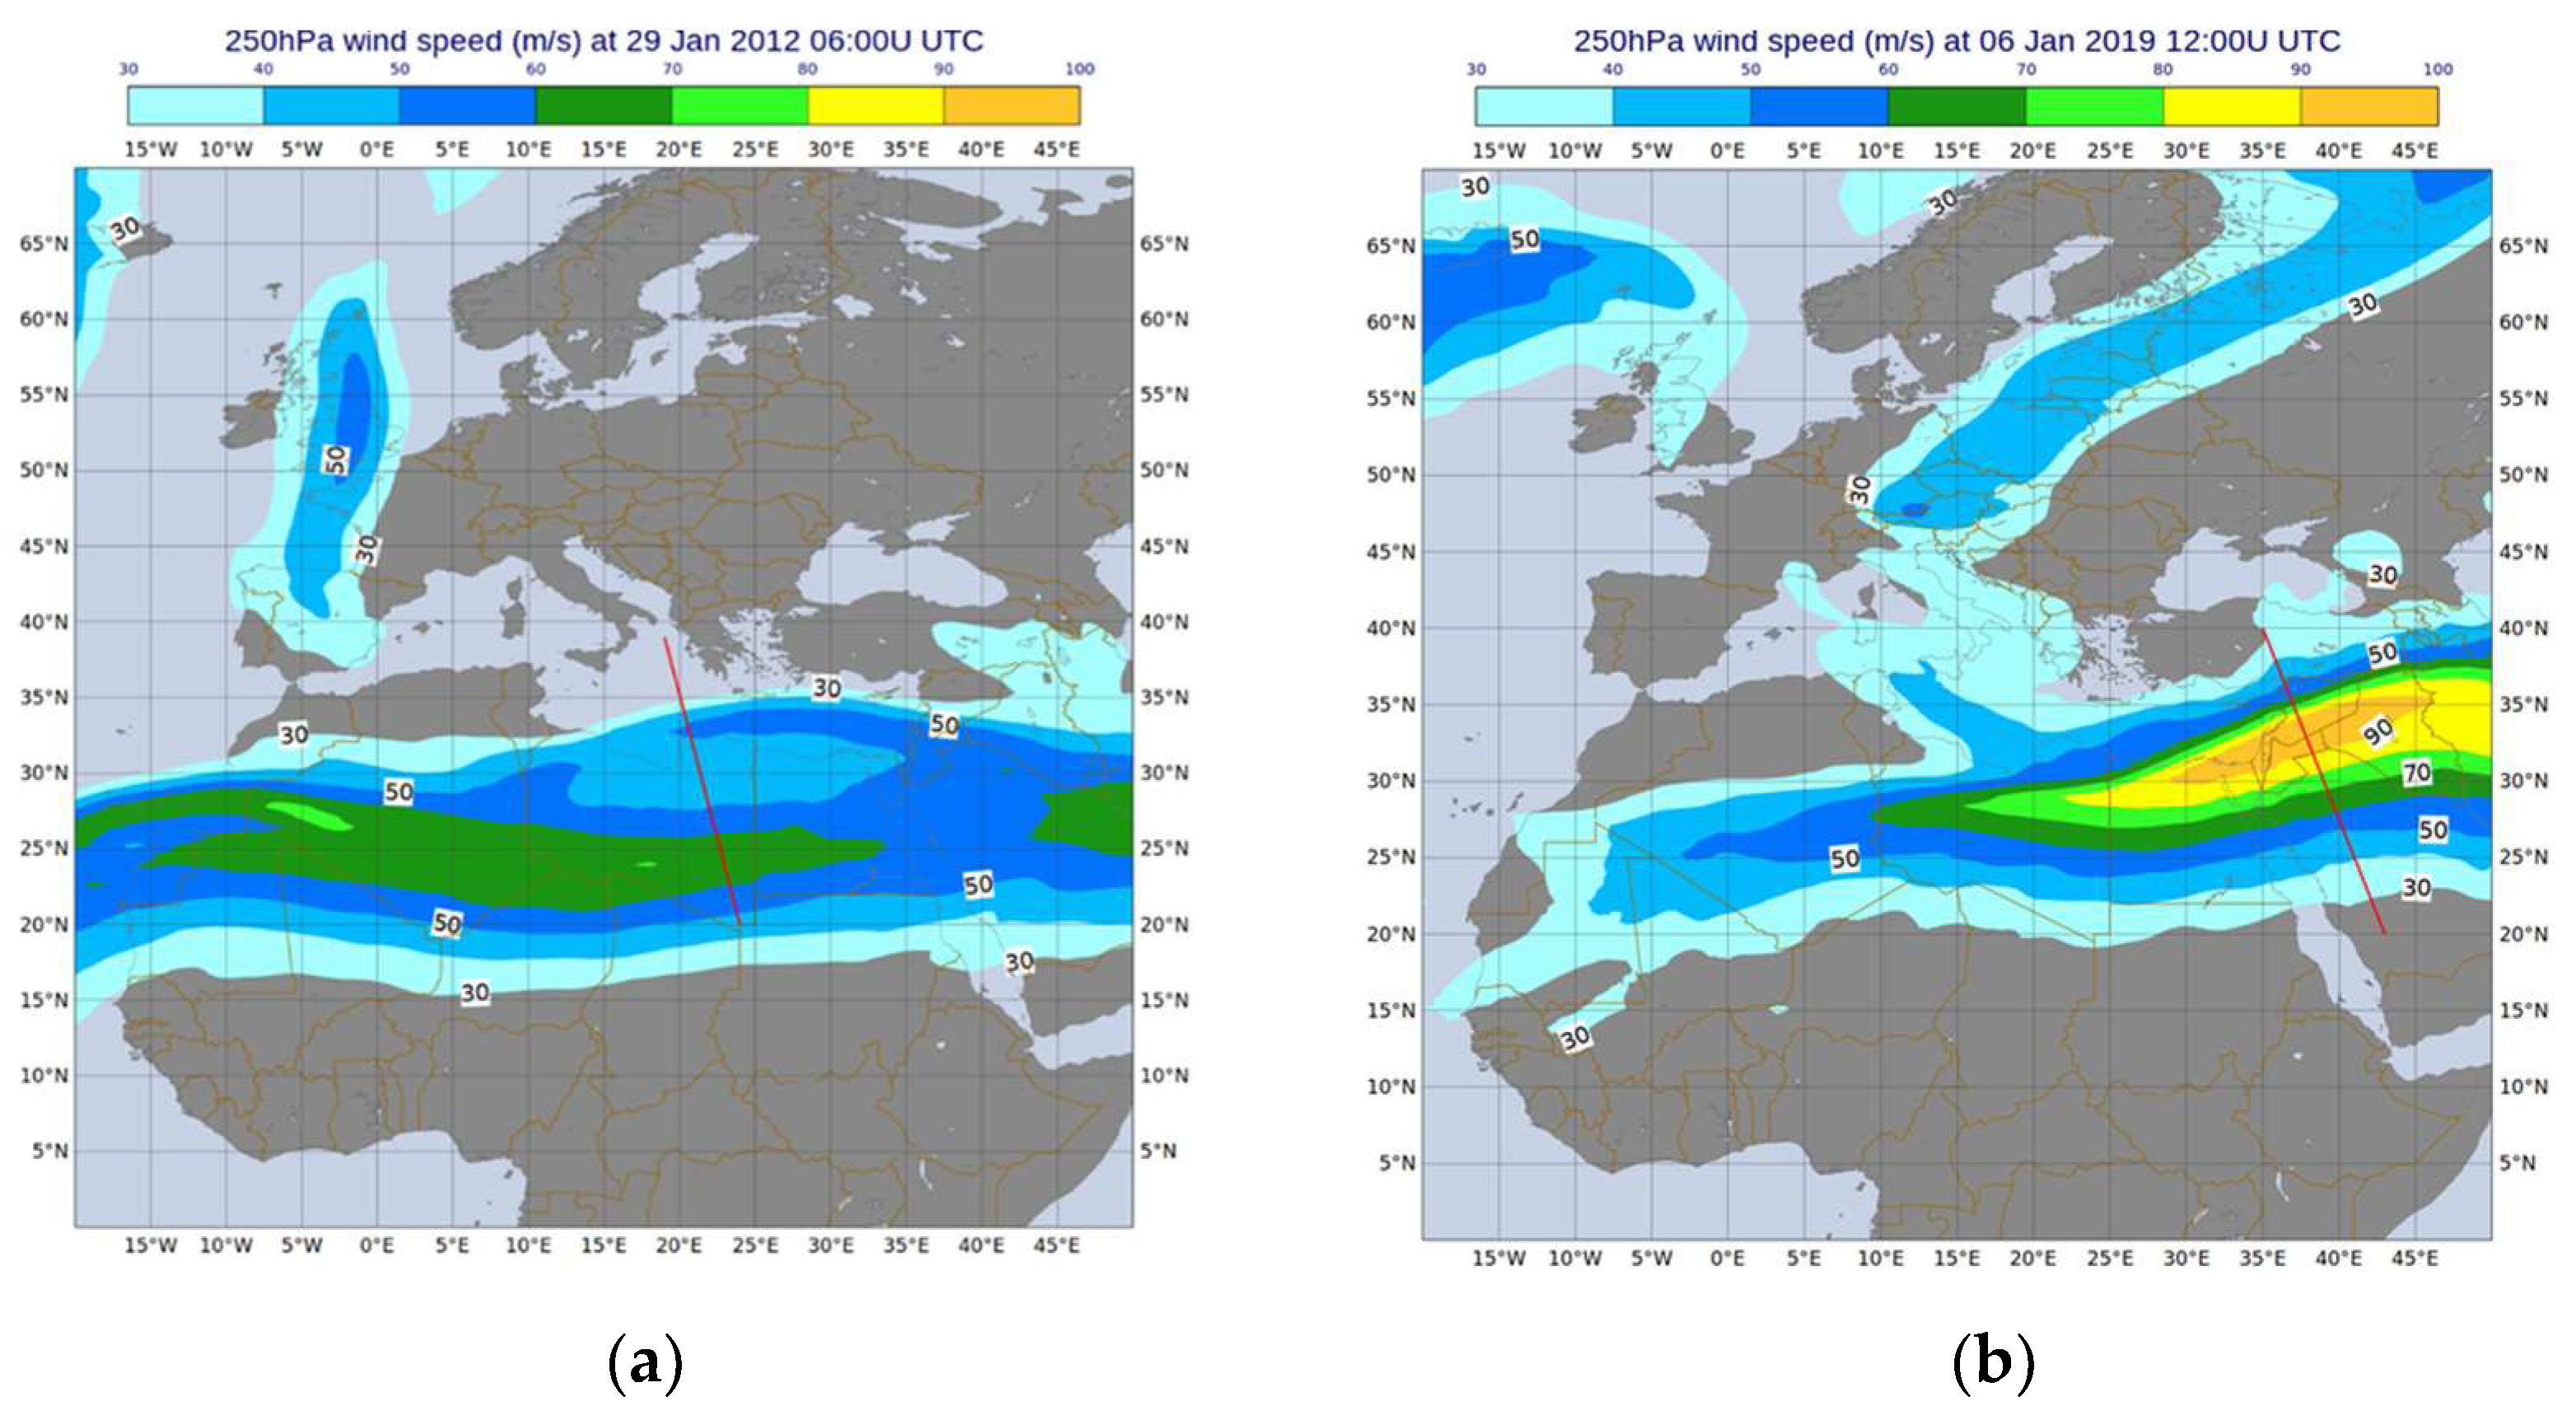
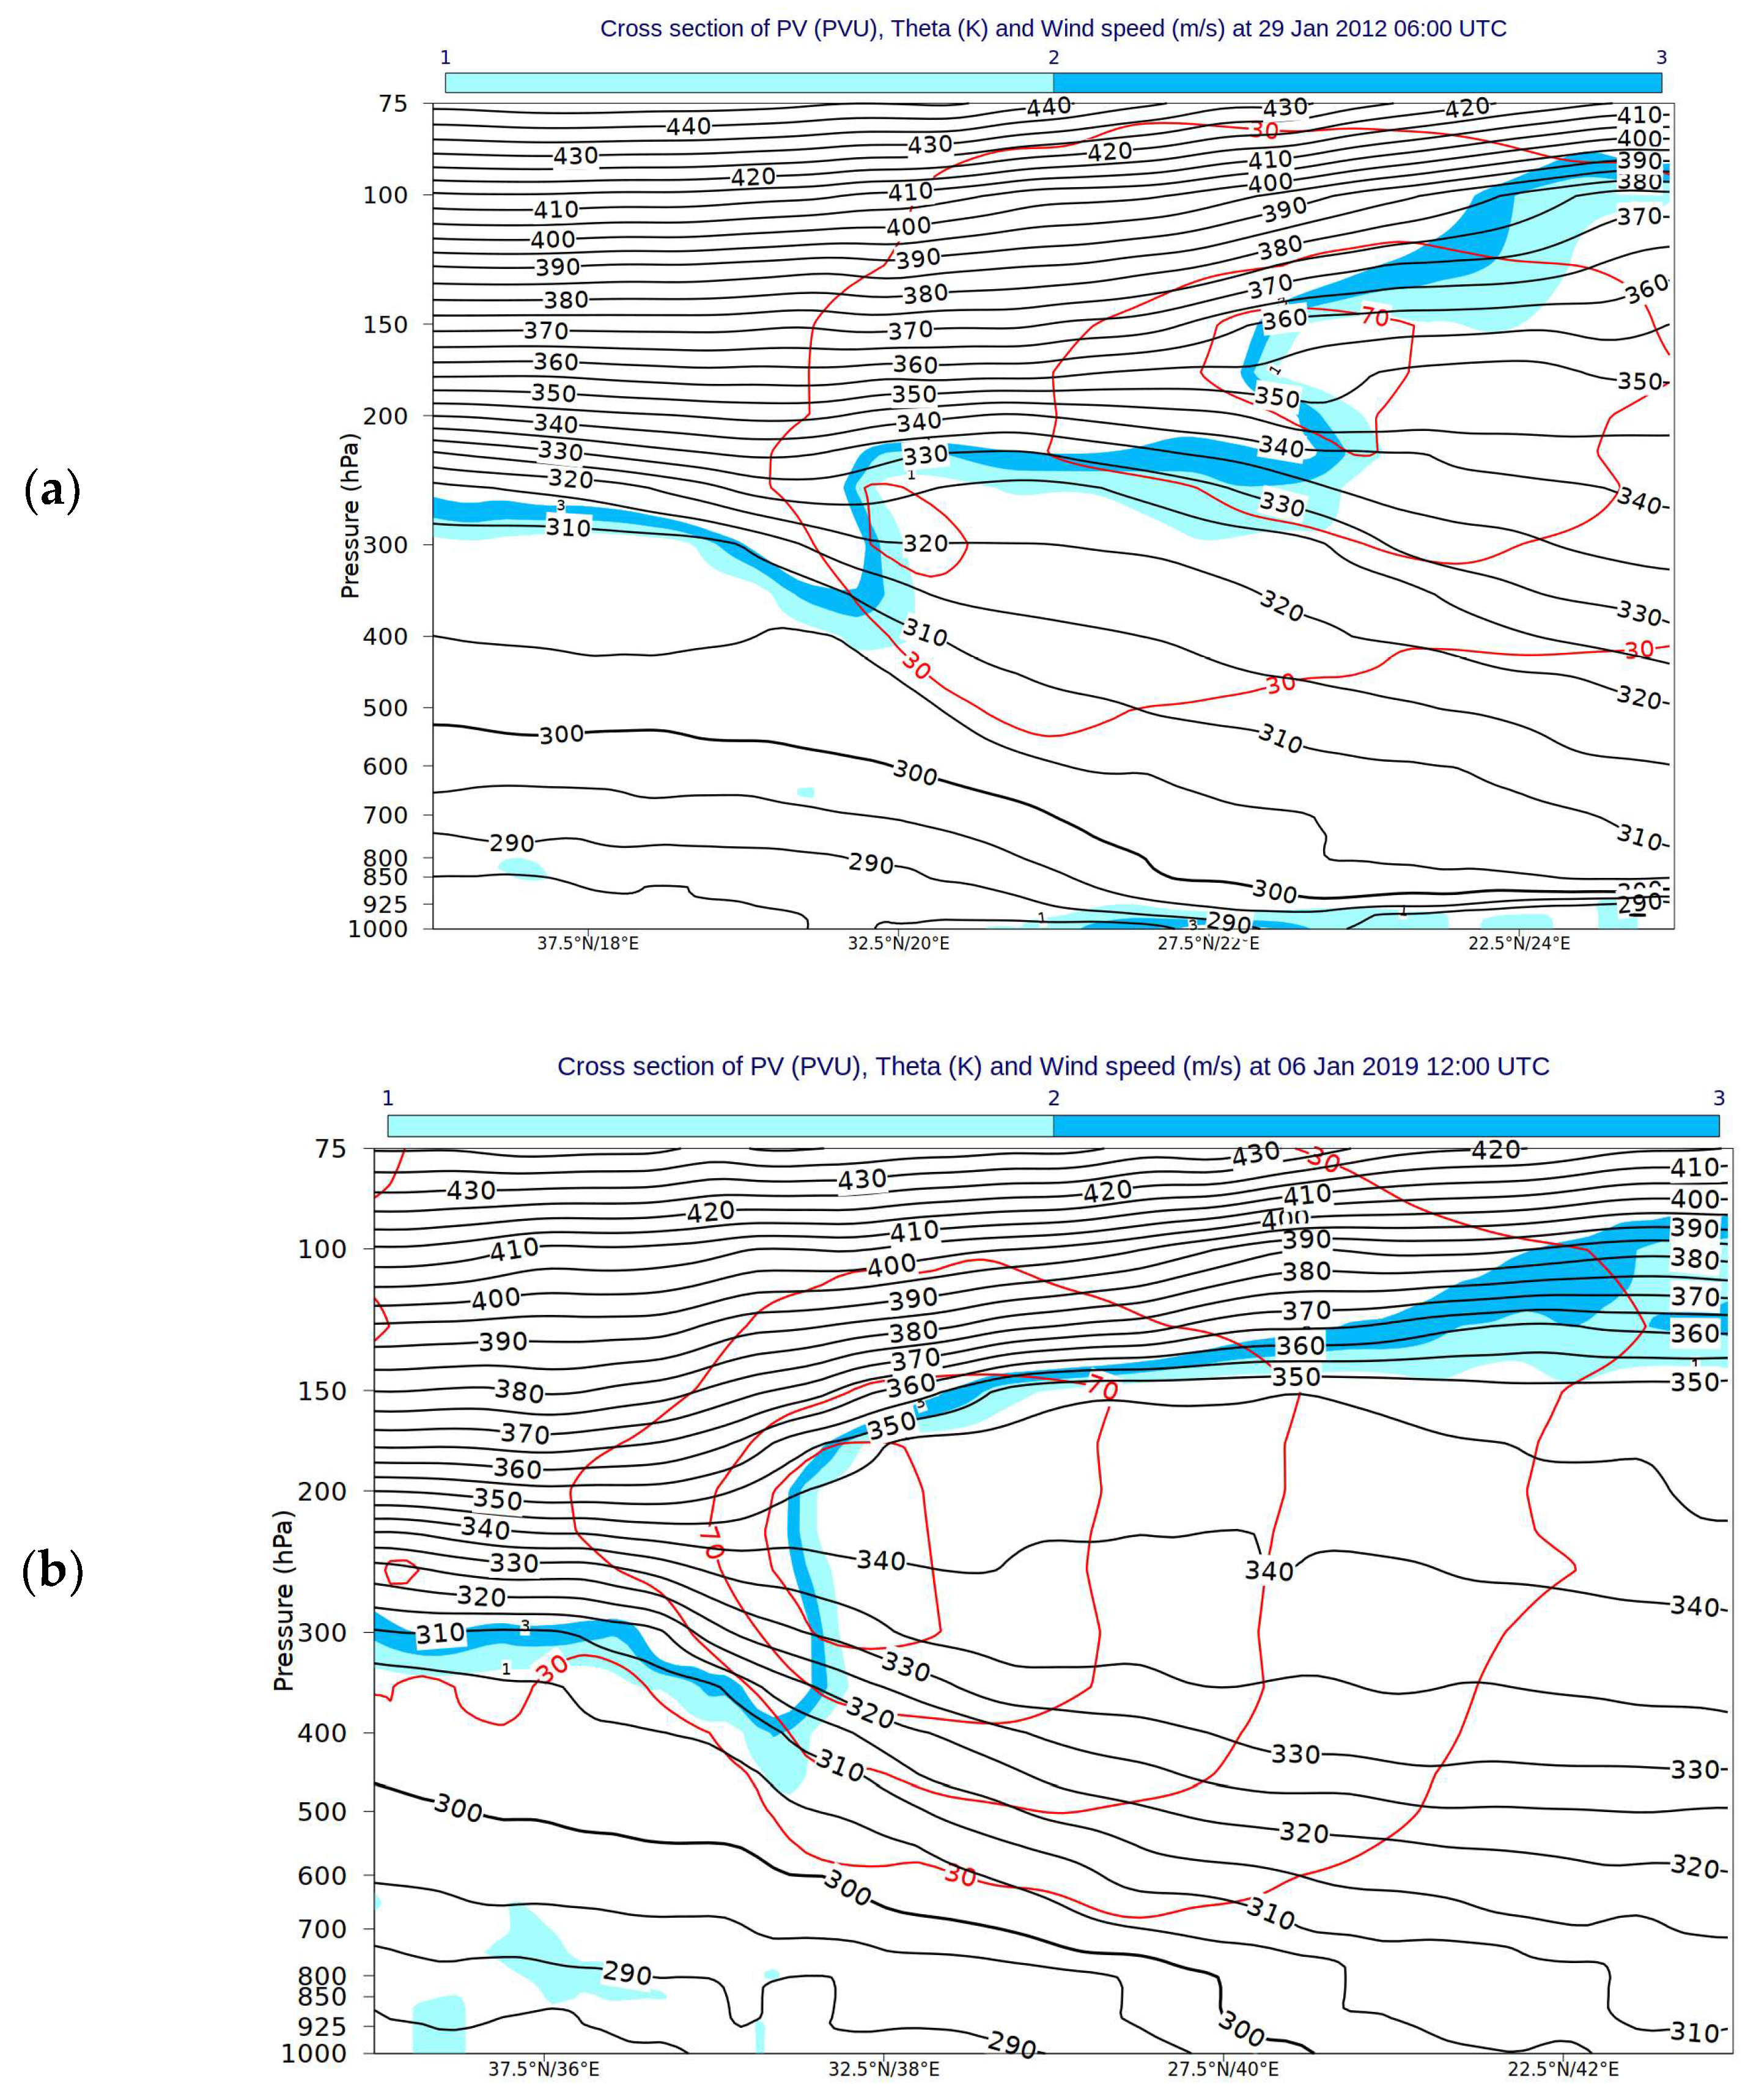
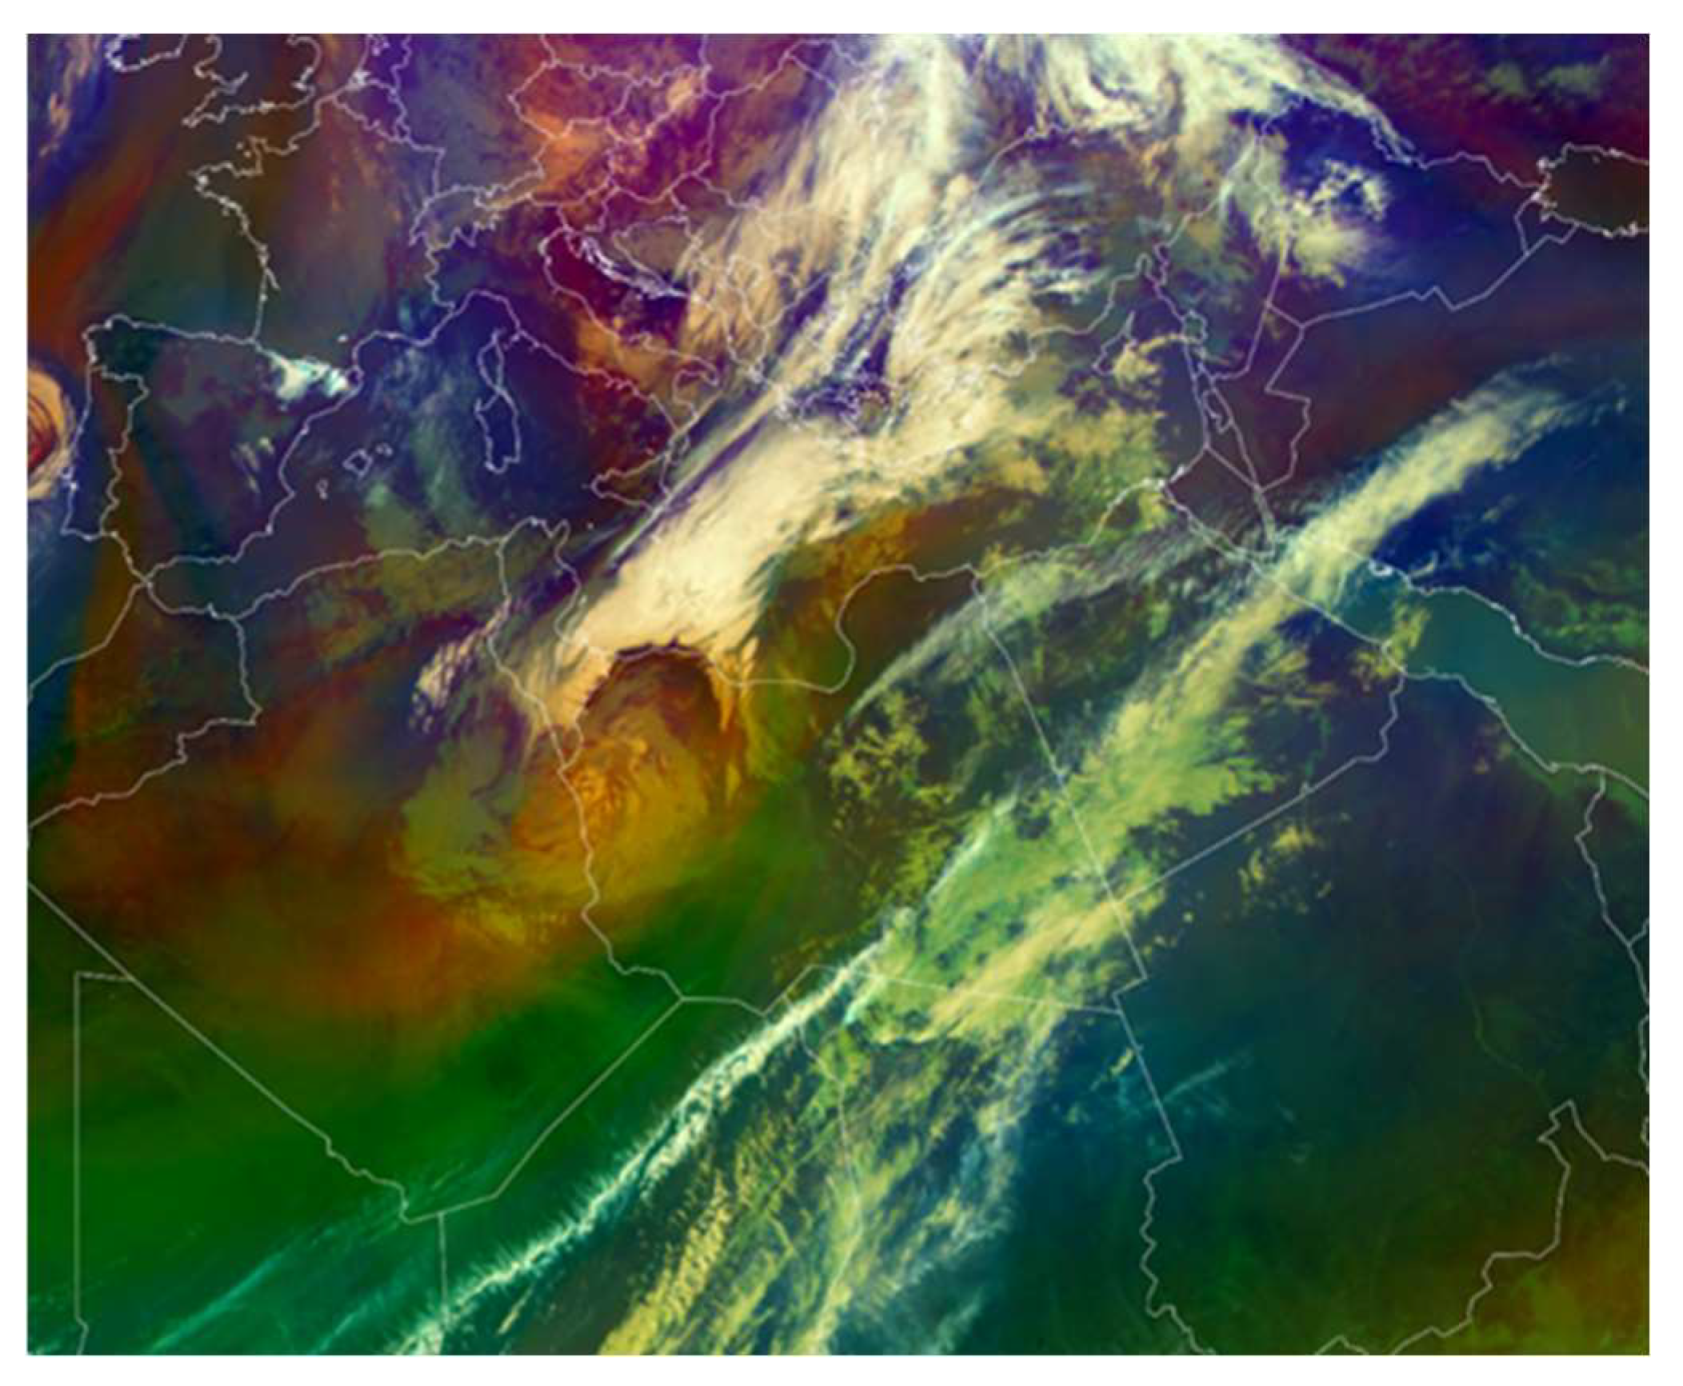
The identification of superposition is restricted over the Mediterranean region, excluding cases that cover only one grid point and last for only one 6 h interval. Figure 1 and Figure 2 present a typical case of the superposition of the two jets as compared with their regular common pattern. Airmass RGB images are also used to support the identification of superposition: the abrupt transition between blue and green, with orange color in a narrow zone between them and located in these latitudes, may reflect the cross-section in superposition events. Additionally, the presence of cirrus clouds in the tropical mass is indicative of the subtropical jet stream (see Figure 3).
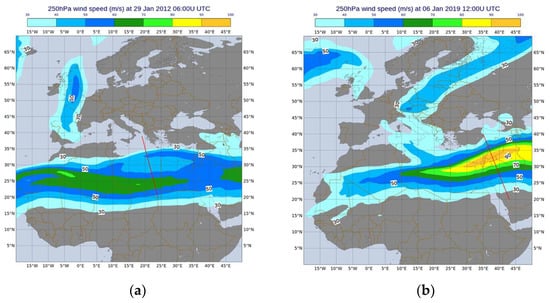
Figure 1.
Wind speed of 250 hPa at (a) 29-01-2012 06:00 UTC (b) at 06-01-2019 12:00 UTC.
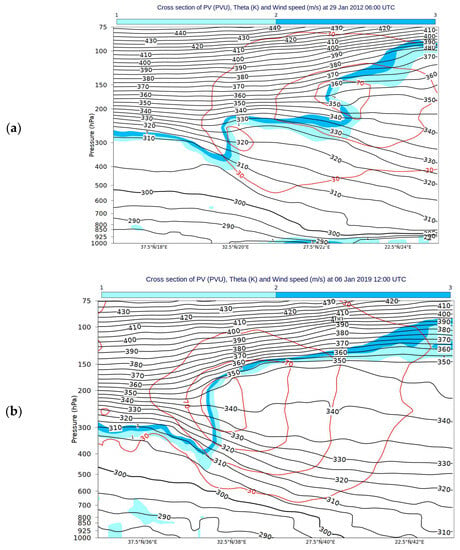

Figure 3.
Airmass RGB at 21-1-2004 12:00 UTC. Blue colors represent cold/polar air masses, red/orange colors represent dry air masses (indicating e.g., subsiding air,) and green colors represent warm/tropical air masses.
By following the recognition of the superposition cases, weather phenomena occurring during or after each event are examined. The satellite images referring from 24 h prior to and up to 48 h after each event were used to examine the weather phenomena that occurred in the vicinity of the superposition. Complimentary to the satellite data, the European Severe Weather Database (ESWD) was used to track reports of severe weather events like heavy precipitation, hail, and severe wind in the region at any specific time [10].
3. Results
During the period from November to December 2004–2022, 422 instances (e.g., synoptic hours) were found to meet the criteria mentioned above for jet stream superposition. Considering sequential hours, 98 events of jet superposition were identified. The interannual variation and the distribution of the location of the events during the examined period (not shown) are in good agreement with the climatology of [5]). It was found that North-East Africa and the Western parts of Asia appear as the locations of the vast majority of cases. Furthermore, February (November) is characterized by maximum (minimum) frequency.
The employment of Airmass RGB products during the first instance of each event showed that 90 out of the 98 cases exhibit the pattern of Figure 3, suggesting the applicability of RGB products to the identification process.
Concerning the connection between superposition and weather events, it was found that 47 superposition cases link to potential severe weather events according to satellite images and ESWD around the location of superposition. The cases that indicated severe weather in satellite imagery, but where no report was found on ESWD, were examined next with the aid of ERA-5 rainfall data. First, the threshold of 50 mm over 12 h or 60 mm over 24 h, which would trigger an orange alarm at Meteoalarm in Greece was considered with seven cases satisfying this threshold. Finally, when the less strict limit of heavy rain of 50 mm in 24 h, which is defined in WMO’s SWIC (https://severeweather.wmo.int/v2/observation.html, accessed on 9 May 2023) is taken into account, five more cases can be characterized as severe. Once all the above-mentioned cases are added up, a total of 55 cases out of 98 may be characterized as severe. Concerning the rest of the cases, 17 featured weather events that were moderate, meaning that they did not meet any criteria for severe weather events’ characterization. The last 26 cases did not demonstrate any noticeable weather occurring.
4. Summary
In this study, the association between severe weather events and jet stream superposition in the Mediterranean region was examined spanning from November to March 2004–2022. There were 422 instances of superposition grouped in 98 events that were included in this research, found mostly over North Africa. The frequency was higher in the winter months, especially in February when the maximum occurrences were found. Satellite imagery (specifically Airmass RGB) can be used to locate possible superposition events when a certain pattern is depicted. By using again satellite images, weather events developing in the region during and after the superposition could be examined. RGB products and infrared images showed that severe storms with low top cloud temperatures occurred in several cases as part of a low-pressure system. Furthermore, reports from the ESWD can provide further evidence of severe weather events. It was found that about 56% of superposition events were followed by high-impact weather that developed in the region, affecting the surrounding countries.
It must be mentioned that although jet stream superposition may lead to stronger divergence at the upper troposphere and is characterized by enhanced baroclinicity, other drivers can also be in play. Therefore, more research needs to be conducted to assess the importance of all drivers and thus clarify the contribution of jet superposition.
Author Contributions
Conceptualization, A.T.; methodology, A.T.; Investigation A.T., C.C. and H.F.; data curation, A.T.; writing—original draft preparation, A.T.; writing—review and editing, C.C. and H.F.; supervision, C.C. All authors have read and agreed to the published version of the manuscript.
Funding
This research received no external funding
Institutional Review Board Statement
Not applicable.
Informed Consent Statement
Not applicable.
Data Availability Statement
The research data is open data mentioned in the main text.
Conflicts of Interest
The authors declare no conflict of interest.
References
- Defant, F.R.; Taba, H. The Threefold Structure of the Atmosphere and the Characteristics of the Tropopause. Tellus 1957, 9, 259–274. [Google Scholar] [CrossRef]
- Ramaswamy, C. On the Sub-tropical Jet Stream and its Role in the Development of Large-scale Convection. Tellus 1956, 8, 26–60. [Google Scholar] [CrossRef]
- Uccellini, L.W.; Kocin, P.J. The Interaction of Jet Streak Circulations during Heavy Snow Events along the East Coast of the United States. Weather. Forecast. 1987, 2, 289–308. [Google Scholar] [CrossRef]
- Mohri, K. On the Fields of Wind and Temperature over Japan and Adjacent Waters during Winter of 1950–1951. Tellus 1953, 5, 340–358. [Google Scholar] [CrossRef]
- Christenson, C.E.; Martin, J.E.; Handlos, Z.J. A Synoptic Climatology of Northern Hemisphere, Cold Season Polar and Subtropical Jet Superposition Events. J. Clim. 2017, 30, 7231–7246. [Google Scholar] [CrossRef]
- Handlos, Z.J.; Martin, J.E. Composite Analysis of Large-Scale Environments Conducive to Western Pacific Polar/Subtropical Jet Superposition. J. Clim. 2016, 29, 7145–7165. [Google Scholar] [CrossRef]
- Winters, A.C.; Martin, J.E. The Role of a Polar/Subtropical Jet Superposition in the May 2010 Nashville Flood. Weather. Forecast. 2014, 29, 954–974. [Google Scholar] [CrossRef]
- Winters, A.C.; Martin, J.E. Synoptic and mesoscale processes supporting vertical superposition of the polar and subtropical jets in two contrasting cases. Q. J. R. Meteorol. Soc. 2016, 142, 1133–1149. [Google Scholar] [CrossRef]
- Winters, A.C.; Martin, J.E. Diagnosis of a North American Polar–Subtropical Jet Superposition Employing Piecewise Potential Vorticity Inversion. Mon. Weather. Rev. 2017, 145, 1853–1873. [Google Scholar] [CrossRef]
- Dotzek, N.; Groenemeijer, P.; Feuerstein, B.; Holzer, A.M. Overview of ESSL’s severe convective storms research using the European Severe Weather Database ESWD. Atmos. Res. 2009, 93, 575–586. [Google Scholar] [CrossRef]
Disclaimer/Publisher’s Note: The statements, opinions and data contained in all publications are solely those of the individual author(s) and contributor(s) and not of MDPI and/or the editor(s). MDPI and/or the editor(s) disclaim responsibility for any injury to people or property resulting from any ideas, methods, instructions or products referred to in the content. |
© 2023 by the authors. Licensee MDPI, Basel, Switzerland. This article is an open access article distributed under the terms and conditions of the Creative Commons Attribution (CC BY) license (https://creativecommons.org/licenses/by/4.0/).