Abstract
Thermal comfort is a key aspect of optimal conditions in urban public spaces. Air temperature, relative humidity, wind speed, and globe temperature measurements are critical components of bioclimatic research in the broader scientific field of urban space quality assessment. The evaluation of thermal comfort in public spaces frequently requires field measurements over long periods and at multiple sites at the same time. This can be challenging on a qualitative and quantitative level. Finding the most accurate way to collect such data in an accessible and manageable way is crucial in the context of an urban field study. Data from various instruments were evaluated and statistically compared in order to assess possible instrument synergy or even similarities that would allow a transition to a simplified way of measuring these determinants of thermal comfort.
1. Introduction
Comfort, particularly thermal comfort, is a fundamental feature of urban public spaces that has a direct impact on the quality of life of city people. External thermal comfort in urban public places is strongly tied to people’s well-being, especially in hot regions where heat stress conditions and the impact on residents’ health are significant [1]. Thermal comfort is frequently measured using a variety of bioclimatic parameters such as air temperature (Ta), relative humidity (RH), wind speed (WS), and globe temperature (Tg) [2,3,4]. These data are critical not only for understanding and analyzing the thermal environment of public areas, but also for identifying infections and developing ways to improve thermal comfort for users. Given the process’s complexity, both qualitatively and computationally, collecting bioclimatic data in metropolitan public places can be challenging [5,6]. Field measurements may be necessary over long periods of time and at several sites at the same time, making data collecting an intensive and time-consuming process. Furthermore, the cost of the necessary equipment and regular maintenance might be prohibitively expensive for many research studies and urban environmental exploration and planning efforts, restricting the range and scale of such projects. As a result, an easier and more accessible method of instrumental monitoring of bioclimatic parameters in urban public places is required. In this study, we expect to identify possible synergies or similarities between different bioclimatic instruments of varying cost (which affects the economic viability of each project) and physical size (which affects the ease of implementing measurements) in order to create a simplified approach to data collection. The aim of this study is to contribute to the creation of a more accessible and viable technique of evaluating the bioclimatic determinants of thermal comfort, with the goal of enhancing the convenience and accessibility of researching the urban environment.
2. Methodology
In order to compare the various instruments and determine the possible use of more portable and affordable solutions for bioclimatological research, three different setups were employed. A micrometeorological station for reference, a portable heat stress tracker (Kestrel 5400) measuring Ta (TaK), RH (RHK), Tg (TgK) and WS (WSK) and a shielded portable thermohygrometer (HOBO MX2302A) measuring Ta (TaH) and RH (RHH). The reference station consisted of a Delta-T GP2 logger connected to a shielded ADCON TR1 thermohygrometer measuring Ta (TaS) and RH (RHS), an Atmos 22 sonic anemometer measuring WS (WSS) and a PT100 thermometer inserted into a PVC 40 mm diameter sphere painted grey (RAL 7001), measuring Tg (TgS). All sensors were installed 1.1 m from the ground in an open location (Figure 1) on the premises of AUA and measurements were logged in 10 min intervals from 9.00 AM to 17.00 PM on 8 May 2023. Specifications of instruments are presented in table (Table 1). Statistical analysis was conducted using SPSS 26 and Jamovi 2.3.21 software. Correlation of measurements was estimated according to Spearman’s rank-order and Pearson product–moment correlation methodologies. Descriptive statistics for all measurements plus the difference between the reference station and the two other instruments are presented in Figure 2 and Table 2, Table 3, Table 4 and Table 5.
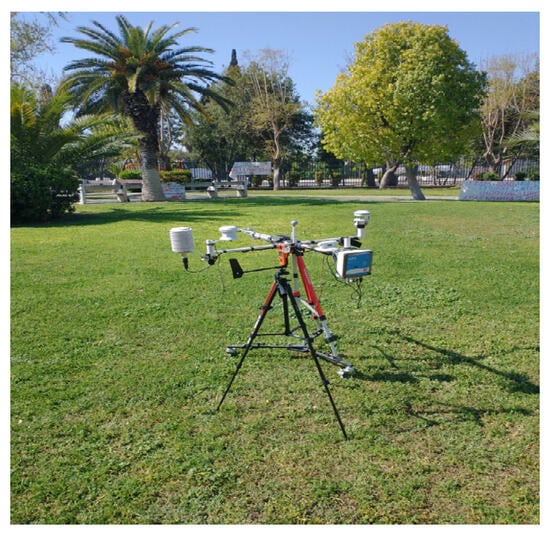
Figure 1.
Photograph captured in the measuring field.

Table 1.
Instrument specifications.
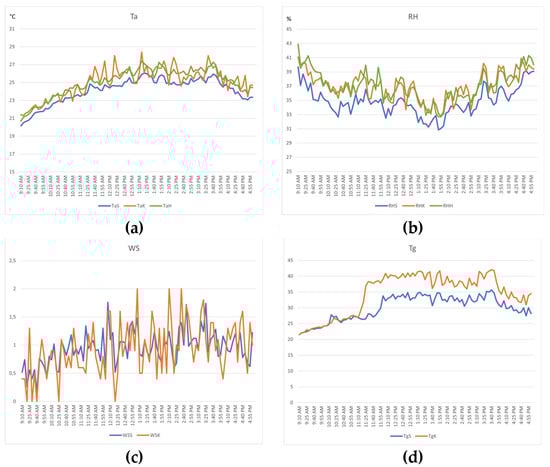
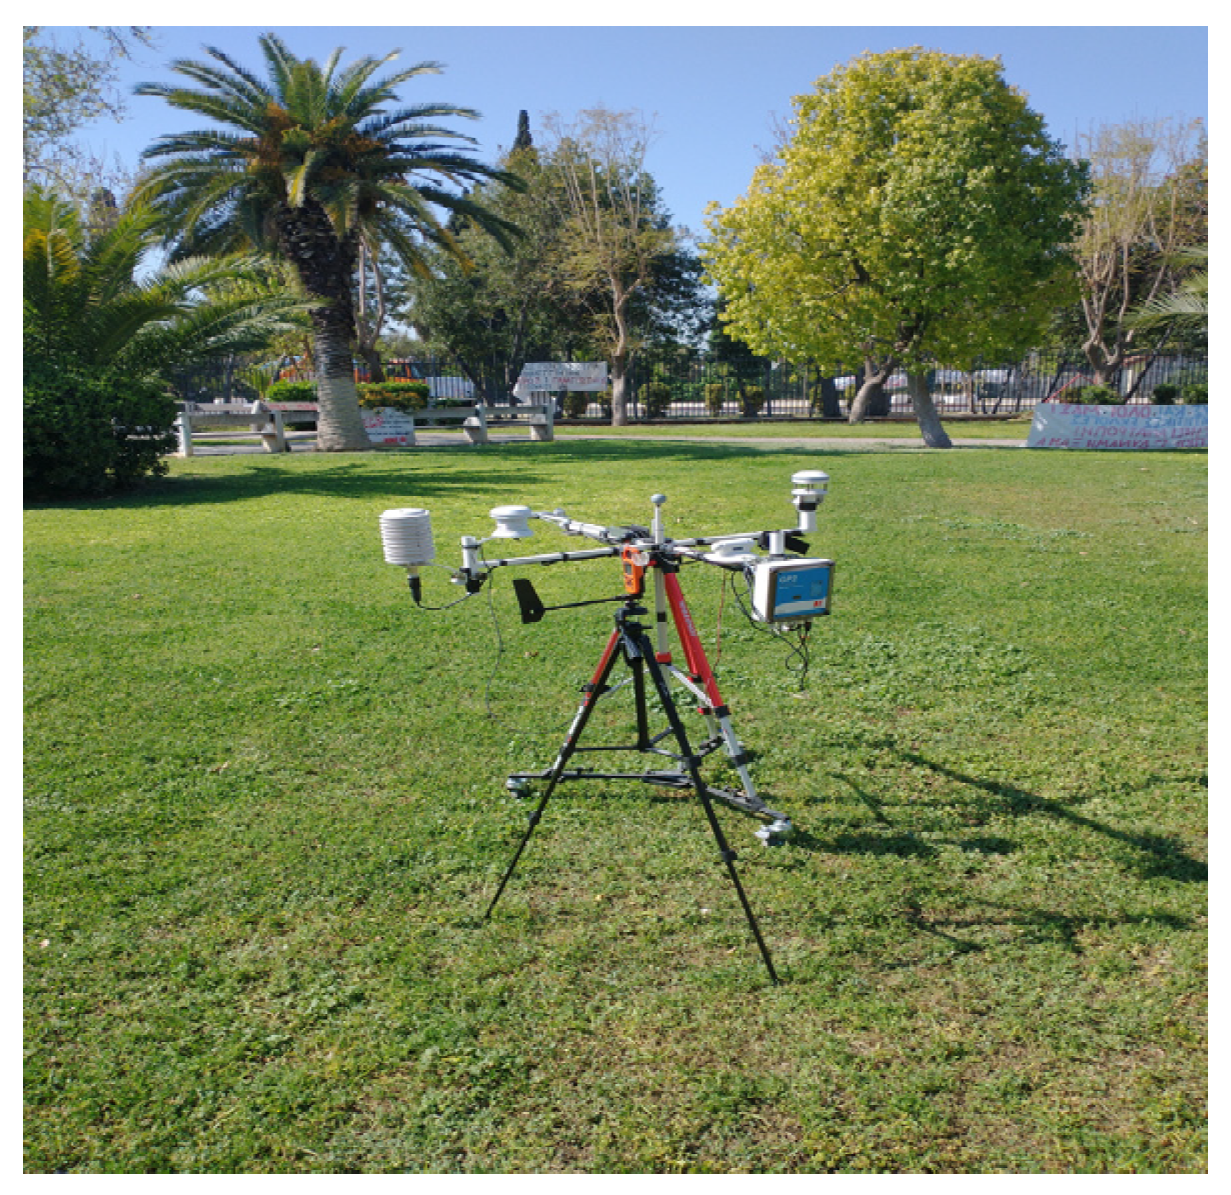
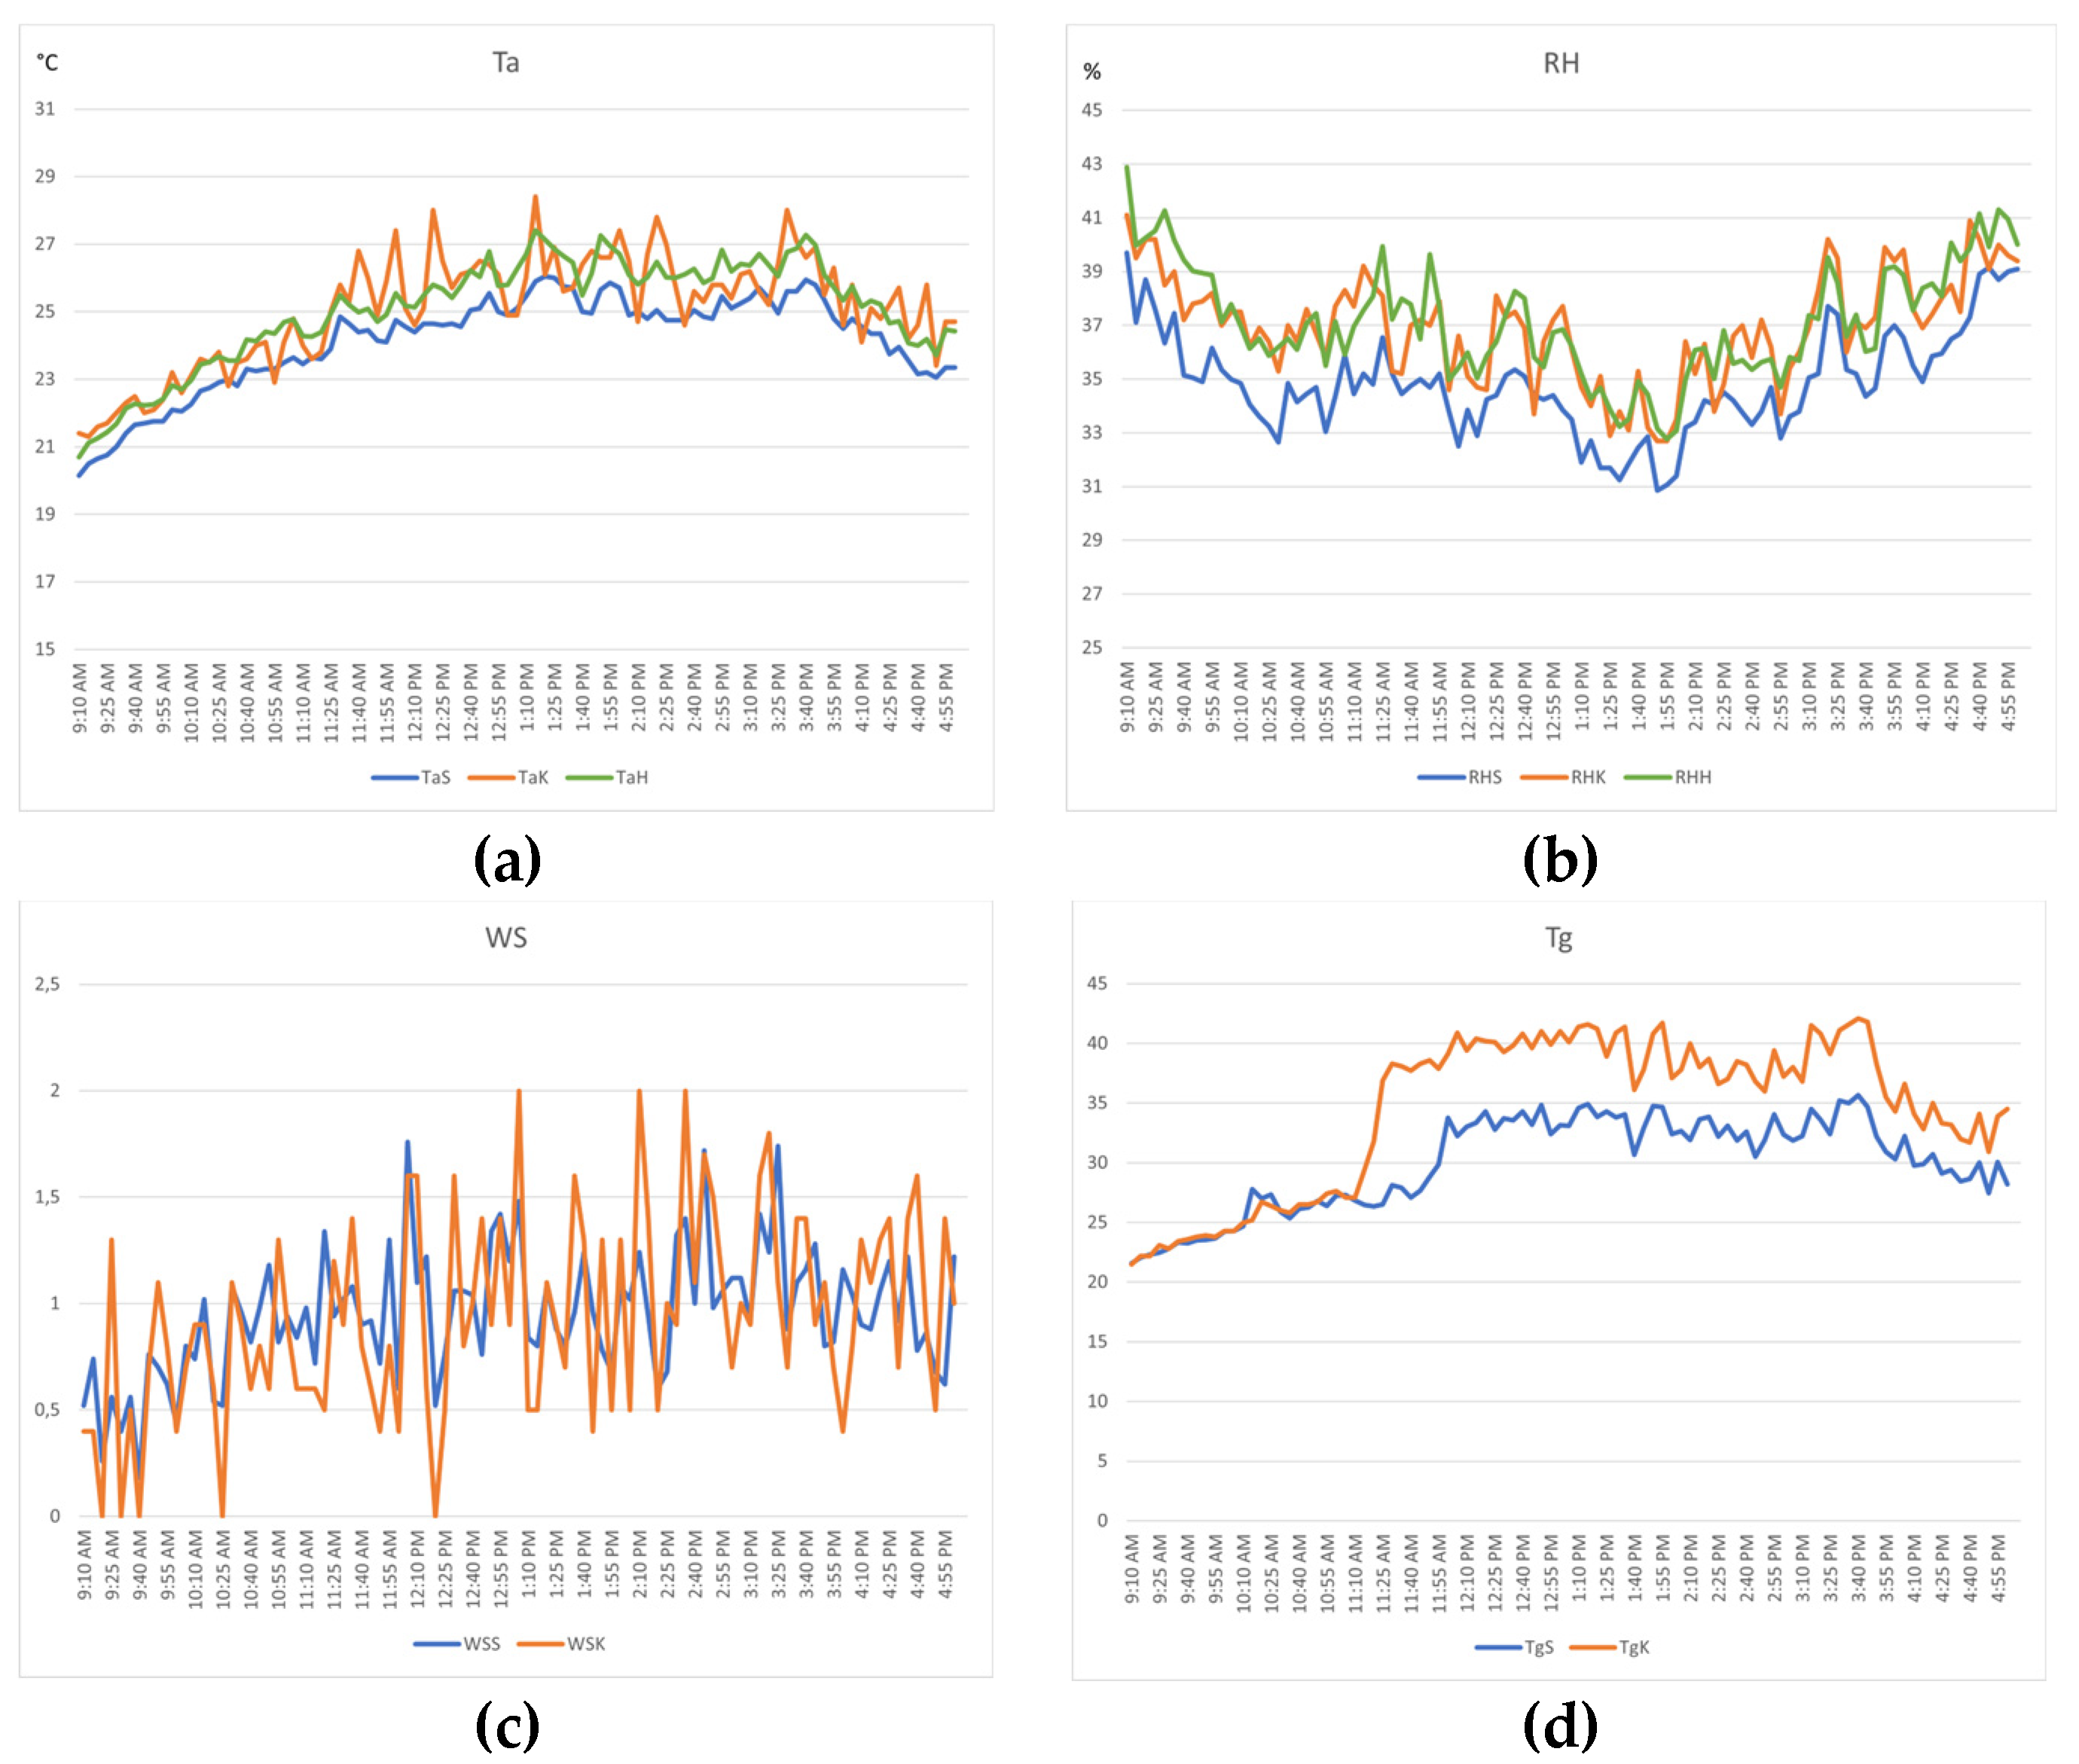
Figure 2.
Air temperature values (a); relative humidity values (b); wind speed values (c); globe temperature values (d) as logged during the experiment.
Table 2.
Descriptives (Ta/°C).
Table 3.
Descriptives (RH/%).
Table 4.
Descriptives (Tg/°C).
Table 5.
Descriptives (WS/m/s).
3. Results
The Ta values had a similar mean ΔTa for TaH and TaK compared with the Ta values logged in the reference station (−0.92 K). The TaK values had a bigger range compared with the other two instruments. This could be due to the fact that the thermometer in Kestrel 5400 is exposed in contrast with the other two instruments. The RHK values followed the RHS values in greater detail compared with the RHH values. The mean WSK values were similar to the WSS values (mean ΔWS = 0.02%). The mean ΔTg value between TgK and TgS was −4.48 K but the two instruments’ responses to solar radiation appear correlated. Examining the TaS, TaK and TaH values, there was a statistically significant positive correlation. Between TaS and TaK; rs = 0.818 (p < 0.005), between TaS and TaH, rs = 0.982 (p < 0.005); and between TaK and TaH, rs = 0.833 (p < 0.005). Examining RHS, RHK and RHH values, there was a statistically significant positive correlation as follows: between RHS and RHK, rs = 0.858 (p < 0.005); between RHS and RHH, rs = 0.912 (p < 0.005); and between RHK and RHH, rs = 0.854 (p < 0.005). There was also a statistically significant positive correlation between WSS and WSK (rs = 0.6, p < 0.005) and between TgS and TgK (rs = 0.922, p < 0.005).
As a more affordable and portable solution compared to a full micrometeorological station, the HOBO MX2302A appeared to give better measurements for Ta and RH compared to Kestrel 5400. The WS values from Kestrel 5400 were comparable to the WS values logged in the reference station but must be used with caution, especially due to the lack of more detailed logging options in Kestrel 5400 and the different operational principal of the two anemometers (sonic vs. vane). However, the Tg values logged in Kestrel 5400 in comparison with Tg values from the reference station appeared to be significantly correlated.
4. Conclusions
In conclusion, the first findings indicate that the use of portable and less expensive instruments may be a feasible alternative to a full scientific micrometeorological station in bioclimatological research. However, further study is needed to properly comprehend the possibilities of this method. Future research should be conducted under a broader range of environmental variables, such as different seasons (winter, summer and transitional periods), and varying levels of shading. Furthermore, the number of measurements obtained should be raised in order to examine the efficiency of these devices more thoroughly. Overall, the objective of this continuing research is to discover the optimal instrumental configurations that will allow for more accessible and cost-effective bioclimatic monitoring.
Author Contributions
Conceptualization, E.M. and A.M.; methodology, E.M. and A.M.; software E.M.; writing—original draft preparation, E.M. and A.M.; writing—review and editing, E.M., A.M., I.T. and G.V. All authors have read and agreed to the published version of the manuscript.
Funding
This research received no external funding.
Institutional Review Board Statement
Not applicable.
Informed Consent Statement
Not applicable.
Data Availability Statement
The data presented in this study are available on request from the corresponding author. The data are not publicly available yet.
Acknowledgments
The authors would like to thank Christina Mamasi for her support in the experimental part of this research.
Conflicts of Interest
The authors declare no conflict of interest.
References
- Tseliou, A.; Tsiros, I.X.; Nikolopoulou, M.; Papadopoulos, G. Outdoor thermal sensation in a Mediterranean climate (Athens): The effect of selected microclimatic parameters. Arch. Sci. Rev. 2015, 59, 190–202. [Google Scholar] [CrossRef]
- Matzarakis, A.; Nastos, P. Heat Waves in Athens. In Proceedings of the 8th Conference on Meteorology-Climatology-Atmospheric Physics, Athens, Greece, 25–29 September 2023; pp. 153–160. [Google Scholar]
- Tapias, E.; Matzarakis, A.; Schmitt, G. First results of the data acquisition and analysis of microclimate conditions in Barranquilla, Colombia. In Proceedings of the ICUC9—9th International Conference on Urban Climate. NOMTM6: Urban Climate Measurement Networks, Toulouse, France, 20–24 July 2015. [Google Scholar] [CrossRef]
- Wang, R.; Zhao, J.; Meitner, M.J.; Hu, Y.; Xu, X. Characteristics of urban green spaces in relation to aesthetic preference and stress recovery. Urban For. Urban Green. 2019, 41, 6–13. [Google Scholar] [CrossRef]
- Kalogeropoulos, G.; Dimoudi, A.; Toumboulidis, P.; Zoras, S. Urban Heat Island and Thermal Comfort Assessment in a Medium-Sized Mediterranean City. Atmosphere 2022, 13, 1102. [Google Scholar] [CrossRef]
- Jin, H.; Cui, P.; Wong, N.H.; Ignatius, M. Assessing the Effects of Urban Morphology Parameters on Microclimate in Singapore to Control the Urban Heat Island Effect. Sustainability 2018, 10, 206. [Google Scholar] [CrossRef]
Disclaimer/Publisher’s Note: The statements, opinions and data contained in all publications are solely those of the individual author(s) and contributor(s) and not of MDPI and/or the editor(s). MDPI and/or the editor(s) disclaim responsibility for any injury to people or property resulting from any ideas, methods, instructions or products referred to in the content. |
© 2023 by the authors. Licensee MDPI, Basel, Switzerland. This article is an open access article distributed under the terms and conditions of the Creative Commons Attribution (CC BY) license (https://creativecommons.org/licenses/by/4.0/).