1. Introduction
Teleconnection patterns play an important role in determining regional climate variability and extremes, as they constitute a significant component of natural climatic variability. While the spatial and temporal characteristics of the patterns affecting the Mediterranean region have been already evaluated along with their impacts on Mediterranean winter climate variability and extremes (e.g., [
1,
2]), there are open questions about the underlying dynamical mechanisms that contribute to the development of these patterns, their intra-annual variations, and possible relationships among them. In addition, the mechanisms linking climate variability over the North Atlantic with the Mediterranean intraseasonal variability have not been rigorously demonstrated in previous works. Traditional statistical analysis of climate variability has vastly exploited concepts based on linear correlations and composites; however, it exhibits several weaknesses.
Here, we apply a causal discovery approach using the PCMCI (Peter and Clark algorithm combined with the Momentary Conditional Independence approach; see
Section 2) method [
3]. The main advantage of causal discovery tools is that they can identify and remove spurious correlations [
3,
4,
5] and, thus, provide insight into the potential causal relationships [
6].
The resulting weighted network representation of causal interdependencies is referred to as a Causal Effect Network (CEN) [
7,
8]. A CEN detects and visualizes the causal relationships among a set of variables. Finally, we can visually highlight causally related spatial structures, grounded on the concept of causal maps [
9].
Here, we applied the PCMCI+CEN approach to a set of teleconnection indices of the Northern Hemisphere that had been found to affect the Mediterranean climate, to investigate their inter-relationship and their links with the Mediterranean climate.
2. Material and Methods
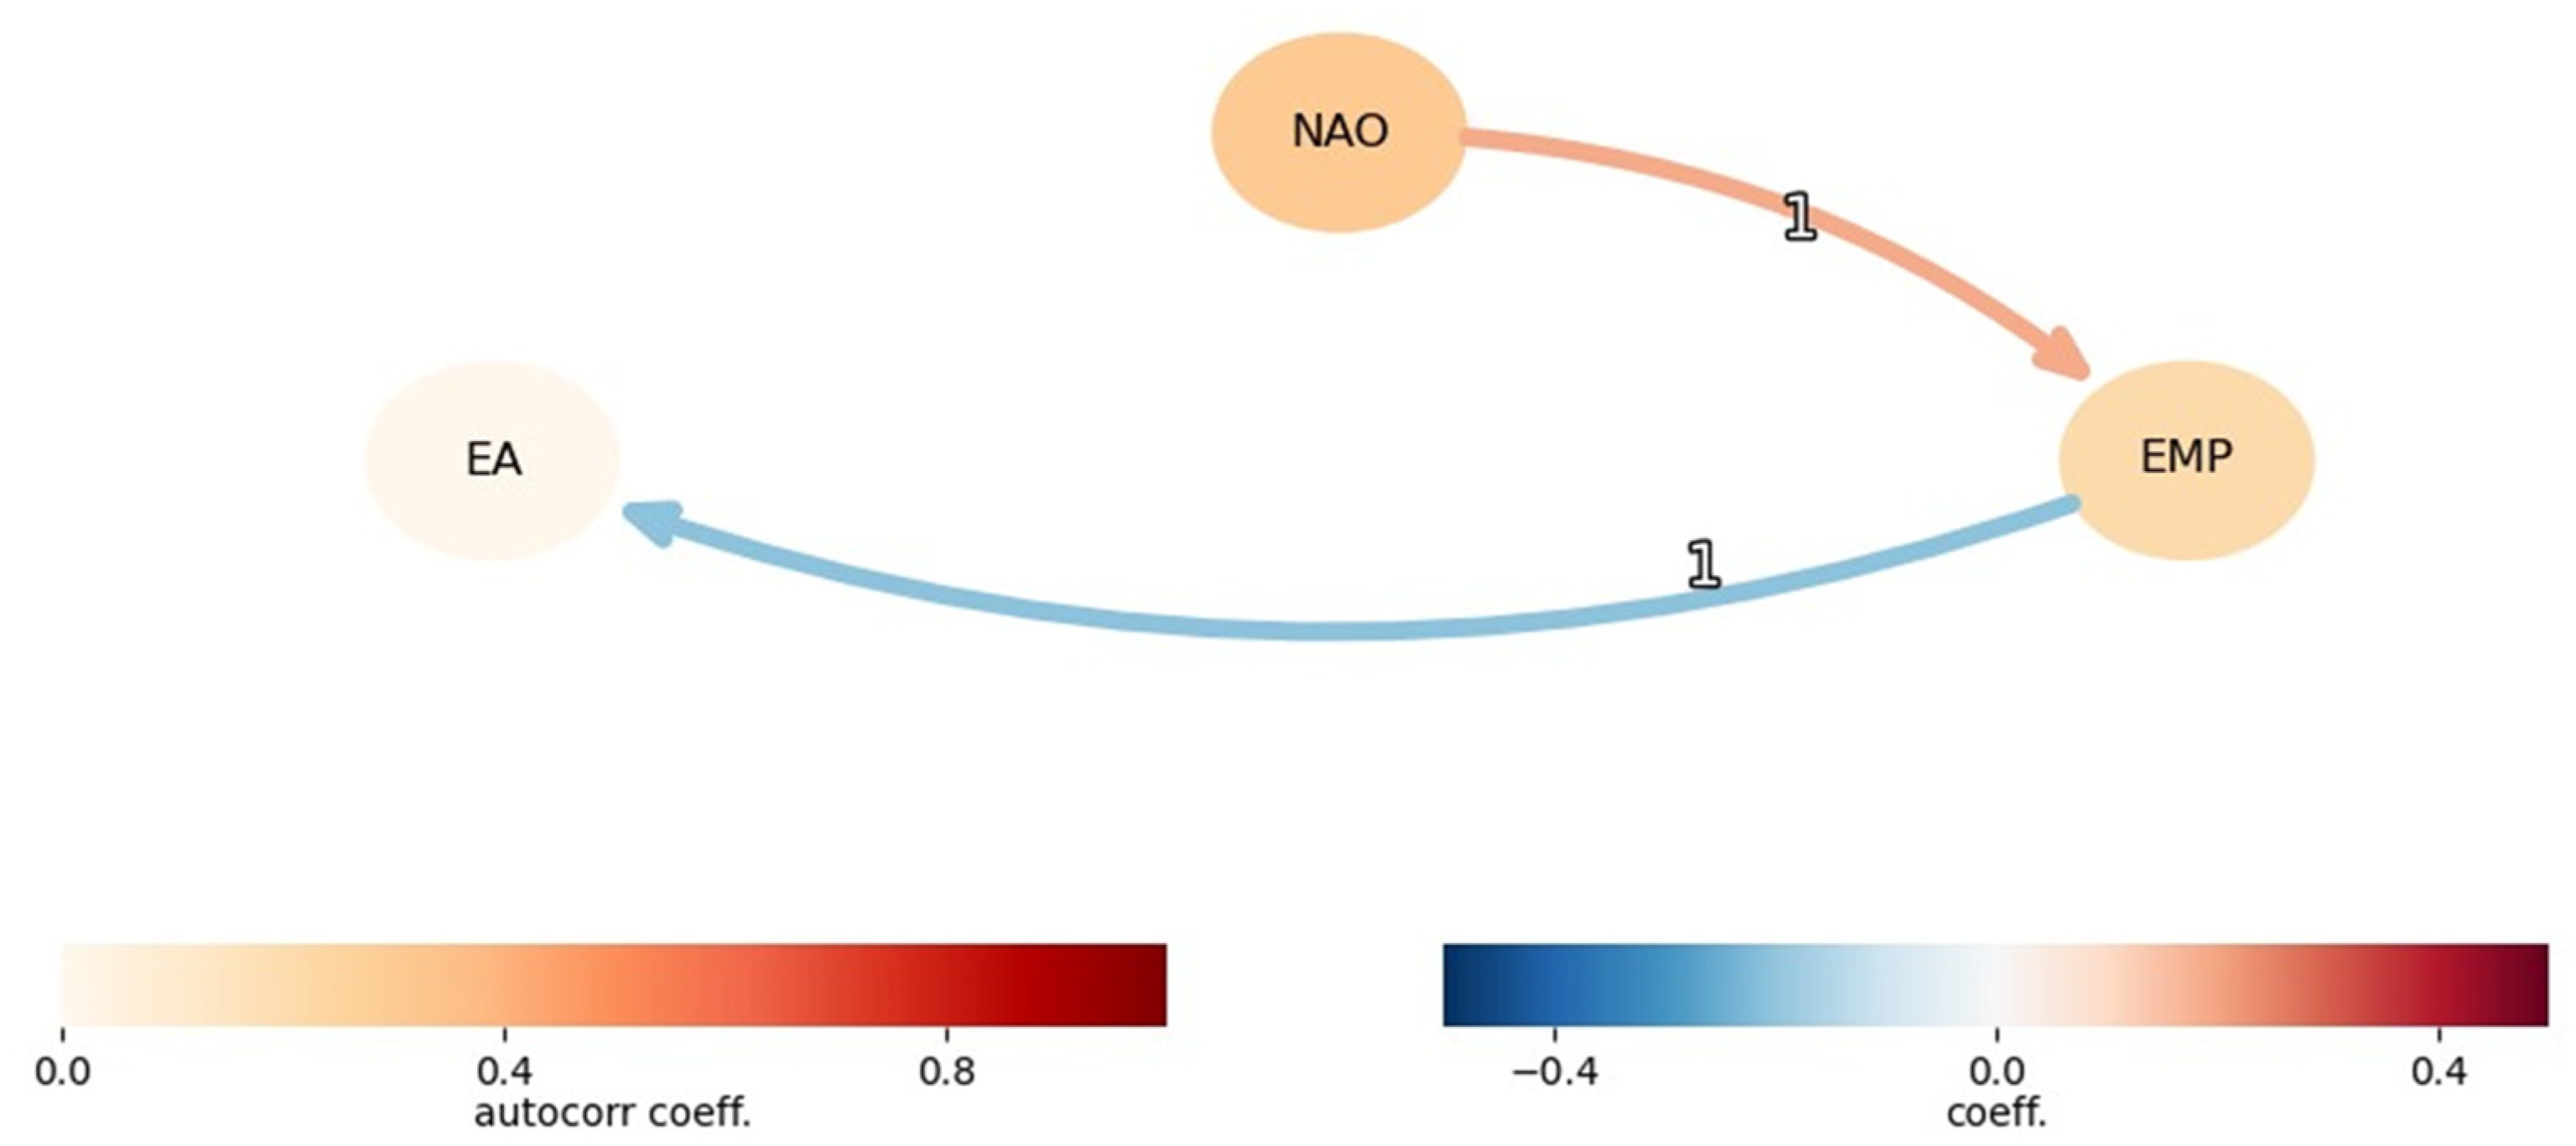
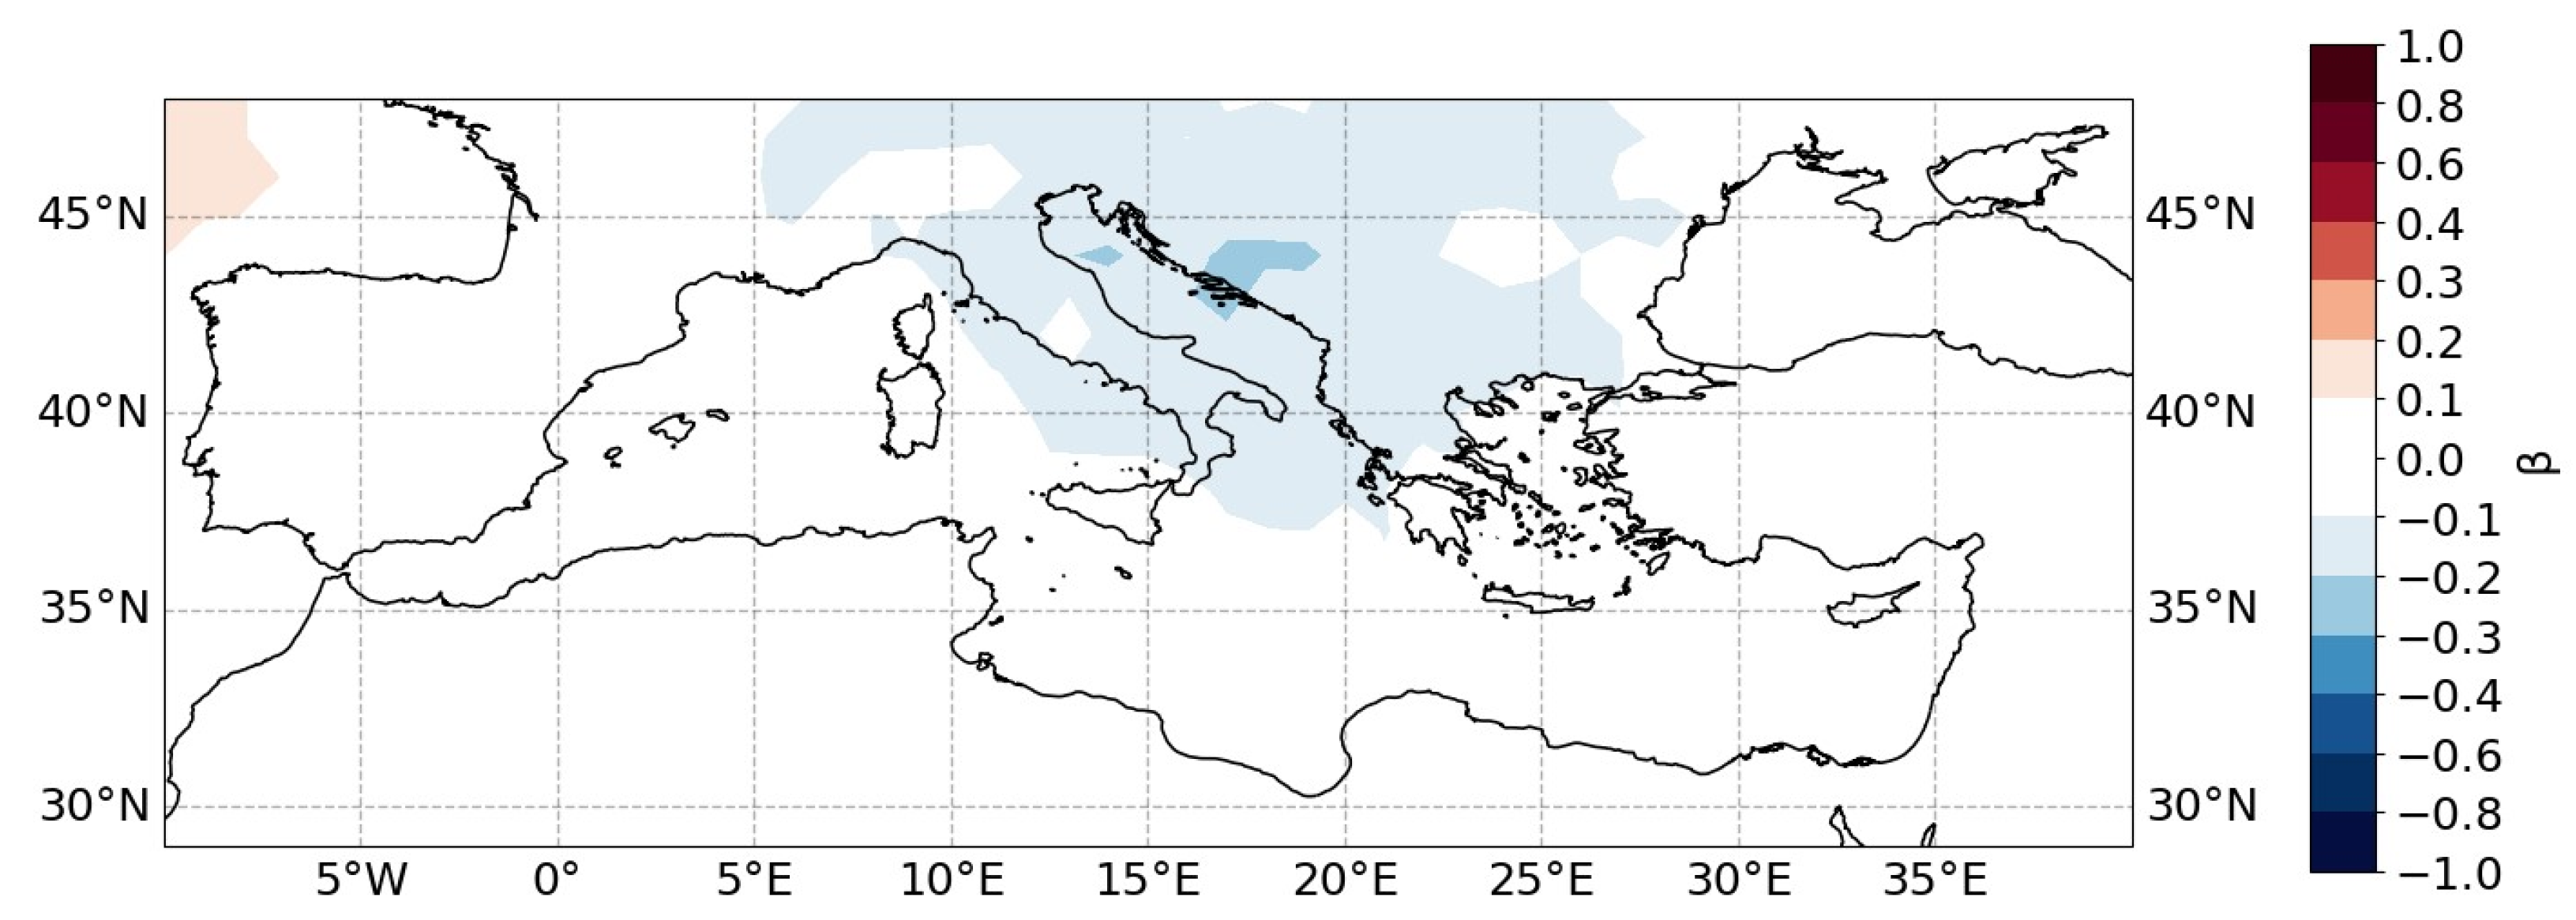
PCMCI is a causal discovery method based on the PC algorithm (named after Peter and Clark) combined with the Momentary Conditional Independence approach (MCI, [
3]). Given a set of univariate time series (called “actors”), PCMCI estimates their time series graph representing the conditional independencies among the time-lagged actors. The actors are selected by the user guided by previous knowledge. Assuming linear dependencies, PCMCI uses partial correlations to iteratively test conditional independencies and remove spurious links arising from autocorrelation effects, indirect links, or common drivers. Thereby, PCMCI efficiently conducts partial correlation tests to identify which links cannot be explained by other time-lagged actors [
3].
The output of PCMCI is a
p-value for each time-lagged causal link. It should be noted that the term “causal” lies on specific assumptions [
5]. Adding or removing actors can alter the result, thus, having a robust hypothesis for the choice of the selected actors is important. The causal links detected via the PCMCI algorithm are then visualized in terms of a causal effect network (CEN). Each CEN is composed of circles representing the various actors, with their color indicating the strength of self-influence, and arrows indicating the direction of the detected causal links between the actors.
To explore the causal effects that a specific actor has on a 3D (lat, lon, time) climate variable field, the concept of causal maps was introduced [
9]. In causal map visualization, we can directly illustrate the effect of a specific actor on the variable field, considering the influence of autocorrelation, indirect links, and common driver effects due to other participating variables. Causal maps are analogous to correlation maps; however, a causal map shows the path coefficient
β from one actor to each grid point of the examined field, conditioning out all remaining actors. For example, for a set of two actors (X1 and X2) and one field Y, we can obtain two causal maps: one from X1 to Y, conditioned on X2 and all autocorrelation effects, and one from X2 to Y, conditioned on X1 and all autocorrelation effects, respectively.
The Northern Hemisphere teleconnection patterns that were selected as actors in the present analysis are represented by the EMP [
10], NAO [
11], and EA [
12] indices. The time-series of NAO and EA were derived from the NOAA Climate Prediction Center (
https://www.cpc.ncep.noaa.gov/data/teledoc/telecontents.shtml, accessed on 12 June 2023). For the investigation of their causal effects on the Mediterranean climate, we used the ERA5 air temperature and precipitation monthly fields for the period 1959–2021 [
13].
3. Results
The resulting CEN for the selected set of indices is plotted in
Figure 1 and shows that EA is causally connected to EMP, while EMP is causally connected to NAO, both with a lag of 1 month. Specifically, the red arrow from NAO to EMP indicates a positive link, meaning that an increase in the NAO index will lead to an increase in the EMP index one month later, while the blue arrow from EMP to EA indicates a negative link. The strength of this relationship is seen from the right color bar in
Figure 1. Thus, any correlation between NAO and EA is due to an indirect link via EMP (or to a common driver not included in this CEN).
The causal map of
Figure 2 shows the path coefficient
β for the NAO link on Mediterranean winter air temperature, conditioning out the other actors and autocorrelations. This link is negative over the northern central-eastern Mediterranean. This indicates that an increase in the NAO index will lead to a decrease in winter temperature one month later.
The respective analysis for Mediterranean winter precipitation does not result in statistically significant results.
4. Conclusions
In this preliminary study, we apply causal discovery algorithms to analyze the causal links among teleconnection patterns of the North Hemisphere and their influence on Mediterranean climate winter variability.
We find that there are causal links between NAO and EMP and between EMP and EA, with different signs and with a lag of 1 month. NAO is related to the winter air temperature of the northern parts of the central and eastern Mediterranean and specifically, it is found that an increase in the NAO index leads to a decrease in air temperature with 1 month of lag.
The present analysis will be extended employing different sets of actors and higher temporal resolution datasets in order to examine the consistency of the causal effect networks across different timescales and to uncover the underlying mechanism of their links.
Author Contributions
Conceptualization, M.H., G.D.C., R.V.D. and H.A.F.; methodology, G.D.C. and R.V.D.; software, M.H., G.D.C. and J.C.; validation, M.H. and G.D.C.; formal analysis, M.H., G.D.C. and H.A.F.; investigation, M.H., G.D.C. and H.A.F.; data curation, M.H., J.C. and P.P.; writing—original draft preparation, M.H.; writing—review and editing, M.H. and H.A.F.; visualization, M.H., J.C. and P.P.; supervision, R.V.D. and H.A.F. All authors have read and agreed to the published version of the manuscript.
Funding
This research received no external funding.
Institutional Review Board Statement
Not Applicable.
Informed Consent Statement
Not Applicable.
Data Availability Statement
No new data were created.
Acknowledgments
This work has been performed within the context of the IKYDA 2022–2024. Programme for Project-Related Personal Exchange (PPP) between Germany and Greece “Causal drivers of Eastern Mediterranean climate variability and extremes (CauseMED)”. G.D.C. and R.V.D. acknowledge financial support by the German Federal Ministry for Education and Research (BMBF) via the JPI Climate/JPI Oceans project ROADMAP (grant no. 01LP2002B).
Conflicts of Interest
The authors declare no conflict of interest.
References
- Hatzaki, M.; Flocas, H.A.; Giannakopoulos, C.; Maheras, P. The Impact of the Eastern Mediterranean Teleconnection Pattern on the Mediterranean Climate. J. Clim. 2009, 22, 977–992. [Google Scholar] [CrossRef]
- Lemus-Canovas, M. Changes in compound monthly precipitation and temperature extremes and their relationship with teleconnection patterns in the Mediterranean. J. Hydrol. 2022, 608, 127580. [Google Scholar] [CrossRef]
- Runge, J.; Nowack, P.; Kretschmer, M.; Flaxman, S.; Sejdinovic, D. Detecting and quantifying causal associations in large nonlinear time series datasets. Sci. Adv. 2019, 5, eaau4996. [Google Scholar] [CrossRef] [PubMed]
- Runge, J.; Donner, R.V.; Kurths, J. Optimal model-free prediction from multivariate time series. Phys. Rev. E 2015, 91, 052909. [Google Scholar] [CrossRef] [PubMed]
- Runge, J. Causal network reconstruction from time series: From theoretical assumptions to practical estimation. Chaos Interdiscip. J. Nonlinear Sci. 2018, 28, 075310. [Google Scholar] [CrossRef] [PubMed]
- McGraw, M.C.; Barnes, E.A. Memory Matters: A Case for Granger Causality in Climate Variability Studies. J. Clim. 2018, 31, 3289–3300. [Google Scholar] [CrossRef]
- Kretschmer, M.; Coumou, D.; Donges, J.F.; Runge, J. Using Causal Effect Networks to Analyze Different Arctic Drivers of Midlatitude Winter Circulation. J. Clim. 2016, 29, 4069–4081. [Google Scholar] [CrossRef]
- Di Capua, G.; Kretschmer, M.; Donner, R.V.; van den Hurk, B.; Vellore, R.; Krishnan, R.; Coumou, D. Tropical and mid-latitude teleconnections interacting with the Indian summer monsoon rainfall: A theory-guided causal effect network approach. Earth Syst. Dynam. 2020, 11, 17–34. [Google Scholar] [CrossRef]
- Di Capua, G.; Runge, J.; Donner, R.V.; van den Hurk, B.; Turner, A.G.; Vellore, R.; Krishnan, R.; Coumou, D. Dominant patterns of interaction between the tropics and mid-latitudes in boreal summer: Causal relationships and the role of timescales. Weather Clim. Dynam. 2020, 1, 519–539. [Google Scholar] [CrossRef]
- Hatzaki, M.; Flocas, H.A.; Asimakopoulos, D.N.; Maheras, P. The eastern Mediterranean teleconnection pattern: Identification and definition. Int. J. Climatol. 2007, 27, 727–737. [Google Scholar] [CrossRef]
- Hurrell, J.W.; Kushnir, Y.; Ottersen, G.; Visbeck, M. An Overview of the North Atlantic Oscillation. In The North Atlantic Oscillation: Climatic Significance and Environmental Impact; Wiley: Hoboken, NJ, USA, 2003; pp. 1–35. [Google Scholar] [CrossRef]
- Barnston, A.G.; Livezey, R.E. Classification, Seasonality and Persistence of Low-Frequency Atmospheric Circulation Patterns. Mon. Weather Rev. 1987, 115, 1083–1126. [Google Scholar] [CrossRef]
- Hersbach, H.; Bell, B.; Berrisford, P.; Hirahara, S.; Horányi, A.; Muñoz-Sabater, J.; Nicolas, J.; Peubey, C.; Radu, R.; Schepers, D.; et al. The ERA5 global reanalysis. Q. J. R. Meteorol. Soc. 2020, 146, 1999–2049. [Google Scholar] [CrossRef]
| Disclaimer/Publisher’s Note: The statements, opinions and data contained in all publications are solely those of the individual author(s) and contributor(s) and not of MDPI and/or the editor(s). MDPI and/or the editor(s) disclaim responsibility for any injury to people or property resulting from any ideas, methods, instructions or products referred to in the content. |
© 2023 by the authors. Licensee MDPI, Basel, Switzerland. This article is an open access article distributed under the terms and conditions of the Creative Commons Attribution (CC BY) license (https://creativecommons.org/licenses/by/4.0/).