1. Introduction
Climate change is one of the most pressing challenges our society is facing today and for generations to come. The use of fossil fuels is the primary anthropogenic source contributing to the carbon cycle, along with the development of the agricultural industry, coal mining, waste management, and other human activities that lead to increased concentrations of greenhouse gases [
1,
2]. The resulting rise in greenhouse gases, particularly carbon dioxide (CO
2), is driving climate change, including the greenhouse effect and global warming.
CO
2 is a well-mixed gas that has a longer lifetime and contributes approximately 65% of the radiative forcing responsible for climate change. Despite global efforts to reduce emissions, its concentrations are increasing at the fastest observed decadal rate of change (2.0 ± 0.1 ppm/yr.) for the period of 2002–2011 [
3]. Carbon monoxide (CO) is primarily sourced from the oxidation of methane, biomass burning, and fossil fuel combustion. The primary sink of CO in the atmosphere is through oxidation with hydroxyl radicals (OH) [
4]. Therefore, it is essential to measure greenhouse gas concentrations and study their spatial and temporal variations accurately and precisely. This information is crucial for estimating global emission levels and improving our understanding of their sources and sinks, ultimately informing policy decisions aimed at mitigating global warming.
Various methods can be employed for the measurement of greenhouse gases, including in situ measurements that offer insights into local sources and satellite remote sensing. In this study, we utilize Fourier Transform Infrared Spectroscopy (FTIR) to determine the total column abundance of greenhouse gases across all atmospheric layers. On a global scale, in situ measurements are carried out using FTIR spectrometers that use direct solar radiation as a light source. The Total Carbon Column Observation Network (TCCON) [
5], established in 2004, is designed to obtain accurate and precise column abundances of greenhouse gases, such as CO
2, CH
4, and CO, from near-infrared solar absorption spectra. TCCON stations operate high-resolution Fourier Transform IFS125HR spectrometers (FTS) manufactured by Bruker [
5]. In 2016, the COCCON network emerged as a viable alternative, based on the low-resolution (0.5 cm
−1) EM27/SUN FTIR spectrometer developed by KIT in collaboration with Bruker [
6].
2. Methodology
The initial data were divided into hourly, daily, and monthly averages for analysis. The primary objective was to determine the co-variability of XCO
2 and XCO gases and to identify their common sources. These gases displayed irregular seasonal fluctuations, so hourly mean concentrations per year were calculated and subtracted from the original data to remove seasonal variations. This filtering process enabled the extraction of short-term variations caused by local effects for each gas, referred to as ΔX terms or residuals. The resulting data present short-term fluctuations that can be examined to better understand each gas’s behavior.
After identifying the X gases for each season, we conducted a comparison of residuals to investigate their seasonal and daily relationships.
3. Results
In this section, the described methodology is applied using FTIR spectrometer observations with the aim of extracting the residual values of XCO2 and XCO, in order to establish a connection between their common sources and sinks. The residual values correspond to the differences between the observed concentrations and the concentrations that would be expected based on known sources and sinks. By identifying and analyzing these residual values, we can gain insights into the underlying processes that contribute to changes in atmospheric XCO2 and XCO. Τhis analysis may have important implications for understanding the dynamics of the Earth’s carbon cycle and for predicting future changes in atmospheric composition.
Carbon Monoxide and Carbon Dioxide Co-Variability
Table 1 presents the average annual values for the four-year time series. The annual increase in carbon dioxide is evident mainly due to anthropogenic emissions, in contrast to XCO, which shows a comparatively more stable trend with occasional increases caused by pollution events such as fires.
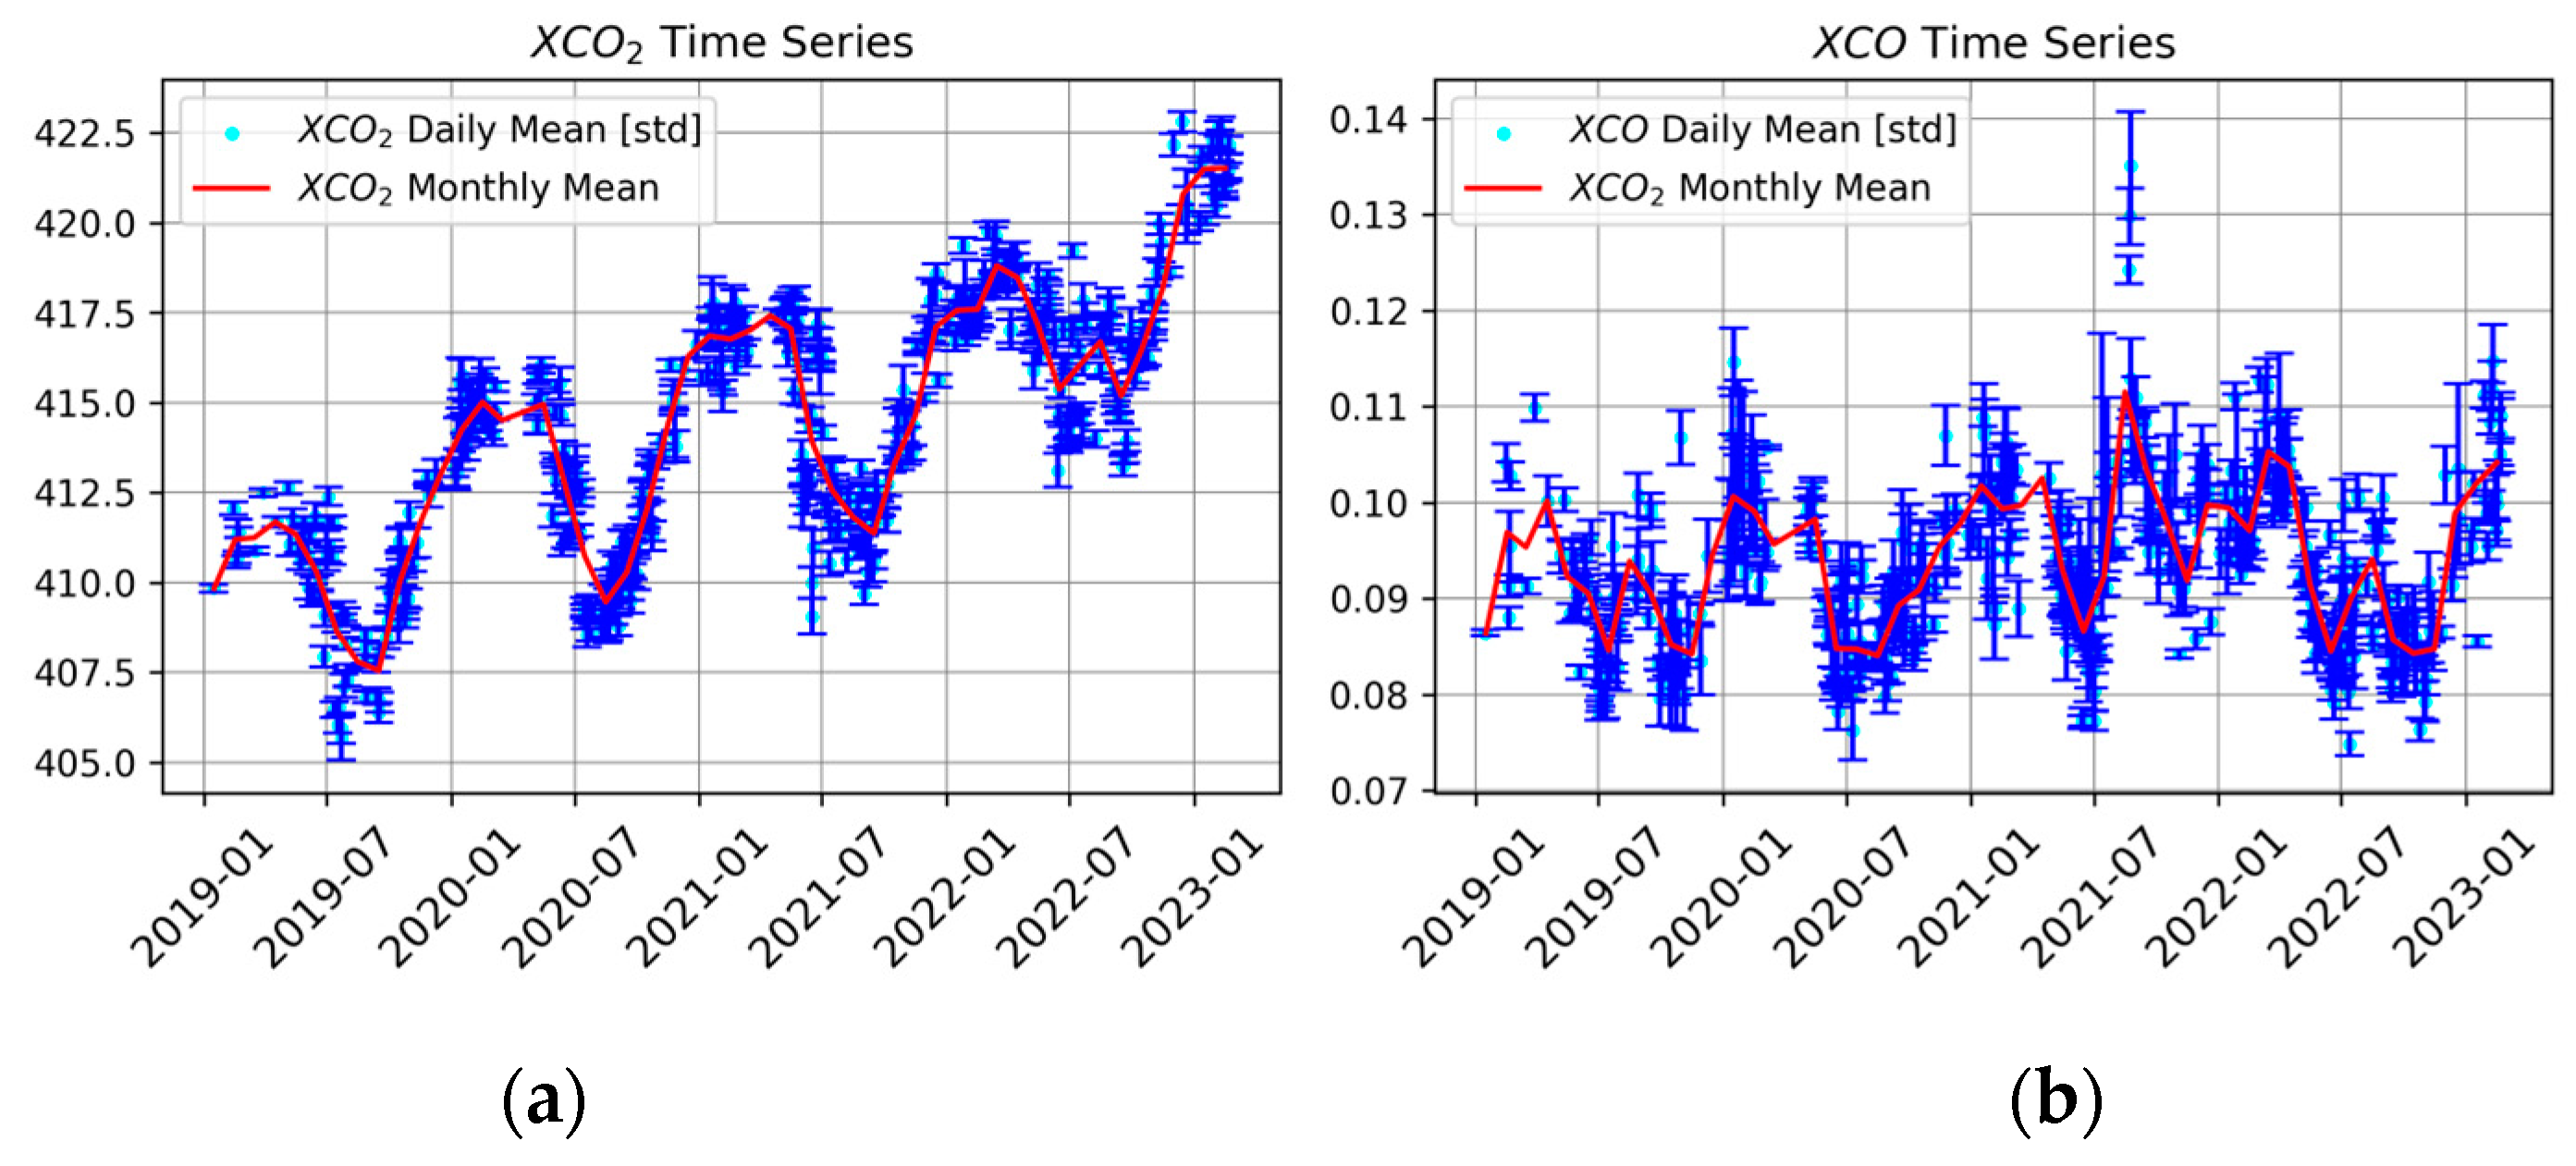
Figure 1a presents the daily and monthly average time series of XCO
2 for the four years. The data reveal a clear seasonal cycle in the XCO
2 concentrations, which is primarily caused by the natural photosynthesis cycle. During the Northern Hemisphere spring and summer, plants absorb CO
2 from the atmosphere for photosynthesis, leading to a decrease in atmospheric CO
2 concentrations. Conversely, during fall and winter, plants shed their leaves and release CO
2 back into the atmosphere, causing an increase in atmospheric CO
2 concentrations.
In addition to the natural seasonal cycle,
Table 1 shows that there has been an overall increase in atmospheric CO
2 concentrations over the four-year period. This increase is mainly attributed to human activities, particularly the burning of fossil fuels and deforestation. These activities release large amounts of CO
2 into the atmosphere, which accumulate over time and contribute to global warming and climate change.
The time series data for carbon monoxide (CO) presented in
Table 1 and
Figure 1b show a relatively stable picture over time, with CO concentrations remaining relatively consistent throughout the four-year period. The concentration of carbon monoxide often displays several gaps, particularly in the summer months, as a result of pollution episodes. These episodes are primarily caused by fires, such as the ones that occurred in July 2021.
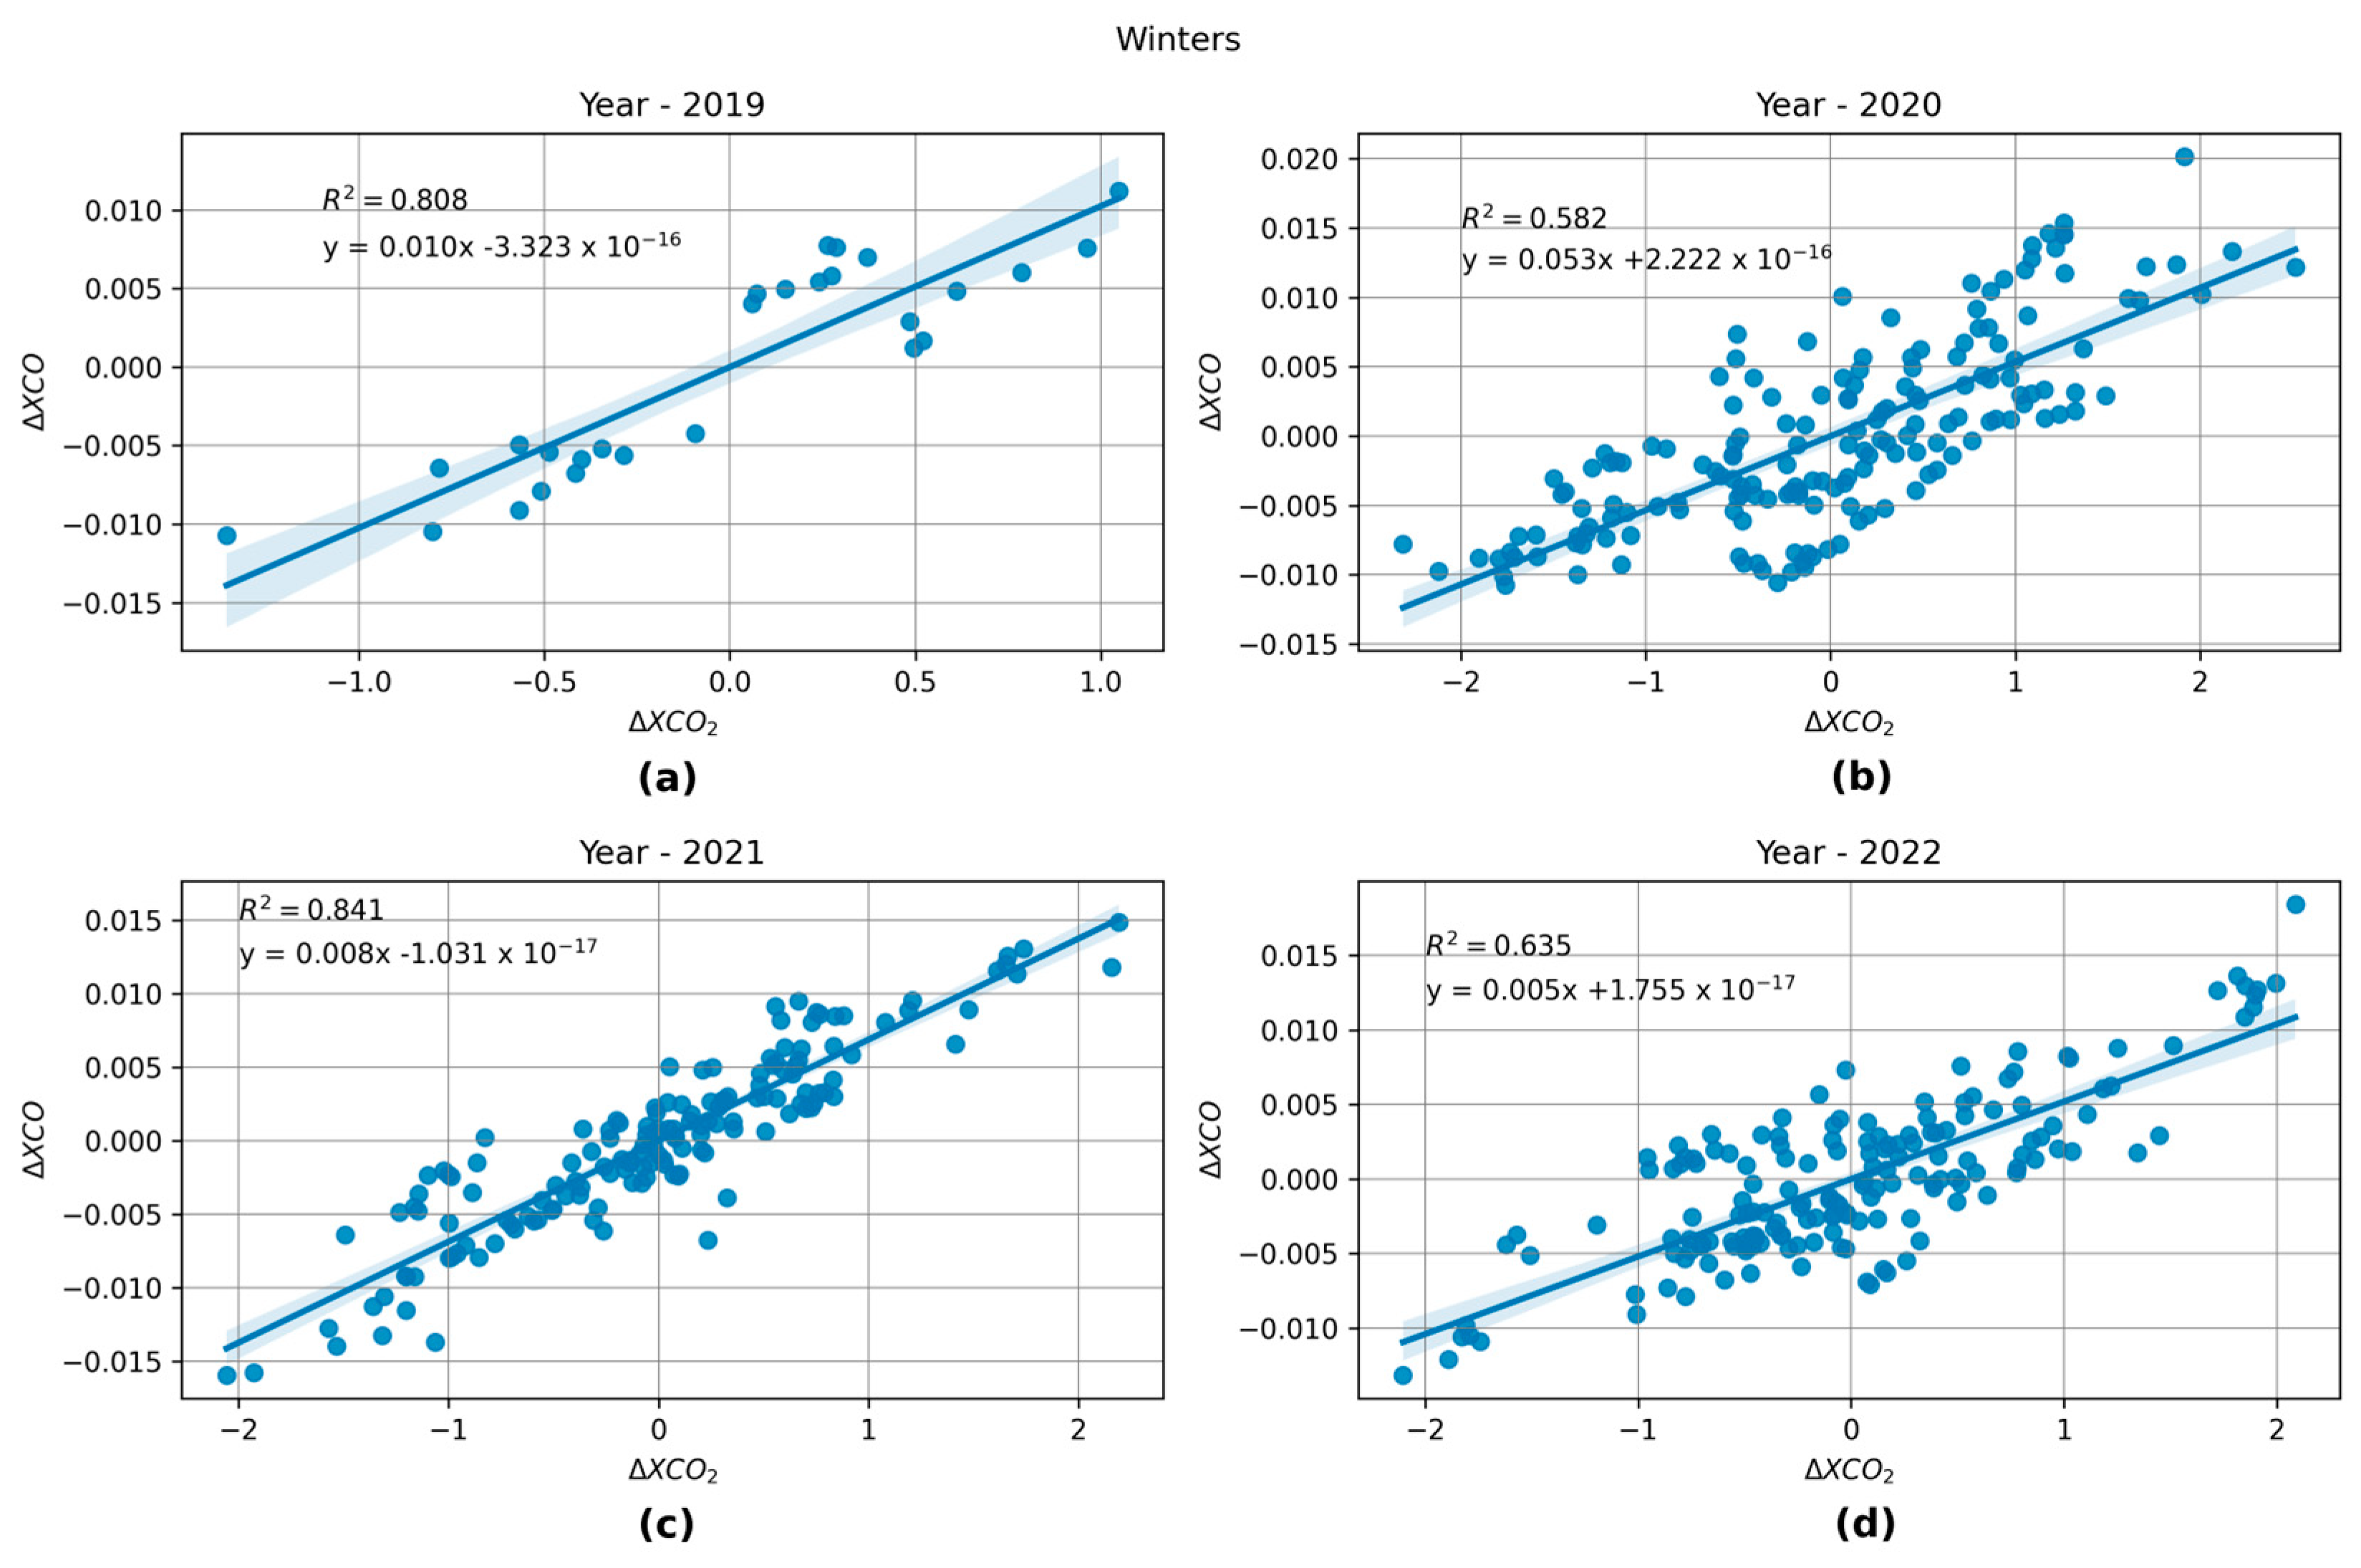
The correlation between ΔXCO
2 and ΔXCO values in
Figure 2 suggests that changes in fossil fuel combustion can affect the levels of both gases. It is important to note that other factors, such as natural emissions and atmospheric processes, can also contribute to variations in ΔXCO
2 and ΔXCO values. However, the strong correlation, especially in the winter months, between these two gases indicates that they have common sources.
4. Conclusions
In this study, the total columns of carbon dioxide and carbon monoxide in Thessaloniki, Greece were measured for four full years (2019–2022), using a portable direct solar viewing FTIR spectrometer. Additionally, the seasonal behavior of greenhouse gas residuals (ΔX) was examined to capture short-term variations of X-gases and identify local sources, as well as common sources between them.
The time series for XCO2 demonstrates the emergence of the seasonal cycle, with maxima occurring in winter and spring due to anthropogenic influence and a summer minimum resulting from the biosphere cycle, which is a local phenomenon for mid-latitude regions of the Northern Hemisphere. The time series for exhibits a greater variability in its daily values due to local sources, with a maximum occurring in winter and a minimum in summer , reflecting the common sources shared with carbon dioxide. However, the concentration of carbon monoxide can sometimes reach high levels during the summer months due to fires occurring in those periods, as was the case in July 2021 when the concentration was measured at 0.141 ± 0.013 ppm.
The study of the co-variability of ΔXCO and ΔXCO2 residuals throughout the seasonal cycle showed good agreement for the winter months ( and a significant correlation coefficient in spring. These findings suggest that there are strong influences of fossil fuel as a common emission source for the two gases during these seasons. However, in the summer and autumn months, the two gases are not correlated due to the higher seasonality of XCO2 compared to XCO, indicating that the emission sources for these two gases differ during these seasons. Therefore, it is crucial to consider the seasonal variability of the sources when studying atmospheric chemistry and air pollution.
Author Contributions
Conceptualization, D.B.; Investigation, T.P.; Methodology, T.P., M.M., C.T. and D.B.; Software, T.P., M.M., C.T., F.H. and D.D.; Formal analysis, T.P., M.M. and C.T.; Data curation, T.P. and M.M.; Supervision, D.B. and F.H.; Writing—original draft preparation, T.P. and M.M.; Writing—review and editing, M.M., C.T., D.B. and F.H. All authors have read and agreed to the published version of the manuscript.
Funding
This research was co-financed by the Karlsruhe Institute of Technology (KIT—“The Research University in the Helmholtz Association”) and by the European Union (European Regional Development Fund).
Data Availability Statement
The EM27/SUN FTIR spectrometer data over Thessaloniki, Greece are available upon request.
Acknowledgments
This research was supported by the European Space Agency (COCCON-PROCEEDS, grant no. 4000121212/17/I-EF and QA4EOQA4EO and grant no. 4000128426/19/NL/FF/ab).
Conflicts of Interest
The authors declare no conflict of interest.
References
- Duxbury, J.M. The Significance of Agricultural Sources of Greenhouse Gases. Fertil. Res. 1994, 38, 151–163. [Google Scholar] [CrossRef]
- Barnosky, A.D.; Matzke, N.; Tomiya, S.; Wogan, G.O.U.; Swartz, B.; Quental, T.B.; Marshall, C.; McGuire, J.L.; Lindsey, E.L.; Maguire, K.C.; et al. Has the Earth’s Sixth Mass Extinction Already Arrived? Nature 2011, 471, 51–57. [Google Scholar] [CrossRef] [PubMed]
- AR5 Climate Change 2014: Mitigation of Climate Change—IPCC. Available online: https://www.ipcc.ch/report/ar5/wg3/ (accessed on 8 May 2023).
- Röckmann, T.; Brenninkmeijer, C.A.M.; Saueressig, G.; Bergamaschi, P.; Crowley, J.N.; Fischer, H.; Crutzen, P.J. Mass-Independent Oxygen Isotope Fractionation in Atmospheric CO as a Result of the Reaction CO + OH. Science 1998, 281, 544–546. [Google Scholar] [CrossRef] [PubMed]
- Wunch, D.; Toon, G.C.; Blavier, J.F.L.; Washenfelder, R.A.; Notholt, J.; Connor, B.J.; Griffith, D.W.T.; Sherlock, V.; Wennberg, P.O. The Total Carbon Column Observing Network. Philos. Trans. R. Soc. A Math. Phys. Eng. Sci. 2011, 369, 2087–2112. [Google Scholar] [CrossRef] [PubMed]
- Gisi, M.; Hase, F.; Dohe, S.; Blumenstock, T.; Simon, A.; Keens, A. XCO2-Measurements with a Tabletop FTS Using Solar Absorption Spectroscopy. Atmos. Meas. Tech. 2012, 5, 2969–2980. [Google Scholar] [CrossRef]
| Disclaimer/Publisher’s Note: The statements, opinions and data contained in all publications are solely those of the individual author(s) and contributor(s) and not of MDPI and/or the editor(s). MDPI and/or the editor(s) disclaim responsibility for any injury to people or property resulting from any ideas, methods, instructions or products referred to in the content. |
© 2023 by the authors. Licensee MDPI, Basel, Switzerland. This article is an open access article distributed under the terms and conditions of the Creative Commons Attribution (CC BY) license (https://creativecommons.org/licenses/by/4.0/).


 ,
, 
