Proceeding Paper

Modelling the Urban Thermal Environment through the Combined Use of WRF and the Local Climate Zones Approach: Case Study for Nicosia †

by
Konstantina Koutroumanou-Kontosi
1,2,*,
Constantinos Cartalis
2,
Panos Hadjinicolaou
1,
Katiana Constantinidou
1 and
Ilias Agathangelidis
2
1
Climate and Atmosphere Research Center (CARE-C), The Cyprus Institute, Nicosia 2121, Cyprus
2
Department of Physics, National and Kapodistrian University of Athens, 15784 Athens, Greece
*
Author to whom correspondence should be addressed.
Presented at the 16th International Conference on Meteorology, Climatology and Atmospheric Physics—COMECAP 2023, Athens, Greece, 25–29 September 2023.
Environ. Sci. Proc. 2023, 26(1), 53; https://doi.org/10.3390/environsciproc2023026053
Published: 25 August 2023

Abstract

:
The Eastern Mediterranean and Middle East (EMME) region is an exceptionally thermally vulnerable area, projected to suffer from frequent and severe heatwaves in the coming decades. To assess the impacts of climate change on the urban thermal environment in cities, high-resolution numerical simulations are crucial. In this study, the Weather Research and Forecasting (WRF) model is tested in order to progressively downscale the regional scale (12 km) to the local scale (1 km) and thus derive high-resolution data for the 2 m air temperature over Nicosia. Two different simulations were conducted, driven by the ERA5 re-analysis, over a two-month summer period, namely from 15 June to 15 August, 2021, to compare two different urban canopy schemes. The first simulation concerns the implementation of the bulk scheme using the default land cover of MODIS. In the second, the WRF model was coupled with the Single Layer Urban Canopy Model for a better representation of the urban characteristics of Nicosia, and detailed information on the urban form was inserted into the model via the creation of the Local Climate Zones classification scheme. A comparison between the two different physical schemes as well as an evaluation of the simulation results with observation data are performed.

1. Introduction

The Eastern Mediterranean and Middle East (EMME) region constitutes a major climate change “hot spot”. It warms faster compared to the global mean [1,2,3,4]. This trend of warming is expected to be further intensified in the future, depending on greenhouse gas emissions and socioeconomic and technological development [5,6]. Consequently, cities located in the EMME region are particularly vulnerable to this excessive heat. One major impact of the increased temperature in cities is the intensification of the Urban Heat Island (UHI) phenomenon, which refers to the temperature difference between urban and rural areas. The replacement of natural land cover with pavement and other building materials leads to changes in the radiative and energetic processes that take place and result in the UHI phenomenon [7].
Process-based numerical simulations of the urban climate can provide a cost-effective assessment of urban overheating with greater spatial and temporal resolution than in-situ observations [8]. Importantly, numerical models allow for the evaluation of potential heat hazards and an assessment of the efficacy of heat adaptation strategies [9]. In recent years, numerous urban modelling tools—at different resolutions, scale, levels of sophistication, and suitability—have attempted to quantify the interactions between climate change and urbanization, and in particular how the urban thermal environment is shaped under their combined effect. Urban numerical models can be classified into four main categories [10]: (i) “bulk” one-dimensional urban models where urban areas are represented as horizontal surfaces interacting with the overlying air, i.e., the Bulk scheme; (ii) “single-layer” urban canopy models which are based on a two-dimensional street canyon configuration, i.e., the Single Layer Urban Canopy Model (SLUCM) scheme; (iii) “multilayer” urban canopy models that employ several layers within the urban canopy, i.e., the Building Environment Parameterization (BEP) scheme [11]; and (iv) Computational Fluid Dynamics (CFD) models that explicitly consider three-dimensional buildings and enable sophisticated microclimate numerical simulations of the flow inside urban canyons, i.e., the ENVI-met model [12].
Every city exhibits significant spatial variability in its morphological features, making it essential to incorporate this information in the simulations. The Local Climate Zone (LCZ) scheme introduced by [13] consists of 17 different classes depending on the properties of the built structure (1–10) and the natural surface cover (A-G). The World Urban Database Access Portal Tool (WUDAPT) [14] is an initiative to produce LCZ classification maps for various cities around the globe with a consistent methodology. Various studies have found that inserting LCZ information into the WRF model leads to high urban simulation accuracy [15,16,17]. Thus, in this study, the WRF model was used to simulate the urban thermal environment of Nicosia based on the two different urban schemes of Bulk and SLUCM. Furthermore, the LCZ classification map was included in the SLUCM to further investigate the performance of the model in urban areas.

2. Data and Methodology

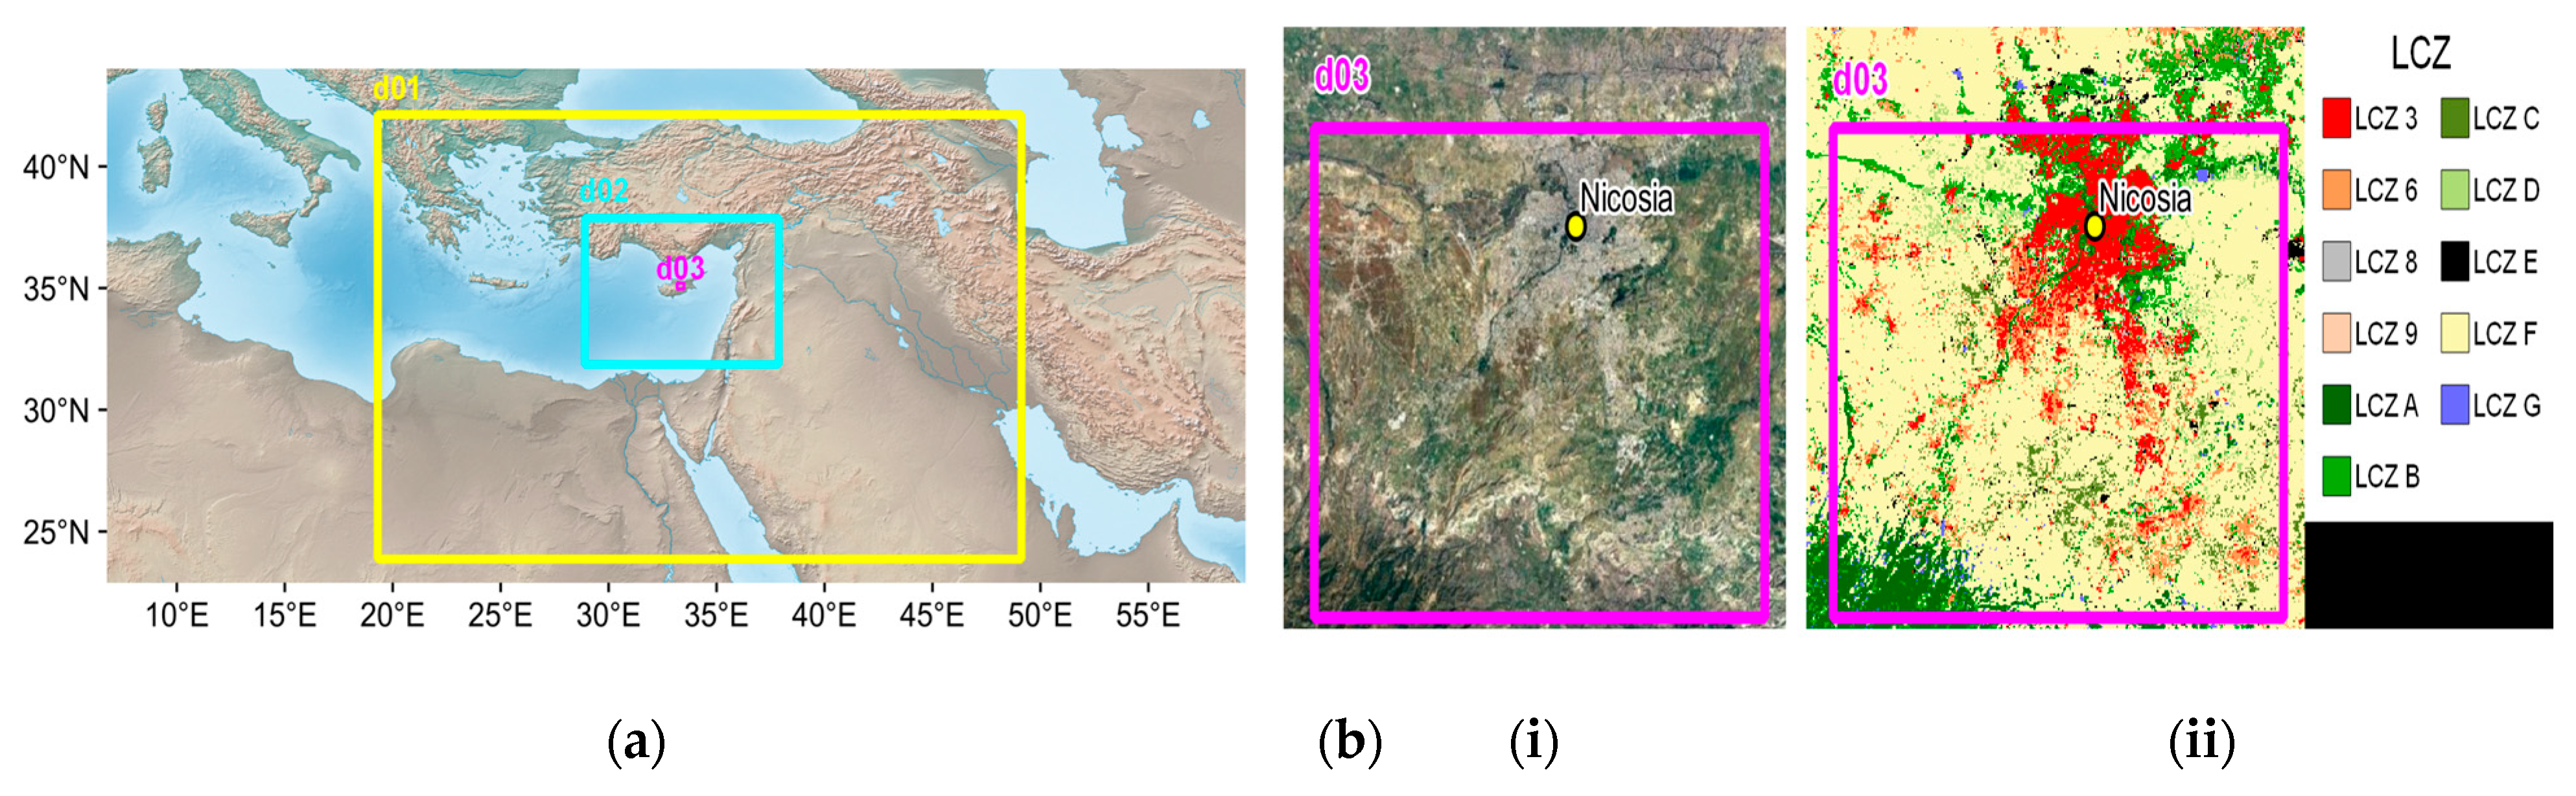
2.1. Model and Study Area

This study focuses on Nicosia in Cyprus, located in the EMME region. The Weather Research and Forecasting (WRF) model, which is a state-of-the-art mesoscale system, was used to perform numerical simulations and dynamically downscale the near-surface air temperature (2 m air temperature) from the regional (12 km) to the local scale (1 km). All WRF simulations were performed with version 4.3.1 centered on the city of Nicosia and using the regular latitude–longitude projection with reference latitude 42.24° N and reference longitude 19.36° E so as to produce the spatial and temporal distribution of air temperature. The parent domain covered part of the EMME region (d01, 19.36° E–49.06° E, 23.87° N–42.13° N) with a spatial resolution of 12 km, while the two two-way nested domains focused on Cyprus (d02, 28.89° E–37.88° E, 31.86° N–37.88° N) and Nicosia specifically (d03, 33.17° E–33.49° E, 34.97° N–35.21° N) with a spatial resolution of 4 km and 1 km respectively. Convection-permitting simulations were performed concerning the d03 domain due to its high spatial resolution (1 km). The domain decomposition is shown in Figure 1a. The simulation period included two summer months starting on 15 June 2021 and running to 15 August 2021 with the first 16 days (15–30 June 2021) considered a spin-up period and, thus, excluded from the data processing.

2.2. WRF Configuration

The ERA5 reanalysis data with 0.25° × 0.25° spatial resolution and 6h time intervals were obtained from the Copernicus Climate Data Store (https://cds.climate.copernicus.eu/cdsapp#!/search?type=dataset&text=era5, accessed on 3 February 2023) and were used to force the simulations with initial and lateral boundary conditions. The 2 m air temperature data were provided by the Department of Meteorology of Cyprus for an urban station located at the city center of Nicosia (lon = 33.36°, lat = 35.16°). The location of the meteorological station in the d03 domain is illustrated in Figure 1b(i).
Two different simulations were performed with both the Noah-MP as a Land–Surface Model (LSM), which was found to be closer to the observations for the Middle East and North Africa (MENA) region according to [18]. The first one uses the Bulk urban scheme and the default Land Use/Land Cover (LU/LC) of the Moderate Resolution Imaging Spectroradiometer (MODIS) with 30s resolution. In the second one, to improve the representation of Nicosia’s urban characteristics, the WRF model was coupled with the SLUCM using a LCZ classification map for the LU/LC data. Among the different approaches to deriving a LCZ classification map, the WUDAPT level 0 methodology was used in this study, to produce the scheme introduced by [13]. The LCZ map was developed and created for the city of Nicosia and had a 100 m spatial resolution, illustrated in Figure 1b(ii). The map can be freely accessed at https://lcz-generator.rub.de/factsheets/8203d449c11ea097b3943aa2cff7cd82a55e2b05/8203d449c11ea097b3943aa2cff7cd82a55e2b05_factsheet.html (accessed on 3 July 2022). Next, it was aggregated to 1km resolution so that it could be inserted into the WRF model. Table 1 shows the main parameterizations used for both simulations and for all domains.
The output results of the WRF model for both simulations had an hourly temporal resolution and were evaluated against station-based observations as detailed below. The evaluation focused on three variables, namely the mean (Tmean), maximum (Tmax), and minimum (Tmin) daily temperature. The differences between the simulated and observed temperatures for both urban schemes and for all studied variables for each day of the simulated period as well as the statistical metrics of Mean Absolute Error (MAE), Root Mean Square Error (RMSE), and mean bias error (Bias) were calculated. Furthermore, the simulated values of the two urban schemes were compared to each other in order to investigate their performance in the urban areas.

3. Results

3.1. Temporal Average of Differences

The WRF output of Tmean, Tmax, and Tmin was derived for each day, grid cell, and urban parameterization scheme. The temporal average of differences between the 2 schemes for the studied period over the smallest domain was derived separately for each variable by subtracting the value of the Bulk from the corresponding one of the SLUCM ( Δ Τ = T ( S L U C M ) T B u l k ) . The obtained results for the temporal average of differences in Tmean (left), Tmax (center) and Tmin (right) are illustrated in Figure 2 below.
Analyzing the maps of Figure 2 and taking into account the LU/LC data distribution from the LCZ classification map it is obvious that in the non-urban grid cells, the differences between the two urban parameterizations are almost zero. In the urban areas, the differences are generally negative which means that the SLUCM underestimates the values of temperature compared to Bulk. Regarding the map of ΔTmean, all urban areas exhibit negative values of approximately −0.5 °C. Negative values of around −0.4 °C in ΔTmax are only observed in urban areas of lower latitudes corresponding to LCZ 6 (open low-rise), whereas larger differences of about −1.2 °C in ΔTmin are found in urban areas of higher latitudes corresponding to LCZ 3 (compact low-rise). Therefore, it can be inferred that the negative values observed in the Tmean map are a combination of the spatial patterns observed in ΔTmax and ΔTmin.

3.2. Spatial Average of Differences

The nearest grid cell to the meteorological station was located using the coordinates of the station and the grid cells, and its values were compared with the observations. The grid cell representative of Nicosia station belonged to the urban LCZ 3 (compact low-rise). Figure 3 presents the daily average time series of the difference between simulated and observed values for the Nicosia station, and the difference between the two schemes spatially averaged for the Nicosia domain d03.
The difference between the two model schemes is negative for all variables and more pronounced for the Tmin. This indicates that the SLUCM simulation provides consistently lower temperature values compared to the Bulk. The time series of the ΔΤmean, ΔΤmax, and ΔΤmin model biases from observation, for both schemes, exhibit the same pattern during the period of study where maxima and minima are reported for the same days (e.g., 8 August 2021). The statistical metrics of MAE, RMSE, and Bias for the studied period between the Bulk and SLUCM simulated air temperature values and the observed ones for both stations were calculated and are presented in Table 2 below.
The results of Table 2 reveal that in general, the values of the different metrics between the two schemes are very close, with the only exception in the Bias, which is −0.61 °C for the SLUCM and almost zero (−0.06 °C) for the Bulk. This indicates that the WRF model does not exhibit a significant systematical bias error in either scheme, especially for the Bulk. Furthermore, the relatively low metric values indicate that both schemes have acceptably simulated the urban environment with good accuracy.

4. Conclusions

This study aimed to model the urban thermal environment of Nicosia by comparing the performance of two different urban parameterization schemes, namely the Bulk and the SLUCM, in simulating the urban environment over a two-month summer period. The WRF model was used to dynamically downscale the 2 m air temperature from the regional to the local scale, thus producing high-resolution data. Three variables were investigated: air Tmean, Tmax, and Tmin; and their simulated values were compared between the two urban schemes as well as to observations from a meteorological station located in the city center of Nicosia. The differences between the two schemes in the urban areas were small, with the greatest ones observed in the Tmin variable. The SLUCM produced cooler temperature values than the Bulk in urban areas. Both schemes simulated the urban thermal environment of Nicosia with no significant systematic bias errors, with those of Bulk being slightly lower.

Author Contributions

All authors designed the methodology. K.K.-K. implemented the methodology and performed the statistical analysis; all authors contributed to the analysis of data, interpretation of the results, and the writing of the paper. All authors have read and agreed to the published version of the manuscript.

Funding

The research is supported by the EMME-CARE project, funded by the European Union’s Horizon 2020 Research and Innovation Programme, under grant agreement no. 856612, and co-funded by the Government of the Republic of Cyprus.

Institutional Review Board Statement

Not applicable.

Informed Consent Statement

Not applicable.

Data Availability Statement

Data available on request.

Conflicts of Interest

The authors declare no conflict of interest.

References

  1. Giorgi, F. Climate change hot-spots. Geophys. Res. Lett. 2006, 33, 101029. [Google Scholar] [CrossRef]
  2. Lelieveld, J.; Hadjinicolaou, P.; Kostopoulou, E.; Chenoweth, J.; El Maayar, M.; Giannakopoulos, C.; Hannides, C.; Lange, M.A.; Tanarhte, M.; Tyrlis, E.; et al. Climate change and impacts in the Eastern Mediterranean and the Middle East. Clim. Chang. 2012, 114, 667–687. [Google Scholar] [CrossRef]
  3. Zittis, G.; Almazroui, M.; Alpert, P.; Ciais, P.; Cramer, W.; Dahdal, Y.; Fnais, M.; Francis, D.; Hadjinicolaou, P.; Howari, F.; et al. Climate Change and Weather Extremes in the Eastern Mediterranean and Middle East. Rev. Geophys. 2022, 60, e2021RG000762. [Google Scholar] [CrossRef]
  4. Zittis, G.; Hadjinicolaou, P. The effect of radiation parameterization schemes on surface temperature in regional climate simulations over the MENA-CORDEX domain. Int. J. Climatol. 2017, 37, 3847–3862. [Google Scholar] [CrossRef]
  5. Masson-Delmotte, V.; Zhai, P.; Pirani, A.; Connors, S.L.; Péan, C.; Berger, S.; Caud, N.; Chen, Y.; Goldfarb, L.; Gomis, M.I.; et al. Working Group I Contribution to the Sixth Assessment Report of the Intergovernmental Panel on Climate Change. 2021. Available online: www.ipcc.ch (accessed on 4 February 2023).
  6. Zittis, G.; Hadjinicolaou, P.; Klangidou, M.; Proestos, Y.; Lelieveld, J. A multi-model, multi-scenario, and multi-domain analysis of regional climate projections for the Mediterranean. Reg. Environ. Chang. 2019, 19, 2621–2635. [Google Scholar] [CrossRef]
  7. Masson, V.; Lemonsu, A.; Hidalgo, J.; Voogt, J. Urban Climates and Climate Change. Annu. Rev. Environ. Resour. 2020, 45, 411–444. [Google Scholar] [CrossRef]
  8. Nazarian, N.; Krayenhoff, E.S.; Bechtel, B.; Hondula, D.M.; Paolini, R.; Vanos, J.; Cheung, T.; Chow, W.T.L.; de Dear, R.; Jay, O.; et al. Integrated Assessment of Urban Overheating Impacts on Human Life. Earths Future 2022, 10, e2022EF002682. [Google Scholar] [CrossRef]
  9. Krayenhoff, E.S.; Broadbent, A.M.; Zhao, L.; Georgescu, M.; Middel, A.; Voogt, J.A.; Martilli, A.; Sailor, D.J.; Erell, E. Cooling Hot Cities: A Systematic and Critical Review of the Numerical Modelling Literature. Available online: https://iopscience.iop.org/article/10.1088/1748-9326/abdcf1/meta (accessed on 12 May 2023).
  10. Nazarian, N.; Lipson, M.; Norford, L.K. Multiscale modeling techniques to document urban climate change. Urban Clim. Change Heat Isl. 2023, 123–164. [Google Scholar] [CrossRef]
  11. Martilli, A.; Clappier, A.; Rotach, M.W. An urban surface exchange parameterisation for mesoscale models. Bound.-Layer Meteorol. 2002, 104, 261–304. [Google Scholar] [CrossRef]
  12. Bruse, M.; Fleer, H. Simulating surface-plant-air interactions inside urban environments with a three dimensional numerical model. Environ. Model. Softw. 1998, 13, 373–384. [Google Scholar] [CrossRef]
  13. Stewart, I.D.; Oke, T.R. Local Climate Zones for Urban Temperature Studies. Bull. Am. Meteorol. Soc. 2012, 93, 1879–1900. [Google Scholar] [CrossRef]
  14. Bechtel, B.; Alexander, P.J.; Beck, C.; Böhner, J.; Brousse, O.; Ching, J.; Demuzere, M.; Fonte, C.; Gál, T.; Hidalgo, J.; et al. Generating WUDAPT Level 0 data—Current status of production and evaluation. Urban Clim. 2019, 27, 24–45. [Google Scholar] [CrossRef]
  15. Wong, M.M.F.; Fung, J.C.H.; Ching, J.; Yeung, P.P.S.; Tse, J.W.P.; Ren, C.; Wang, R.; Cai, M. Evaluation of uWRF performance and modeling guidance based on WUDAPT and NUDAPT UCP datasets for Hong Kong. Urban Clim. 2019, 28, 100460. [Google Scholar] [CrossRef]
  16. Hammerberg, K.; Brousse, O.; Martilli, A.; Mahdavi, A. Implications of employing detailed urban canopy parameters for mesoscale climate modelling: A comparison between WUDAPT and GIS databases over Vienna, Austria. Int. J. Climatol. 2018, 38, e1241–e1257. [Google Scholar] [CrossRef]
  17. Molnár, G.; Gyöngyösi, A.Z.; Gál, T. Integration of an LCZ-based classification into WRF to assess the intra-urban temperature pattern under a heatwave period in Szeged, Hungary. Theor. Appl. Clim. 2019, 138, 1139–1158. [Google Scholar] [CrossRef]
  18. Constantinidou, K.; Hadjinicolaou, P.; Zittis, G.; Lelieveld, J. Performance of Land Surface Schemes in the WRF Model for Climate Simulations over the MENA-CORDEX Domain. Earth Syst. Environ. 2020, 4, 647–665. [Google Scholar] [CrossRef]
Figure 1. (a) Domain decomposition of the WRF simulations including the parent (EMME region, d01), the 1st nested (Cyprus, d02), and the 2nd nested (Nicosia, d03). (b) (i) Domain d03 and locations of the meteorological stations.; (ii) LCZ classification map for the city of Nicosia as derived with the WUDAPT level 0 methodology.
Environsciproc 26 00053 g001
Figure 2. Temporal average of differences in Tmean (left), Tmax (center), and Tmin (right) between the two urban schemes. The differences were derived by subtracting the value of the Bulk from the corresponding one of the SLUCM.
Environsciproc 26 00053 g002
Figure 3. Time series of Bulk minus observations (blue line), SLUCM minus observations (red line) for the Nicosia station and SLUCM minus Bulk (green line) for the Nicosia domain d03.
Environsciproc 26 00053 g003
Table 1. Main parameterizations used for both simulations.
ParameterizationSimulation 1Simulation 2
Land-Surface ModelNoah-MPNoah-MP
Urban SchemeBulkSLUCM
Land Use/Land CoverMODISLCZ
Table 2. Statistical metrics of MAE, RMSE, and Bias between the Bulk and SLUCM simulated air temperature values and the observed ones Nicosia station.
StationUrban Scheme/
Statistical Metric
MAE (°C)RMSE (°C)Bias (°C)
NicosiaBulk0.760.94−0.06
SLUCM0.801.07−0.61
Disclaimer/Publisher’s Note: The statements, opinions and data contained in all publications are solely those of the individual author(s) and contributor(s) and not of MDPI and/or the editor(s). MDPI and/or the editor(s) disclaim responsibility for any injury to people or property resulting from any ideas, methods, instructions or products referred to in the content.

