Abstract
Viticulture requires constant and meticulous care throughout the year to ensure a high-quality harvest. Precision agriculture has significantly advanced, enabling the early detection of potential threats or diseases without harming the crops. Understanding the distinct features of various grapevine varieties, such as chlorophyll content, canopy growth, stress, and interactions with specific soil elements, is crucial. To address these challenges, this study employs multispectral images captured by unmanned aerial vehicles (UAVs), providing a method for exploiting the spectral features of the vine canopies on a field with numerous vine varieties. The primary objective is to cluster different grapevine varieties in the same area based on common spectral characteristics.
1. Introduction
Vineyards are faced with various challenges throughout their lifecycle. Farmers need to monitor several common issues during the growth period of vineyards, including vineyard productivity [1], plant water stress [2] and nutrient concentrations, such as nitrogen (N), phosphorus (P), potassium (K), etc. [3]. Precision agriculture methods enable early detection of dangers or diseases without harming crops [4]. The production of vineyards holds significant economic, social, and environmental importance [5] which means that sustainable vineyard management is crucial. Vegetation monitoring methods that fall into the category of laboratory methods are costly, time-consuming, and involve plant damage. On the other hand, non-destructive methods, like proximal and remote sensing, offer plant health information without destruction, at lower cost and within a shorter time [6]. Remote sensing methods include satellites or unmanned aerial systems (UASs), while proximal sensing uses ground-based cameras. Satellite images cover large areas efficiently but have limits in spatial resolution compared to aerial images obtained via UAVs and offer both high spatial and spectral resolution, but are costly and require expertise to obtain [7]. Multispectral images provide valuable insights into plant health, as the visible spectrum indicates leaf pigments, while the NIR spectrum reveals internal leaf structure and detects elements or diseases. Moreover, spectral values are dependent on the plant variety, growth stage, and tissue content [8]. Besides the right image acquisition method choice, the optimal classification algorithm is crucial for data clustering of vineyard varieties or detecting elements and diseases. Clustering, machine learning, and vegetation indices enhance accuracy in assessing plant conditions by combining various methods and data types.
This work aims to detect and analyze several vineyard varieties through their spectral properties. To this end, some vegetation indices, which provide details about the health and the condition of vineyards, will be used.
2. Material and Methods
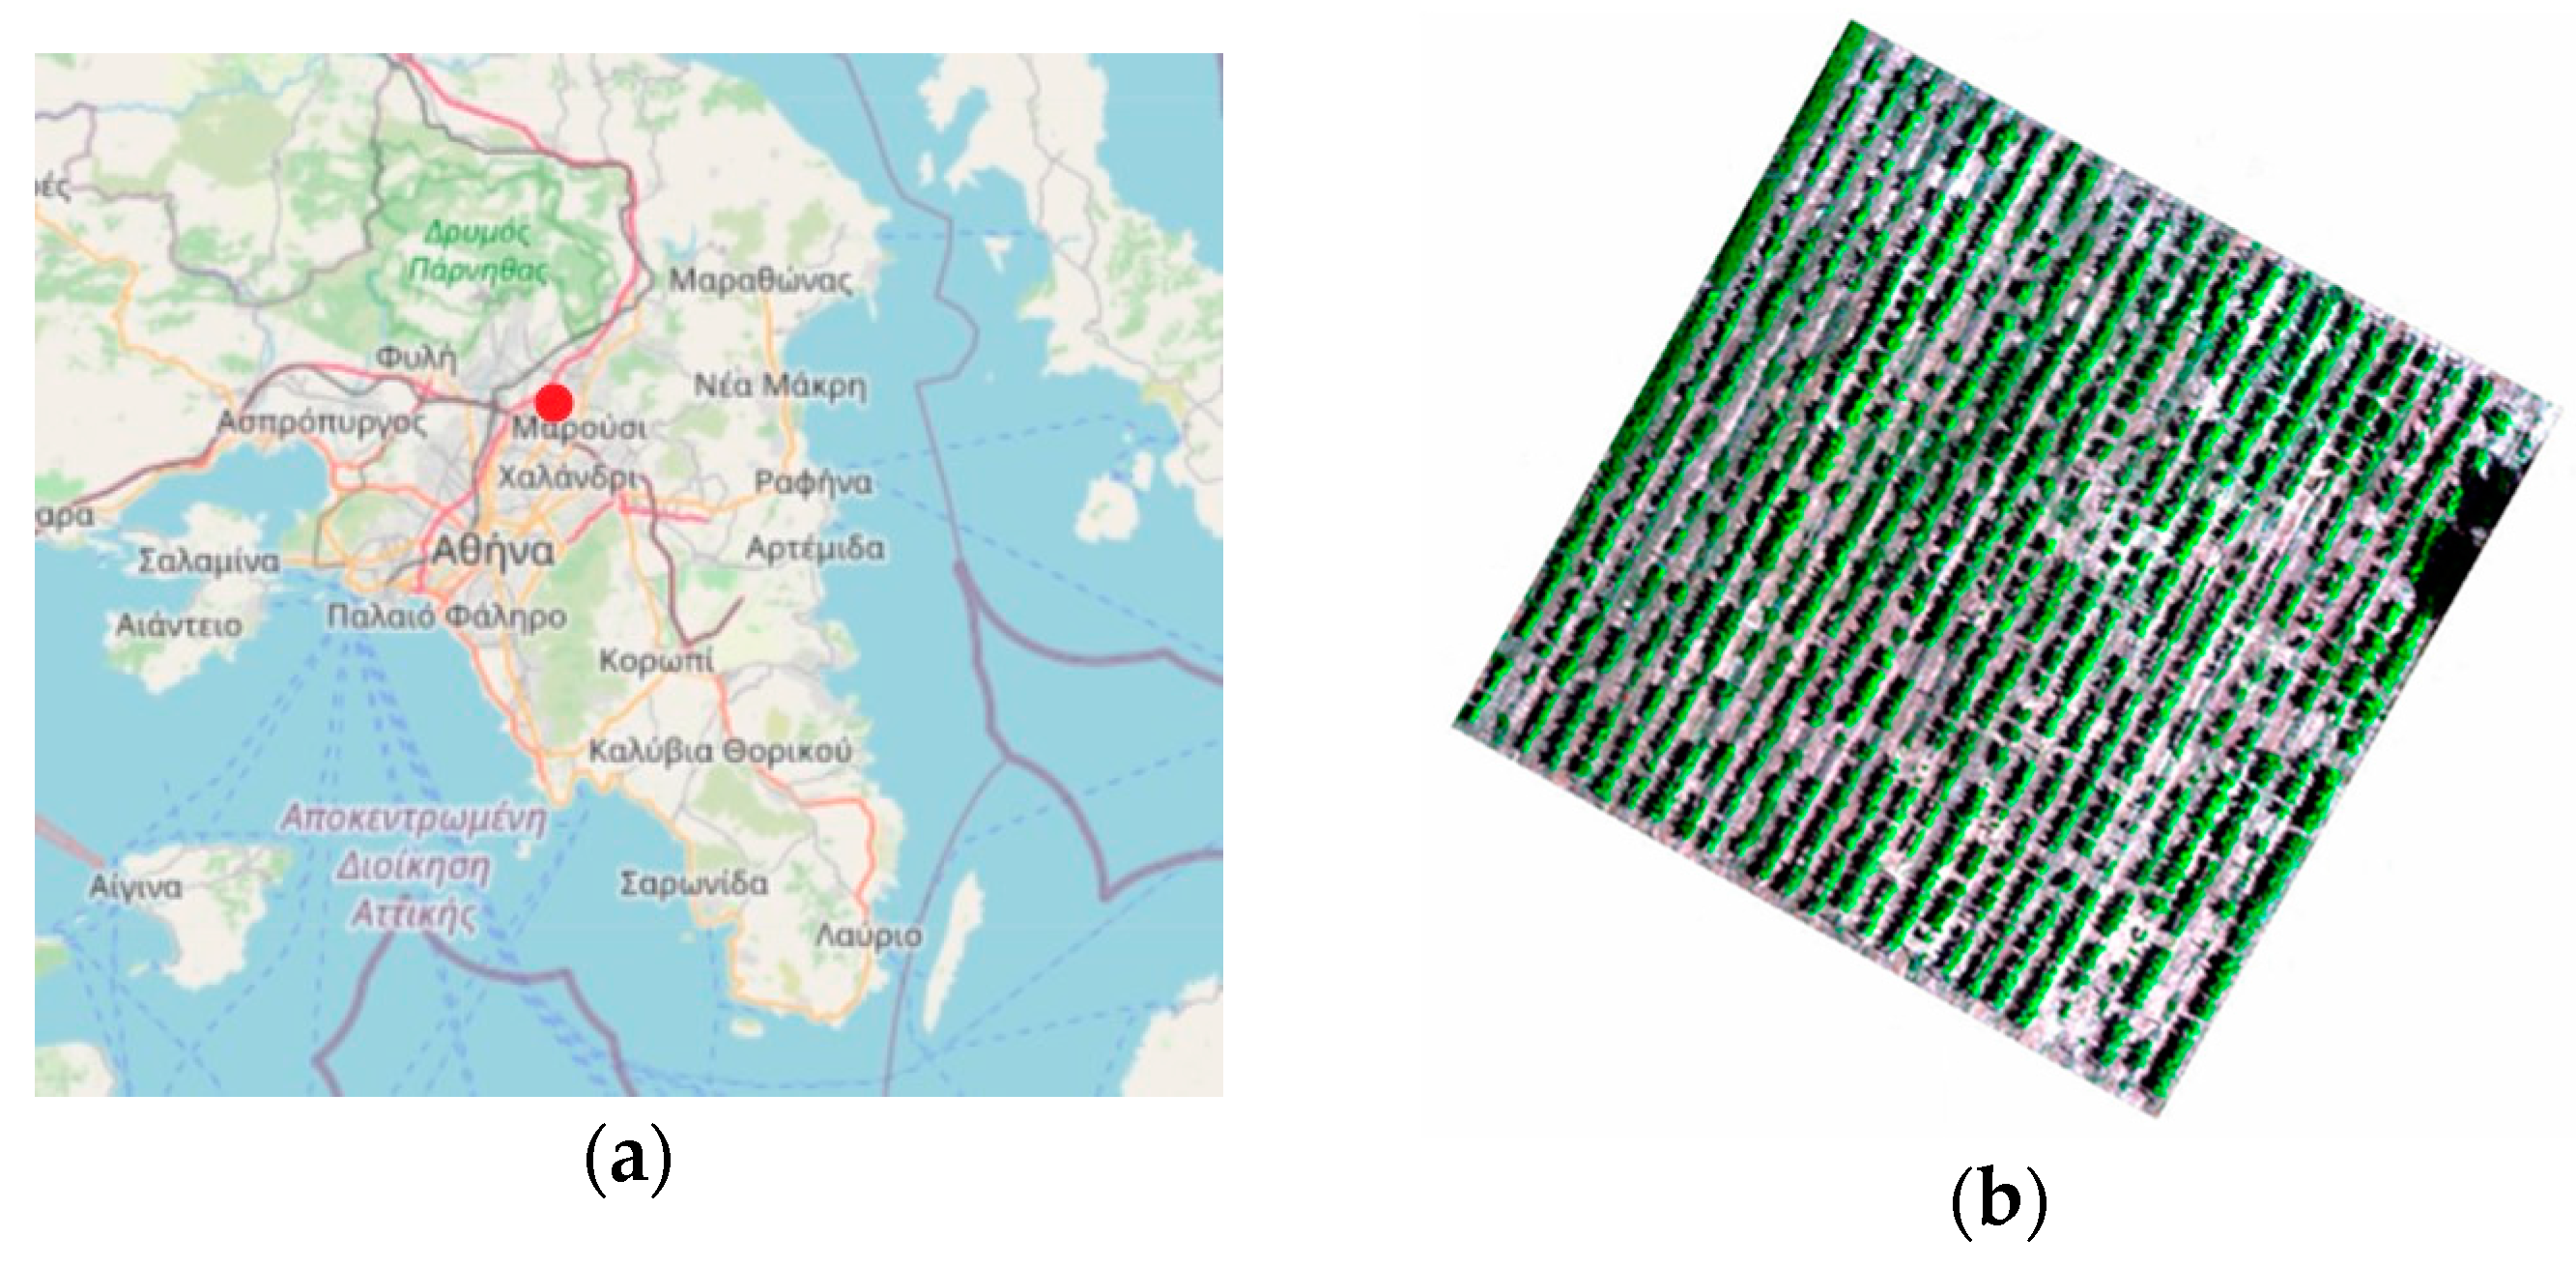
2.1. Study Area and Equipment
This research focuses on a vineyard in the northern part of Athens within the Attica region (Figure 1a). The study area is home to 112 different vineyard varieties (Figure 1b), offering an ideal setting to apply methods for the evaluation of various characteristics of the plants.
Figure 1.
(a)Area of interest from open street map geographic database [9] and (b) Study vineyard area.
The vineyard area was captured using the multispectral camera Micasense RedEdge-M (Figure 2a) in May 2022. By providing bands in five different spectral values (Figure 2b), a wealth of information about the vineyard’s condition can be extracted from the images.
Figure 2.
(a) Lens configuration of Rededge-M camera and (b) Spectral band values and reflection percentage in a typical vegetation spectrum [10].
2.2. Datasets
The aerial images collected contain information about five different spectral bands. Using these images, the orthophotomap of the vineyard was created via the Metashape software [11]. The procedure includes the stage of sparse and dense point cloud creation and the building of a digital elevation model in order to lead to the orthophotomap creation.
Moreover, field measurements for varieties’ location identification were conducted. For this purpose, the GNSS GINTEC-M20 receiver was used. This receiver is capable of achieving horizontal position accuracy of less than 2 cm. In the vineyard fields, labels for each variety were positioned at the starting point of each variety. The locations of these labels were mapped using the GNSS receiver in the GGRS87 coordinate reference system, which is the National Greek Coordinate system.
2.3. Method
In this study, a methodology was employed to analyze the spectral information of different grapevine varieties through a comparative approach and clustering techniques. Seven spectral indices were computed for each grapevine variety, to identify the most important related to vineyard health. From those, two indices were selected which played a key role in clustering algorithms, and the resultant data underwent analysis to comprehend the various factors influencing vineyard health. The study determined the optimal number of classes for dataset classification and assessed their significance in gauging vineyard health.
3. Results and Discussion
Utilizing the vast potential of machine learning, supervised algorithms were employed to identify grapevine areas within the orthophotomap. The Maximum Likelihood algorithm displayed an impressive accuracy of 98.79% in correctly pinpointing vine pixels. The resulting grapevine masks played a crucial role in outlining distinct polygons, each representing a specific grapevine variety. Subsequently, seven different vegetation indices (Chlorophyll Index–Green (CIG), Chlorophyll Index–RedEdge (CIRE), Chlorophyll Vegetation Index (CVI), Normalized Difference Vegetation Index (NDVI), Green Normalized Difference Vegetation Index (GNDVI), Enhanced Vegetation Index2 (EVI2) and Ratio Vegetation Index (RVI)) were calculated for each polygon, offering valuable insights into the unique characteristics of each variety. To explore the relationship between varieties, two pairs of indices (pair1: CVI-RVI, pair2: CLGR-CLRE) were chosen based on lower correlation. Following this, k-Means and Gaussian Mixture Model (GMM) clustering algorithms were applied to categorize varieties into three groups. The k-Means (Figure 3a) and GMM (Figure 3b) algorithms successfully categorized 73 and 58 out of 112 varieties, respectively, into three groups, with both pairs of indices yielding the same classification. The remaining varieties were left unclassified. By combining the results of both algorithms (Figure 3c,d), 25 out of 112 varieties were grouped (Group 1-2-3: 13-4-8 varieties) based on specific spectral properties, demonstrating a comprehensive and effective approach.
Figure 3.
K-means clustering results (a), Gaussian mixture model clustering results (b), combination of algorithms’ results (c,d).
This study aimed to explore the use of multispectral images for identifying various grapevine varieties. Unlike previous studies that often focused on areas producing either table grapes or wine with a limited number of varieties, this study examined a small area containing a diverse range of grapevine varieties. Initial attempts to classify grape varieties using only the bands of the multispectral camera proved challenging. Consequently, the study employed vegetation indices to create categories, successfully classifying the varieties into three classes. Spatial analysis revealed that varieties classified in the same class were sometimes spatially related, prompting questions about the influence of unique characteristics versus external factors like soil, water, and fertilizer on classification outcomes.
4. Conclusions
In summary, understanding the unique characteristics of different grapevine varieties is paramount for farmers, as it empowers them to optimize yields, make informed decisions about planting and harvesting, and implement effective disease management strategies. This knowledge allows farmers to adapt their cultivation practices to specific growing conditions, ultimately maximizing productivity and minimizing crop losses. As this study serves as a foundational exploration into grapevine growth characteristics, there remains vast potential for future applications and scientific investigations in the farming sector. Future attempts may include the integration of hyperspectral images, data fusion with aerial and satellite data, and advanced techniques such as deep learning, time series analysis, and multi-dimensional vector analysis. The ongoing advancement of technology and computational capabilities promises exciting prospects for further enhancing the understanding of plant growth dynamics and improving agricultural practices.
Author Contributions
Conceptualization, O.K.; methodology, O.K.; validation, O.K.; formal analysis, O.K.; data curation, O.K.; writing—original draft preparation, O.K.; writing—review and editing, E.O.; visualization, O.K.; supervision, E.O.; project administration, E.O.; funding acquisition, E.O. All authors have read and agreed to the published version of the manuscript.
Funding
The work was contacted within the research program MERIAVINO (Multiscale Sensing for Disease Monitoring in Vineyard Production) of the EC ICT-AGRI-FOOD 2019 Joint Call and supported by Greece GSRT contract number T12EPA5-00068.
Institutional Review Board Statement
Not applicable.
Informed Consent Statement
Not applicable.
Data Availability Statement
The data presented in this study are available on request from the corresponding author.
Acknowledgments
The multispectral images were given by the Laboratory of Remote Sensing of National and Technical University of Athens, Dimitris Taskos provided us access to the Institute of Technology of Agricultural Products for the data collection.
Conflicts of Interest
The authors declare no conflict of interest.
References
- Ballesteros, R.; Intrigliolo, D.S.; Ortega, J.F.; Ramírez-Cuesta, J.M.; Buesa, I.; Moreno, M.A. Vineyard yield estimation by combining remote sensing, computer vision and artificial neural network techniques. Precis. Agric. 2020, 21, 1242–1262. [Google Scholar] [CrossRef]
- Loggenberg, K.; Strever, A.; Greyling, B.; Poona, N. Modelling water stress in a Shiraz vineyard using hyperspectral imaging and machine learning. Remote Sens. 2018, 10, 202. [Google Scholar] [CrossRef]
- Chancia, R.; Bates, T.; Vanden Heuvel, J.; van Aardt, J. Assessing grapevine nutrient status from unmanned aerial system (UAS) hyperspectral imagery. Remote Sens. 2021, 13, 4489. [Google Scholar] [CrossRef]
- Anastasiou, E.; Castrignanò, A.; Arvanitis, K.; Fountas, S. A multi-source data fusion approach to assess spatial-temporal variability and delineate homogeneous zones: A use case in a table grape vineyard in Greece. Sci. Total Environ. 2019, 684, 155–163. [Google Scholar] [CrossRef] [PubMed]
- Jones, G.V. Sustainable vineyard developments worldwide. J. Enol. Vitic. 2012, 85, 973. [Google Scholar]
- Kasimati Jordan, C.F. Derivation of Leaf-Area Index from Quality of Light on the Forest Floor. Ecology 1969, 50, 636–666. [Google Scholar]
- Sassu, A.; Gambella, F.; Ghiani, L.; Mercenaro, L.; Caria, M.; Pazzona, A.L. Advances in Unmanned Aerial System Remote Sensing for Precision Viticulture. Sensors 2021, 21, 956. [Google Scholar] [CrossRef] [PubMed]
- Akkara Silva, D.M.; Bernardin, T.; Fanton, K.; Nepaul, R.; Pádua, L.; Sousa, J.J.; Cunha, A. Automatic detection of Flavescense Dorée grapevine disease in hyperspectral images using machine learning. Procedia Comput. Sci. 2021, 196, 125–132. [Google Scholar] [CrossRef]
- OpenStreetMap. Available online: https://www.openstreetmap.org/#map=7/37.280/23.570 (accessed on 1 October 2023).
- MicaSense. Available online: https://support.micasense.com/hc/en-us/article_attachments/204648307 (accessed on 1 October 2023).
- Agisoft Metashape Professional; Version 1.7.1; Agisoft LLC: St. Petersburg, Russia, 2021.
Disclaimer/Publisher’s Note: The statements, opinions and data contained in all publications are solely those of the individual author(s) and contributor(s) and not of MDPI and/or the editor(s). MDPI and/or the editor(s) disclaim responsibility for any injury to people or property resulting from any ideas, methods, instructions or products referred to in the content. |
© 2023 by the authors. Licensee MDPI, Basel, Switzerland. This article is an open access article distributed under the terms and conditions of the Creative Commons Attribution (CC BY) license (https://creativecommons.org/licenses/by/4.0/).