1. Introduction
In many countries, round wood is sold in stacks. The most important factor for the purchaser when buying round wood in stacks is to precisely know the volume, which is acquired. There are two parameters, which are important at this point: the stack volume and the solid wood content. The stack volume is normally measured by multiplying the length, width, and height of a stack and its result is the cubic area occupied by the stack of wood. Two common units to express the stacked wood measure are the stere and the cord. However, when expressing the volume of a stack in such a way, not only the wood volume but also the bark portion, air space, etc., are included.
The solid wood content corresponds to the real round wood volume which is the basis of the sales process. To figure out this latter one, it is necessary to measure every log´s volume. Nevertheless, due to the huge volumes of round wood purchases in many countries, this procedure is unfeasible. Therefore, this value is normally calculated. The calculation of the solid wood content in a stack has been a forest research issue for the last two centuries [
1]. However, the first publications related to this topic date from the end of the 19th century such as the research from Bauer in Germany in 1879 and von Senkendorf in Austria in 1881 [
2]. The realization of these studies was based on the increasing demands of wood and the diminishing supply of desirable wood species [
3]. Nowadays, the main reason is the need to manage the financial resources more efficiently when purchasing raw material. A calculation error at that step of the sales process can cause considerable economic losses which in the current context of a global market can mean a considerable loss of competitiveness.
The influencing parameters on the stack volume and therefore on the conversion factors from stack volume into solid wood content have constituted an important research topic whose first publications date back to the beginning of the 20th century with the research results of Zon in 1903 [
4]. Although these parameters are already considered in the measurement of stacks in countries such as Sweden, their influence has not been analyzed individually until now based on a broad statistical background.
The collection of the data for such a purpose supposes the measurement of the stack volume and the solid wood content of a considerable number of log piles in order to obtain a sufficiently broad statistical basis. Therefore, the whole process is very costly in practice. Additionally, due to the fact that the most precise method to measure the real volume of a log is the water displacement method and its application for an enormous number of logs would require a significant period of time and financial resources. It can hence be assumed that another way must be found since this method is practically unfeasible. Consequently, the approach based on the implementation of a 3D simulation model to realize this analysis was hereby tested since it allows us to reproduce virtually innumerable stacked piles and consequently it is not necessary to measure so many stacks on the field.
2. Material and Methods
Our simulation model consists of a software based on the cross-platform game engine Unity 3D. It is capable of simulating an enormous number of stacks in 3D and measuring them in accordance with three methods: fotooptical measurement, by measuring the front and back side surfaces of the stack and by implementing the sections method which is described in the German framework agreement for the round wood trade [
5]. It calculates the solid volume of each log and provides the conversion factors according to the three methods. This program consists of several interfaces: The first ones are designed to introduce the data related to the log and the pile to be simulated such as the minimum length, the angles of the stack sides, the wood density, the coefficient of friction, and the proportion of logs, which are piled in one concrete direction. This data can be based on real data or selected arbitrarily by the user. Another part corresponds to the simulation parameters: number of iterations to be simulated, the accuracy with which the stack will be measured and number of supporting points per meter that shall be considered in measuring the pile according to fotooptical methods. The last interface shows the results which can be exported as e.g., a .csv table.
To analyze the influence of crookedness, a database of logs of the tree species Scots pine (Pinus sylvestris L.) was created with the following parameters, which were measured on 1000 logs:
The log length, measured by mean of a forest tape. This data is expressed in meters to two decimal places.
The diameters at both ends and midpoint, measured by mean of a caliper. For each point two measurements were taken perpendicularly. This data is expressed in millimeters.
The log crookedness, measured by setting a levelling rule on the curved log side and measuring the distance between the levelling rule and the log at the deepest point in millimeter. After that, this distance was divided by the log length and the parameter value is obtained and expressed in millimeter per meter.
The bark thickness, measured by mean of a Swedish bark gauge. In some logs where the bark was too thin, a rule was used for the measurement at both ends of the log. This data is expressed in millimeters.
The taper amount, calculated by subtracting the average small end diameter from the average large end diameter and dividing it by the log length. Thus, this parameter is measured in millimeter per meter.
Finally, the parameter, which considers the ovality of each log, computed by dividing the smaller diameter by the bigger diameter of each measurement point and calculating the average from the three resulting values (large end, small end and midpoint of the log). The measurement of this parameter results in a factor between 0 and 1, where the 1 represents a round log.
The stack parameters remained unmodified for all simulation sets. The side angle of each stack was 45°. The wood density was 520 kg/m3. The minimum stack length was 7 m. The distribution of the stacked logs regarding the piles’ direction was 50% (distribution of small end and large end diameter).
From the original database, 300 logs were selected by taking into consideration their crookedness. This means those logs whose values concerning this parameter were more than zero (i.e., the logs were crooked) were chosen.
Using the main database, five data sets were formed to analyze the influence of the proportion of crooked logs in a stack: the first data set contains the original data from real logs, where 100% of the logs are crooked. In the second data set, the crookedness for 20% of the logs was modified to zero and 80% remained unaltered (i.e., crooked). The selection of these logs was performed randomly. According to this method three additional data sets were created with (i) 50% of crooked logs, (ii) 20% of crooked logs and the last one with (iii) only straight logs (see
Table 1).
In total, 150 simulations were carried out for each data set. After that, basic statistics of the results were calculated, as well as parameters such as stack volume and conversion factors according to the fotooptical and the section method and compared.
3. Results
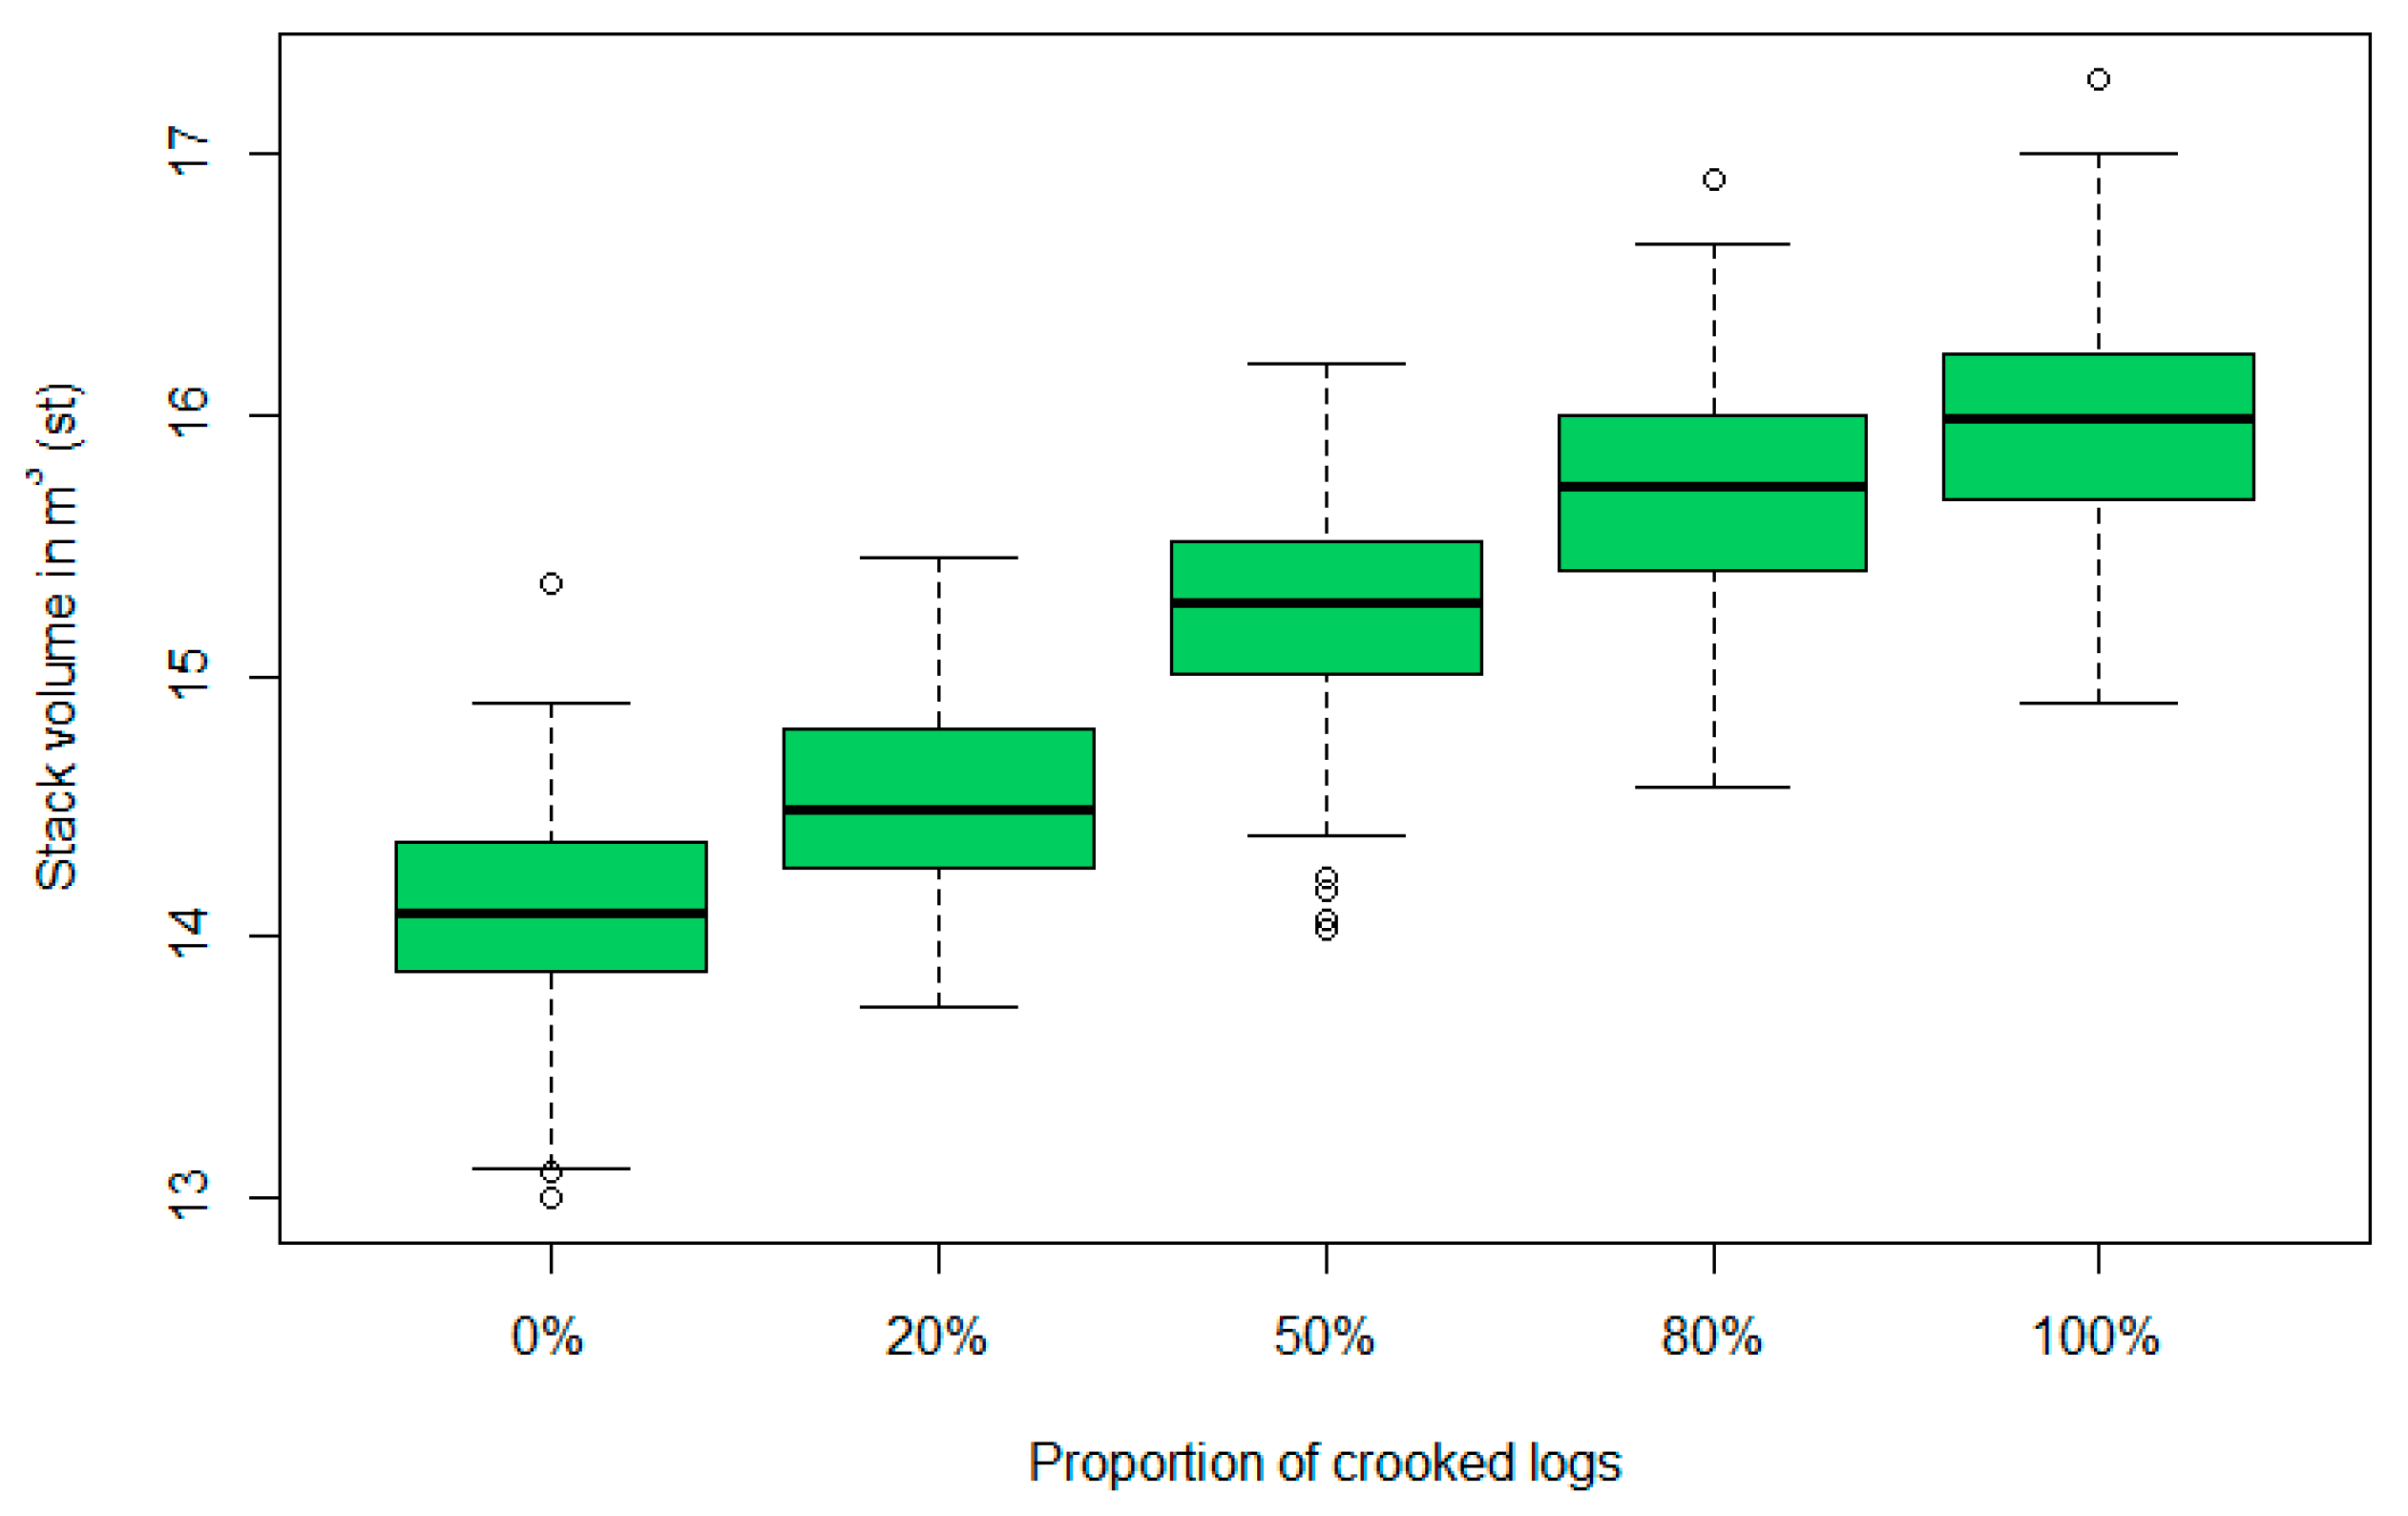
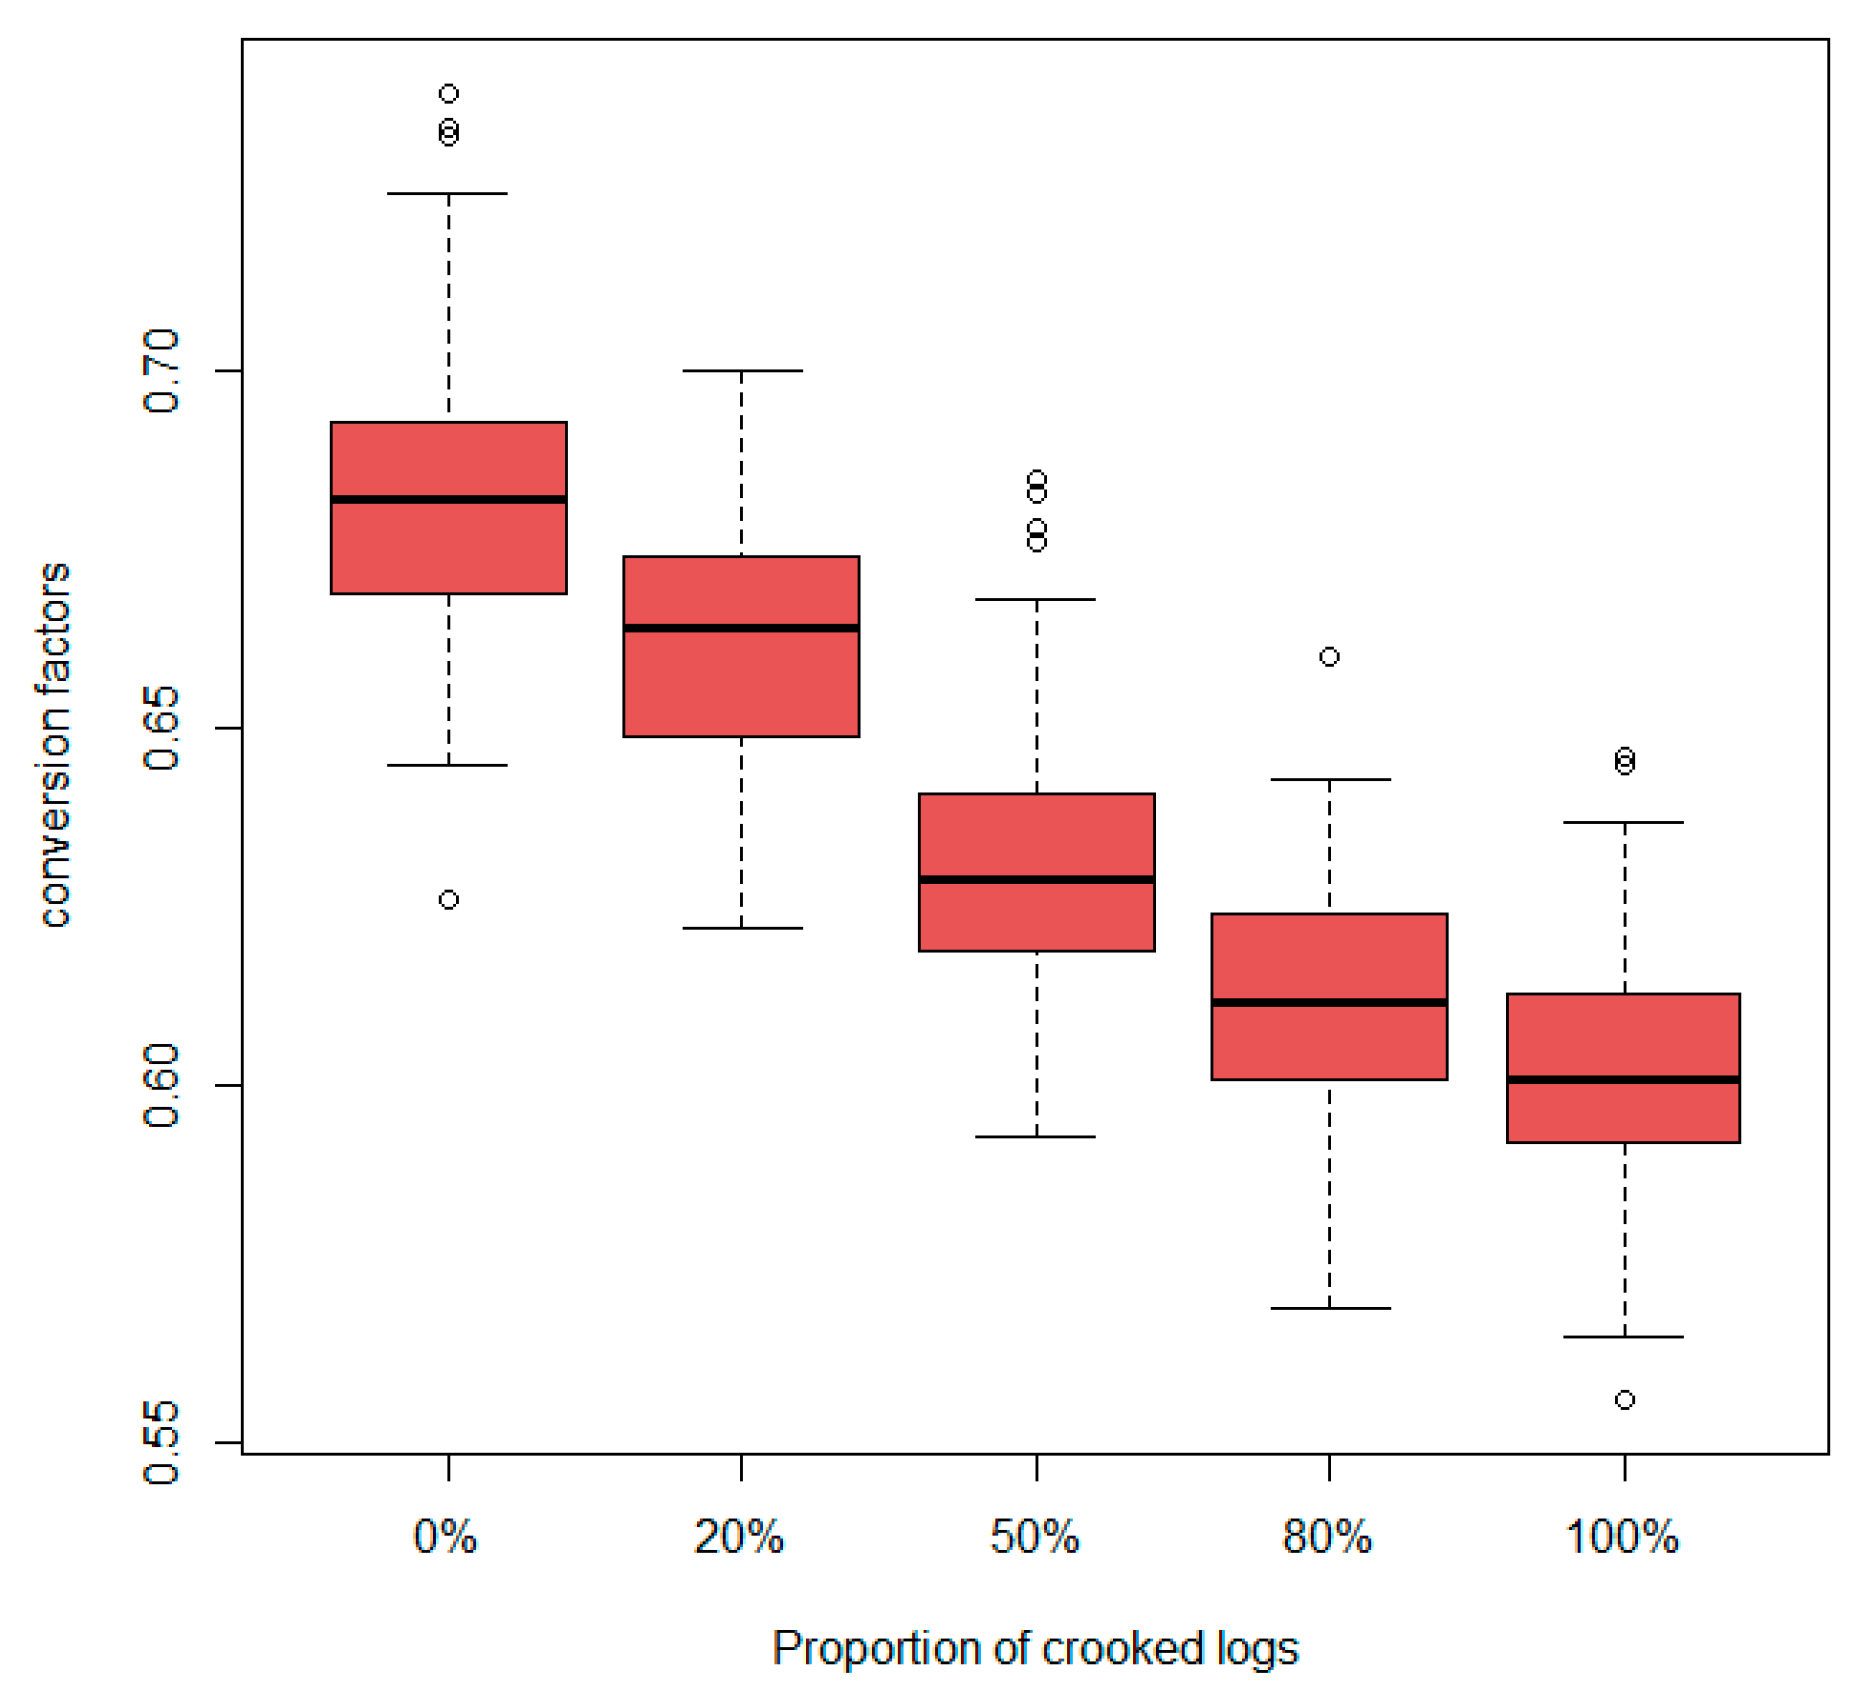
The average values of the stack volume and conversion factors according to different proportions of crooked logs in the stack are displayed in
Figure 1 and
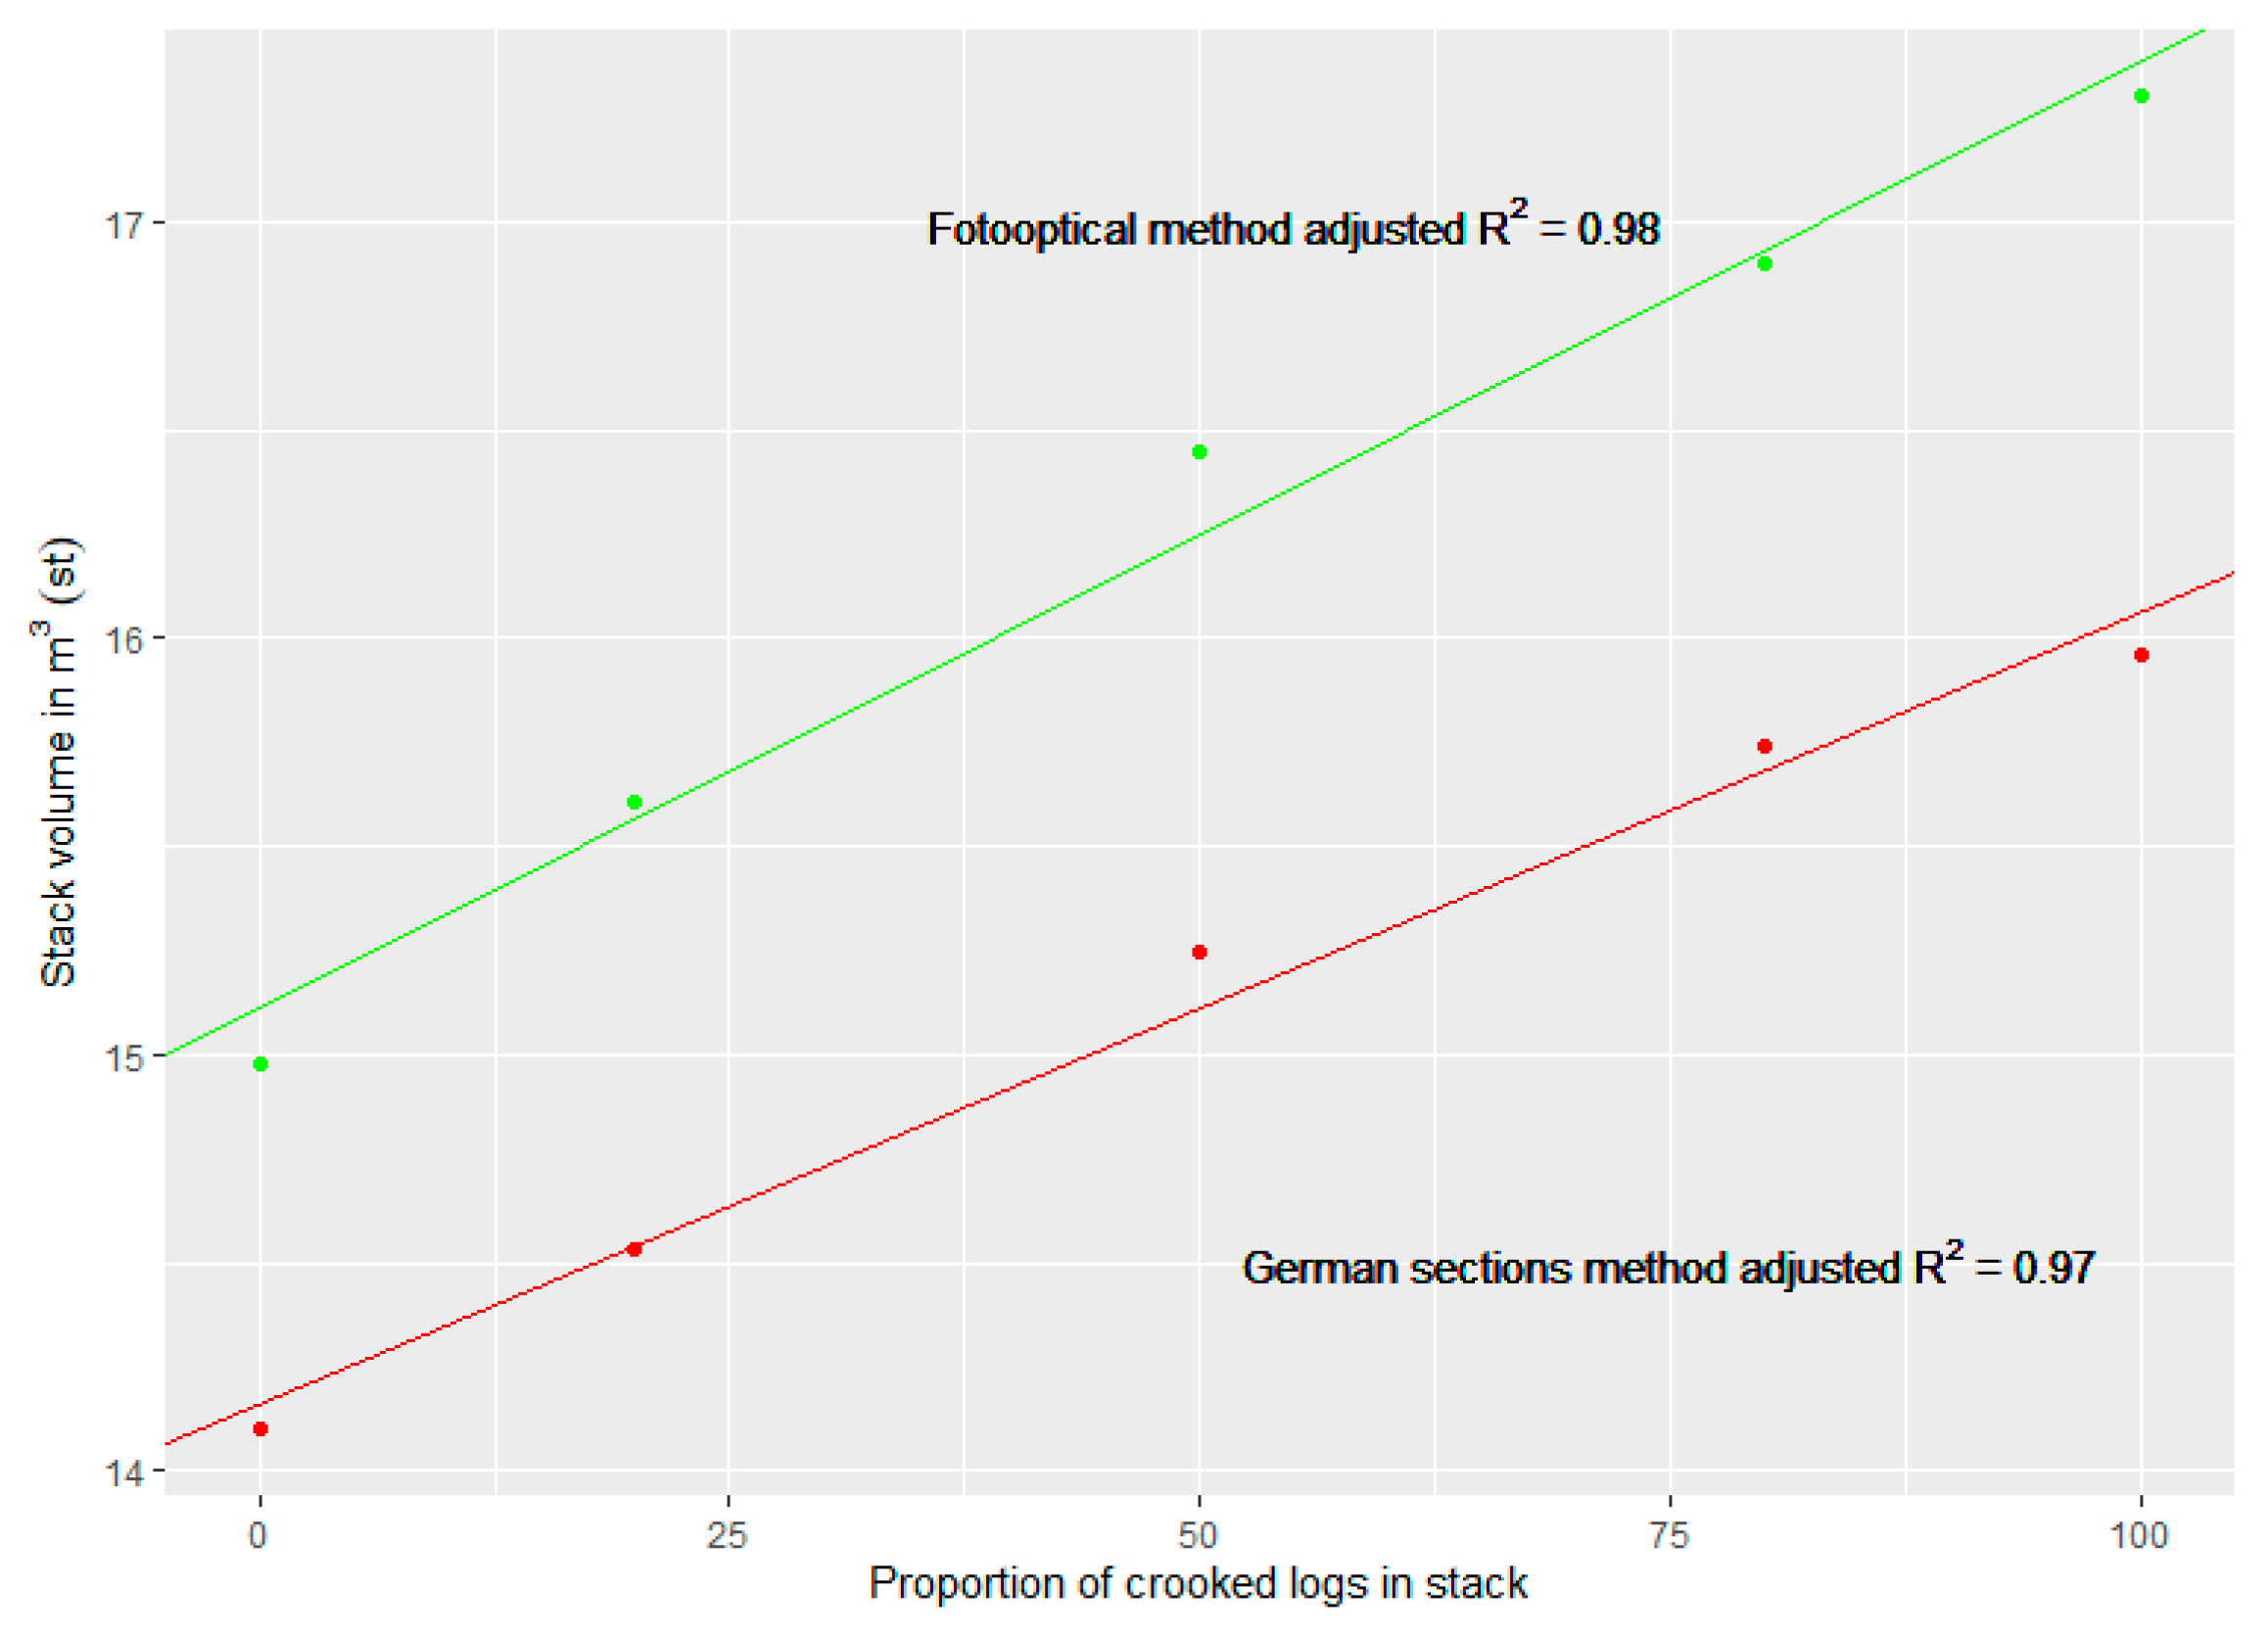
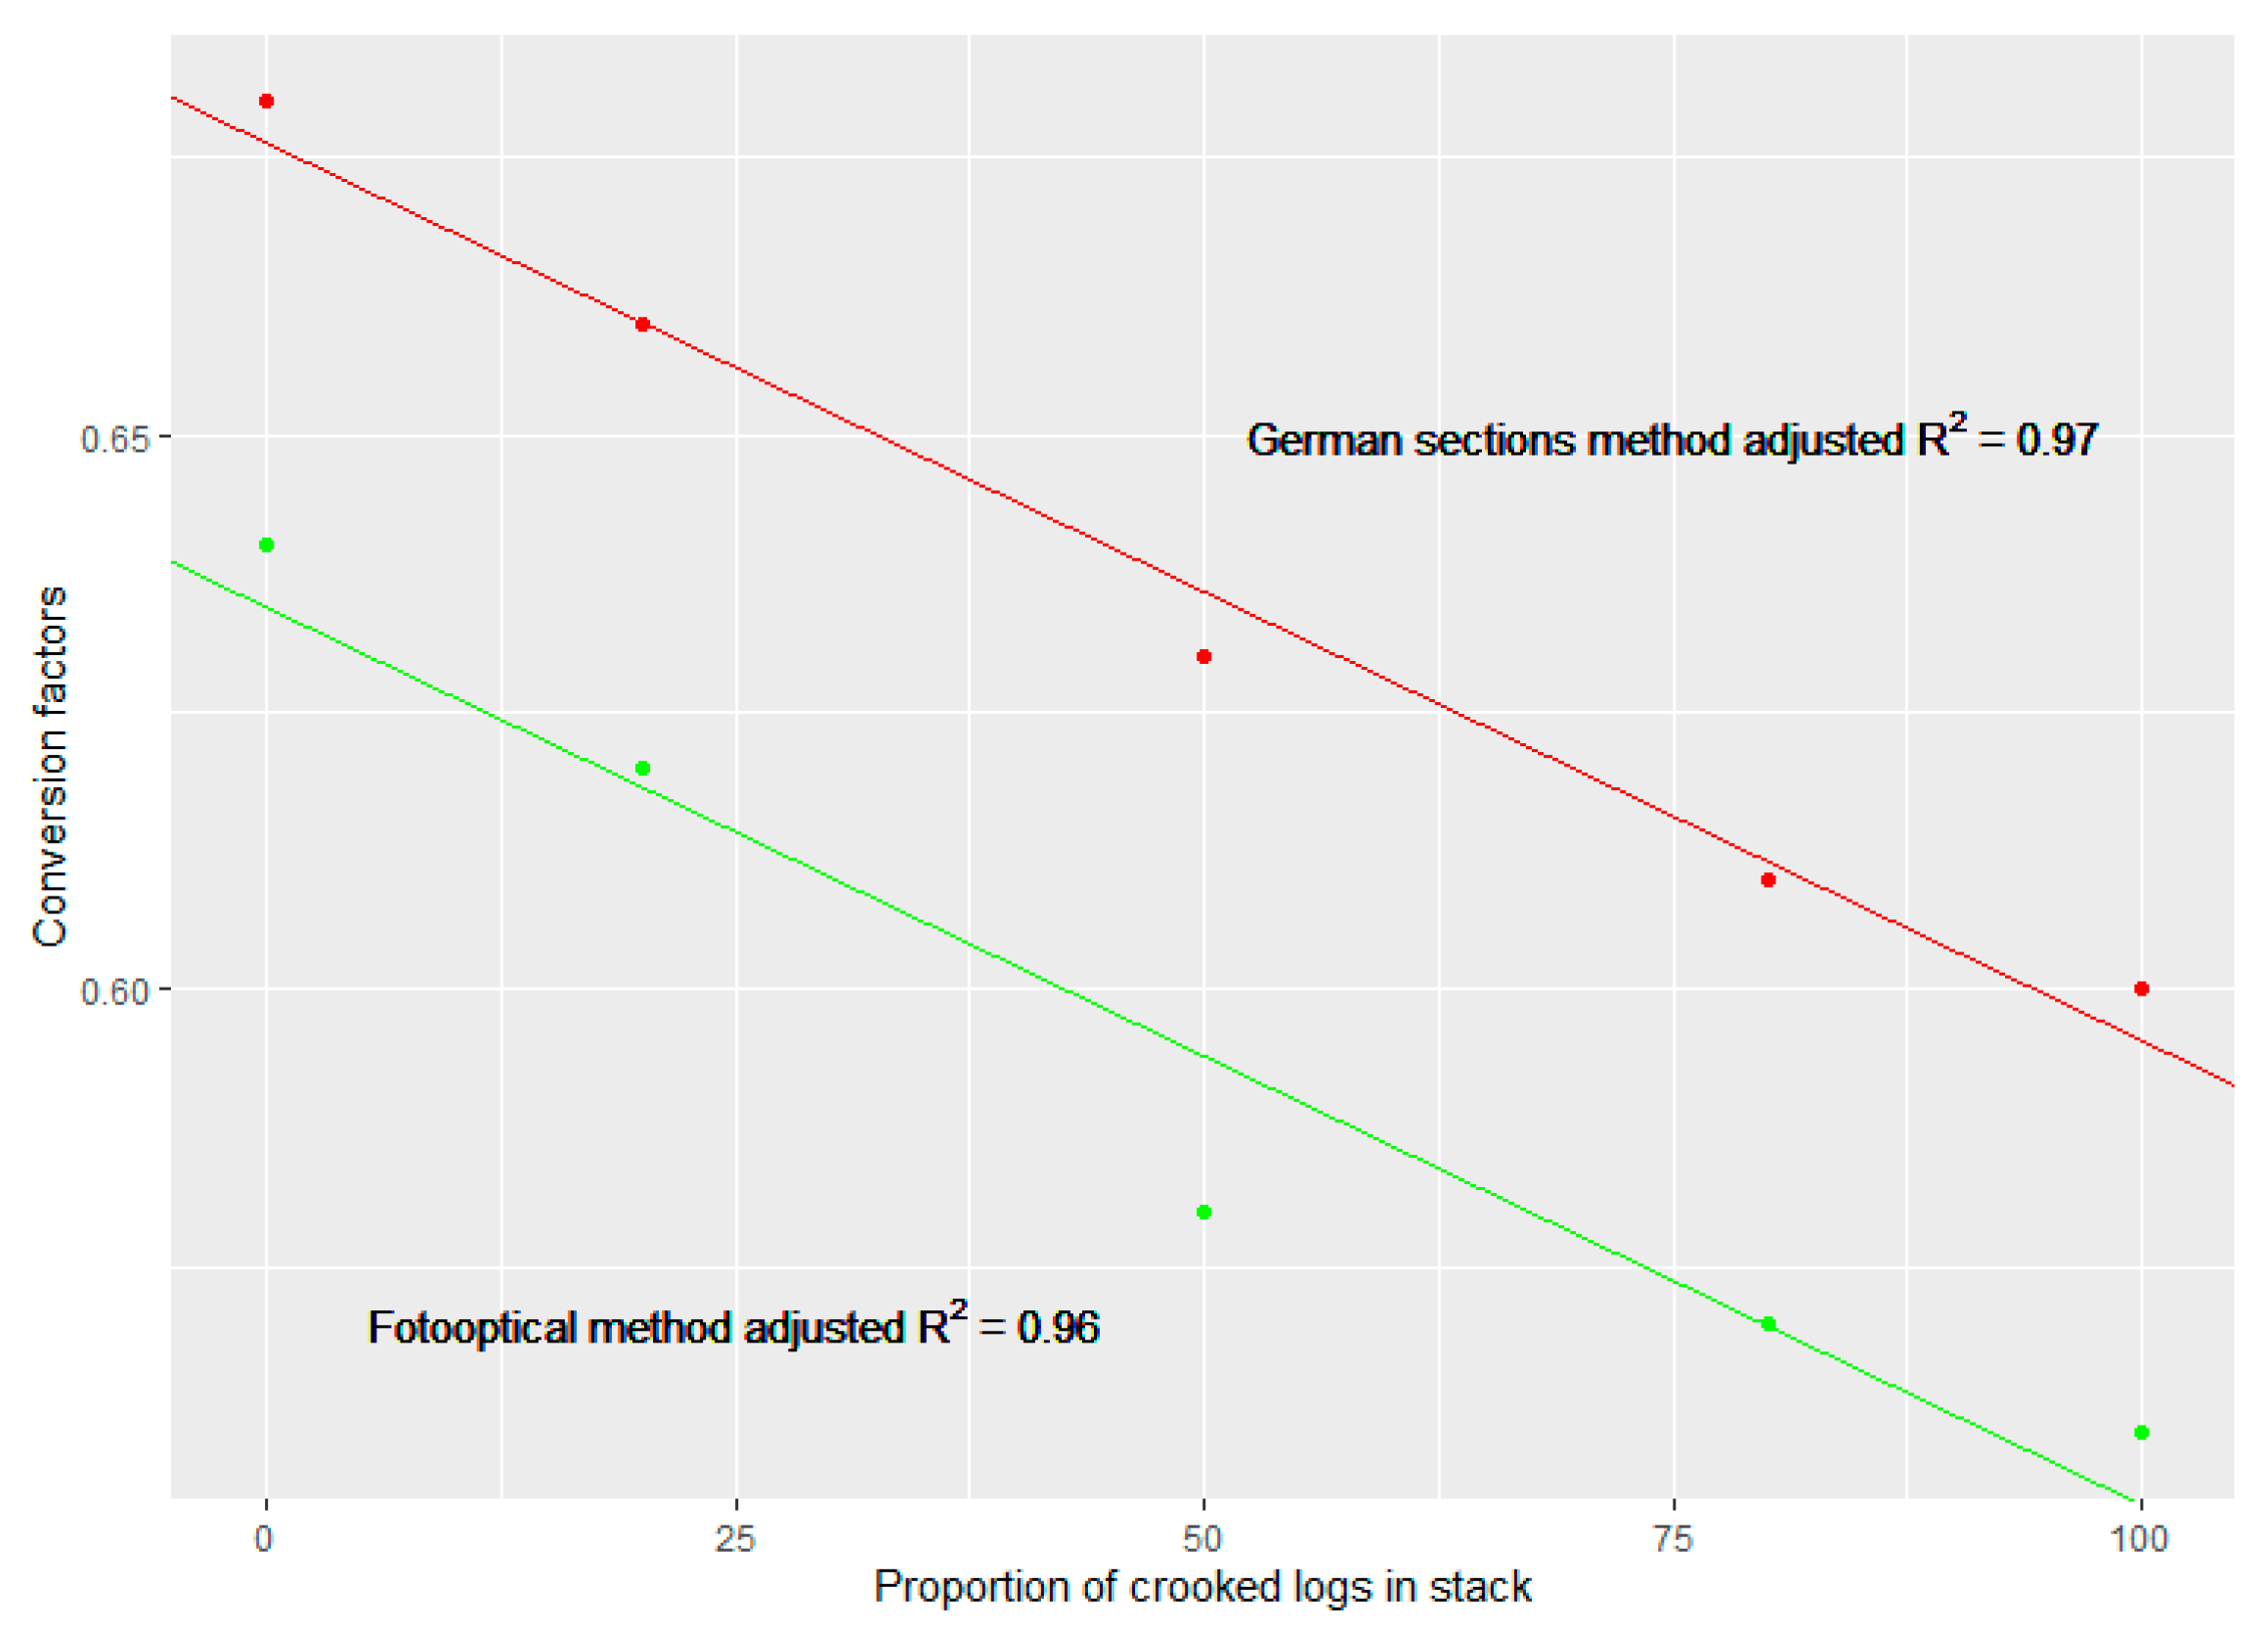
Figure 2. Two logistic regressions for each measurement method (section method and fotooptical method) were fitted to analyze the relation between the stack volume and the conversion factors and of the crooked logs in the stack. These logistic regressions are displayed in the
Figure 3 and
Figure 4. Thus, it can be deduced that these parameters show a linear relation.
4. Discussion and Conclusions
The results show that crookedness exerts a direct influence on both the stack volume and the conversion factor: The bigger the portion of crooked logs in the stack, the larger is the stack and inversely, the smaller is the conversion factor. In this exemplary case, the original logs’ crookedness was not very pronounced. Therefore, variations were not too high.
The results confirm our hypothesis that crooked logs occupy a larger volume in the pile than straight ones do and produce air spaces between them such. Therefore, this is mentioned in the measurement guidelines of some countries already, such as the Standard Procedures for the Measurement of Round Timber for Sale Purposes in Ireland [
6] or the Swedish SDC´s instructions for timber measurement [
7] and other references such as Zon [
4], Parde and Bouchon [
8], and Rondeux [
9].
The results of this work demonstrate the capacity of the simulation model to obtain large databases for statistical analyses and a therefore higher reliability. However, it is necessary to perform more simulations with further datasets to, e.g., quantify the influence of other parameters on the stack volume.
Thus, it can be stated that this simulation model provides reliable results which can serve as a basis for future investigations.
Finally, it can be concluded that the parameter crookedness exerts a considerable influence on the stack volume. Therefore, provenience regions, where the raw material is more crooked because of genetics patterns or site conditions, should be considered when purchasing round wood since the solid wood content of a stack will be much lower in comparison to regions where the trees show only a little crookedness.
Author Contributions
Conceptualization, F.d.M.-D., E.T.-E. and T.C.; methodology, F.d.M.-D. and T.C.; formal analysis, F.d.M.-D.; data curation, F.d.M.-D.; writing—original draft preparation, F.d.M.-D.; writing—review and editing, F.d.M.-D., E.T.-E. and T.C. All authors have read and agreed to the published version of the manuscript.
Funding
This study was undertaken in the framework of the project “HoBeOpt”, which was financially supported via the Fachagentur Nachwachsende Rohstoffe (FNR), Germany, by the Federal Ministry of Food and Agriculture (BMEL) (Grant number: 22007918).
Data Availability Statement
The data that support the findings of this study are available from the corresponding author, F.d.M.-D., upon reasonable request.
Conflicts of Interest
The authors declare no conflict of interest.
References
- Graves, H.S. Forest Mensuration; John Wiley and Sons, Inc.: New York, NY, USA, 1906; p. 103. [Google Scholar]
- Schnur, G.L. Converting factors for some stacked cords. J. For. 1932, 30, 814–820. [Google Scholar]
- Keepers, C. A new method of measuring the actual volume of wood in stacks. J. For. 1945, 43, 16–22. [Google Scholar]
- Zon, R. Factors influencing the volume of solid wood in the cord. For. Quart. 1903, 1, 126–133. [Google Scholar]
- RVR. Rahmenvereinbarung für den Rohholzhandel in Deutschland (RVR), 3rd ed.; Fachagentur für Nachwachsende Rohstoffe e.V. (FNR): Gülzow-Prüzen, Germany, 2020. [Google Scholar]
- Purser, P. Timber Measurement Manual. Standard Procedures for the Measurement of Round timber for Sale Pruposes in Ireland; Forest Service in the Department of the Marine & Natural Resources: Dublin, Ireland, 1999.
- SDC ek för. SDC’s instructions for timber measurement. In Measurement of Roundwood Stacks; SDC: Sundsvall, Sweden, 2014; pp. 1–15. [Google Scholar]
- Pardé, J.; Bouchon, J. Dendrométrie; Ecole Nationale du Génie Rural, des Eaux et Forêts: Montpellier, France, 1988. [Google Scholar]
- Rondeux, J. La Mesure des Arbres et des Peuplements Forestiers; Les Presses Agronomiques de Gembloux: Gembloux, Belgium, 1993. [Google Scholar]
| Publisher’s Note: MDPI stays neutral with regard to jurisdictional claims in published maps and institutional affiliations. |
© 2020 by the authors. Licensee MDPI, Basel, Switzerland. This article is an open access article distributed under the terms and conditions of the Creative Commons Attribution (CC BY) license (https://creativecommons.org/licenses/by/4.0/).


