Abstract
One of the numerous fundamental tasks to perform rescue operations after an earthquake is to check the status of buildings that have been destroyed. The methods to obtain the damage map are in two categories. The first group of methods uses data before and after the earthquake, and the second group only uses the data after the earthquakes that we want, to offer a flexible damage map according to information that we are available to achieve. In this paper, we work on VHR satellite images of Haiti and UNet which is a convolution network. The learning algorithm’s profound changes to improve the results were intended to identify the damage of the buildings caused by the earthquake. The deep learning algorithms require training data and that is one of the problems that we want to solve. As well as previous studies examining pixel by pixel degradation, ultimate precision to increase that shows the success of this approach felt and has been able to reach the overall accuracy of 68.71%. The proposed method for other natural disasters such as rockets, explosions, tsunamis, and floods also destroyed buildings in urban areas is to be used.
1. Introduction
The world has constantly influenced natural disasters such as earthquakes, floods, and tsunami during civilization. They are considered to be extremely tragic threats and ruined human security and property. A quick evaluation of infrastructure damage after a dangerous event has an essential role in emergency response management and recovery planning [1,2].
The traditional approach to estimating the spatial distribution of earthquake losses in buildings through building field inspection is made by a volunteer group consisting of engineers, architects, and other construction industry professionals. This precise inspection process is essential because evaluations are reliable and give us valuable information on the damaged building’s seismic function. However, the duration of these inspections makes them impossible for emergency support and planning for early recovery. Depending on the availability of qualified specialists and the geographical distribution of damaged buildings, the field inspection process can last for months [3].
Therefore, for decades, remote sensing techniques play an essential role in examining the earthquake’s damage, especially due to its fast availability after catastrophic and large coverage. In most studies, remote sensing measurements have been used to detect collapsed buildings using different methods before and after the event. Some researchers have only used post-event information and the similarity between damaged buildings that use it to distinguish between destroyed and undamaged buildings that limit this method’s accuracy [4,5,6].
As the main sources of remote sensing, optical images usually provide only two-dimensional information that is not suitable for detecting objects; using LIDAR and SAR can improve determination and identification, especially for three-dimensional objects. Information about the height, especially for the three-dimensional interpretation of the building’s state, can detect damaged and collapsed buildings by comparing the altitude information before and after the event in urban areas. The method of producing accurate altitude data is tough and expensive, which leads to the inaccessibility of the precise 3D data before and after the earthquake. UAV allows for higher resolution images and cloud 3D points. However, the preparation of UAV images is challenging before the earthquake because UAV images are not continually covering all regions of the world. However, satellite images are still the primary and commonest source for damage assessment. For this reason, they are more reliable and more accessible to detect the destruction of buildings [7,8,9].
With the rapid improvement of satellite optics sensors’ spatial resolution, optical data is promising data for identifying earthquake damages. However, achieving remote sensing VHR images before the earthquake is not easy. Therefore, in new studies, we have tried to achieve good results without having the before event information. This has led to valuable algorithms that can be used with both access and not access to data before the earthquake. The other problem with satellite images is that they cannot detect damage to the building’s length due to the imaging of the above [10,11].
The most common method is to detect damage based on change detection techniques. Images before and after an event have been collected and create an image difference, representing the difference between the two datasets. However, this method limits the requirement to have two sets of before and after the earthquake that may not always be available. In such circumstances, machine learning methods had been introduced. Deep learning, one of the advanced techniques in the field of machine learning, is the best method for complex and non-linear feature extraction and is at a high level. In recent years, convolutional neural networks (CNN) due to outstanding performance in extracting features on remote sensing have been widely used [12,13].
In terms of operational response to the disaster, many challenges remain, two of them to declare that we have and try to solve these challenges [14].
- Good performance of deep learning algorithms is limited to the size of data available, and the network structure is considered. One of the most critical challenges for using a deep learning method for monitoring the buildings damaged in the disaster is that the training images of damaged targets are usually not very much. In terms of operational response to the disaster, many challenges remain, two of them declare that we have and try to solve these challenges.
- The size of blocks that have been labeled as undamaged or damaged buildings by the algorithm is ultimately a significant impact on overall accuracy. Previous studies only a label on a large block and was allocated. However, this block contains a large number of pixels is irrelevant. Therefore, theoretically, the pixel-based labeling method is more accurate [15,16].
UNet, which is essentially a convolution network, can ultimately reduce the challenges, and we change its layers to make it perform better [17].
In this study, the convolution neural network UNet for monitoring Haiti earthquake damage on pixel-based images with high-resolution remote sensing is implemented.
2. Experiments
2.1. Datasets
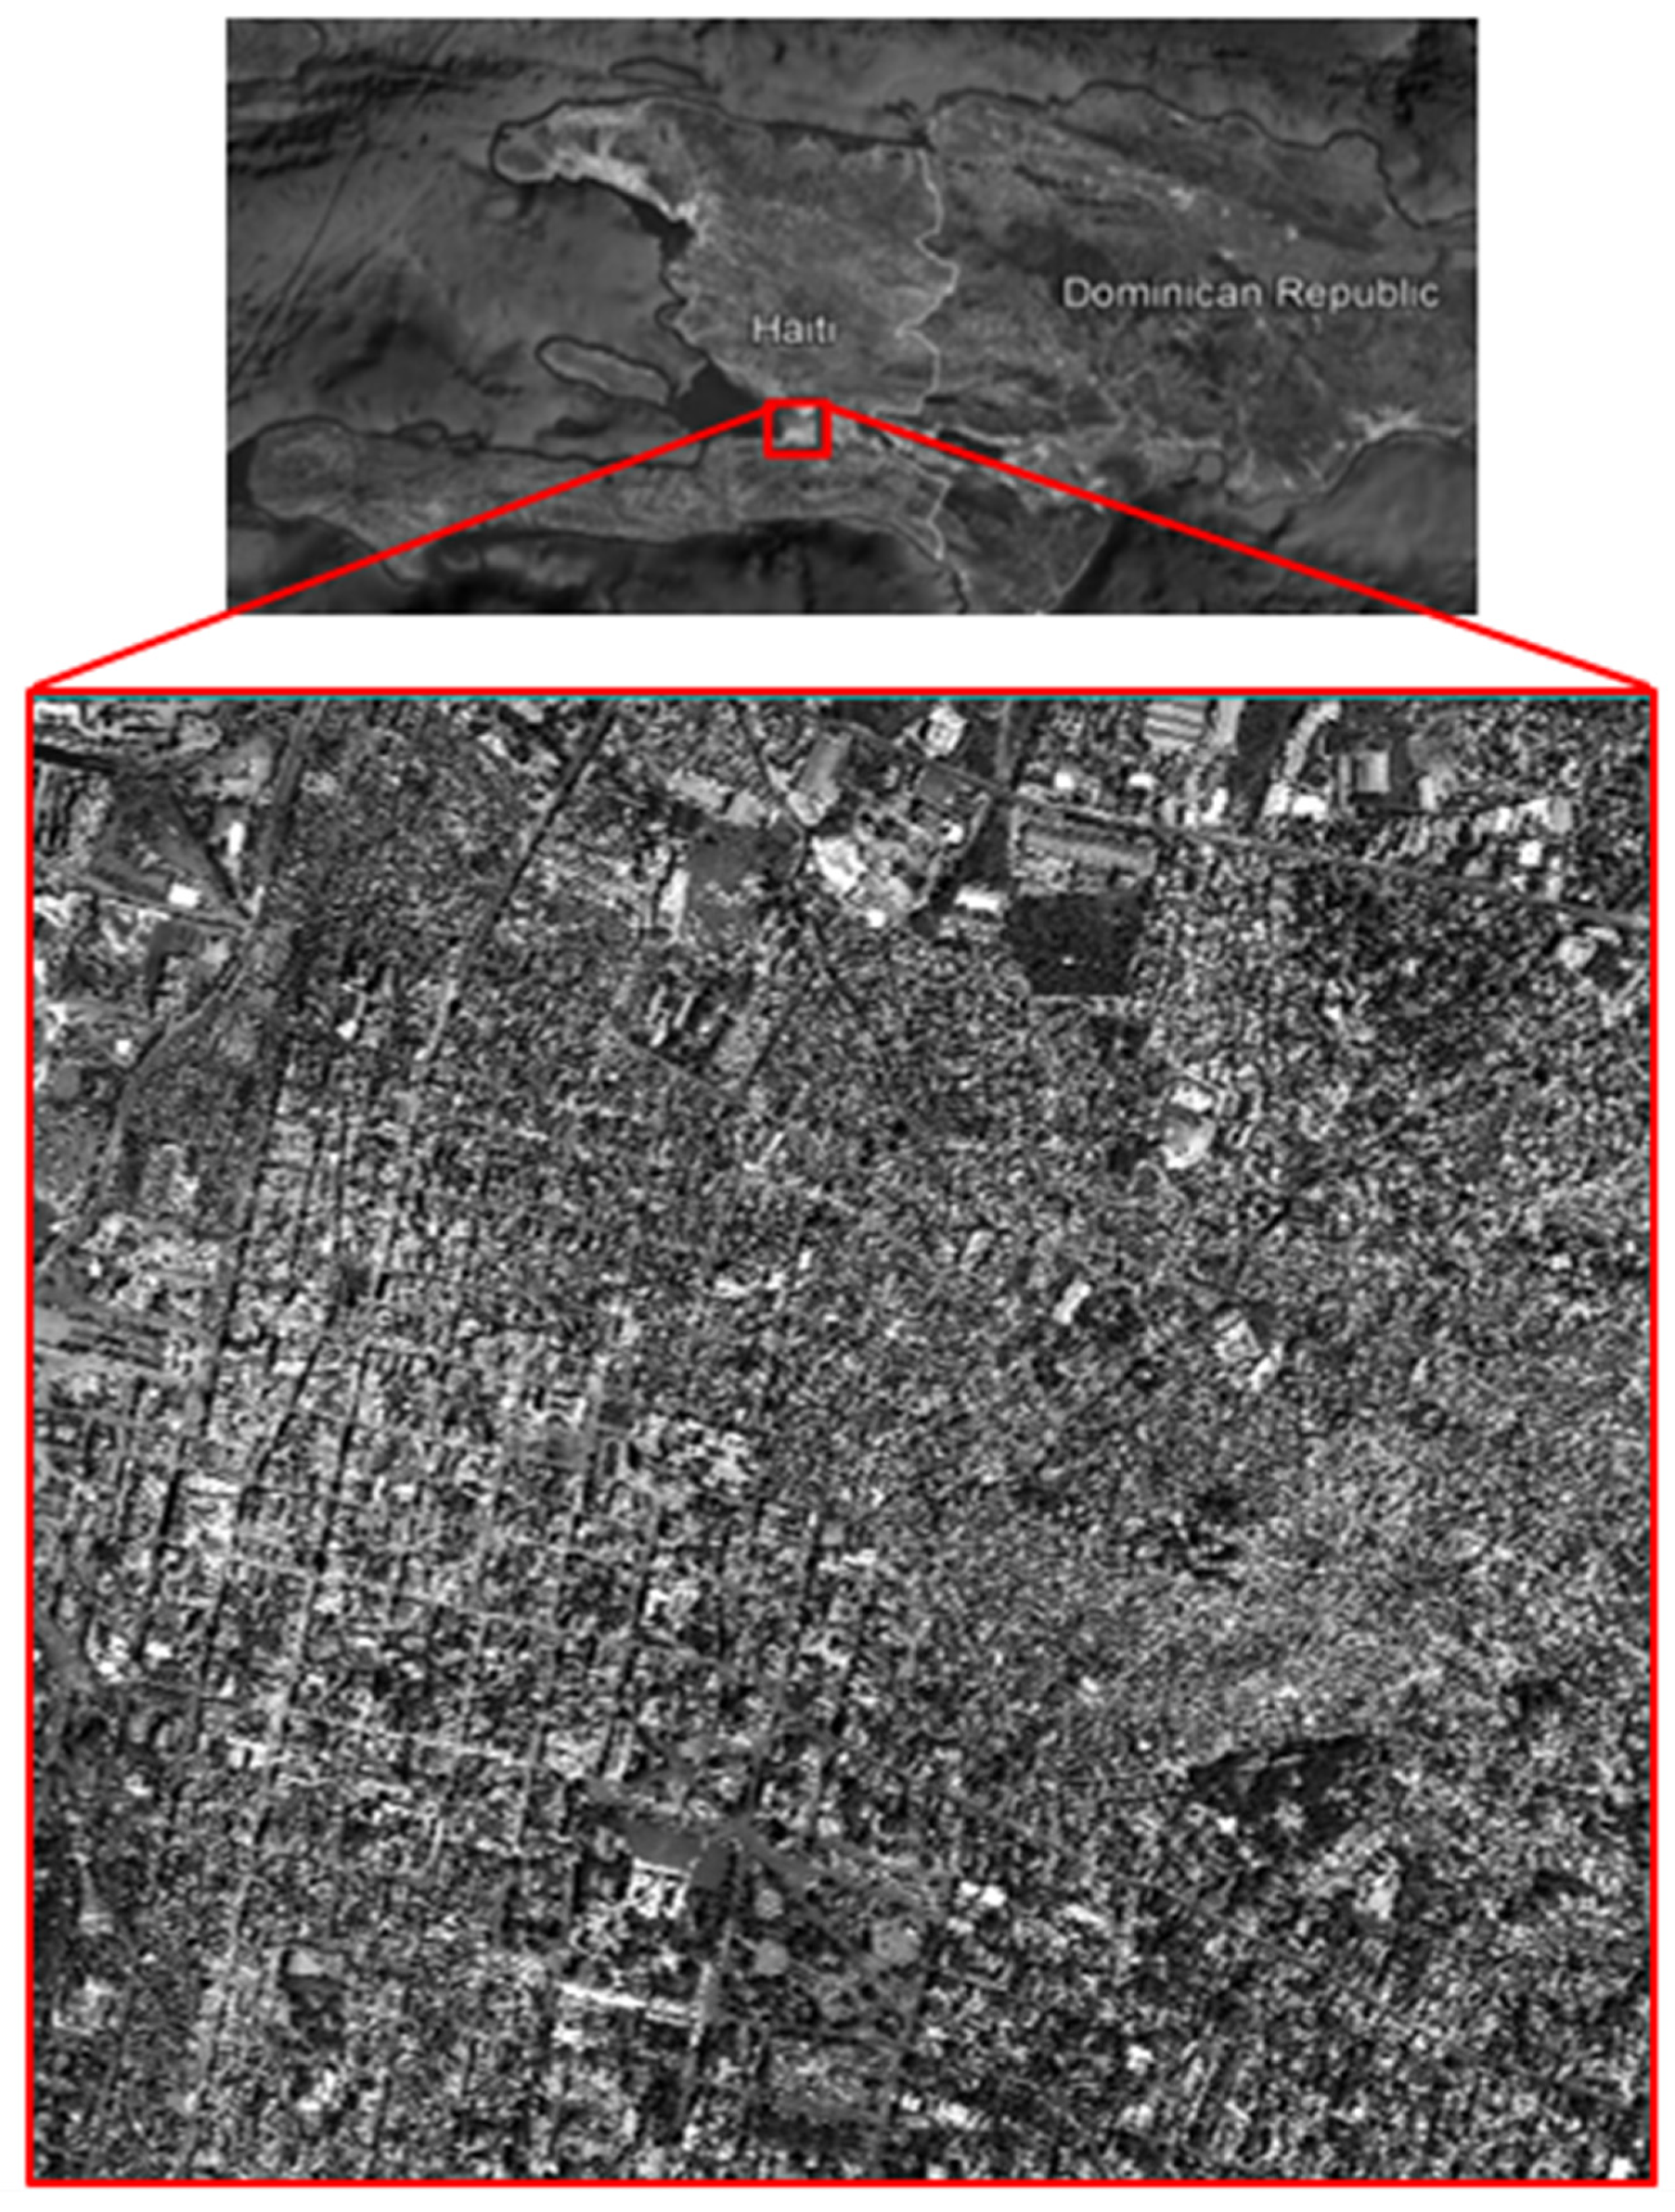
On 12 January 2010, an earthquake with a magnitude of seven on the Richter scale hit Port-au-Prince, capital of Haiti. In Port-au-Prince and in the southern areas of Haiti, about 97,294 houses were completely destroyed and 188,383 houses have suffered damage [18]. The study area is part of the city of Port-au-Prince and is shown in Figure 1. In this study, by Worldview 2 satellite imagery, pre-image was acquired on 16 January 2010, and post-image obtained on 1 October 2009. The satellite image consists of four multi-spectral bands with a resolution of 2 m and one high-resolution panchromatic band with 0.5 m resolution. Four high-resolution colored bands are used in this algorithm, through integrating the multi-spectral and panchromatic bands. To assess damaged and undamaged buildings use the International Institute UNITAR / UNOSAT data and Earthquake Geospatial Data Dataverse (CGA, Harvard Univ) dataset with visual interpretation [19,20].
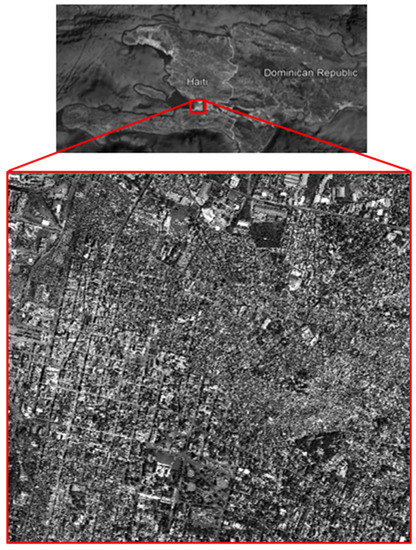
Figure 1.
The location of the study area.
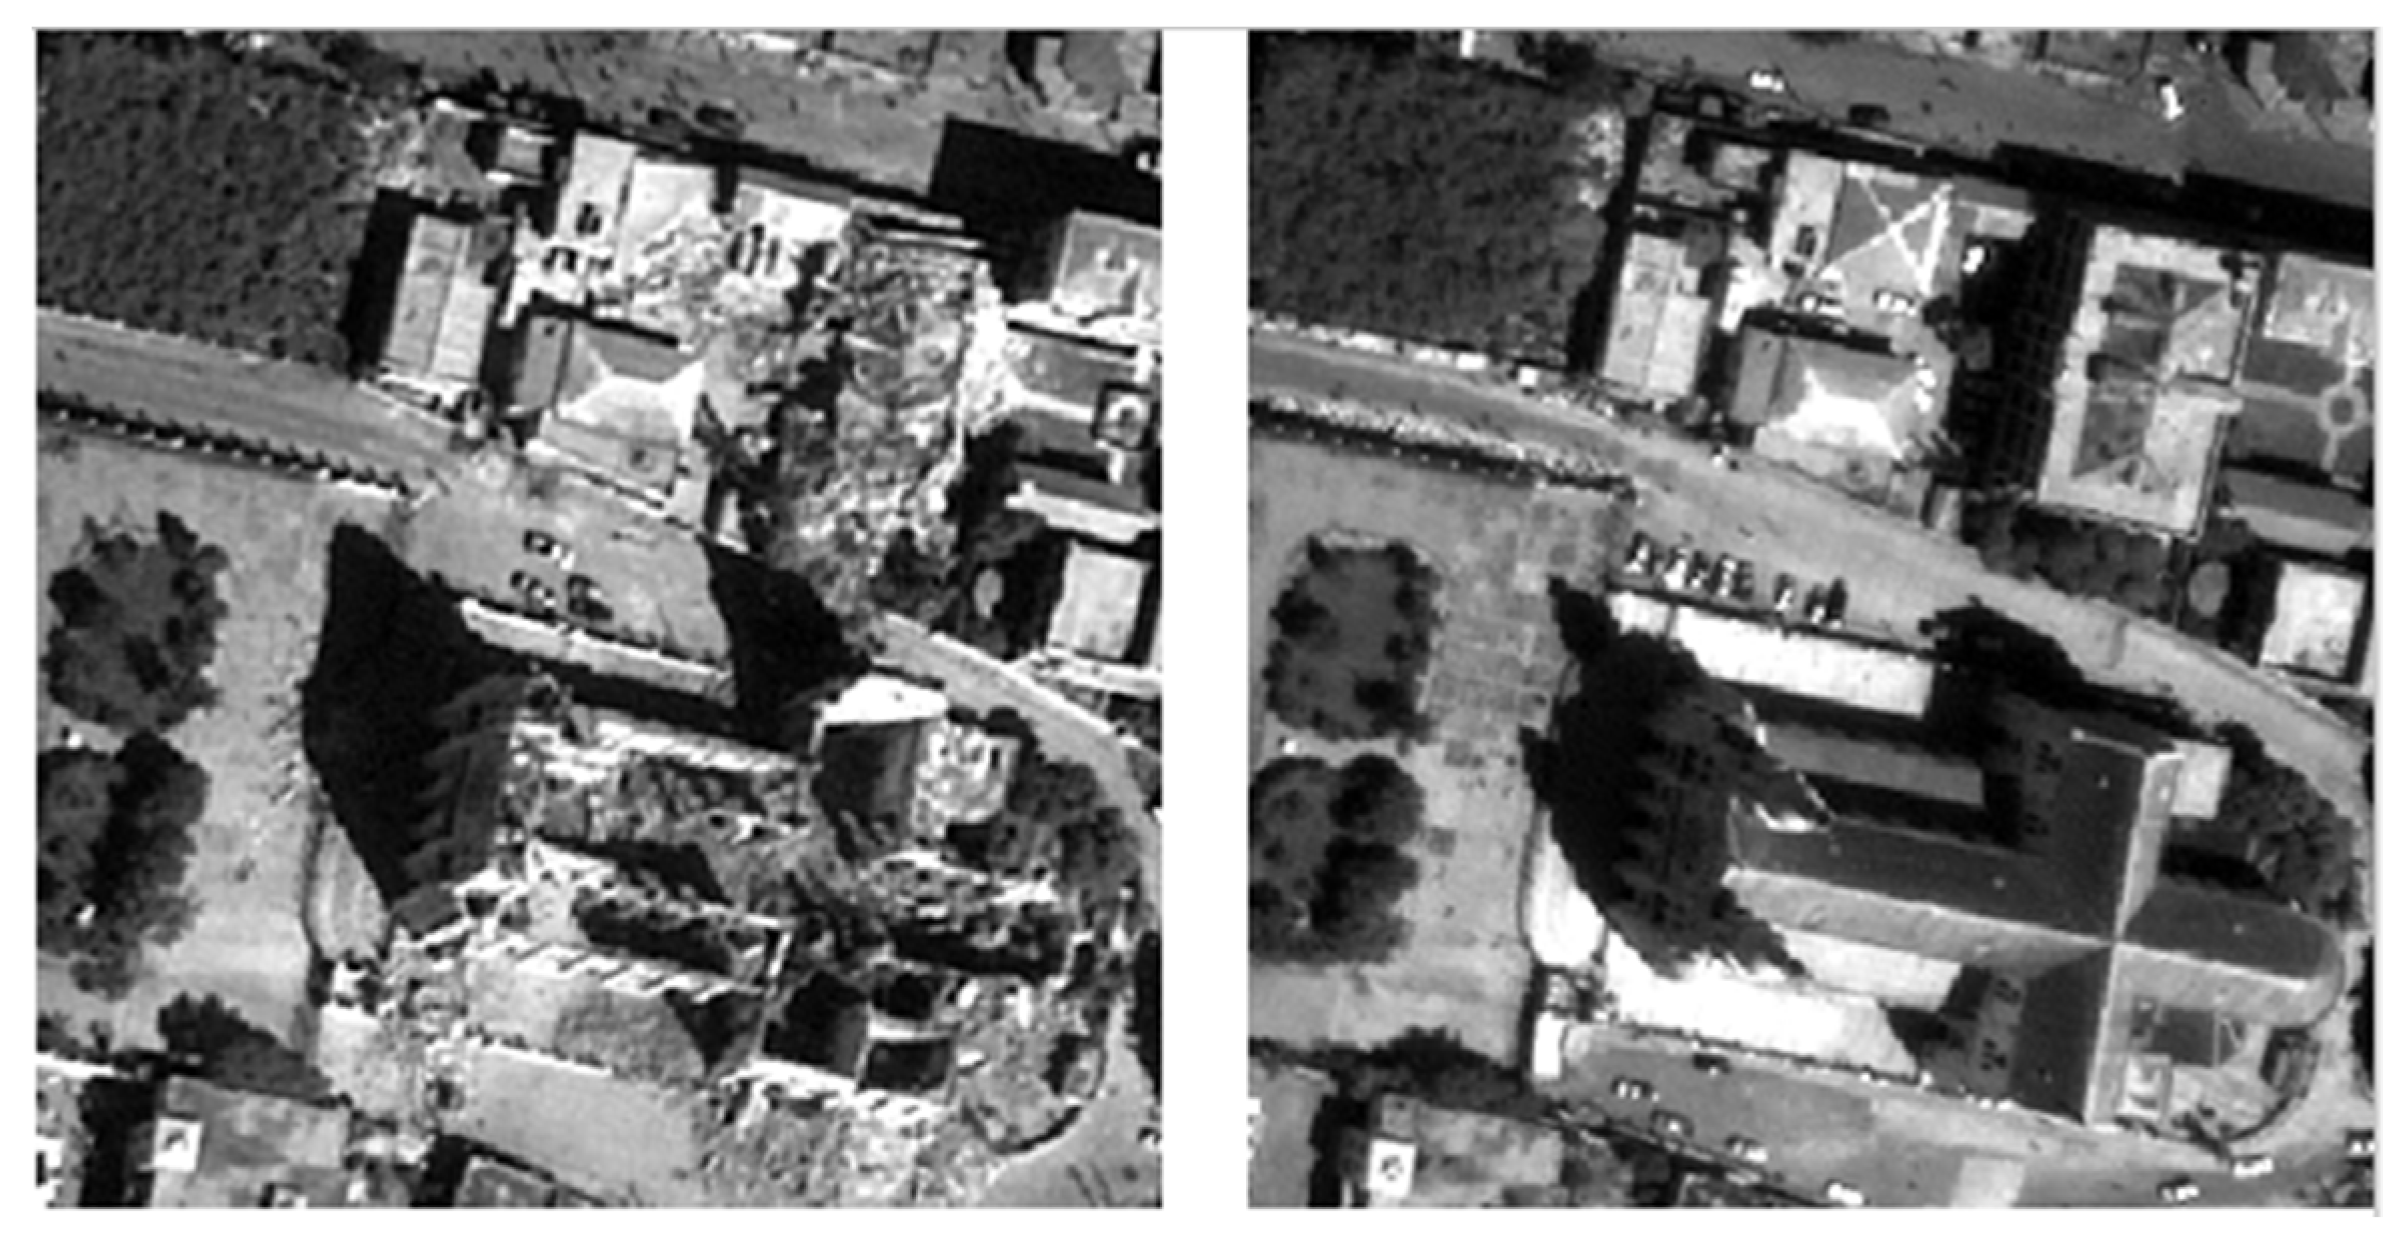
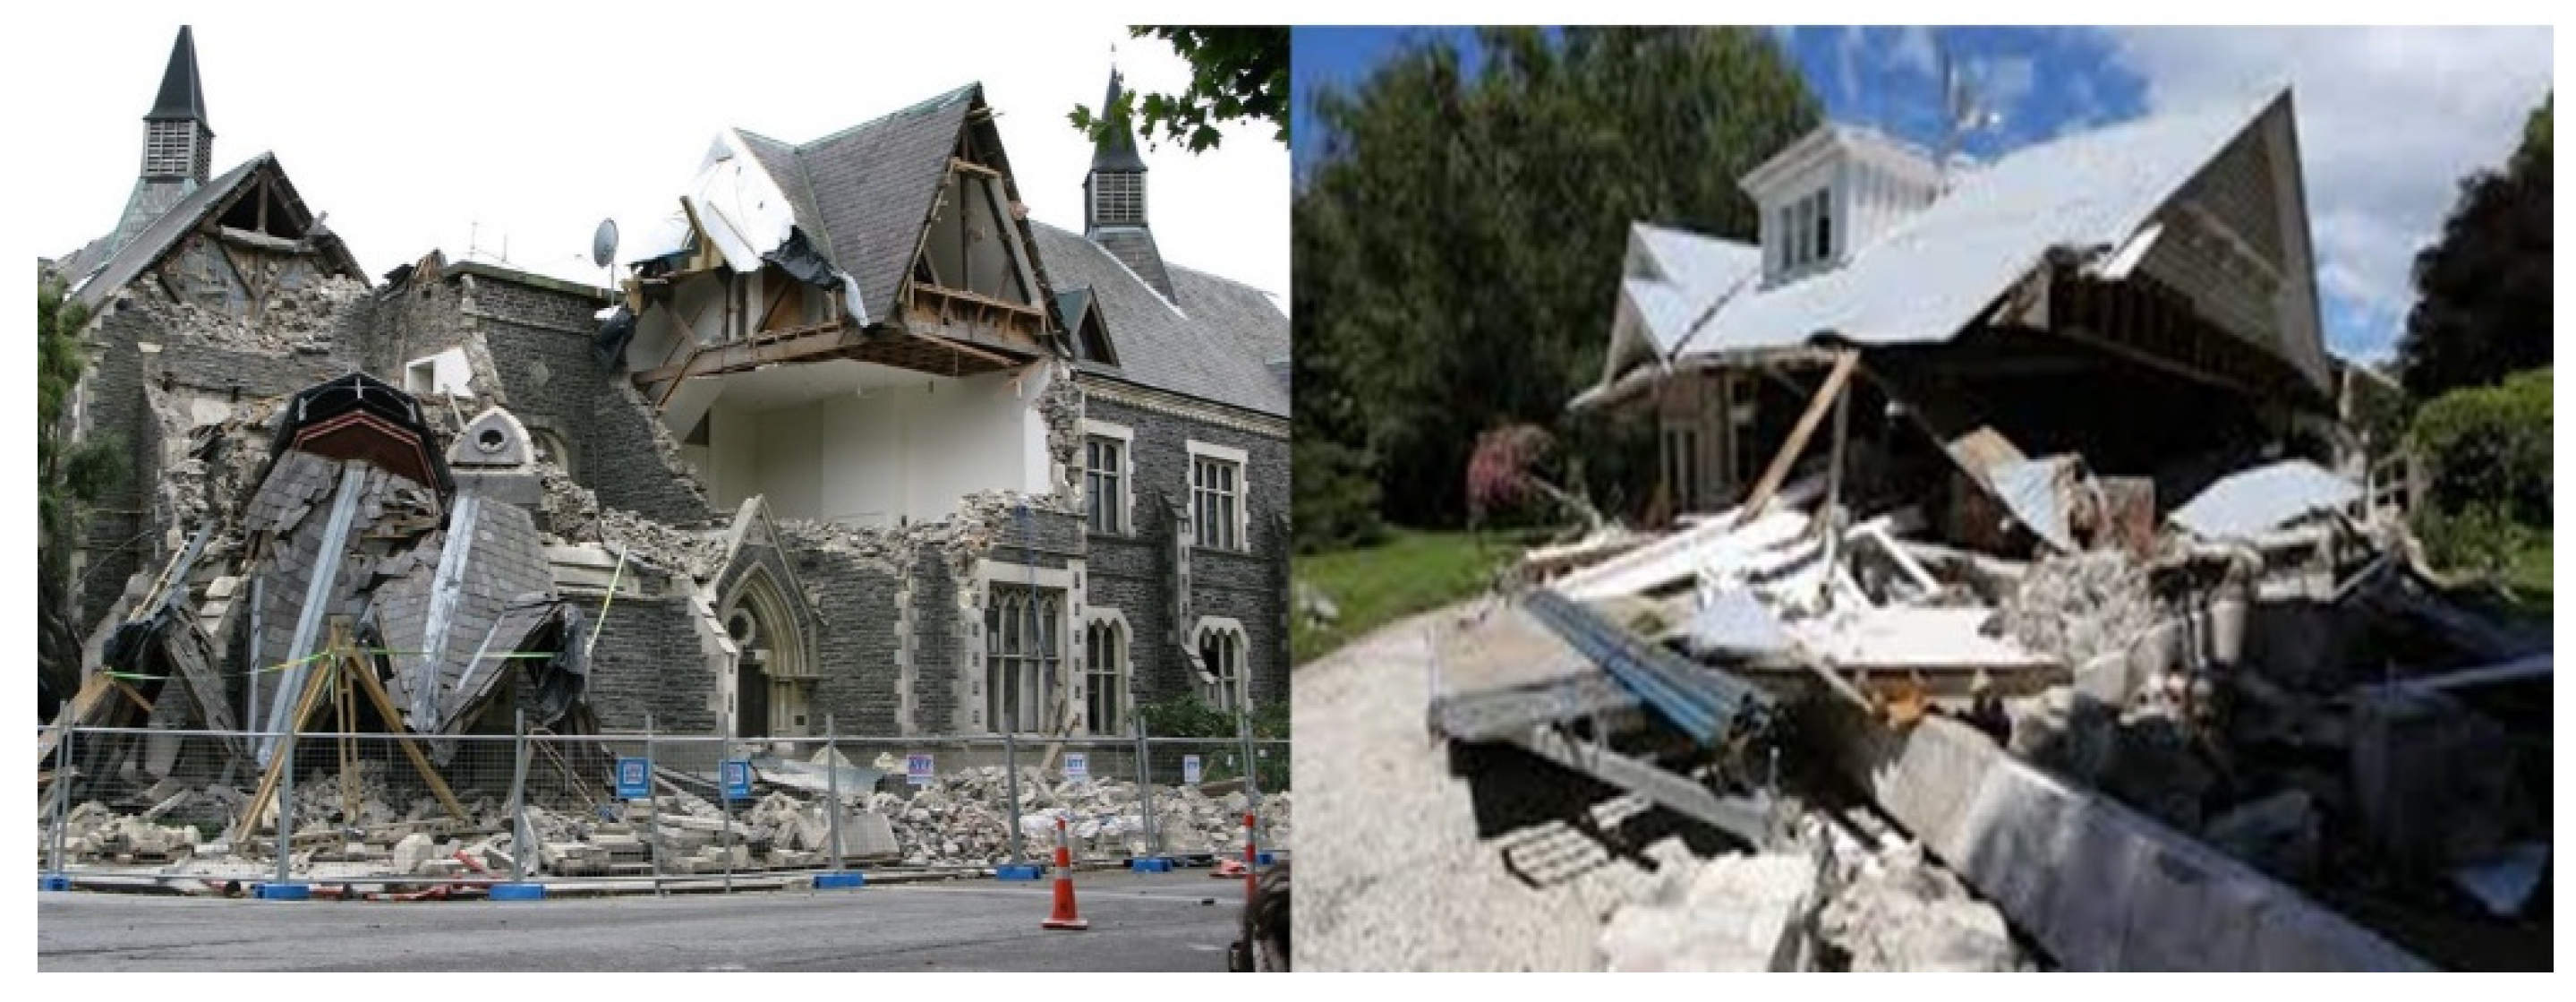
View of the area before and after the earthquake is shown in Figure 2.
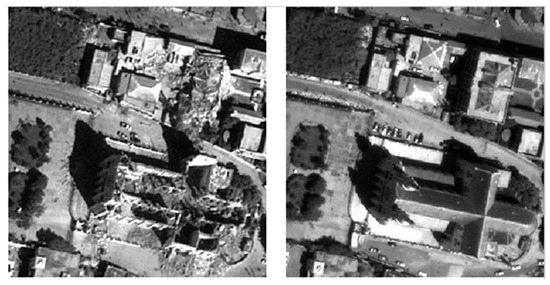
Figure 2.
The right image is before the earthquake, and the left image is after the earthquake.
2.2. Method
In this study, an approach based on deep learning algorithms and neural networks for monitoring the buildings destroyed by the earthquake is presented. The way that we are going to explain it is based on previous studies where the use of VHR optical data is emphasized. The solution proposed to lack of access to the data before the earthquake [21,22,23].
Deep learning is a neural network with a large number of hidden layers to extract many features from raw data. Data can be an image, pixel, signal, and so on. The different architecture of this kind exists today. The number of layers is greater (deeper), so the more non-linear characteristics are obtained, which is why we are interested in deep learning. Figure 3 shows the general view of the deep learning networks. Unlike deep learning, machine learning extracts features by itself, and they need to identify the characteristics and feature engineering [24,25,26].
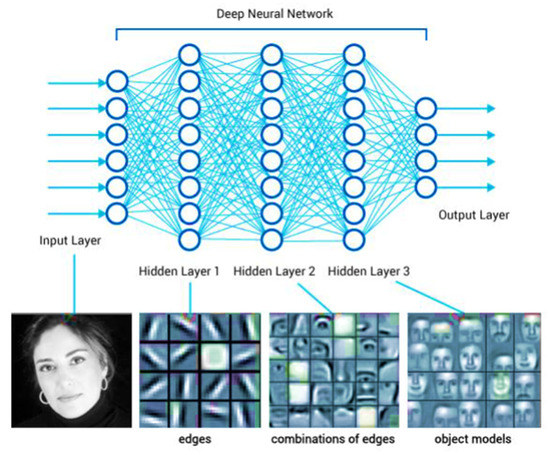
Figure 3.
Design of layers of the deep learning network.
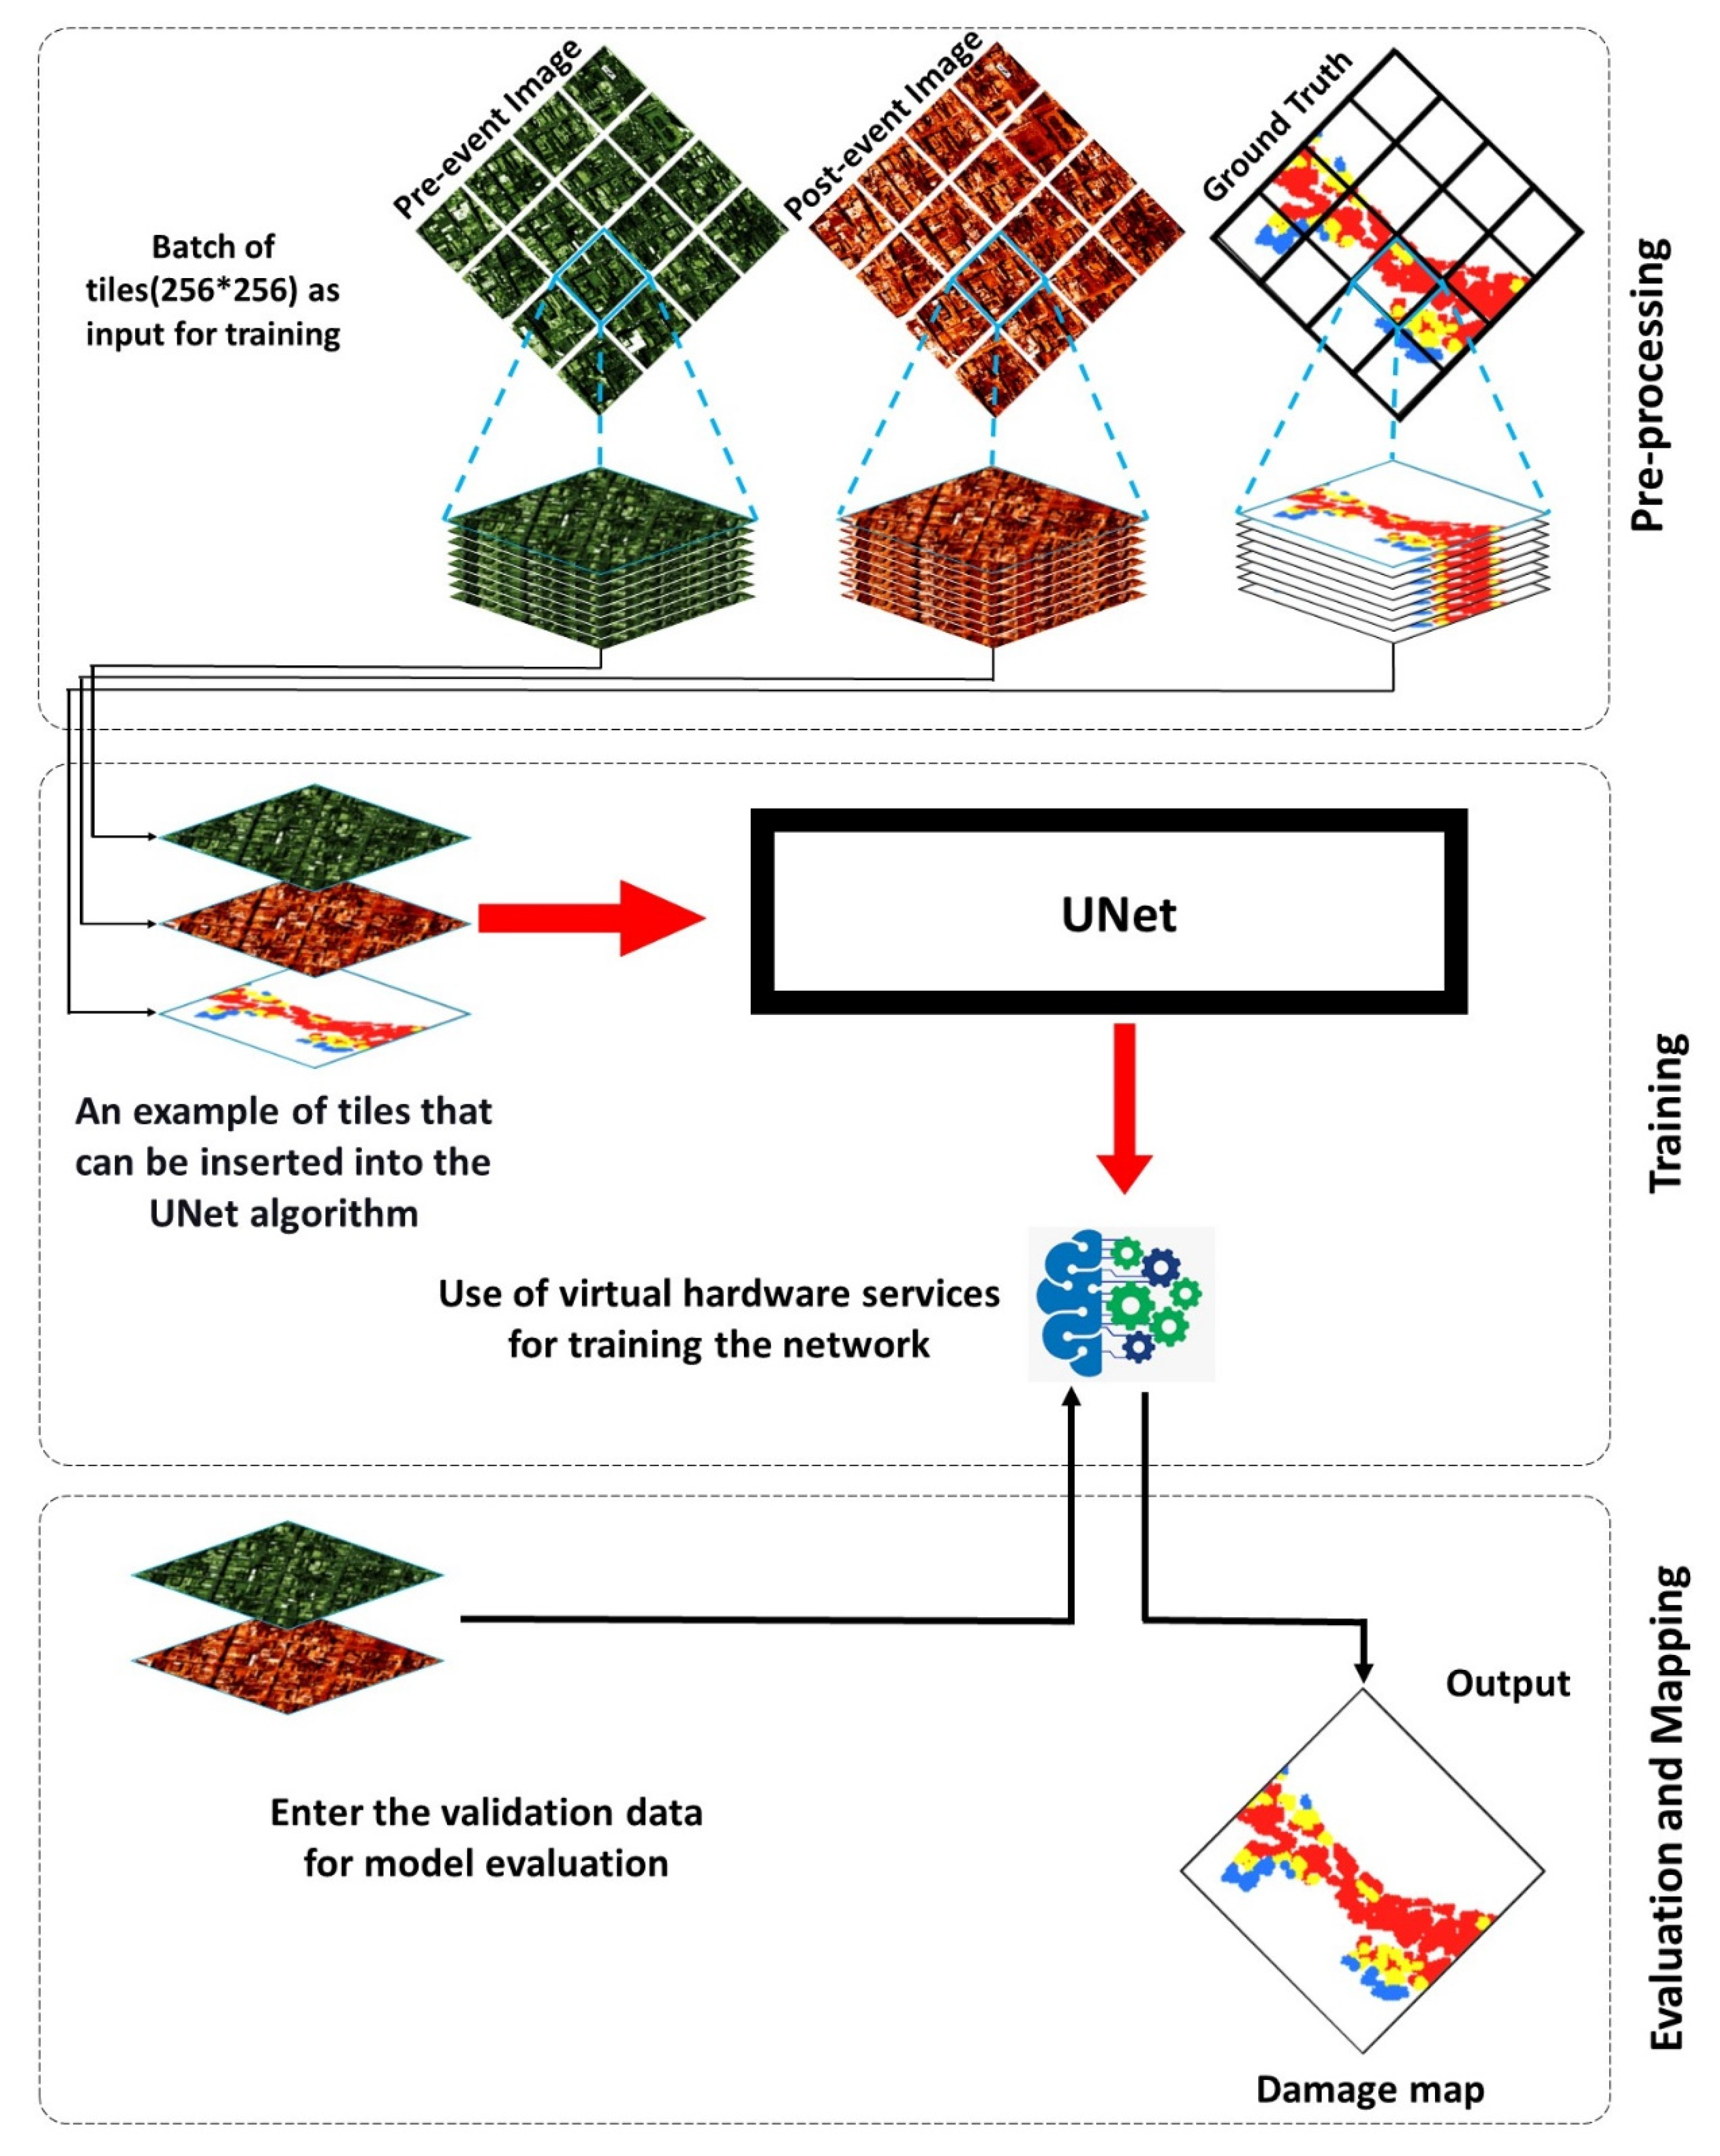
The UNet algorithm, due to high precision, high-speed processing, and learning, has no need for large data sets to learn and complex and expensive hardware. In recent years, the objects of the image and image processing has become popular in detection. The characteristics of this network enable us to overcome two major challenges that we mentioned in the introduction [27,28]. Figure 4, is shown an overview of the proposed method in this study.

Figure 4.
The framework proposed in this paper for monitoring the destruction of buildings in earthquake.
2.2.1. Pre-Processing
The images collected before and after the event were compiled into a large image. The co-registration procedure was implemented on the pre and post-event images. Bands of pre-post images pan sharped and stacked together [29]. At this stage, each pixel should be assigned a value of zero or one that reflects the state of the destruction of the building. Both images and ground-truth data of building damage were projected into the UTM/WGS84 geo-referenced coordinate system. Theoretically and ideally, the image tiles with the pixel size of an arbitrary 2n are suitably used as the input [30]. When selecting random patches to do the training, we try to choose the patches that more than half of the pixels within them labeled as undamaged or damaged.
2.2.2. Network Architecture and Training
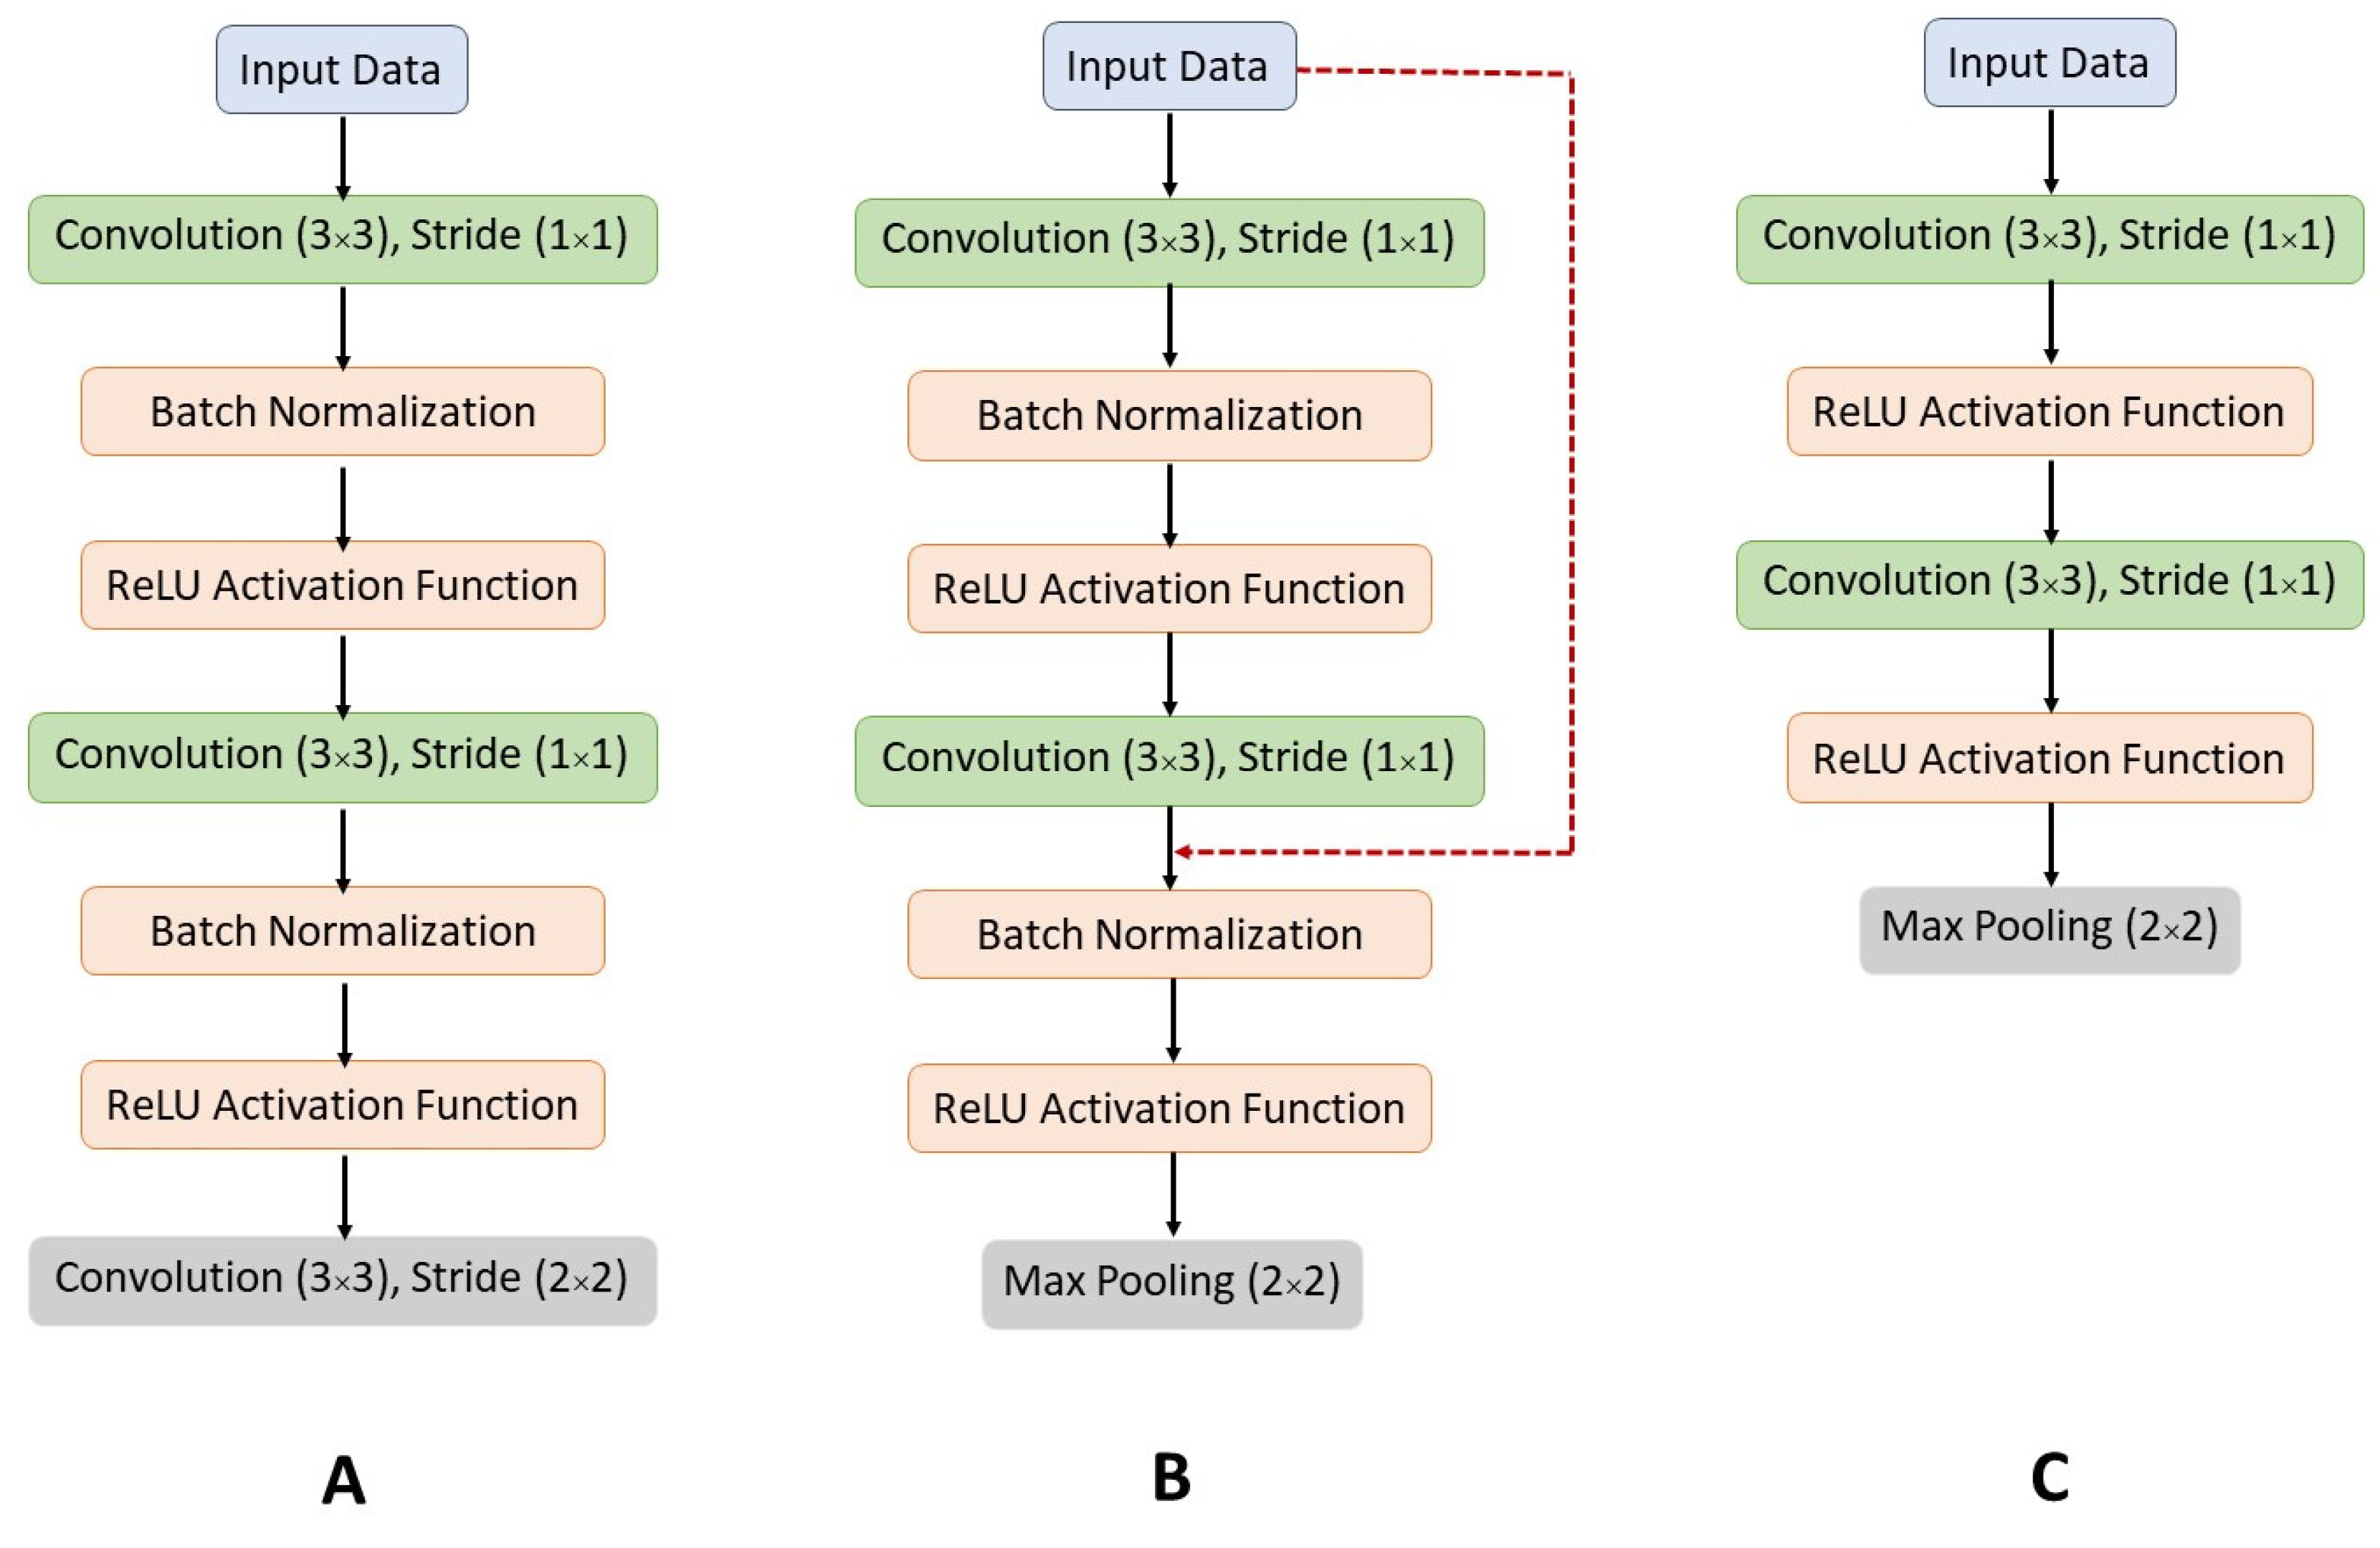
UNet originated from Ronneberger in 2015 [31]. The blocks of neural network units of UNet, UNet adopted in this study, and Deep Residual UNet that proposed by Zhang in 2018 are shown in Figure 5 [31,32,33].

Figure 5.
Blocks of neural network units. (a) Neural unit of UNet in this work. (b) Neural unit in Deep Residual UNet. (c) Neural unit in general UNet.
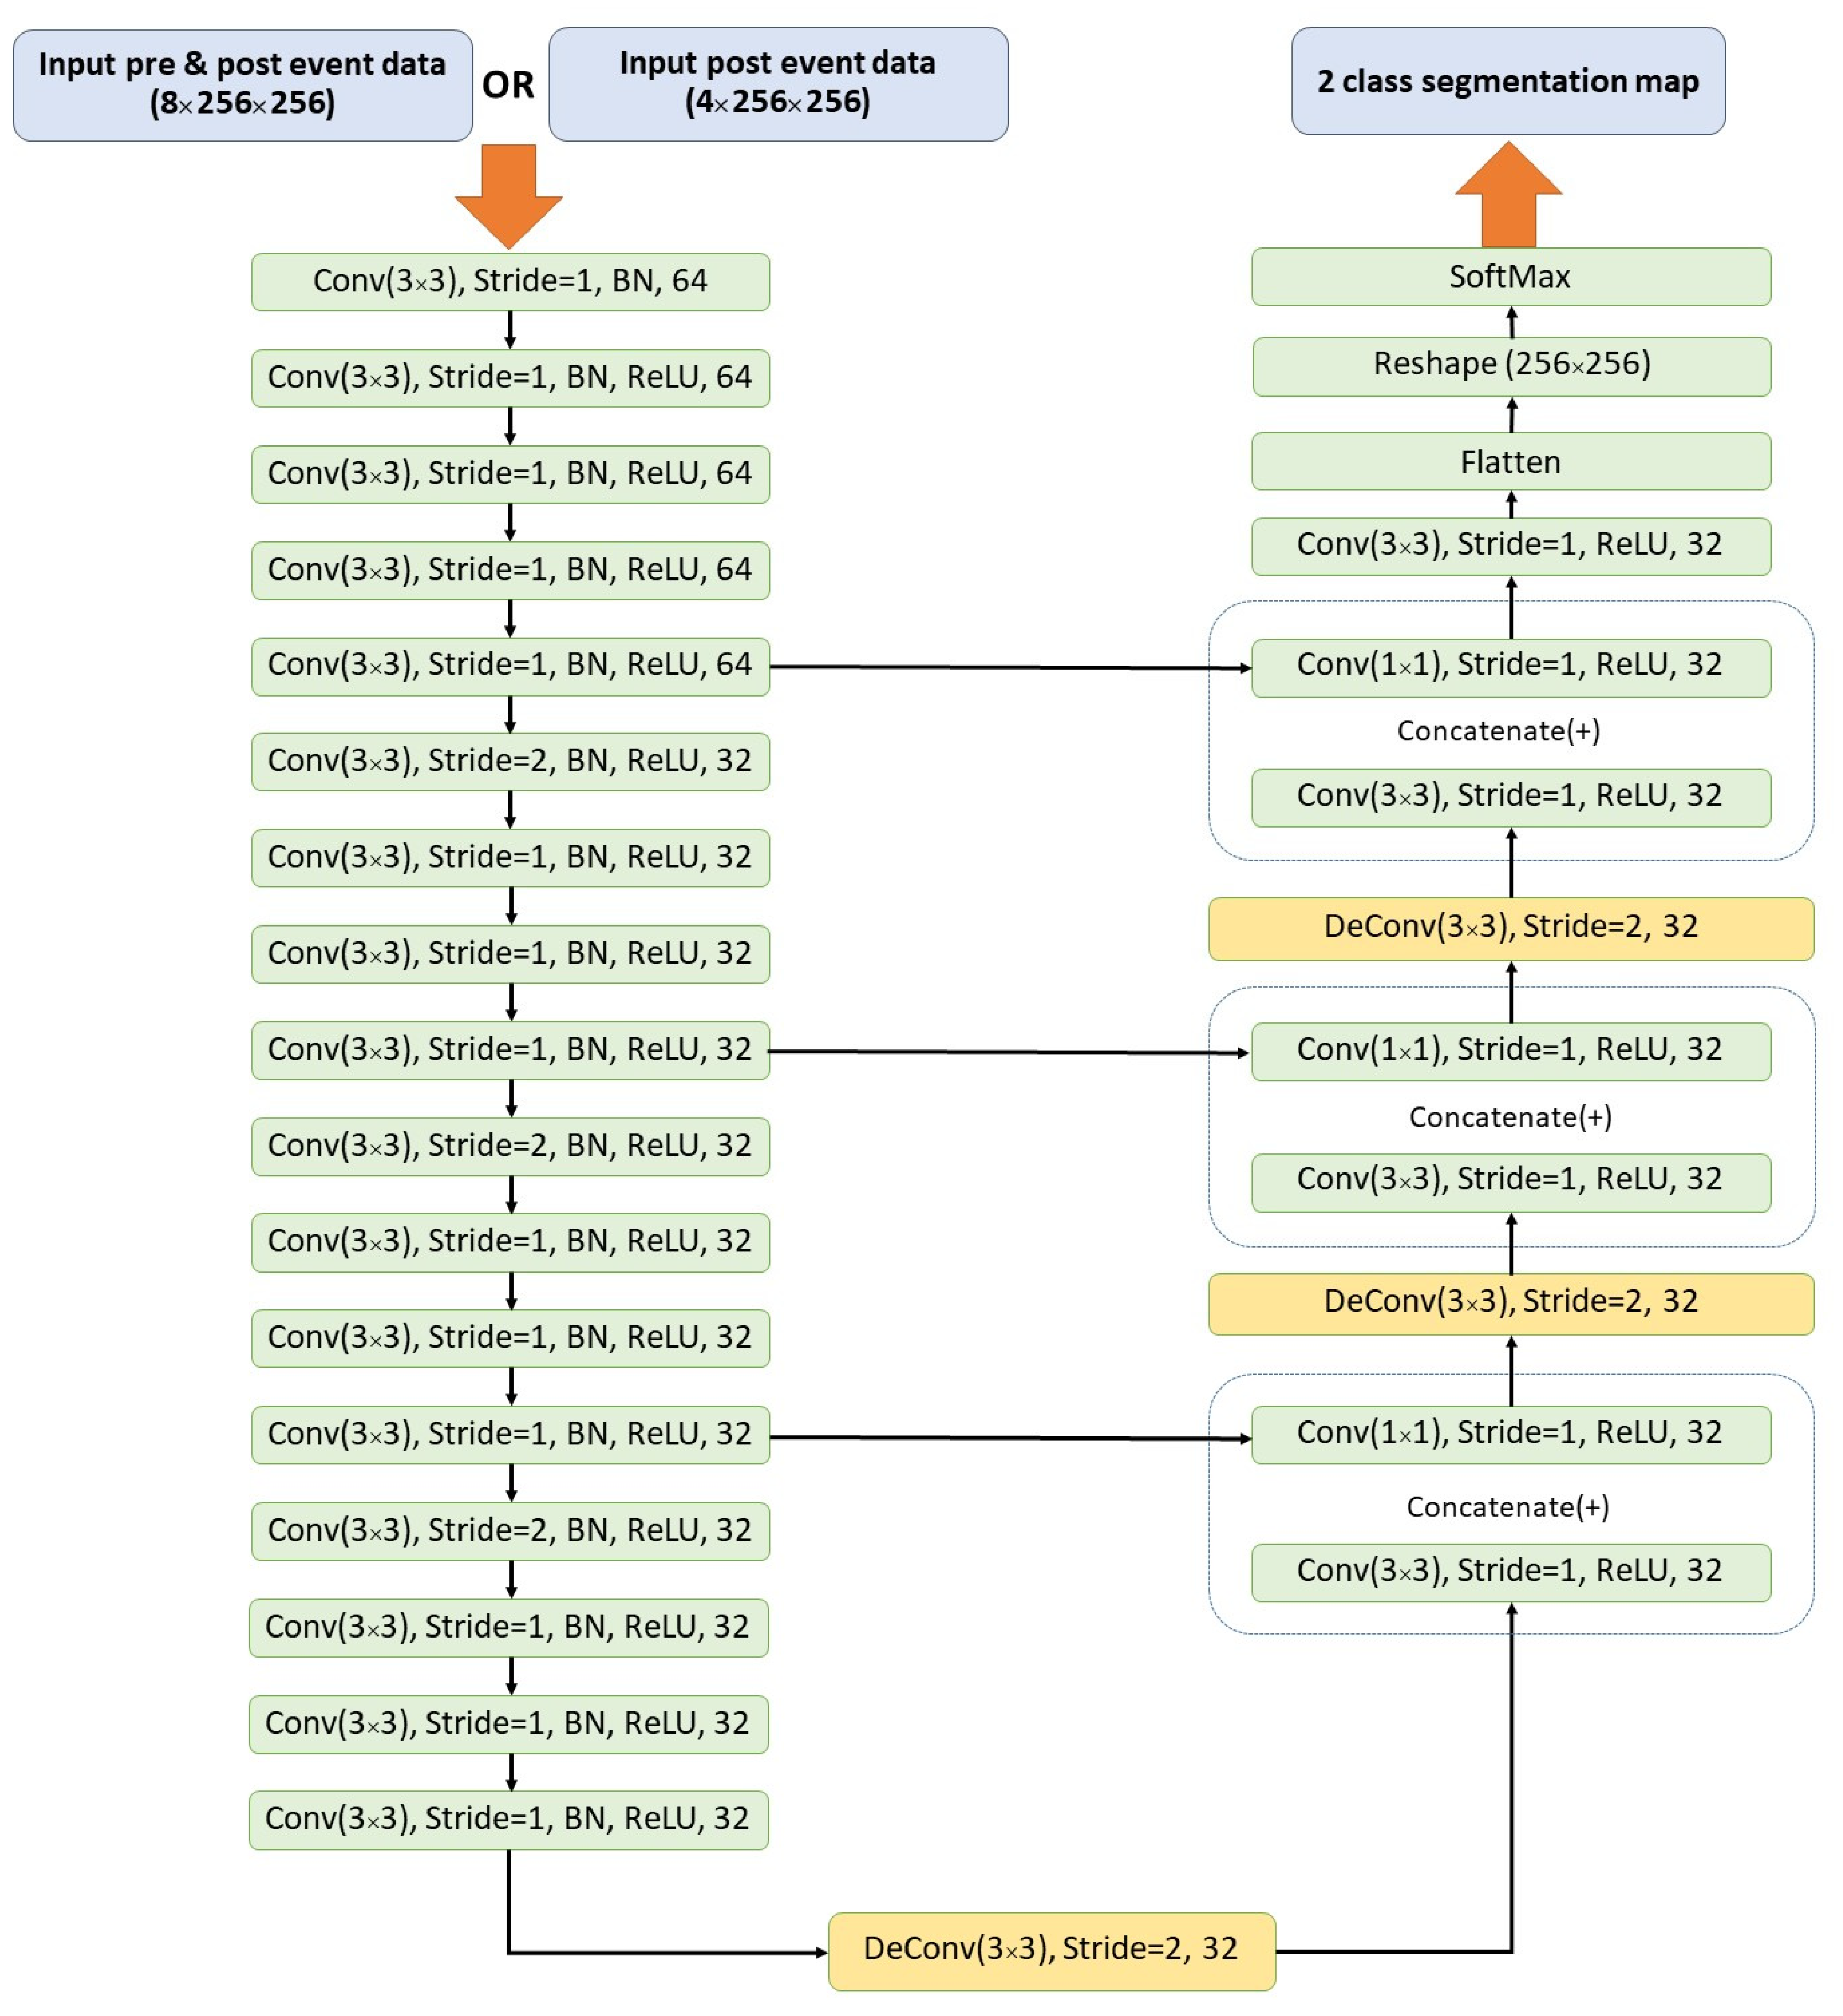
It has already been shown in many studies that normalizing input data on different architectures accelerates network convergence. The use of the Batch Normalization in deep learning algorithms makes sustainable education and training operations faster [34]. So Residual Unet network, as well as our proposed network of Batch Normalization, is used. We normalize the input layer by adjusting and scaling the activations. For instance, once we have features from 0 to 1 and a few from 1 to 1000, we should always normalize them to hurry up learning. If the input layer is taking advantage of it, why not do an equivalent thing also for the values within the hidden layers, that are changing all the time, and get 10 times or more improvement in the training speed [35,36]. The architecture of the UNet algorithm is shown in Figure 6.

Figure 6.
Architecture of the UNet in this study.
The max-pooling layer used in general U-net was replaced by a convolutional layer with a stride of two because the convolutional layer with increased stride outperforms the max-pooling with regards to several image recognition benchmarks as shown in Figure 5 [37].
To reduce the calculation time cost, we decreased the filter number to 50% of the first. This strategy was recommended in many studies because it was shown useful for remote-sensing recognition tasks [38].
We use a batch size of 25 and a patch size of 256 × 256 pixels for the UNet models. The models were trained for 50 epochs. We trained the network with a learning rate of 0.01 for all epochs. RMSProb is used for parameter optimization that is suitable for large datasets. The employed loss function is cross-entropy.
2.2.3. Development Environment
In this work, we used the Deep Learning Studio (DLS) and Peltarion as the deep learning framework [39,40]. DLS is DeepCognition’s web-based software, that designs networks and trains deep learning algorithms for Windows and Linux. DLS supports deep learning networks for image recognition tasks. All experimentation and modeling environment tasks are implemented in Deep Learning Studio Virtual Machine (DLSVM).
The virtual machine is configured with 32 GB of RAM, a 2.30 GHz 2-core Intel(R) Xeon(R) CPU, and a 1.59 GHz NVIDIA Tesla T4 GPU 16GB DDR6 with 50 GB memory [39,40].
The data are preprocessed and analyzed in Python using the GDAL, NumPy, pandas, OpenCV, Scipy, Scikit-image, Scikit-learn, Pillow, MKL, and Tifffile libraries. The deep learning algorithms are achieved in the Deep Learning Studio (DLS) which is a robust GUI, partially free, and easy-to-use framework. It can be used in the cloud or on our infrastructure.
3. Results
In this study, we completed 50 epochs for both the UNet model and deep residual UNet to get the trained building damage recognition model [31,32]. The relation between the cross-entropy loss and the iteration of epochs is shown in Figure 5. Trend graphs in Figure 7 show that our proposed method considerably and noticeably improves results. Both networks till epoch 15 are close to each other, with not much difference between them.
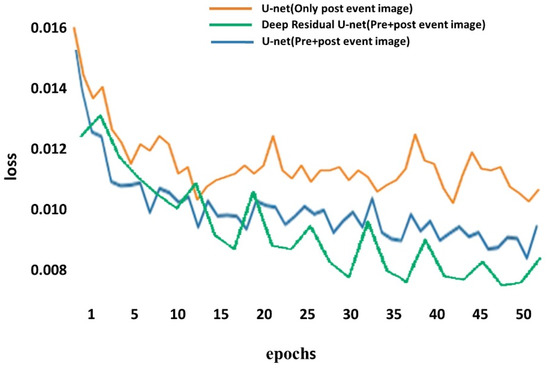
Figure 7.
Relation between the loss and the number of epochs during the training.
Here, the UNet has a much lower omission error (28.1% undamaged, and 39.3% damaged) than the deep residual UNet (37.7% undamaged, and 47.2% damaged). The overall accuracy of our proposed approach 69.71 and the overall accuracy of deep residual UNet 62.5%, which is shown the method is proposed in this paper proves the performance of the network. The Kappa value for UNet in this paper is 37.7%.
Some buildings were classified incorrectly, because of the orthographic projection characteristic of the optical remote sensing measurement, the sensor can only record the information on top of each object, and the damage situation under the roof is not reflected. An example is shown in Figure 8 [41,42].

Figure 8.
An example of collapsed buildings in the earthquake which were incorrectly classified. The image does not relate to the Haiti earthquake.
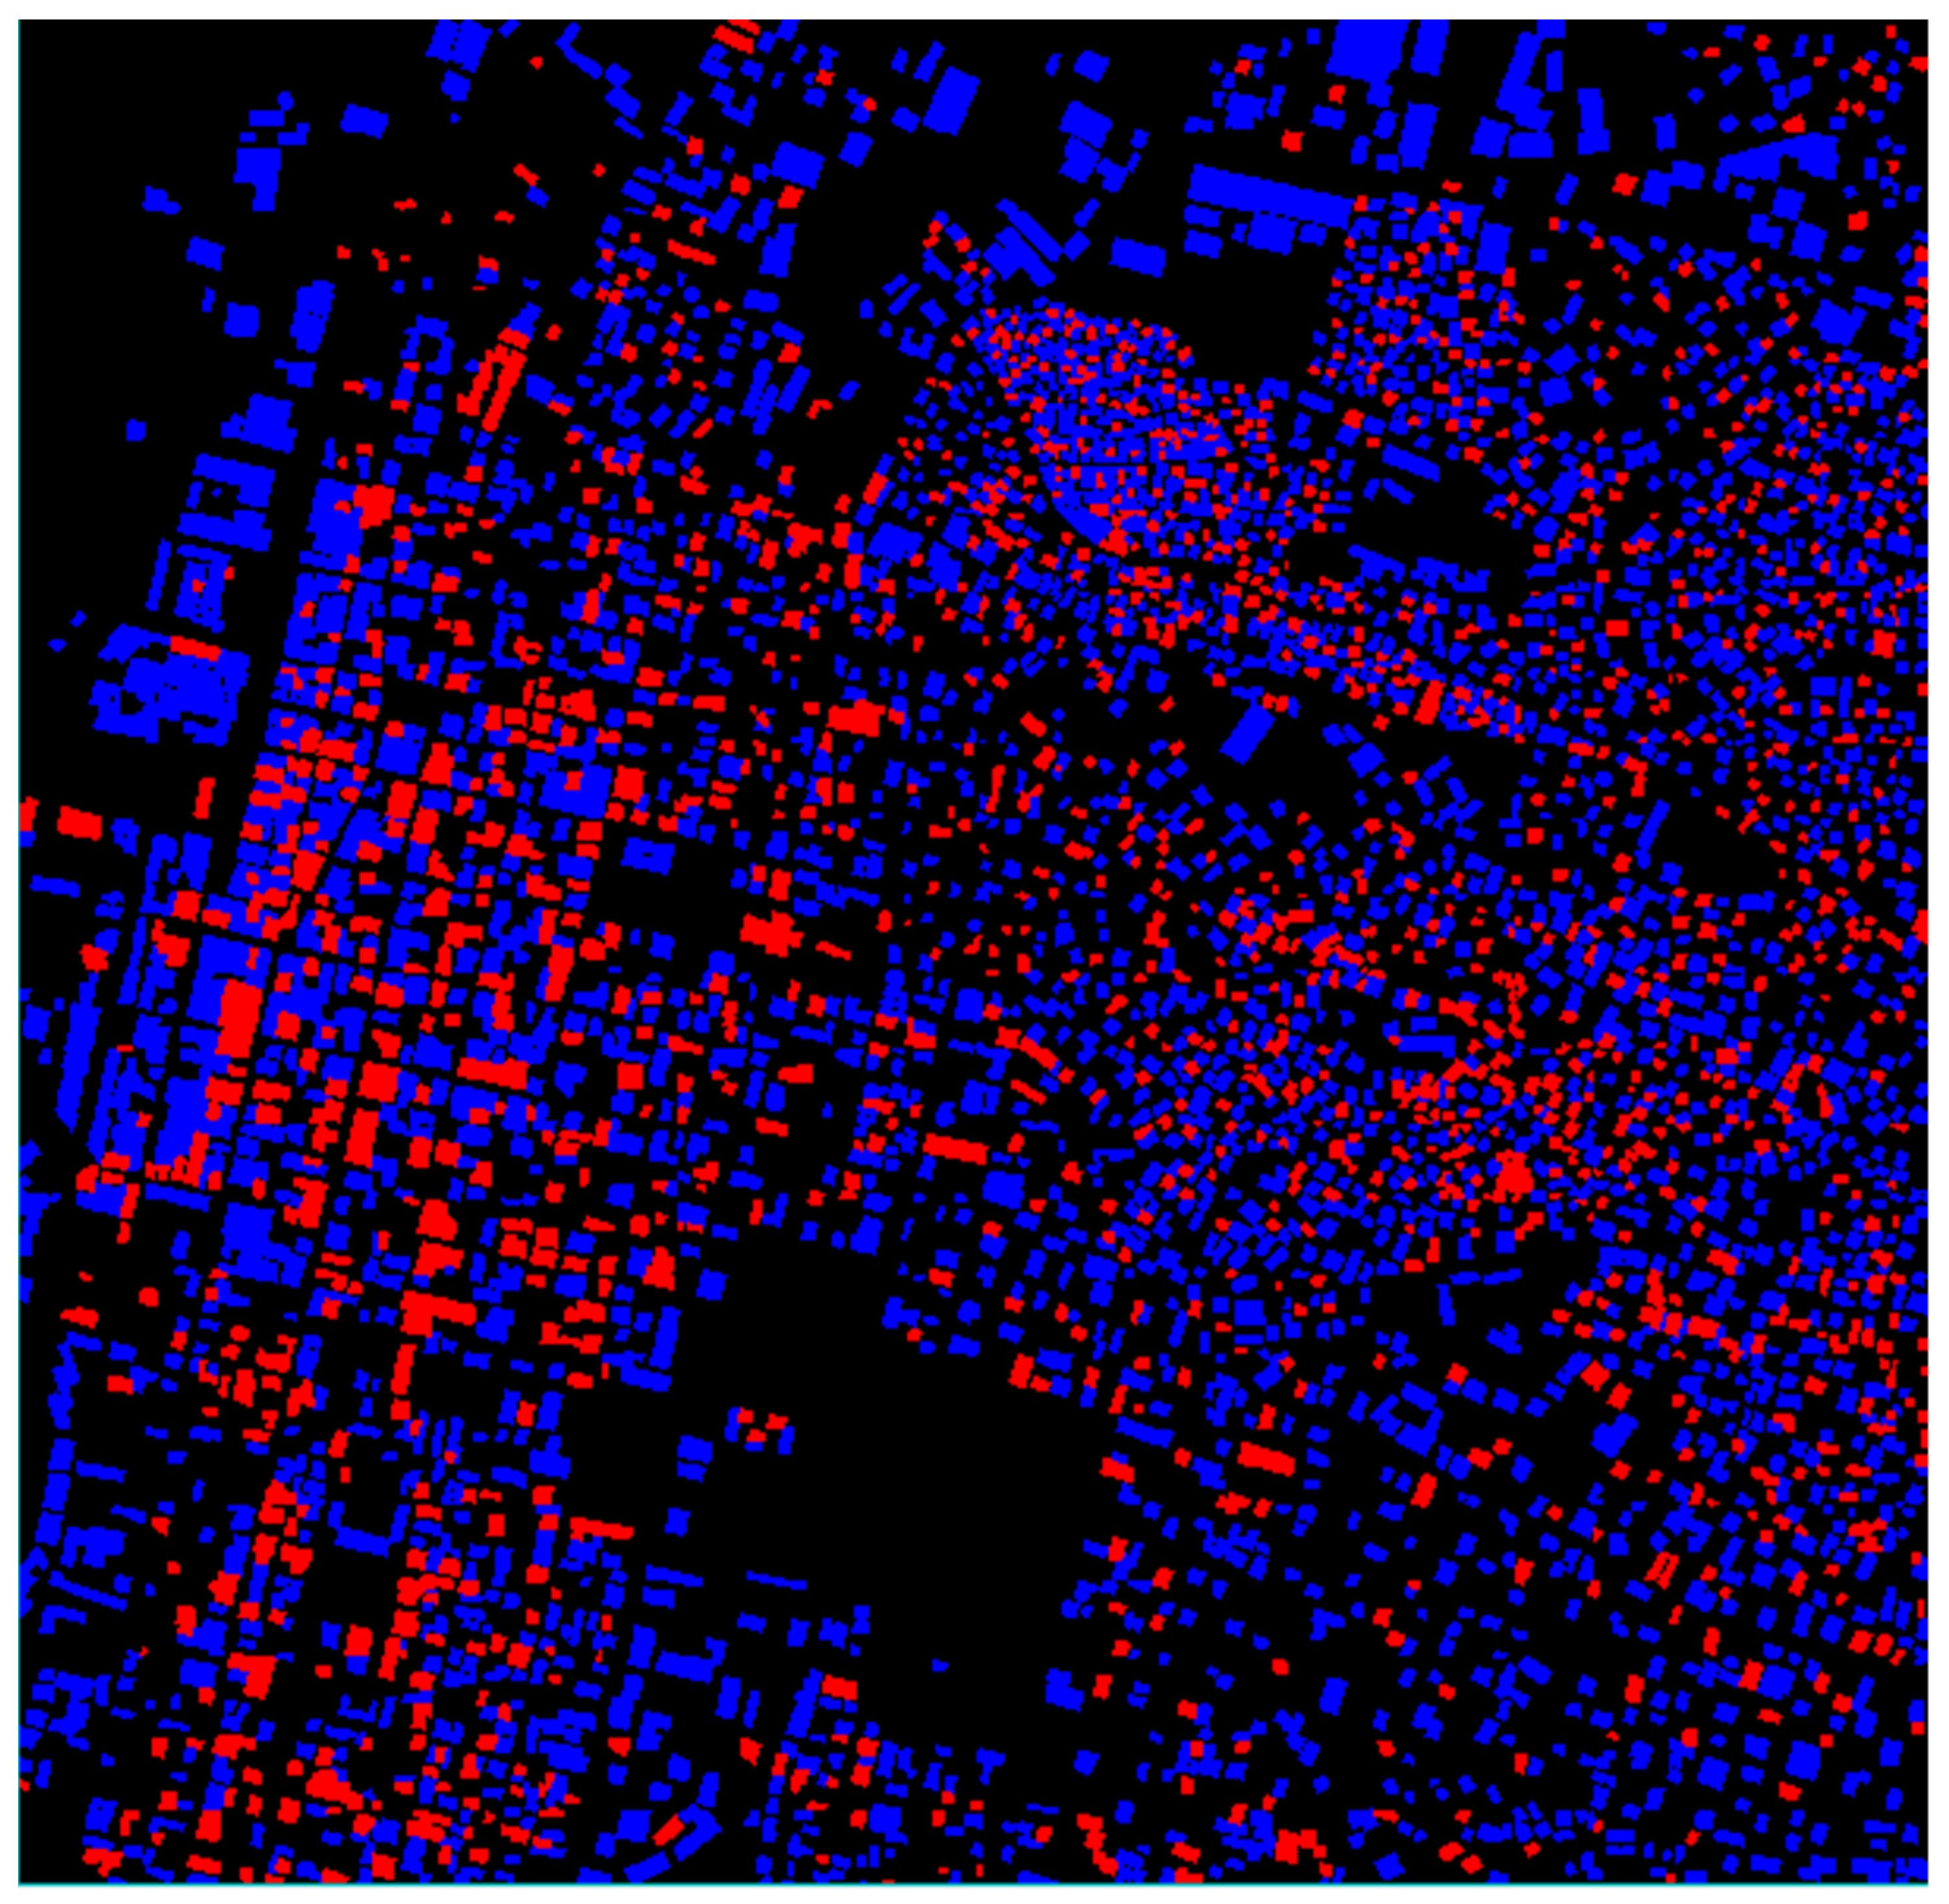
The final result of the buildings damage map shown is in Figure 9. Although the number of buildings damaged and safe is almost equal, about there are three times the pixels dedicated to undamaged buildings more than buildings have been destroyed. The black area relates to parks, slums, and tents survivors as well as other items that are not within the building kind.
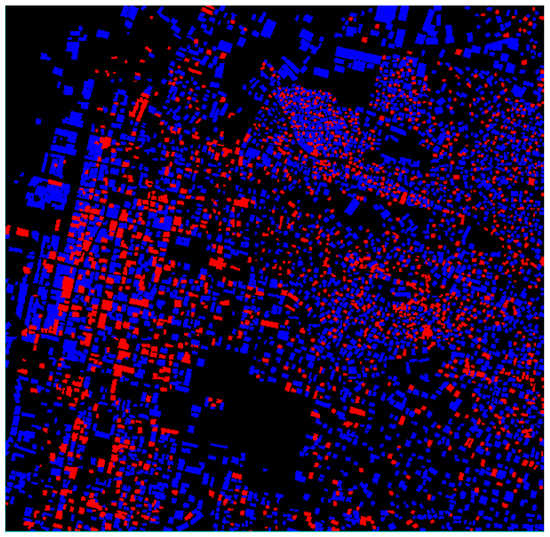
Figure 9.
Final damage Map. The blue color represents safe buildings, and the red color represents damaged buildings.
From the availability of data, to achieve the final map takes less than 7 h and that is much faster than the field inspection and this is the advantage of this approach.
4. Discussion
This model was demonstrated for mapping the earthquake damage, but the framework also works for other hazards such as floods, missile attacks, hurricanes, and many natural and unnatural disasters. To generalize this framework to other tragic event types, the VHR satellite image and corresponding reference data for different disaster types should be used to train the new model. The proposed model is a supervised classification model. It can be simply implemented to react to future hazards after these models are well developed.
The role of building footprint data is to create training data labels. It should be considered that the label of land covers the jungle, water, etc. The non-built-up regions are also available, and we can train a new model that does not depend on the building footprint data. From this aspect, the proposed framework does not depend on building footprint data and is a generalized framework.
5. Conclusions
Dominance image processing and artificial intelligence in the field of images of remote sensing, especially with the development of algorithms for deep learning, continues to grow. However, unlike other issues that improved very significantly, in remote sensing a little performance increased, so still, we need to research and further studies of the potential of the computer world in the field of geographical sciences and image processing.
Author Contributions
M.M. conceived and designed the experiments; M.M. performed the experiments; M.M. and R.S.-H. analyzed the data; R.S.-H. contributed materials and analysis tools; M.M and R.S.-H. wrote the paper. All authors have read and agreed to the published version of the manuscript.
Funding
This research received no external funding.
Institutional Review Board Statement
Not applicable.
Informed Consent Statement
Not applicable.
Data Availability Statement
Data sharing not applicable.
Acknowledgments
We would like to thank Deep Cognition for providing the Deep Learning Studio (DLS) service and Peltarion that is a cloud-based operational AI platform that allows you to build and deploy your deep learning models. The service offers an end-to-end platform that lets you do everything from pre-processing your data to building models and putting them into production. All of this runs in the cloud and developers get access to a graphical user interface for building and testing their models. We would also like to show our great gratitude to the International Institute UNITAR / UNOSAT for providing the reference data.
Conflicts of Interest
The authors declare no conflict of interest.
Abbreviations
The following abbreviations are used in this manuscript:
| VHR | Very High Resolution |
| SAR | Synthetic Aperture Radar |
| UAV | Unmanned Aerial Vehicle |
| Lidar | Light Detection and Ranging |
| CNN | Convolutional Neural Network |
| UNITAR | United Nations Institute for Training and Research |
| DLS | Deep Learning Studio |
| GUI | Graphical User Interface |
| DLSVM | Deep Learning Studio Virtual Machine |
References
- Anniballe, R.; Noto, F.; Scalia, T.; Bignami, C.; Stramondo, S.; Chini, M.; Pierdicca, N. Earthquake damage mapping: An overall assessment of ground surveys and VHR image change detection after L’Aquila 2009 earthquake. Remote Sens. Environ. 2018, 210, 166–178. [Google Scholar] [CrossRef]
- Bialas, J.; Oommen, T.; Rebbapragada, U.; Levin, E. Object-based classification of earthquake damage from high-resolution optical imagery using machine learning. J. Appl. Remote Sens. 2016, 10, 036025. [Google Scholar] [CrossRef]
- Dong, L.; Shan, J. A comprehensive review of earthquake-induced building damage detection with remote sensing techniques. ISPRS J. Photogramm. Remote Sens. 2013, 84, 85–99. [Google Scholar] [CrossRef]
- Cooner, A.J.; Shao, Y.; Campbell, J.B. Detection of Urban Damage Using Remote Sensing and Machine Learning Algorithms: Revisiting the 2010 Haiti Earthquake. Remote Sens. 2016, 8. [Google Scholar] [CrossRef]
- Gokon, H.; Koshimura, S. Mapping of building damage of the 2011 Tohoku earthquake tsunami in Miyagi Prefecture. Coast. Eng. J. 2012, 54, 1250006. [Google Scholar] [CrossRef]
- Menderes, A.; Erener, A.; Sarp, G. Automatic Detection of Damaged Buildings after Earthquake Hazard by Using Remote Sensing and Information Technologies. Procedia Earth Planet. Sci. 2015, 15, 257–262. [Google Scholar] [CrossRef]
- Novikov, G.; Trekin, A.; Potapov, G.; Ignatiev, V.; Burnaev, E. Satellite imagery analysis for operational damage assessment in emergency situations. In International Conference on Business Information Systems; Springer: Cham, Vietnam, 2018; pp. 347–358. [Google Scholar]
- Taskin Kaya, G.; Musaoglu, N.; Ersoy, O.K. Damage assessment of 2010 Haiti earthquake with post-earthquake satellite image by support vector selection and adaptation. Photogramm. Eng. Remote Sens. 2011, 77, 1025–1035. [Google Scholar] [CrossRef]
- Tong, X.; Hong, Z.; Liu, S.; Zhang, X.; Xie, H.; Li, Z.; Yang, S.; Wang, W.; Bao, F. Building-damage detection using pre- and post-seismic high-resolution satellite stereo imagery: A case study of the May 2008 Wenchuan earthquake. ISPRS J. Photogramm. Remote Sens. 2012, 68, 13–27. [Google Scholar] [CrossRef]
- Voigt, S.; Schneiderhan, T.; Twele, A.; Gähler, M.; Stein, E.; Mehl, H. Rapid damage assessment and situation mapping: Learning from the 2010 Haiti earthquake. Photogramm. Eng. Remote Sens. 2011, 77, 923–931. [Google Scholar] [CrossRef]
- Duarte, D.; Nex, F.; Kerle, N.; Vosselman, G. Satellite Image Classification of building damages using airborne and satellite image samples in a deep learning approach. ISPRS Ann. Photogramm. Remote Sens. Spat. Inf. Sci. 2018, 4. [Google Scholar] [CrossRef]
- Huang, B.; Zhao, B.; Song, Y. Urban land-use mapping using a deep convolutional neural network with high spatial resolution multispectral remote sensing imagery. Remote Sens. Environ. 2018, 214, 73–86. [Google Scholar] [CrossRef]
- Huang, F.; Yu, Y.; Feng, T. Automatic building change image quality assessment in high resolution remote sensing based on deep learning. J. Vis. Commun. Image Represent. 2019, 63, 102585. [Google Scholar] [CrossRef]
- Bai, Y.; Mas, E.; Koshimura, S. Towards operational satellite-based damage-mapping using u-net convolutional network: A case study of 2011 tohoku earthquake-tsunami. Remote Sens. 2018, 10, 1626. [Google Scholar] [CrossRef]
- Cao, Q.D.; Choe, Y. Building damage annotation on post-hurricane satellite imagery based on convolutional neural networks. Nat. Hazards 2020, 103, 3357–3376. [Google Scholar] [CrossRef]
- Wang, X.; Li, P. Extraction of earthquake-induced collapsed buildings using very high-resolution imagery and airborne lidar data. Int. J. Remote Sens. 2015, 36, 2163–2183. [Google Scholar] [CrossRef]
- Cao, K.; Zhang, X. An Improved Res-UNet Model for Tree Species Classification Using Airborne High-Resolution Images. Remote Sens. 2020, 12, 1128. [Google Scholar] [CrossRef]
- Ji, M.; Liu, L.; Buchroithner, M. Identifying collapsed buildings using post-earthquake satellite imagery and convolutional neural networks: A case study of the 2010 Haiti earthquake. Remote Sens. 2018, 10, 1689. [Google Scholar] [CrossRef]
- UNITAR/UNOSAT.; EC Joint Research Centre; World Bank. Haiti Earthquake 2010: Remote Sensing Damage Assessment. Available online: https://unitar.org/maps/countries/44?page=0 (accessed on 17 August 2019).
- Berman, L. Haiti Earthquake Data (VECTORS), 1st ed.; Harvard Dataverse, 2015. [Google Scholar] [CrossRef]
- Liu, D.; Han, L.; Han, X. High spatial resolution remote sensing image classification based on deep learning. Acta Optica Sinica 2016, 36, 0428001. [Google Scholar]
- Sameen, M.I.; Pradhan, B.; Aziz, O.S. Classification of very high resolution aerial photos using spectral-spatial convolutional neural networks. J. Sens. 2018, 2018, 7195432. [Google Scholar] [CrossRef]
- Wozniak, M. Hybrid. Classifiers: Methods of Data, Knowledge, and Classifier Combination; Springer: Berlin/Heidelberg, Germany, 2013; Volume 519. [Google Scholar]
- Kemker, R.; Salvaggio, C.; Kanan, C. Algorithms for semantic segmentation of multispectral remote sensing imagery using deep learning. ISPRS J. Photogramm. Remote Sens. 2018, 145, 60–77. [Google Scholar] [CrossRef]
- Han, Y.; Wei, C.; Zhou, R.; Hong, Z.; Zhang, Y.; Yang, S. Combining 3D-CNN and Squeeze-and-Excitation Networks for Remote Sensing Sea Ice Image Classification. Math. Probl. Eng. 2020, 2020, 8065396. [Google Scholar] [CrossRef]
- Ferreira, A.; Giraldi, G. Convolutional Neural Network approaches to granite tiles classification. Expert Syst. Appl. 2017, 84, 1–11. [Google Scholar] [CrossRef]
- Garg, L.; Shukla, P.; Singh, S.; Bajpai, V.; Yadav, U. Land Use Land Cover Classification from Satellite Imagery using mUnet: A Modified Unet Architecture. In Proceedings of the 14th International Joint Conference on Computer Vision, Imaging and Computer Graphics Theory and Applications—Volume 4: VISAPP, Prague, Czech Republic; 2019; pp. 359–365. [Google Scholar]
- Chen, G.; Li, C.; Wei, W.; Jing, W.; Woźniak, M.; Blažauskas, T.; Damaševičius, R. Fully convolutional neural network with augmented atrous spatial pyramid pool and fully connected fusion path for high resolution remote sensing image segmentation. Appl. Sci. 2019, 9, 1816. [Google Scholar] [CrossRef]
- Li, E.; Xia, J.; Du, P.; Lin, C.; Samat, A. Integrating multilayer features of convolutional neural networks for remote sensing scene classification. IEEE Trans. Geosci. Remote Sens. 2017, 55, 5653–5665. [Google Scholar] [CrossRef]
- Han, J.; Zhang, D.; Cheng, G.; Guo, L.; Ren, J. Object detection in optical remote sensing images based on weakly supervised learning and high-level feature learning. IEEE Trans. Geosci. Remote Sens. 2014, 53, 3325–3337. [Google Scholar] [CrossRef]
- Ronneberger, O.; Fischer, P.; Brox, T. U-net: Convolutional networks for biomedical image segmentation. In International Conference on Medical Image Computing and Computer-Assisted Intervention; Springer: Cham, Vietnam, 2015; pp. 234–241. [Google Scholar]
- Zhang, Z.; Liu, Q.; Wang, Y. Road extraction by deep residual u-net. IEEE Geosci. Remote Sens. Lett. 2018, 15, 749–753. [Google Scholar] [CrossRef]
- Ural, S.; Hussain, E.; Kim, K.; Fu, C.-S.; Shan, J. Building extraction and rubble mapping for city port-au-prince post-2010 earthquake with GeoEye-1 imagery and lidar data. Photogramm. Eng. Remote Sens. 2011, 77, 1011–1023. [Google Scholar] [CrossRef]
- Leichtle, T.; Geiß, C.; Lakes, T.; Taubenböck, H. Class imbalance in unsupervised change detection–a diagnostic analysis from urban remote sensing. Int. J. Appl. Earth Obs. Geoinf. 2017, 60, 83–98. [Google Scholar] [CrossRef]
- Ioffe, S.; Szegedy, C. Batch normalization: Accelerating deep network training by reducing internal covariate shift. arXiv preprint 2015, arXiv:1502.03167. [Google Scholar]
- Haut, J.M.; Fernandez-Beltran, R.; Paoletti, M.E.; Plaza, J.; Plaza, A.; Pla, F. A new deep generative network for unsupervised remote sensing single-image super-resolution. IEEE Trans. Geosci. Remote Sens. 2018, 56, 6792–6810. [Google Scholar] [CrossRef]
- Springenberg, J.T.; Dosovitskiy, A.; Brox, T.; Riedmiller, M. Striving for simplicity: The all convolutional net. arXiv preprint 2014, arXiv:1412.6806. [Google Scholar]
- Maggiori, E.; Tarabalka, Y.; Charpiat, G.; Alliez, P. Can semantic labeling methods generalize to any city? The inria aerial image labeling benchmark. In Proceedings of the 2017 IEEE International Geoscience and Remote Sensing Symposium (IGARSS), Fort Worth, TX, USA, 23–28 July 2017; pp. 3226–3229. [Google Scholar]
- Deep Learning Studio, AI Services on Deep Cognition. Available online: https://deepcognition.ai/features/deep-learning-studio/ (accessed on 27 September 2020).
- Artificial Intelligence Software on Peltarion. Available online: https://peltarion.com/ (accessed on 27 September 2020).
- Bai, Y.; Adriano, B.; Mas, E.; Koshimura, S. Building damage assessment in the 2015 Gorkha, Nepal, earthquake using only post-event dual polarization synthetic aperture radar imagery. Earthq. Spectra 2017, 33, 185–195. [Google Scholar] [CrossRef]
- Bai, Y.; Gao, C.; Singh, S.; Koch, M.; Adriano, B.; Mas, E.; Koshimura, S. A framework of rapid regional tsunami damage recognition from post-event TerraSAR-X imagery using deep neural networks. IEEE Geosci. Remote Sens. Lett. 2017, 15, 43–47. [Google Scholar] [CrossRef]


Publisher’s Note: MDPI stays neutral with regard to jurisdictional claims in published maps and institutional affiliations. |
© 2020 by the authors. Licensee MDPI, Basel, Switzerland. This article is an open access article distributed under the terms and conditions of the Creative Commons Attribution (CC BY) license (https://creativecommons.org/licenses/by/4.0/).