Article

The Usage of Twitter (Now 𝕏) Amplifiers in the European Elections of 2019

by
Thomai Voulgari
1,*,
Alexandros K. Angelidis
2,3,
Charalampos Bratsas
2,3,*,
Rigas Kotsakis
2,
Andreas Veglis
1 and
Antonis Skamnakis
1
1
School of Journalism & Mass Communications Thessaloniki, Aristotle University of Thessaloniki (AUTH), 54124 Thessaloniki, Greece
2
Department of Information and Electronic Systems, International Hellenic University, 54124 Thessaloniki, Greece
3
Open Knowledge Foundation Greece, 54352 Thessaloniki, Greece
*
Authors to whom correspondence should be addressed.
Journal. Media 2024, 5(3), 951-966; https://doi.org/10.3390/journalmedia5030060
Submission received: 2 May 2024 / Revised: 26 June 2024 / Accepted: 8 July 2024 / Published: 12 July 2024

Abstract

:
The aim of this study is to investigate how amplifiers are used in Twitter (now called “ X ”) during election campaigns. Specifically, the main purpose is to identify the role and engagement of Twitter amplifiers in the 2019 European elections, the visibility of political parties and leaders, and the way in which automated tools are used to manipulate public opinion by influencing voting decisions. The countries considered in the study are two economic powers of Western Europe, France and Germany, as well as two countries of the European South, which are affected by the economic and financial crisis, Greece and Italy. The countries from Southern Europe were included in the sample as they are often used by mass media as political campaign tools. This paper emphasizes the Twitter platform through which the data collection was implemented using the official API of the social networking tool, focusing on the 2019 European elections. We collected data on 88 party leaders and MEP candidates between 10 May and 30 May 2019, as well as on 44,651 accounts that retweeted them. We concluded using 237,813 election-related tweets and used network theory to analyze and visualize the data. The results demonstrate that all political parties use amplifiers to promote their tweets, and some use the same amplifiers between different countries.

1. Introduction

Digital technology has transformed the way we interact, having a significant influence on media and communication. Although social media platforms are used as a tool to engage and communicate with multiple target audiences, they can also be used to achieve malicious activities, as well as for spreading disinformation during election campaigns (Ferrara et al. 2020). Political parties and politicians promote content on Twitter (now called “ X ”) by algorithms in order to boost their tweets which increase political polarization. The rapid development of artificial intelligence brought about changes in the fields of political communication and data journalism. Amplifiers are used in an attempt to increase the popularity of specific content by creating trends on Twitter (Broniatowski et al. 2018) and sharing their views on political issues. A significant part of this literature review examines the manipulation through the Twitter platform during critical electoral processes such as the 2019 European elections, the 2016 US presidential elections, the 2022 French presidential elections, and elections that took place in other countries such as Germany, Italy, and the UK (Cinelli et al. 2020; Grinberg et al. 2019; Ferrara et al. 2020; Aral and Eckles 2019).
Social media platforms have enabled the collection and analysis of vast amounts of data. By using algorithms and automated methods through social media, one can create the sense that millions of users discuss a topic. Automated mechanisms are aimed at dynamic communities in social networks that have a significant influence on public opinion (Capralos 2019). Undoubtedly, they offer the opportunity to study and explore the interaction between political candidates and the public to a greater extent than ever before (Ratkiewicz et al. 2011). As pointed out by Conover et al. (2021), it is undeniable that social media became a powerful “weapon” of influence on public discourse, since hashtags and retweets enable the direct dissemination of information.
According to Enli (2017), nowadays, elections are held on the social media ecosystem, while New Media are used by politicians as a method and field of self-promotion, as well as an “arena for political marketing” (Bellström et al. 2016; De Paula et al. 2018). Social media has gained a strategic position in election campaigns, while the immediacy of communication between political organizations, political candidates and voters leads to a faster dissemination of messages through interactive tools. Political actors globally make use of digital tools in combination with the appropriate algorithms or bots to try to control and influence online public opinion in the digital era (Woolley and Howard 2016). Fake and automated accounts with human behavior are quite often created to spread propaganda messages rapidly. These are automated Twitter accounts with human behavior that post content, interact with other users, and retweet with comments (Voulgari et al. 2021).
Given in the Twitter ecosystem is the impression of widespread dissemination and support for political ideology of elected politicians or political candidates and parties by promoting personalized content and advocating specific views or by using propaganda techniques (Alaphilippe et al. 2019). Twitter is a powerful tool that gives the opportunity to reach users who have an influence and act as “influencers” in shaping public opinion. Political actors create a virtual popularity by using automated or semiautomated accounts, and this is supposed to be a very effective way of exerting political influence. By using these methods, they try to increase the frequency of occurrence in the timeline of content that has been purposefully created and is part of microtargeted propaganda by foreign actors. Social media users can be influenced directly by online communities, as such practices may affect constructive dialogue (Coletto et al. 2016; Chu et al. 2012). Political actors infiltrate political debates (Neudert and Marchal 2019) and then disseminate and promote specific messages in an attempt to reinforce controversial views. The result is to distort the flow of information but also to cause divisions in society, as well as to create a growing confusion in politics. Fake accounts and automated accounts (bots) with human behavior reproduce massive propaganda messages across Twitter.
The literature review highlights the increasing interest from researchers about whether opinion “influencers” have the potential to maximize the spread of a message to wider audiences through a social network (Weimann 1994; Keller and Berry 2003). The role of influencers in communication is becoming more noticeable as they are used through social media platforms due to their ability to influence online conversations (Anspach 2017). Xu et al. (2014) highlight that influencers’ content on Twitter often trigger strong emotional reactions and this suggests that some information is disseminated significantly more widely than its importance. Measuring influence on social media has become a field of study in computer science (Coletto et al. 2016). Although there is a huge volume of data for analysis by online media platforms, measuring influence is complex and multidimensional and it becomes even more complicated to define its variables. Riquelme and González-Cantergiani (2016) support that the identification of influential users on Twitter is supposed to be an extremely difficult process in view of the fact that there is a high percentage of accounts that have either been deactivated, deleted, or remain inactive or even private (Anger and Kittl 2011).
According to Riquelme and González-Cantergiani (2016), part of the wider research community that examines influence relies on the collection of real-time data (tweets) via Twitter API, while other researchers examine influence using complex mathematical models. Using network theory to study, analyze, visualize, and understand data is an approach with several applications in social media, and more specifically in Twitter (Becatti et al. 2019; Kimmo 2019; Liang and Lu 2023; Logan et al. 2023; Pierri et al. 2020; Samalis et al. 2023; Witzenberger and Pfeffer 2024; Yoon et al. 2022).
In this article, we examine the use of accounts that amplify political propaganda messages on social media, specifically Twitter, during the period leading up to the 2019 European elections. The countries under consideration are two strong economic powers of Western Europe, France and Germany, as well as two countries of the European South, Greece and Italy. Southern European countries were selected because of the frequent use of media by various economic entities as tools for political involvement (Papathanasopoulos 2004). The primary aim of this study is to explore the role and actions of amplifiers in the 2019 European elections campaign.
Our contribution can be summarized by addressing the following objectives:
  • Investigate how each political party uses amplifiers to increase its popularity during the 2019 European elections within each country.
  • Analyze any potential relationships between countries and political parties in terms of amplifiers usage.
The research questions guiding this study are as follows:
  • RQ1. What is the role of amplifiers and active users on Twitter during the 2019 European elections?
  • RQ2. Is there any kind of interaction between the Twitter accounts among the countries considered?
  • RQ3. How are the relationships portrayed between countries and political parties?
In order to answer these questions, we present the data collection process and methodology in Section 2, the results in Section 3, a summary of the results in Section 4, and our conclusion in Section 5.

2. Materials and Methods

2.1. Data

2.1.1. Data Source and Collection Process

MediaWatch (https://github.com/cvcio/mediawatch accessed on(7 July 2024)), a tool developed by Civic Information Office (https://cvcio.org accessed on (7 July 2024)), which allows users to retrieve data via Twitter API was used to collect data on the May 2019 European elections (Voulgari et al. 2021). The Twitter API provides a sample of available tweets for each query, ensuring that the selection process for tweets was automated and unbiased, with no manual intervention by the authors.
For data collection, we focused on tweets and retweets from the pre-election period between 10 May and 30 May 2019. The dataset comprised Twitter accounts of Members of the European Parliament (MEPs) and candidates from Greece, Italy, France, and Germany. These accounts were selected based on their number of followers, tweet activity, and retweet frequency. Additionally, influential party leaders and candidates were included to ensure comprehensive coverage of key political figures during the campaign. The inclusion criteria for data collection were:
  • Participation in the European elections.
  • Number of friends and followers.
  • Interaction metrics (tweets and retweets) during the specified period.
  • Political accounts from Greece, Italy, France, and Germany, proportional to their parliamentary representation.
Accounts with very few friends or followers, low engagement, locked (suspended) accounts, inactive accounts (zero tweets), and private (protected) accounts were excluded.

2.1.2. Data Description and Ethical Considerations

The dataset comprises:
  • 88 target accounts: These are the primary accounts of MEPs, candidates, influential party leaders, and associated political parties.
  • 11,284 unique tweets: Captured from the 88 target accounts between 10 May and 30 May 2019.
  • 44,651 user accounts: These accounts retweeted the posts from the target accounts, culminating in a total of 237,813 retweets.
No language restrictions were imposed on the dataset, ensuring a diverse and inclusive data sample.
Twitter API was openly accessible during our analysis, allowing us to collect publicly available tweets and retweets without requiring additional permissions. To ensure the confidentiality and privacy of individual users, we excluded private accounts from our dataset. Since the data consist of publicly available content, users have inherently consented for their tweets to be used in public analyses. Our research did not involve direct interaction with these users, maintaining privacy and ethical standards.
In agreement with Twitter’s Developer Agreement and legal guidance, we do not disclose usernames, retweeted usernames, or full tweets. Although this information is used in our analysis, it remains confidential. Our analysis focused on the interaction patterns between political accounts and their retweeters to understand the spread and influence of political messages during the 2019 European elections. Throughout the study, we adhered to strict ethical standards, ensuring the privacy of individuals and careful handling of sensitive information. The entire data collection and analysis process complied with Twitter’s terms of service and ethical research guidelines, respecting the rights of all individuals involved.

2.2. User Classification

In order to characterize user accounts in terms of their activity, a random sample of 6258 unique accounts was created to classify the account into a number of classes by utilizing machine learning algorithms (Voulgari et al. 2021). Although the definition of categorization varies in the literature review, the basic idea of categorization can be defined as “the ability to predict the most likely value for a dependent variable to take, given the values of the independent variables in a data set” (Bradley et al. 1999).
The algorithm indicated the different types of accounts found on Twitter based on the political content. More specifically, there are the (i) new accounts, created at the current moment in time at which a survey is implemented, (ii) active accounts, which are the most “ardent” supporters and show normal behavior, (iii) influencers, which have a huge impact on public sphere, (iv) bots, which are automatic machines that like and retweet nonstop and amplifiers that amplify a message by writing something more or by retweeting and quoting, and, finally, (v) unknown, which is an undefined category. These categories (classes) are defined with more detail as follows.
Amplifier is an account that mostly reproduces content that has little or no number of primary mentions, has many likes and retweets, reproduces specific targets (positive or negative), and often its primary content is aggressive towards an opponent. Their activity is closely linked to other similar accounts, and their themes and scope are related to politics and current affairs. They have a lot of followers and friends, with too many statuses, especially retweets. When you look at their profile, they usually have a pinned status and then only retweet. An amplifier account is distinguished by political unilateralism and strongly and fanatically expresses their views. The term bot was not used in this case since their activity on the MSM is not necessarily automated. Obviously, this characterization includes all astroturfing practices with troll factories and bots. In summary, amplifiers are accounts that have a minimal or nonexistent number of primary mentions, their content is limited in subject matter, have a very high number of retweets, favorites, and actions (per day) and at the same time are used to attack an account (replies).
Influencers are accounts that receive a lot of influence, regardless of the content they produce. They receive a disproportionately large number of actions, such as follow, retweets, replies, quotes, and favorites. They can be a famous personality (persona), a politician, or a journalist. However, there are also influencers on Twitter who have no identity and, still, whatever they write is being reproduced.
Active accounts are those that behave “normally”, producing primary content with a wide range of topics, usually politics, news, and opinions.
New accounts are those created up to 120 days from the time of the report they interact with, and accounts that we cannot classify in the above categories are the unknown accounts.
As extensively discussed in Voulgari et al. (2021), the 6258 classified accounts were used to train a machine learning model. Specificity, the random forest algorithm (Breiman 2001) with the highest possible detection accuracy in accordance with Barbon et al. (2018) was chosen to classify and characterize the accounts. When used for classification, the random forest machine learning algorithm combines the output of many decision trees to conclude the class selected by most of them. This algorithm is applied to businesses and industries such as e-commerce, banking, and telecommunication and IT companies to predict behavior and outcomes (Mbaabu 2020). The classification was based on criteria such as number of followers, friends, statuses, favorites, followers–friends ratio and statuses–favorites ratio, and date of account creation.

2.3. Network Analysis

A network or graph is a mathematical structure that represents relationships between objects. More specifically, graphs consist of a set of nodes (or vertices) and a set of edges (or links). In the context of social media analysis, and specifically in the context of Twitter accounts, the vertices could represent the individual Twitter users and the edges the retweets between them. We can also assign directions in the edges demonstrating whose post was retweeted by who, and/or weights, such as ±1, demonstrating whether the retweet is positive or not. Graph visualization plays a crucial role in helping us to understand the complex relationships and structures present in the data. It allows us to visually explore the structure of the network and identify central nodes, which are nodes with a high degree of influence and impact. By examining the visualization, we can also detect communities or clusters and observe patterns of connectivity, such as communities of users with shared interests or affiliations. Overall, the representation of data as a network reveals hidden relationships and patterns present in the data and allows us to gain a deeper understanding about its structure.
Network theory has been widely used in various fields, such as in the analysis of terrorist and criminal networks (Anastasiadis and Antoniou 2024; Spyropoulos et al. 2021; Spyropoulos et al. 2022), global value chain networks of COVID-19 materials (Angelidis et al. 2021), outliers and anomaly detection tasks (Bratsas et al. 2021), and even in complex theoretical problems in mathematical physics (Angelidis et al. 2024). It has also been applied to data collected through the Twitter platform, with some examples involving the analysis of political communication through Twitter (Samalis et al. 2023), the investigation of the spread of disinformation (Pierri et al. 2020), and the exploration of the use of amplifiers in elections (Kimmo 2019; Yoon et al. 2022).
In our analysis, we used network visualization to identify hidden relationships between the users in the dataset. We investigated two main cases. First, we examined in each country separately how political parties (far-right, right, center-right, center-right, center-left, left, far-left and Eurosceptic) exploit the use of amplifier accounts. The categorization of political parties into political sides was based on how the party was identified on their Twitter accounts during the study. We clustered the target accounts that correspond to the same political party in each country. As a result, the 88 target accounts were converted into 7 nodes, representing the political parties. We then checked the accounts in the second dataset, and whenever an account classified as an amplifier had retweeted a post of one of the targets, we established an edge between the amplifier and the political party to which that target account belonged. The same process was applied to active users.
Afterwards, we explored the use of amplifier accounts by political parties on a larger scale and investigated whether amplifiers are also used between different countries. In this case, the 88 target accounts were converted into 4 nodes, representing the 4 countries considered in our study. This was conducted by clustering the accounts corresponding to the same country into a single node. Every time an amplifier retweeted a post from one of the target accounts, an edge between the amplifier and the target account’s country node was established. We also created the graphs corresponding to the active accounts.

2.4. Limitations of the Study

The current research took place several months after the European elections, and as a result it was impossible not only to record the election data in real time, but also to collect educational data and specific hashtags that could be used as an analysis tool. In addition, social networks do not provide data for political campaigns. Social media platforms have changed their policy for transparency and targeting of political advertising. It is also noteworthy that the cost of using sophisticated algorithms is very high. However, the volume of data was enough, and the artificial intelligence tool yielded a representative image about the main part of the research regarding the way that amplifiers were used during the pre-election campaign to spread political messages that could influence public opinion.

3. Results

3.1. Distribution of the Accounts

As mentioned in Section 2, the dataset we used in our analysis consists of 88 target accounts and 44,651 accounts that had retweeted at least one post of one of the target accounts. The total number of the target tweets is 11,284 and the total number of retweets is 237,813. Before we present the visualization and interpretation of the networks, we present some general results regarding the dataset.
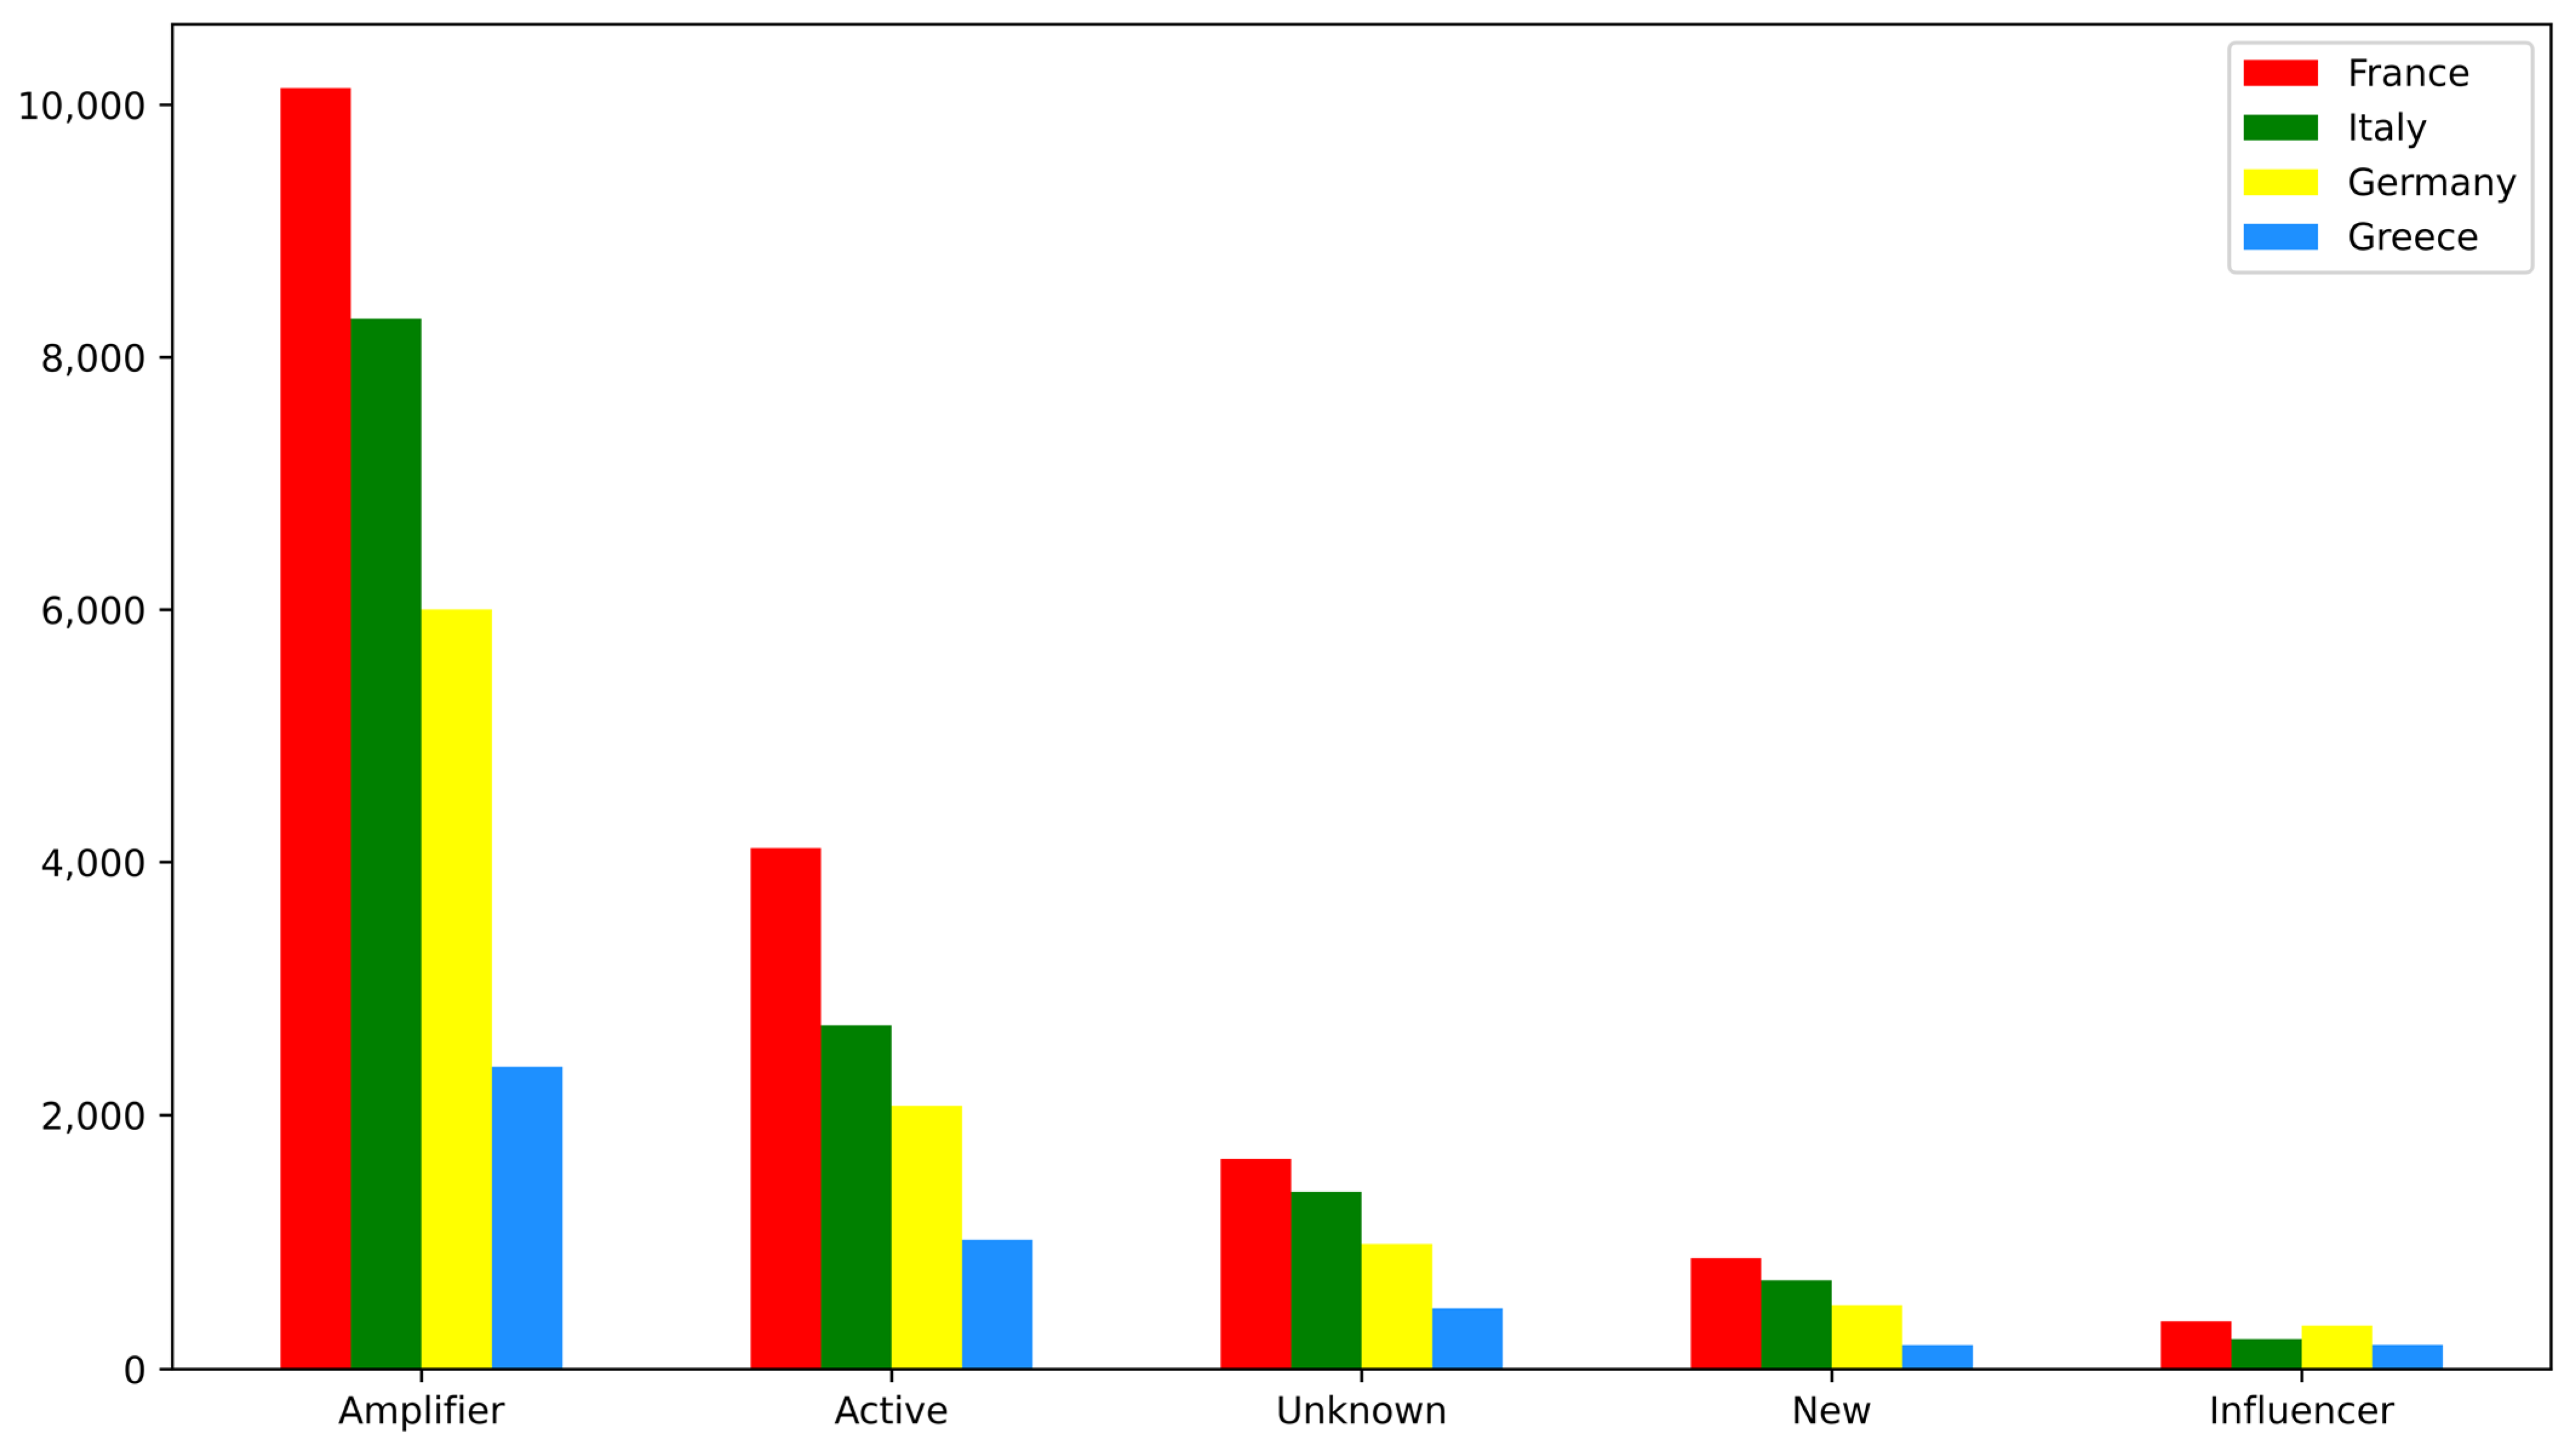
We investigated how accounts are distributed across the dataset, i.e., how many of them were classified as amplifiers, active, unknown, new, and influencers. The results, as presented by the bar chart in Figure 1, demonstrate that the vast majority of accounts are amplifiers. Specifically, in a total of 44,651 accounts, 26,818 were classified as amplifiers (~60%), 9912 as active (~22%), 4514 as unknown (~10%), 2260 as new (~5%), and 1147 as influencers (~3%). In Figure 2, the bars are further split to show the distribution of accounts in each country and to allow comparison between them, while Figure 3 presents the corresponding pie charts with the percentage of each category in each country separately. In each country the accounts seem to be distributed similarly, with the vast majority being amplifiers with a percentage ranging from 55 to 63%, followed by active accounts, which range from 20 to 24%.
Considering that new accounts and influencers make up less than 8%, in the following sections we present the networks associated only with the amplifiers and actives.

3.2. Network Analysis and Visualization

We utilized network theory to create graphs with our dataset and investigate how amplifiers are used by the political parties. We considered two cases. First, we created graphs for each country separately in order to investigate how amplifiers are distributed across political parties within the country (Section 3.2.1); second, we created graphs for each political ideology separately, in order to capture any amplifiers used across different countries by the same political ideologies (Section 3.2.2).

3.2.1. Graphs of Accounts Per Country

We first investigated each country separately, creating a total of four graphs, one for each country (Figure 4). Each graph consists of a few large colorful nodes and many small black nodes. The large nodes represent the political parties after we group all the accounts of the same country with the same political ideology into one node. For each political ideology we used different colors. In particular, the colors aqua, blue, orange, green, pink, red, and gray correspond to the far-right, right, center-right, center-left, left, far-left, and Eurosceptic political ideology, respectively. The small black nodes correspond to the amplifiers, while the purple ones to the active ones. If a large node is connected to an amplifier (or active), then the amplifier (or active) has retweeted a post from one of the accounts corresponding to the political party of that node. Within each large node, we can see its degree, i.e., the number of connections to other nodes. In Table 1, Table 2, Table 3 and Table 4, we summarize the number of amplifiers and active accounts connected to each political party in each country. In Greece, most amplifiers appear on the far-left parties, in Italy and France on the far-right, and in Germany on the center-left. In most cases, the amplifiers and active accounts change proportionally, as in political parties where there are many active accounts, there are usually also many amplifiers.

3.2.2. Graphs of Accounts Per Political Ideology

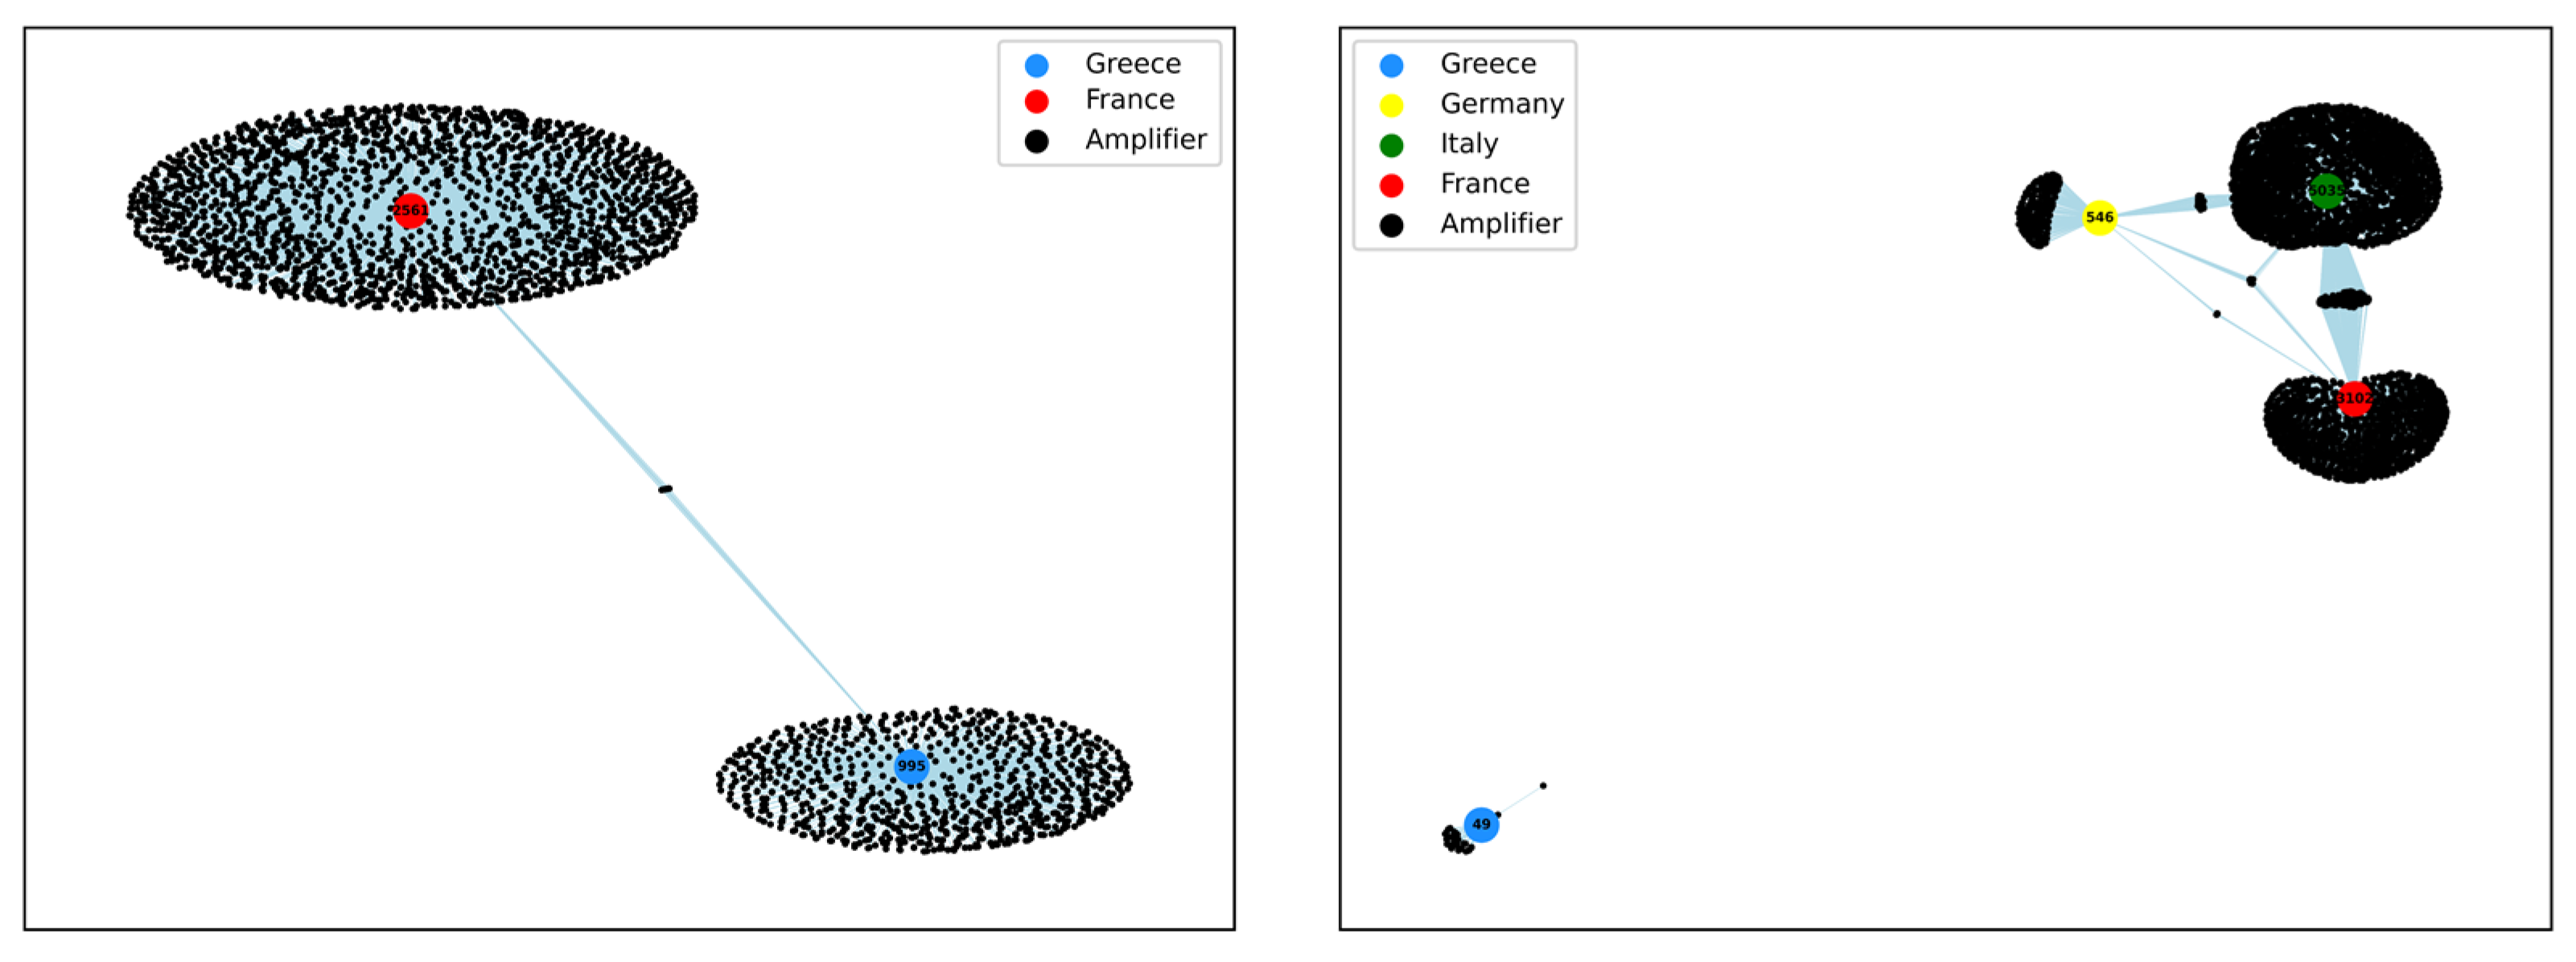
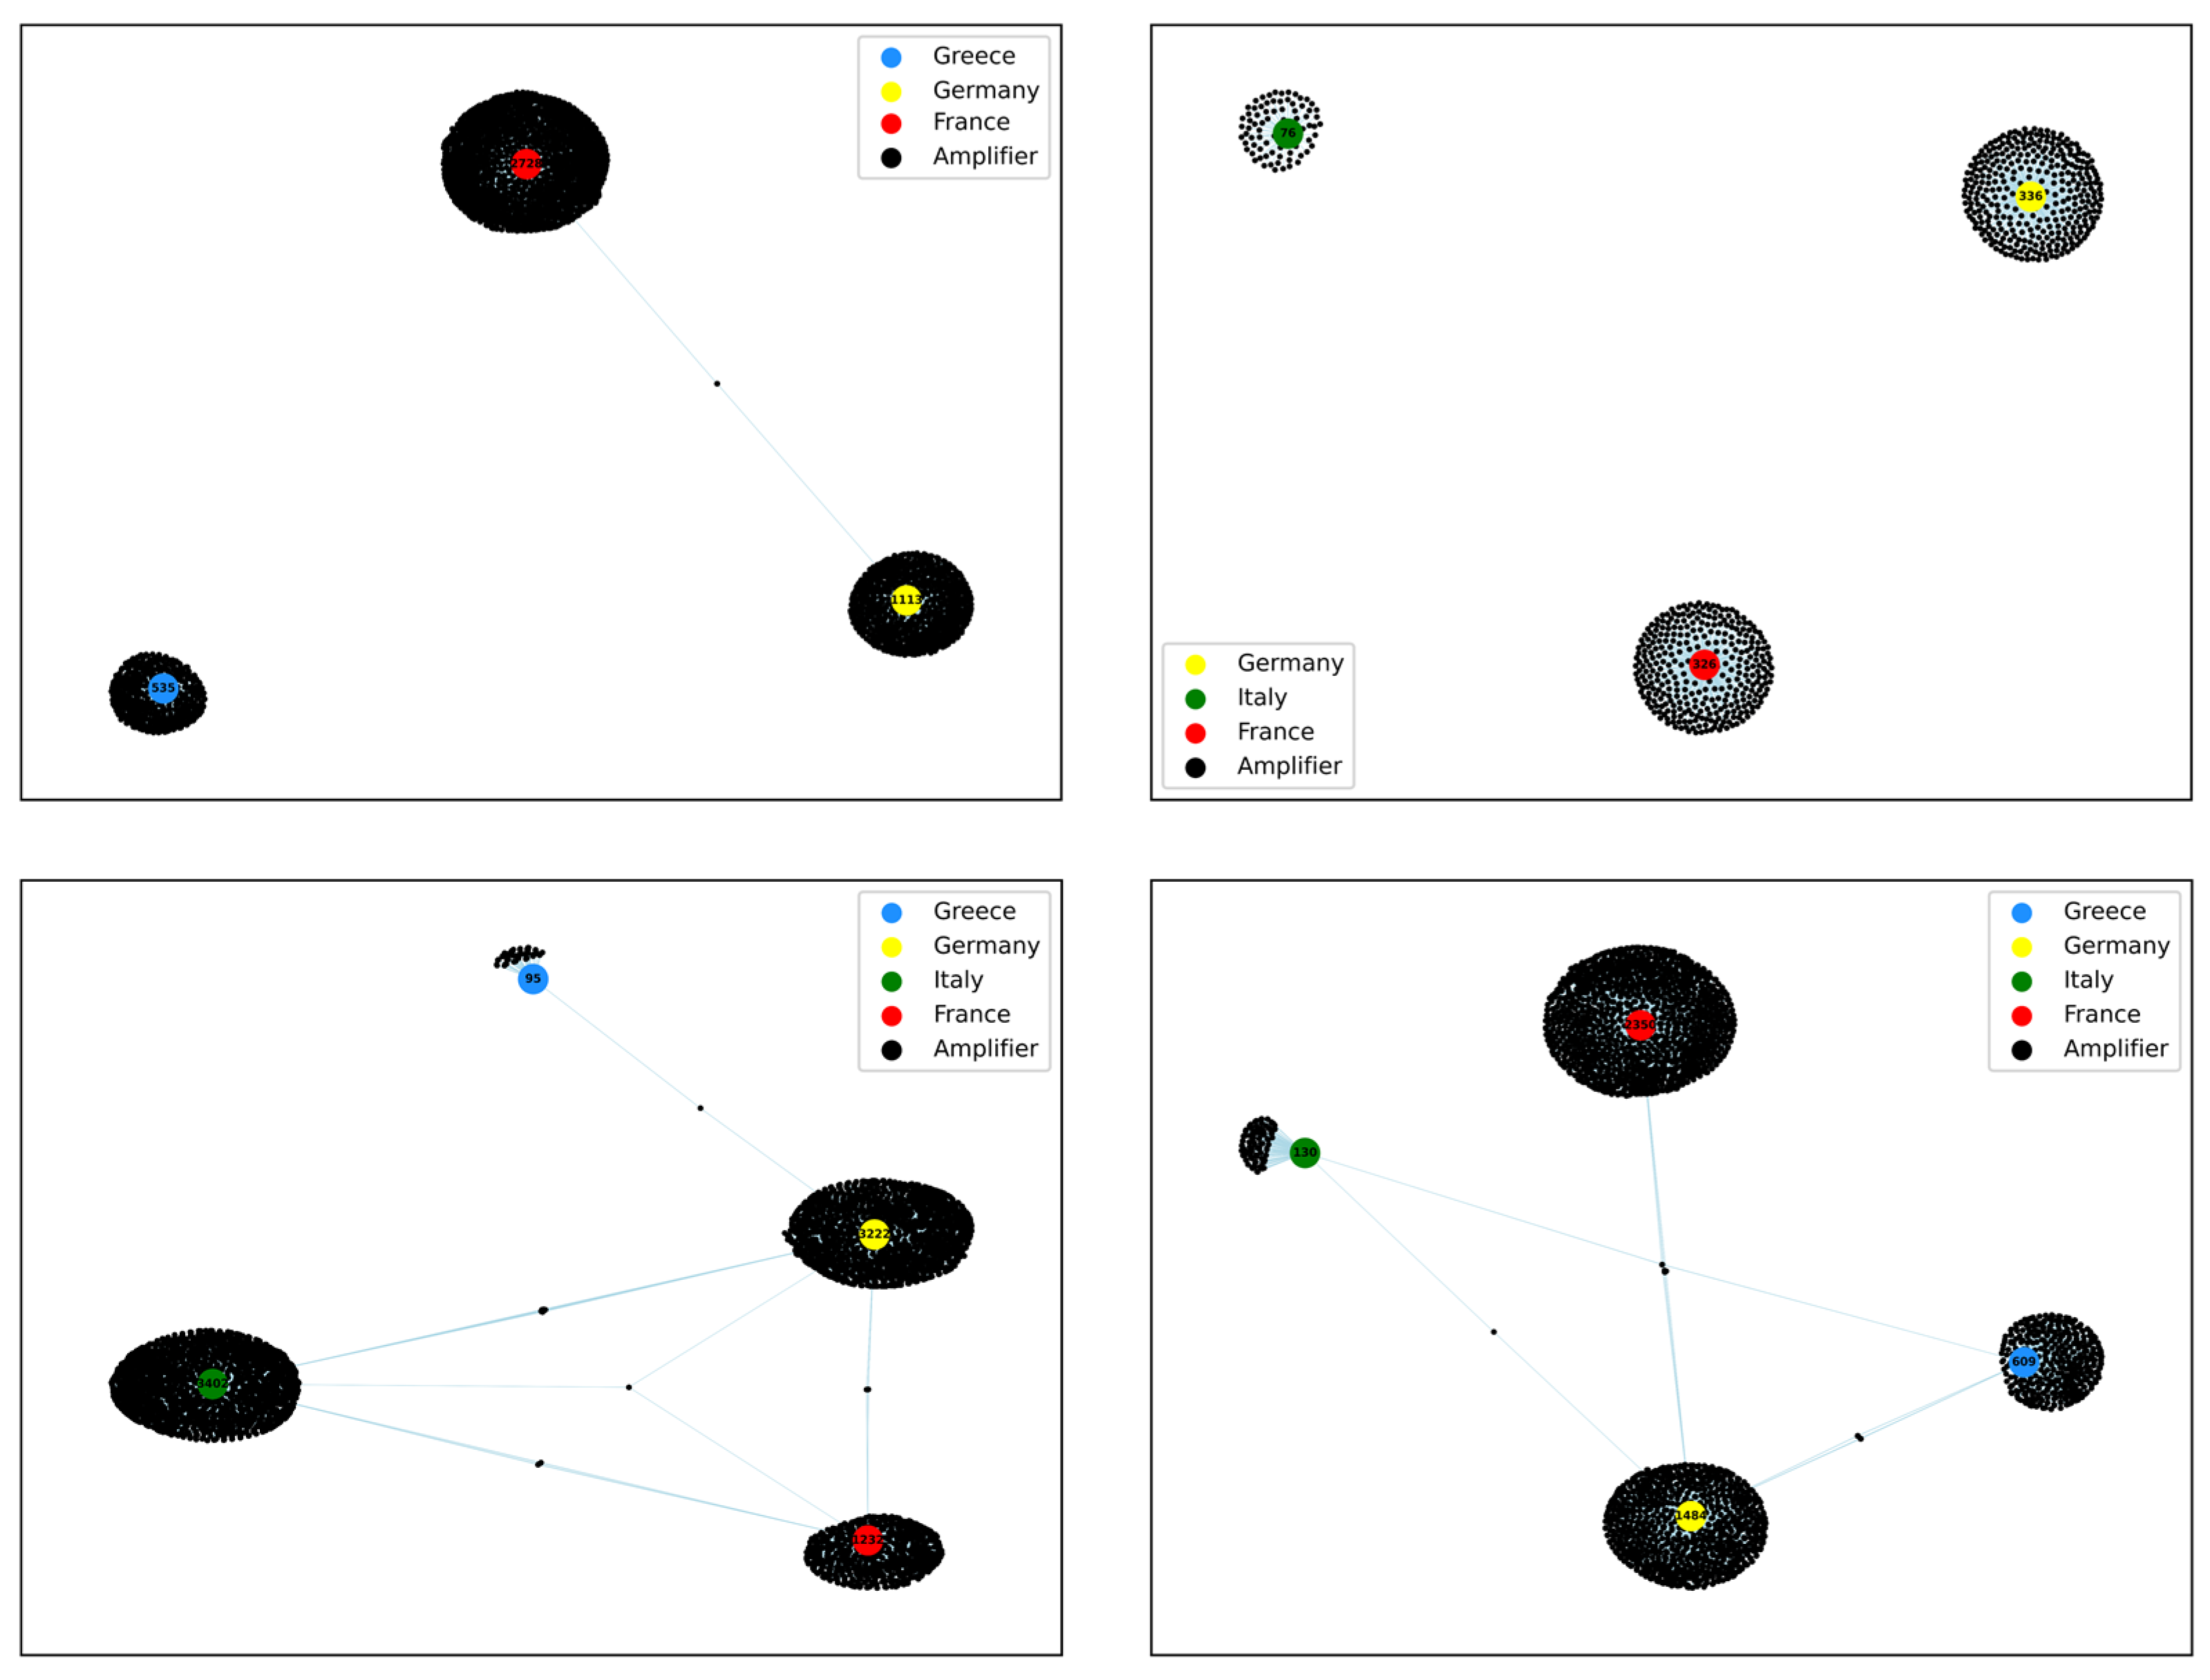
Following a similar procedure to Section 3.2.1, in this case, we investigated whether there are political ideologies that use the same amplifier or active accounts between different countries. We created graphs for each party separately (far-right, right, center-right, center-left, left, far-left). In total, we obtained six graphs demonstrating connections to amplifier accounts (Figure 5) and six graphs demonstrating connections to active accounts (Figure 6). The large nodes represent political parties after grouping all accounts with the same political ideology into one. The difference from the previous graphs in Section 3.2.1 is that, here, we consider the accounts of all the countries in each graph. The large colorful nodes represent the four countries, with blue corresponding to Greece, yellow to Germany, green to Italy, and red to France. The small black nodes represent the amplifiers, and the small purple nodes represent the active accounts. The connections are established using the same rule mentioned in Section 3.2.1. If a large node is connected to an amplifier (or active) account, then the amplifier (or active) has retweeted a post from one of the accounts corresponding to the node’s political party. Within each large node, we can see its degree, i.e., the total number of amplifiers (active accounts respectively) connected to that political party.
In this case, we investigate whether the same amplifiers or the same active accounts are used between different countries, so we summarized the number of common nodes (common amplifiers and common active accounts) used by each party between different countries. Among the far-right parties, there are 523 amplifiers in France and Italy, 41 in France and Germany, 115 in Italy and Germany, and 30 in the three countries together. In the right parties, there are no amplifiers between different countries. In the center-right parties, 34 amplifiers are found in Greece and Germany, while very few amplifiers (fewer than 10) are found between the other countries. Among the center-left parties, there are 26 amplifiers in Germany and France, 12 in Germany and Italy, and very few (fewer than 5) among the other countries. Among left parties, only 2 amplifiers are found in France and Germany, and among far-right parties, only 15 amplifiers are found in France and Greece. Considering the active accounts, it is found that among the far-right parties, there are 96 active accounts in France and Italy, 7 in France and Germany, 21 in Italy and Germany, and 5 in the three countries together. In the right parties, there are no active accounts between different countries. In the center-right parties, 10 active accounts are found in Greece and Germany, and only 2 or 1 are found between the other countries. Among the center-left parties, there are 10 amplifiers in Germany and France, and only 2 or 1 between the other countries. Among left and far-left parties, there are only 3 and 2 active accounts between France and Greece, respectively.

4. Summary of the Results

Our findings presented in this study can be summarized as follows.
We observed that most accounts in the countries we examined are amplifiers, as in the majority there are more than 55 % . Amplifiers double the fake buzz by retweeting. Therefore, amplifiers characterize the study and show that they were means of delivery for political messaging in many countries.
In Greece, we found that 995 amplifiers come from the far-left parties, while 609 amplifiers come from center-right parties. Accordingly, most active users (331) in Greece were issued from far-left political parties, while following were 300 from center-right parties. In Italy, 5035 amplifiers come from the far-right side of the political spectrum, while 3402 from the center-left side, in proportion to 1489 active users from the far-right side and 1228 from the center-left. Then, in France, the highest number of amplifiers (3102) come from far-right political parties, 2350 from the center-right side, and 1552 from Eurosceptic parties and politicians. In Germany, most amplifiers (3222) were found on the center-left side in proportion to the most active accounts (1257) also found on the center-left side.
Comparing the graphs corresponding to the amplifiers (Figure 5) and the active accounts (Figure 6), we observe that there is a relationship between amplifiers and active accounts. The most significant activity is observed among the far-right parties of France and Italy. In most cases, the amplifiers and active accounts change proportionally, as in political parties where there are many active accounts, there are usually also many amplifiers.

5. Conclusions

The purpose of this study was to investigate the action and role of amplifiers in Twitter in the context of 2019 European election in Greece, Germany, Italy, and France. Thousands of tweets and interactions from hundreds of accounts of parties, organizations, and candidates were analyzed. In particular, we examined dozens of political accounts, their interactions, and the profiles of the accounts that amplified political messages in the last twenty days before the 2019 European Parliament election. All the accounts included in the sample were those that attracted significant public attention during the research period (from 10 until 30 May 2019).
Our analysis revealed that amplifiers are a common way to enhance the popularity of political views. We found that although all political parties used amplifiers, this was particularly noticeable in the case of far-right and centrist parties (Section 4). Interestingly, there were instances where the same amplifiers were active between different countries, especially in far-right parties in France and Italy (Figure 5). This may suggest a concerted effort to influence political debates across national boundaries, highlighting the transnational character of contemporary political campaigns. We also observed that the number of amplifiers shows a correlation with the number of active accounts; as the number of active accounts increases, so too does the number of amplifiers. The total number of amplifiers is still too high compared to active accounts. This vast majority of amplifiers underlines the potential dangers lurking in political propaganda via social media.
The researchers used similar methods to achieve results while testing theories and analyzing data. For example, Becatti et al. (2019) demonstrated, through a network analysis of retweets, a similar approach focusing on the parties’ pre-election targeting through account amplification. Moreover, another research approach by Pierri et al. (2020) found that during the 2019 European elections, the topics on Twitter focused on controversial and polarizing issues, such as immigration and nationalism. The similarity with our research is related to the political content coming mainly from far-right parties. Within the research approach of Stella et al. (2018), the content shared on Twitter during a political crisis was investigated, and by looking closely at the retweets, it was found that automated content and bots raise concerns, as social media users are exposed to negative content. In addition, Wojcik et al. (2018) examined the frequency at which automated accounts shared links on social media. Data were collected via Twitter API, and the results showed that two-thirds of the tweets linking to popular websites came from automated machines and bots.
Although amplifiers can perform as a powerful tool for boosting political messages, their use raises important ethical questions about the integrity of political debate. By shedding light on the role of amplifiers in the 2019 European elections, this study contributes to the broader discussion on the impact of social media on democracy and the need for transparency and regulation in digital political campaigns. The contributions are not limited to the theoretical fronts, but also open new horizons in analyzing social media using complex structures from mathematics and computer science, such as network theory and machine learning.
For future research, it would be interesting to consider the introduction of weights on the edges of the graphs, i.e., whether a retweet is created with a positive or negative impact. In particular, it would be useful to investigate whether it comes from party supporters in order to amplify a message and gain popularity, or by political opponents who hold contrary ideologies and try to smear and divide the public (for opposing viewpoints) by promoting negative propaganda. Also, it would be methodologically challenging to identify the audience affected by political manipulation as it could contribute to limiting the dissemination of unreliable content. Another interesting aspect could be the possibility of measuring the degree of influence on voting in real time based on some comparative approach to election results and the participation of automated accounts. Future efforts by the research community should focus on sophisticated machine learning techniques to detect social influence.

Author Contributions

Conceptualization, T.V., C.B., R.K., A.V. and A.S.; methodology, T.V., A.K.A., C.B., R.K., A.V. and A.S.; software, A.K.A., C.B. and R.K.; validation, T.V., A.K.A., C.B., R.K., A.V. and A.S.; formal analysis, T.V., A.K.A., C.B. and R.K.; investigation, T.V., A.K.A., C.B., R.K., A.V. and A.S.; data curation, T.V. and R.K.; writing—original draft preparation, T.V., A.K.A. and C.B.; writing—review and editing, T.V., A.K.A., C.B., R.K., A.V. and A.S.; visualization, A.K.A., C.B. and R.K.; supervision, C.B., R.K., A.V. and A.S. All authors have read and agreed to the published version of the manuscript.

Funding

«The implementation of the doctoral thesis was co-financed by Greece and the European Union (European Social Fund-ESF) through the Operational Programme «Human Resources Development, Education and Lifelong Learning» (MIS-5113934) in the context of the Act “Enhancing Human Resources Research Potential by undertaking a Doctoral Research” Sub-action 2: IKY Scholarship Programme for PhD candidates in the Greek Universities».

Institutional Review Board Statement

Not applicable.

Informed Consent Statement

Not applicable.

Data Availability Statement

The data used for this study are available upon request from the corresponding author.

Conflicts of Interest

The authors declare no conflicts of interest.

References

  1. Alaphilippe, Alexandre, Alexis Gizikis, Clara Hanot, and Kalina Bontcheva. 2019. Automated Tackling of Disinformation. Available online: http://www.europarl.europa.eu/RegData/etudes/STUD/2019/624278/EPRS_STU(2019)624278_EN.pdf (accessed on 15 April 2024).
  2. Anastasiadis, Efstathios Konstantinos, and Ioannis Antoniou. 2024. Directed Criminal Networks: Temporal Analysis and Disruption. Information 15: 84. [Google Scholar] [CrossRef]
  3. Angelidis, Alexandros K., Konstantinos Goulas, Charalampos Bratsas, Georgios C. Makris, Michael P. Hanias, Stavros G. Stavrinides, and Ioannis E. Antoniou. 2024. Distinction of Chaos from Randomness Is Not Possible from the Degree Distribution of the Visibility and Phase Space Reconstruction Graphs. Entropy 26: 341. [Google Scholar] [CrossRef]
  4. Angelidis, Georgios, Charalambos Bratsas, Georgios Makris, Evangelos Ioannidis, Nikos C. Varsakelis, and Ioannis E. Antoniou. 2021. Global Value Chains of COVID-19 Materials: A Weighted Directed Network Analysis. Mathematics 9: 3202. [Google Scholar] [CrossRef]
  5. Anger, Isabel, and Christian Kittl. 2011. Measuring influence on Twitter. Paper presented at 11th International Conference on Knowledge Management and Knowledge Technologies, Graz, Austria, September 7–9; New York: Association for Computing Machinery (ACM), vol. 31, pp. 1–4. [Google Scholar] [CrossRef]
  6. Anspach, Nicholas M. 2017. The new personal influence: How our Facebook friends influence the news we read. Political Communication 34: 590–606. [Google Scholar] [CrossRef]
  7. Aral, Sinan, and Dean Eckles. 2019. Protecting elections from social media manipulation. Science 365: 858–61. [Google Scholar] [CrossRef]
  8. Barbon, Sylvio, Jr., Gabriel F. C. Campos, Gabriel M. Tavares, Rodrigo A. Igawa, Mario L. Proença, Jr., and Rodrigo Capobianco Guido. 2018. Detection of Human, Legitimate Bot, and Malicious Bot in Online Social Networks Based on Wavelets. ACM Transactions on Multimedia Computing, Communications and Applications 14: 1–17. [Google Scholar] [CrossRef]
  9. Becatti, Carolina, Caldarelli Guido, Lambiotte Renaud, and Saracco Fabio. 2019. Extracting significant signal of news consumption from social networks: The case of Twitter in Italian political elections. Palgrave Commun 5: 91. [Google Scholar] [CrossRef]
  10. Bellström, Peter, Monika Magnusson, John Sören Pettersson, and Claes Thorén. 2016. Facebook usage in a local government. Transforming Government: People, Process and Policy 10: 548–67. [Google Scholar] [CrossRef]
  11. Bradley, Brendan P. Karin Mogg, Jim White, Carla Groom, and Jo De Bono. 1999. Attentional bias for emotional faces in generalized anxiety disorder. British Journal of Clinical Psychology 38: 267–78. [Google Scholar] [CrossRef]
  12. Bratsas, Charalampos, Evangelos Chondrokostas, Kleanthis Koupidis, and Ioannis Antoniou. 2021. The Use of National Strategic Reference Framework Data in Knowledge Graphs and Data Mining to Identify Red Flags. Data 6: 2. [Google Scholar] [CrossRef]
  13. Breiman, Leo. 2001. Random forests. Machine Learning 45: 5–32. [Google Scholar] [CrossRef]
  14. Broniatowski, David A., Amelia M. Jamison, Sihua Qi, Lulwah AlKulaib, Teo Chen, Adrian Benton, Sandra C. Quinn, and Mark Dredze. 2018. Weaponized health communication: Twitter bots and Russian trolls amplify the vaccine debate. American Journal of Public Health 108: 1378–84. [Google Scholar] [CrossRef]
  15. Capralos, Spyros. 2019. Conflicts and Political Communication (Anatomy of a War Room). Athens: Papazisi. [Google Scholar]
  16. Chu, Zi, Steven Gianvecchio, Haining Wang, and Sushil Jajodia. 2012. Detecting automation of Twitter accounts: Are you a human, bot, or cyborg? IEEE Transactions on Dependable and Secure Computing 9: 811–24. [Google Scholar] [CrossRef]
  17. Cinelli, Matteo, Stefano Cresci, Alessandro Galeazzi, Walter Quattrociocchi, and Maurizio Tesconi. 2020. The limited reach of fake news on Twitter during 2019 European elections. PLoS ONE 15: e0234689. [Google Scholar] [CrossRef]
  18. Coletto, Mauro, Claudio Lucchese, Salvatore Orlando, and Raffaele Perego. 2016. Polarized User and Topic Tracking in Twitter. Pisa: InSIGIR 2016. [Google Scholar]
  19. Conover, Michael, Jacob Ratkiewicz, Matthew Francisco, Bruno Gonçalves, Filippo Menczer, and Alessandro Flammini. 2021. Political Polarization on Twitter. Proceedings of the International AAAI Conference on Web and Social Media 5: 89–96. [Google Scholar] [CrossRef]
  20. De Paula, Aureo, Imran Rasul, and Pedro Souza. 2018. Recovering Social Networks from Panel Data: Identification. Simulations and an Application. (CEPR DP 12792). Available online: https://papers.ssrn.com/sol3/papers.cfm?abstract_id=3322049 (accessed on 7 July 2024).
  21. Enli, Gunn. 2017. Twitter as arena for the authentic outsider: Exploring the social media campaigns of Trump and Clinton in the 2016 US presidential election. European Journal of Communication 32: 50–61. [Google Scholar] [CrossRef]
  22. Ferrara, Emilio, Herbert Chang, Emily Chen, Goran Muric, and Jaimin PatelChang. 2020. Characterizing social media manipulation in the 2020 U.S. presidential election. First Monday 25. [Google Scholar] [CrossRef]
  23. Grinberg, Nir, Kenneth Joseph, Lisa Friedland, Briony Swire-Thompson, and David Lazer. 2019. Fake news on Twitter during the 2016 U.S. presidential election. Science 363: 374–78. [Google Scholar] [CrossRef]
  24. Keller, Edward, and Jonathan Berry. 2003. The Influentials: One American in Ten Tells the Other Nine How to Vote, Where to Eat, and What to Buy. New York: Free Press. [Google Scholar]
  25. Kimmo, Elo. 2019. Is Twitter just a Media Amplifier? Evidence from a Data-Driven, Comparative Analysis of German Federal Elections 2017 and European Elections 2019. Available online: https://shs.hal.science/halshs-02425856 (accessed on 15 April 2024).
  26. Liang, Fan, and Shuning Lu. 2023. The Dynamics of Event-Based Political Influencers on Twitter: A Longitudinal Analysis of Influential Accounts During Chinese Political Events. Social Media + Society 9. [Google Scholar] [CrossRef]
  27. Logan, Austin P., LaCasse M. Phillip, and Lunday J. Brian. 2023. Social network analysis of Twitter interactions: A directed multilayer network approach. Social Network Analysis and Mining 13: 65. [Google Scholar] [CrossRef]
  28. Mbaabu, Onesmus. 2020. Introduction to Random Forest in Machine Learning. Available online: https://www.section.io/engineering-education/introduction-to-random-forest-in-machine-learning (accessed on 15 April 2024).
  29. Neudert, Lisa Maria, and Nahema Marchal. 2019. Polarisation and the Use of Technology in Political Campaigns and Communication. Brussels: Panel for the Future of Science and Technology, European Parliamentary Research Service. [Google Scholar]
  30. Papathanasopoulos, Stylianos. 2004. Politics and Media: The Case of Southern Europe. Athens: Kastaniotis. [Google Scholar]
  31. Pierri, Francesco, Artoni Alessandro, and Ceri Stefano. 2020. Investigating Italian disinformation spreading on Twitter in the context of 2019 European elections. PLoS ONE 15: e0227821. [Google Scholar] [CrossRef]
  32. Ratkiewicz, Jacob, Conover Michael, Meiss Mark, Bruno Gonçalves, Flammini Alessandro, and Menczer Filippo. 2011. Detecting and Tracking Political Abuse in Social Media. Paper presented at 5th International AAAI Conference on Weblogs and Social Media, Barcelona, Spain, July 17–21. [Google Scholar]
  33. Riquelme, Fabian, and Pablo González-Cantergiani. 2016. Measuring user influence on Twitter: A survey. Information Processing & Management 52: 949–75. [Google Scholar]
  34. Samalis, Alexandros, Alexandros Z. Spyropoulos, Georgios C. Makris, Charalampos Bratsas, Andreas Veglis, Vassilis Tsiantos, Anthoula Baliou, Emmanouel Garoufallou, and Anastasios Ventouris. 2023. Data Journalism and Network Theory: A Study of Political Communication through 𝕏 (Formerly Twitter) Interactions. Journalism and Media 4: 73. [Google Scholar] [CrossRef]
  35. Spyropoulos, Alexandros Z., Charalampos Bratsas, Georgios C. Makris, Evangelos Ioannidis, Vassilis Tsiantos, and Ioannis Antoniou. 2021. Entropy and Network Centralities as Intelligent Tools for the Investigation of Terrorist Organizations. Entropy 23: 1334. [Google Scholar] [CrossRef]
  36. Spyropoulos, Alexandros Z., Charalampos Bratsas, Georgios C. Makris, Evangelos Ioannidis, Vassilis Tsiantos, and Ioannis Antoniou. 2022. Investigation of Terrorist Organizations Using Intelligent Tools: A Dynamic Network Analysis with Weighted Links. Mathematics 10: 1092. [Google Scholar] [CrossRef]
  37. Stella, Massimo, Emilio Ferrara, and Manlio De Domenico. 2018. Bots increase exposure to negative and inflammatory content in online social systems. National Academy of Sciences of the United States of America 115: 12435–40. [Google Scholar] [CrossRef]
  38. Voulgari, Τhomai, Vasilis Vasilopoulos, and Antonis Skamnakis. 2021. The role of twitter bots in political discussion on 2019 European elections. Adapt to Survive. In The Role of Social Media, Sharing and Communication to Ameliorate This World. Moschato: Communication Institute of Greece (COMinG), pp. 37–57. [Google Scholar]
  39. Weimann, Gabriel. 1994. The Influentials: People Who Influence People. Albany: State University of New York Press. [Google Scholar]
  40. Witzenberger, Benedict, and Jürgen Pfeffer. 2024. More Inclusive and Wider Sources: A Comparative Analysis of Data and Political Journalists on Twitter (Now X) in Germany. Journalism and Media 5: 27. [Google Scholar] [CrossRef]
  41. Wojcik, Stefan, Solomon Messing, Aaron Smith, Lee Rainie, and Paul Hitlin. 2018. Bots in the Twittersphere. Available online: https://www.pewresearch.org/internet/wp-content/uploads/sites/9/2018/04/PI_2018.04.09_Twitter-Bots_FINAL.pdf (accessed on 7 July 2024).
  42. Woolley, Samuel C., and Philip N. Howard. 2016. Social media, revolution, and the rise of the political bot. In Routledge Handbook of Media, Conflict, and Security. Edited by Piers Robinson, Philip Seib and Romy Frohlich. New York: Routledge, pp. 282–92. [Google Scholar]
  43. Xu, Weiai W., Sang Yoonmo, Blasiola Stacy, and Park W. Hoo. 2014. Predicting Opinion Leaders in Twitter Activism Networks. American Behavioral Scientist 58: 1278–93. [Google Scholar] [CrossRef]
  44. Yoon, Nara, Hemsley Jeff, Smith Alexander, Simpson Ellen, and Eakins James. 2022. Super-amplifiers! The role of Twitter extended party networks in political elections. Policy & Internet 14: 711–30. [Google Scholar] [CrossRef]
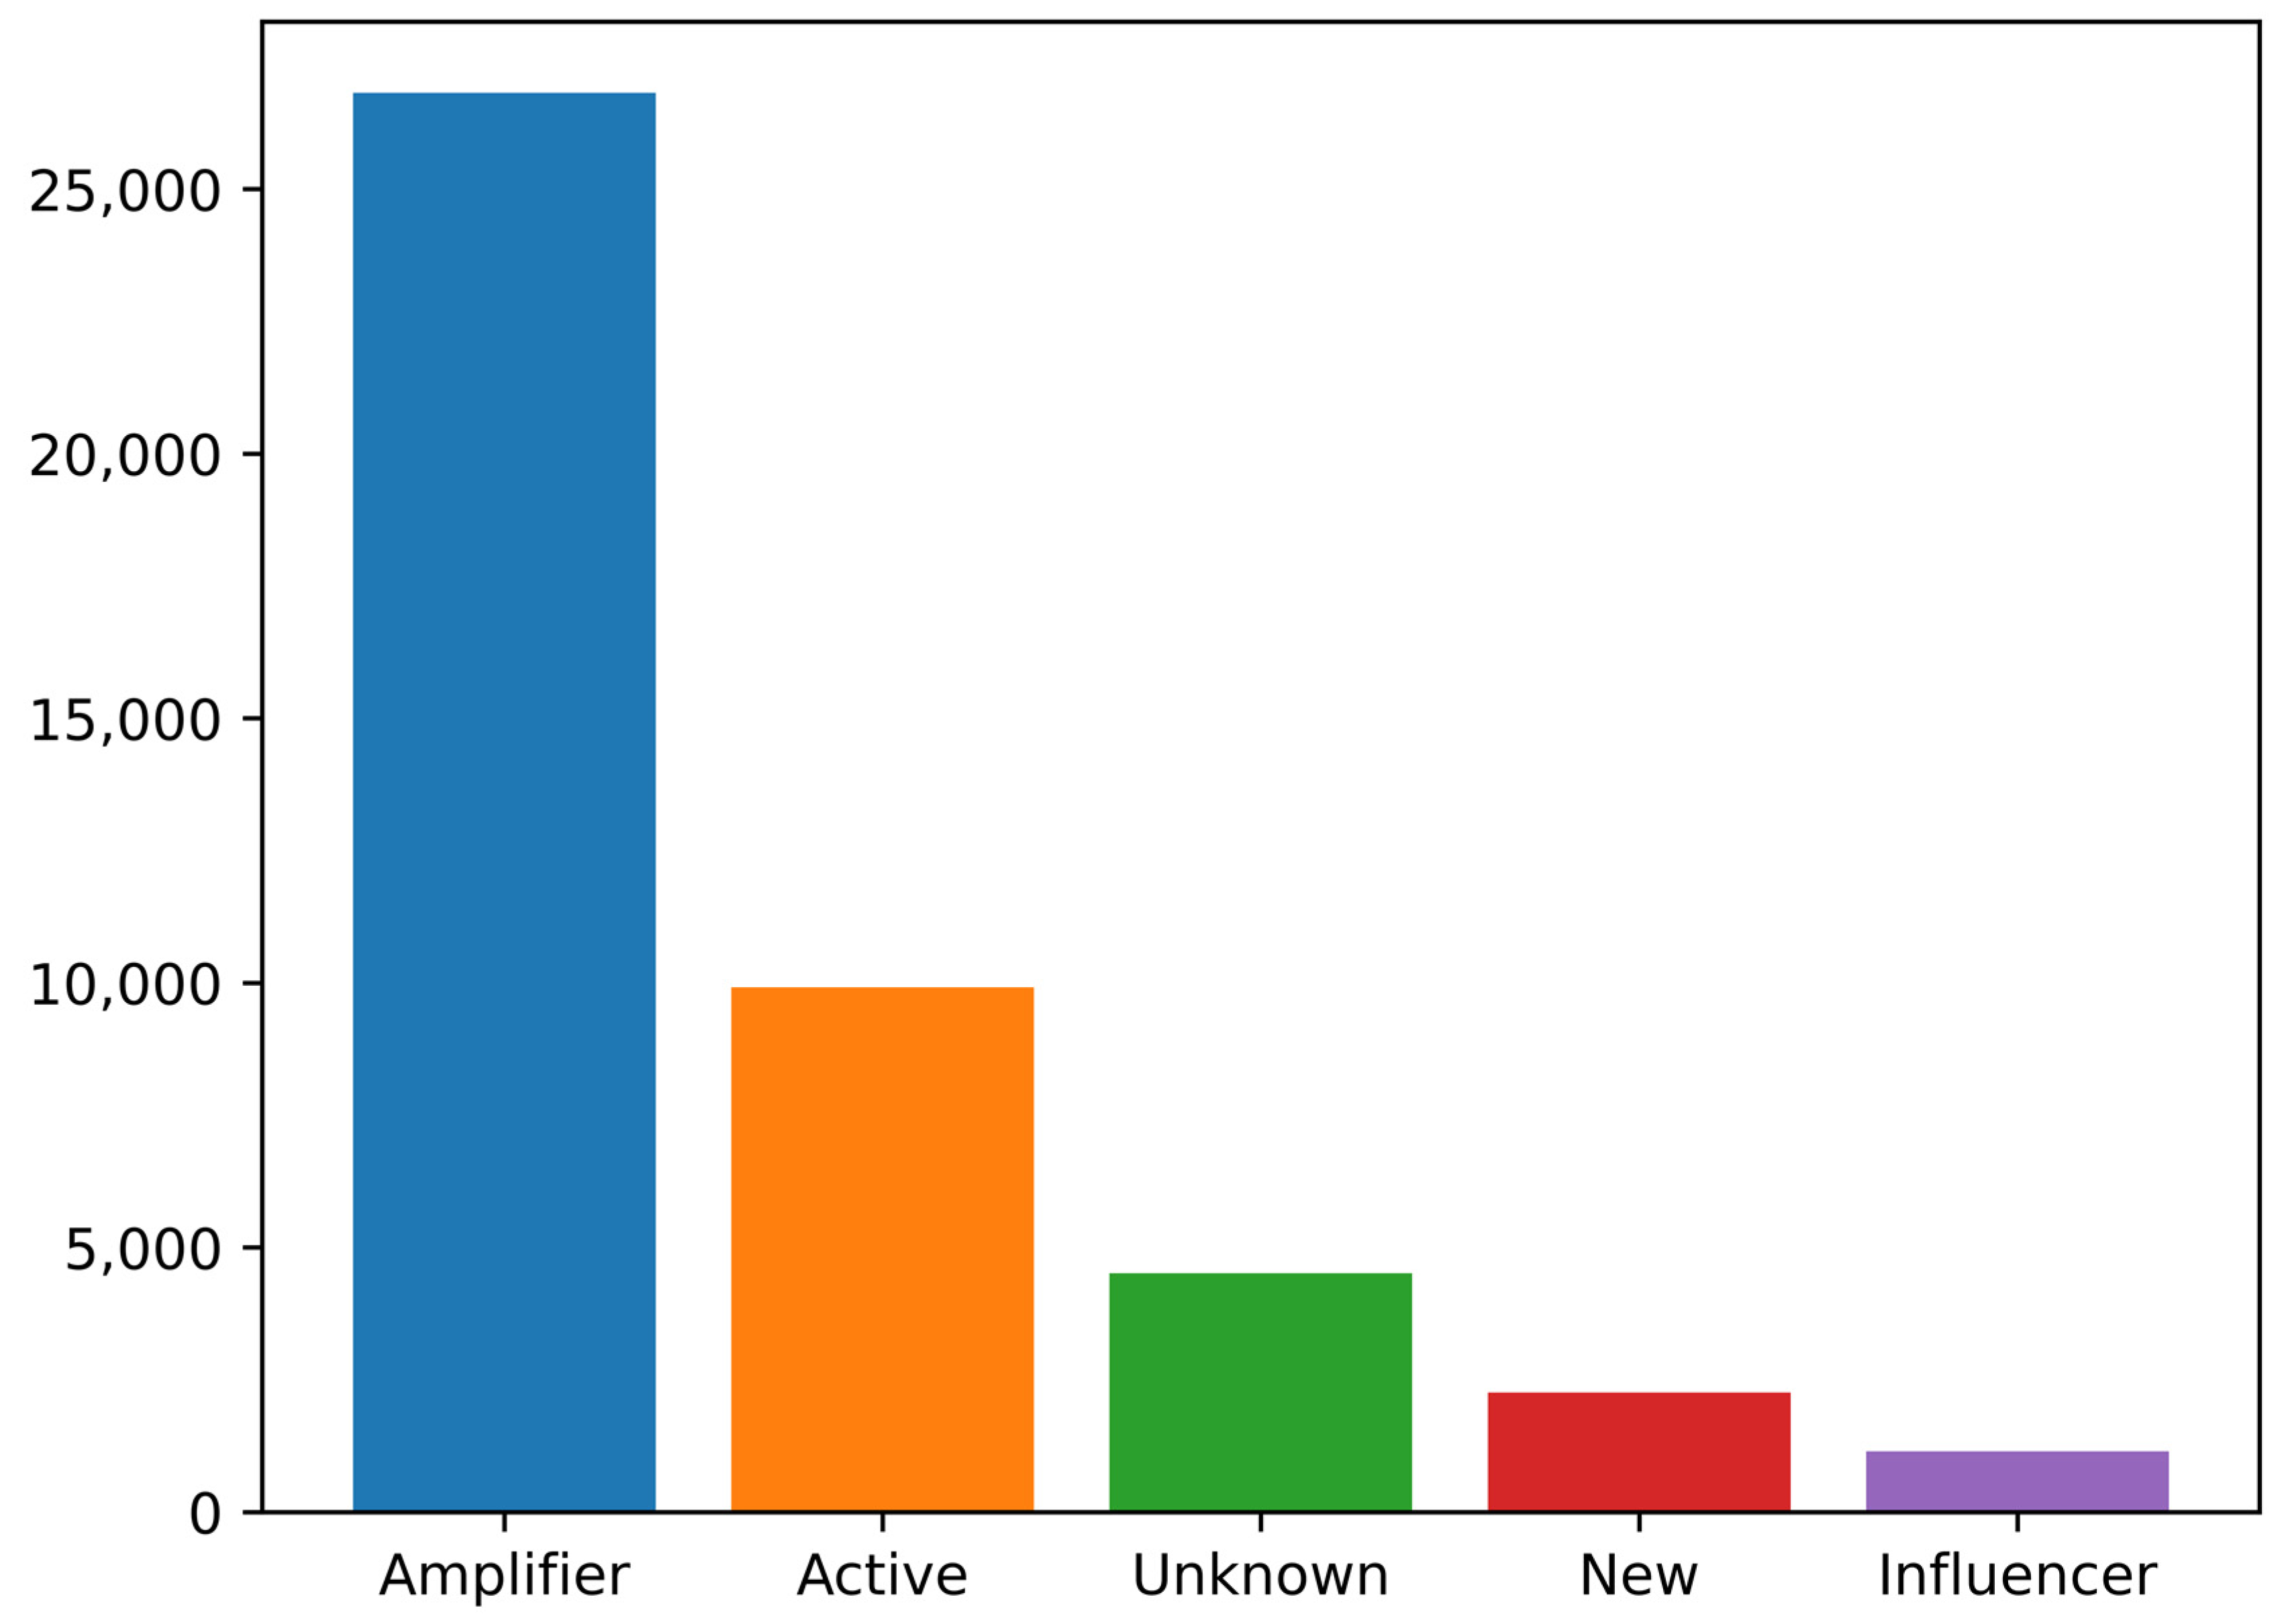
Figure 1. Distribution of account categories (amplifier, active, unknown, new, influencer) across the dataset. The bars represent the total number of accounts in each category for all countries.
Journalmedia 05 00060 g001
Figure 2. Distribution of account categories (amplifier, active, unknown, new, influencer) across countries (France, Italy, Germany, Greece). The bars represent the total number of accounts in each category for each country.
Journalmedia 05 00060 g002
Figure 3. Proportion of account categories within each country (France, Italy, Germany, Greece). Each pie chart displays the percentage distribution of amplifier, active, unknown, new, and influencer accounts for the respective country.
Journalmedia 05 00060 g003
Figure 4. The networks corresponding to the connections of political parties (colored nodes) with amplifiers (left column, black nodes) and active accounts (right column, purple nodes) within each country are presented. From top to bottom, the countries are Greece, Italy, France, and Germany.
Journalmedia 05 00060 g004
Figure 5. The networks corresponding to the cross-country connections of political parties (colored nodes) with amplifiers (black nodes) across Greece, Germany, Italy, and France are presented. The political ideologies are far-left (first row, left column), far-right (first row, right column), left (second row, left column), right (second row, right column), center-left (third row, left column), and center-right (third row, right column).
Journalmedia 05 00060 g005aJournalmedia 05 00060 g005b
Figure 6. The networks corresponding to the cross-country connections of political parties (colored nodes) with active accounts (purple nodes) across Greece, Germany, Italy, and France are presented. The political ideologies are far-left (first row, left column), far-right (first row, right column), left (second row, left column), right (second row, right column), center-left (third row, left column), and center-right (third row, right column).
Journalmedia 05 00060 g006aJournalmedia 05 00060 g006b
Table 1. Amplifiers and active users for each political party in Greece.
Political PartyAmplifierActive
Far-right4928
Center-right609300
Center-left9554
Left535253
Far-left995331
Table 2. Amplifiers and active users for each political party in Italy.
Political PartyAmplifierActive
Far-right50351489
Right7624
Center-right13087
Center-left34021228
Table 3. Amplifiers and active users for each political party in France.
Political PartyAmplifierActive
Far-right3102974
Right326116
Center-right23501063
Center-left1232658
Left2728970
Far-left2561692
Eurosceptic1552536
Table 4. Amplifiers and active users for each political party in Germany.
Political PartyAmplifierActive
Far-right546150
Right33691
Center-right1484424
Center-left32221257
Left1113256
Disclaimer/Publisher’s Note: The statements, opinions and data contained in all publications are solely those of the individual author(s) and contributor(s) and not of MDPI and/or the editor(s). MDPI and/or the editor(s) disclaim responsibility for any injury to people or property resulting from any ideas, methods, instructions or products referred to in the content.