Abstract
The detection of driver oncogenic variants and the recent identification of tumor-agnostic genomic biomarkers has driven the use of comprehensive genomic profiling (CGP) for disease diagnosis, prognosis, and treatment selection. The Oncomine™ Comprehensive Assay Plus (OCA+) panel uses DNA and RNA to detect single nucleotide variants (SNVs), small insertions/deletions (Indels), and structural variants (SVs) across 501 genes. Moreover, microsatellite instability (MSI), tumor mutational burden (TMB), and homologous recombination deficiency (HRD) status are assessed in a single workflow. Herein, we present the analytical validation and clinical utilization of OCA+. By using commercial reference materials, we found good analytical sensitivity, specificity, and precision for all biomarkers analyzed. The limit of detection (LoD) was validated for SNVs and Indels at 4%, except for Indels located in homopolymeric regions, where the LoD was 10%. An additional set of 81 tumor samples, including cytology smears, were sequenced to assess the clinical utility of the OCA+ across different tumor types. Among the clinical cohort, OCA+ demonstrated 100% accuracy, sensitivity, and specificity for all biomarkers analyzed, except for MSI assessment of endometrial cancer cases, where 83% accuracy and 67% sensitivity were achieved, compared to PCR and IHC. The validation of accuracy and robustness of this assay supports the OCA+’s utility for solid tumor CGP.
1. Introduction
The detection of genomic alterations using next-generation sequencing (NGS) technology in solid tumors has shown great clinical utility in the management of oncology patients. NGS testing is currently being used for prognosis as well as making treatment decisions involving molecular targeted therapies based on genomic information [1,2]. Moreover, NGS testing allows oncologists to better match patients with enrollment in available clinical trials [3]. As new molecular targeted therapies become available in clinical practice, detection of actionable gene variants and genomic signatures is becoming increasingly important in driving therapeutic decisions. In addition to detecting discrete oncogenic alterations, such as nucleotide variants (SNVs), small insertions and deletions (Indels), and structural variants (SVs), including copy-number variants (CNVs), gene deletions and/or duplications (Del/Dup), and gene fusions, comprehensive genomic profiling (CGP) allows the detection of integrative genomic signatures with documented prediction of drug response. Genomic signatures such as microsatellite instability (MSI) [4], tumor mutational burden (TMB) [5], or homologous recombination DNA-repair (HRR) deficiency (HRD) are increasingly being used in routine clinical management of patients with different cancer types. The use of HRD status to direct treatment in ovarian cancer patients has shown significant progression-free survival benefits in the PAOLA-1 clinical trial [6]. In addition, HRD status has also been shown to predict response to treatment in other cancer types. Metastatic prostate cancer patients harboring somatic HRR gene mutations (e.g., BRCA1, BRCA2, ATM, PALB2, FANCA, RAD51D, CHEK2, and CDK12) have been shown to benefit from inhibitors of DNA repair pathways, such as poly(ADP-ribose) polymerase inhibitors (PARPi) [7]. Likewise, comprehensive genomic testing that includes microsatellite instability (MSI), tumor mutational burden (TMB), BRCA1/2, HRD status [8], BRAF, RET fusions [9], and NTRK fusions has shown clinical utility in advanced and/or recurrent ovarian, fallopian tube, and peritoneal cancers. Results from the phase II KEYNOTE-158 study demonstrated a clinical benefit of anti-programmed death-1 therapy with pembrolizumab among patients with endometrial, gastric, cholangiocarcinoma, and pancreatic cancers whose tumors exhibit an MSI-high (MSI-H) [10] or TMB-high (TMB-H) (≥10 mut/Mb) phenotype [11].
TMB can be measured by using different NGS approaches, including whole-genome sequencing (WGS), whole exome sequencing (WES), or targeted panel sequencing. WES is the “gold standard” for measuring TMB, allowing for the calculation of somatic coding mutations (nonsynonymous) per 1,000,000 bases (1 Mb). While TMB can be accurately measured by WES, this approach is currently not practical in clinical settings due to its high cost, relatively long turnaround time, and the need for sufficient tissue sample. It is now accepted that gene panels designed to cover at least 0.80 Mb of coding sequence can be utilized for accurate TMB estimation [12]. The Oncomine™ Comprehensive Assay Plus (OCA+) covers 501 cancer-associated genes over 1.4 Mb of coding sequence, including 49 driver genes in over 1300 different inter- and intragenic fusions, detected from RNA paired samples. OCA+ also allows for the evaluation of MSI, TMB, and HRD status through genomic loss of heterozygosity (gLOH), telomeric allelic imbalance (TAI), and large-scale state transitions (LST) assessment in a single assay for an efficient workflow.
Formalin-fixed, paraffin-embedded (FFPE) tissue is commonly used in clinical settings due to its stability for long-term storage and versatility in terms of testing platforms that can be applied to this sample type. With the advent of fine-needle aspiration (FNA), the sample size for biomarker testing is typically small and the FFPE block is often exhausted before molecular testing can be attempted. Other sample types derived from the FNA procedure, such as cytology smears, have been shown to be suitable for molecular testing when FFPE blocks are exhausted [13,14,15].
Here, we present the analytical validation and clinical utility of OCA+ for performing CGP on a variety of solid tumor types. The assessment of SNVs, Indels, SVs, MSI, TMB, and HRD in a single assay, using up to 20 ng DNA and RNA, provides clinically relevant information on actionable biomarkers relevant to pathologists and oncologists in the management of cancer patients.
2. Materials and Methods
2.1. Sample Selection
To assess the analytical performance of the assay, reference materials (RM) and contrived samples, as well as previously tested patient samples with different assays in our laboratory or by other accredited reference laboratories, were analyzed. The orthogonal methods used for the detection of genomic variants on these samples include fluorescence in situ hybridization (FISH), allele-specific PCR (AS-PCR), and other NGS-based assays. Thus, the HapMap DNA NA12878 and NA19240 samples (Coriell Institute, Camden, NJ, USA), several different Seraseq® RM for DNA mutations, RNA Fusions, TMB and HRD (SeraCare®, LGC Clinical Diagnostics, Milford, MA, USA), as well as a positive control sample were tested using OCA+. The positive control sample consists of a mix of DNA isolated from FFPE blocks harboring DNA variants (SNVs and small Indels) at different variant allele frequencies (VAF) and includes variants a low VAF. In addition, we tested 22 tumor samples (10 MSI-stable (MSS) and 12 MSI-H), whose MSI status had been previously established in our laboratory by PCR using the MSI Analysis System, Version 1.2 (Promega, Madison, WI, USA) for accuracy. To evaluate the assay’s performance in clinical specimens, we tested 81 tumor samples (77 FFPE and 4 cytology smears) from various tumor types, with tumor content ranging from 5% to 90% as assessed by board-certified surgical pathologists (Supplementary Table S1), previously tested by different assays in our laboratory or in other accredited reference laboratories. This cohort was comprised of 36 (44%) biopsy specimens and 45 (56%) surgical excision specimens. For samples previously tested by other laboratories, a different FFPE block was used for nucleic acid extraction, since the original block was either exhausted or not available. Clinical patient samples included non-small cell lung cancer (NSCLC), colorectal cancer (CRC), endometrial cancer, ovarian cancer, breast cancer, prostate cancer, soft tissue sarcoma, bladder cancer, cervical cancer, gastric cancer, glioma, mammary analogue secretory carcinoma (MASC), and melanoma cases.
2.2. Nucleic Acid Isolation
All samples were reviewed by a pathologist in order to estimate the percent tumor nuclei and for macrodissection, if needed. Genomic DNA (gDNA) and total RNA were concomitantly isolated from each sample using the commercial MagMAX™ FFPE DNA/RNA Ultra Kit (Applied BiosystemsTM, Thermo Fisher Scientific, Waltham, MA, USA) in a semi-automated fashion on a KingFisher™ Duo Prime magnetic particle processor (Thermo Fisher Scientific, Waltham, MA, USA). Double-stranded DNA (dsDNA) was quantitated by fluorometry, as a measure of amplifiable DNA, as recommended by the manufacturer, using a Qubit Fluorometer with Qubit dsDNA HS Assay kit (InvitrogenTM, Thermo Fisher Scientific, Waltham, MA, USA). Similarly, RNA was quantitated using the Qubit RNA HS Assay kit (InvitrogenTM, Thermo Fisher Scientific, Waltham, MA, USA). All specimens included in this study yield measurable amounts of nucleic acids. Samples with less than the recommended 3 ng/µL of RNA and 2 ng/µL of DNA concentration were also considered.
2.3. Library Preparation and Next-Generation Sequencing
OCA+ is available as research use only (RUO) primer pools to be used for library preparation, which was performed in an automatic fashion using the Ion ChefTM (Thermo Fisher Scientific, Waltham, MA, USA) liquid handler according to manufacturer’s instructions MAN0018490 (Revision D.0). The Ion AmpliSeq™ Sample ID Panel (Thermo Fisher Scientific, Waltham, MA, USA), which is a human SNP genotyping panel, is included in OCA+ to track samples and possibly identify misassignment or mix up between samples and barcodes in a sequencing run. In general, multiplex PCR amplification was conducted using a nucleic acid concentration of approximately 20 ng as input. Deamination reaction was conducted using Uracil-DNA Glycosylase-heat labile (Thermo Fisher Scientific, Waltham, MA, USA) prior to polymerase chain reaction (PCR) amplification. For sequencing, prepared libraries were loaded according to manufacturer’s instructions, Ion 550™ Kit-Chef, MAN0017275 (Revision C.0) onto Ion 550™ Chips (Thermo Fisher Scientific, Waltham, MA, USA) using the Ion Chef™ liquid handler. Sequencing was performed on the Ion S5™XL Sequencer (Thermo Fisher Scientific, Waltham, MA, USA).
2.4. Bioinformatics Pipeline and Statistical Analyses
The data were mapped to the human genome assembly 19, as the standard reference genome. Coverage analysis reports from the Torrent Suite 5.16.1 software providing measurements of mapped reads, mean depth, uniformity of coverage, and alignment over a target region were used as quality assessment of the sequencing. We used the Ion Reporter™ Software (Thermo Fisher Scientific, Waltham, MA, USA) (v5.18), unless otherwise specified, with the Oncomine Comprehensive Plus-w2.3-DNA and Fusions-Single Sample analysis workflow for variant calling identification. Basically, variants with the following effects: missense, non-frameshift insertion, non-frameshift deletion, non-frameshift block substitution, nonsense, stop loss, frameshift insertion, frameshift deletion, frameshift block substitution, splice site 5′ or splice site 3′ location, and classified by ClinVar database (latest version 20201121) as pathogenic, likely pathogenic, risk factor, conflicting interpretations of pathogenicity, or other were filtered in. Tumor samples were not analyzed with paired-normal samples. Thus, potential germline variants were inferred and filtered out using the following parameters: in UCSC Common SNPs database [16], minor allele frequency (MAF) ≥ 10−6, 5000 exomes global MAF ≥ 10−6, and ExAC global population allele frequency (GAF) ≥ 10−6. Variants were ultimately classified using the tier-based system defined by a joint consensus recommendation of the Association for Molecular Pathology, American Society of Clinical Oncology, and College of American Pathologists [17]. MSI was assessed by covering 76 different markers, including the mononucleotides BAT25, BAT26, CAT25, MON27, NR21, NR22, NR24, and NR27. TMB was calculated by detecting somatic mutations only, in exonic regions, including SNVs, Indels, multiple nucleotide variants (MNVs) that cause missense, frameshift deletion, frameshift insertion, non-frameshift deletion, non-frameshift insertion, or nonsense mutations. HRD status was calculated using an algorithm that includes gLOH, TAI, and LST measurements. Pearson correlation analysis was performed for the correlation between two continuous datasets.
3. Results
3.1. Sequencing Performance
A typical sequencing run of the OCA+ assay performed on the S5 XL sequencer, consists of four samples per Ion 550TM chip. In order to establish sequencing quality control (QC) metrics, a total of 12 samples were sequenced in three separate runs/chips (four samples per chip). Four critical sequencing QC parameters per sample were recorded as follows: the mapped reads > 10 million, mean depth > 1000X, on-target coverage > 95%, and uniformity of coverage > 92% (Figure 1).
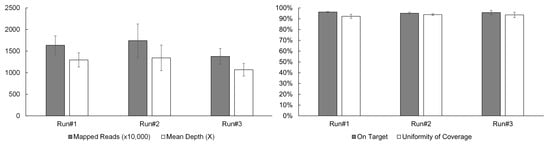
Figure 1.
OCA+ sequencing QC metrics include mapped reads, mean depth, on-target coverage, and uniformity of coverage.
3.2. Accuracy
3.2.1. SNVs and Indels
Accuracy was determined by sequencing well-characterized samples, including the HapMap DNA NA12878 and NA19240 samples, and comparing the VCF files obtained from the publicly available source, the Genetic Testing Reference Materials (GeT-RM) (https://www.cdc.gov/labquality/get-rm/index.html) browser at NCBI (accessed on 1 February 2022). Of the 1,424,145 bases covered by OCA+, 148,245 bases aligned to exonic regions where variants have been reported for these two reference samples, as found by whole-genome sequencing (WES). Thus, we found 1408 exonic variants for the NA12878 sample, which has 1407 variants in those regions according to GeT-RM, with one artifact detected by OCA+, corresponding to a sensitivity of 100.0% (95% CI 99.7% to 100.0%) and a specificity of 100.0% (95% CI 100.0% to 100.0%). For the NA19240 sample, we found 1477 exonic variants; the NA19240 sample has 1473 variants in those regions according to GeT-RM. Thus, OCA+ identified two false positive variants and two artifacts, corresponding to a sensitivity of 100.0% (95% CI 99.8% to 100.0%) and a specificity of 100.0% (95% CI 100.0% to 100.0%). Our results showed error rates of 0.001% and 0.003% for the HapMap NA12878 and NA19240 DNA samples, respectively.
Several replicates of the positive control sample corresponding to DNA mixes isolated from FFPE blocks harboring DNA variants (SNVs and small Indels) were tested using OCA+, obtaining 100% accuracy and excellent correlation (ρ = 0.995) with previously obtained values on a different NGS-based assay performed in our laboratory (Table 1).

Table 1.
Accuracy study using the FFPE positive control sample.
3.2.2. Gene Fusions
Accuracy for the detection of gene fusions was determined by sequencing the Seraseq® Fusion RNA Mix v4 (SeraCare®, LGC Clinical Diagnostics, Milford, MA, USA) material (Table 2). All 18 gene fusions present in the Seraseq® Fusion RNA Mix were detected, resulting in an accuracy of 100%.
Table 2.
Accuracy study using the Seraseq® Fusion RNA Mix v4 sample.
3.2.3. CNVs
Accuracy of copy number variants (CNVs) detection by OCA+ was assessed by comparing the ERBB2 gene fold (×) obtained from three breast cancer samples previously tested by FISH in reference laboratories (Table 3).
Table 3.
CNV accuracy on FFPE breast cancer samples.
3.2.4. MSI
MSI status based on the OCA+ MSI score was used to classify samples as MSI-H or MSS. Accuracy of the OCA+ MSI score was assessed by running 12 MSI-H and 10 MSS samples, as previously assessed by PCR, and by immunohistochemistry (IHC) for mismatch repair (MMR) deficiency (dMMR) or proficiency (pMMR). The samples included 10 gastrointestinal (GI) tumors samples (one gastric cancer + nine CRC) and 12 endometrial cancer (EC) specimens. The MSI scores were significantly different between MSI-H/dMMR and MSS/pMMR cases, but a significant difference (one-sided p-value = 0.0042) was observed between different MSI-H tumor types; with GI cases showing much higher MSI scores than MSI-H EC cases (Figure 2) (numerical data included in Supplementary Table S1).
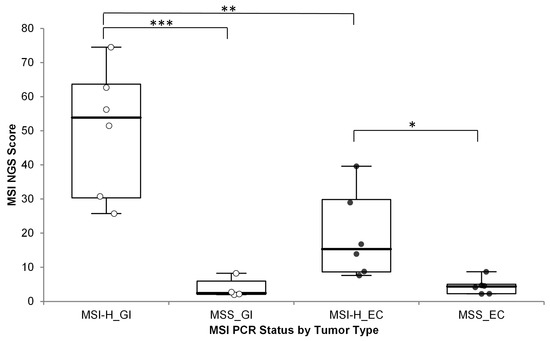
Figure 2.
OCA+ MSI score distribution by tumor type compared to MSI status by PCR. *** p < 0.001; ** p < 0.005; * p < 0.05; GI: gastrointestinal cancer (white dots); EC: endometrial cancer (black dots).
Thus, different MSI score cutoff values were established. Cutoff values of 19 and 11 were established for GI and EC tumors, respectively.
3.2.5. TMB and HRD
Accuracy for TMB and HRD scores was assessed by running several replicates of the Seraseq® Reference Materials (RM) for both genomic signature biomarkers, obtaining highly correlated values (ρ > 0.9) (Table 4). The Seraseq® FFPE HRD RM samples are annotated with a genomic instability score (GIS) calculated by the Myriad Genetics algorithm, as licensed by SeraCare® Life Sciences.
Table 4.
Accuracy study using Seraseq® Reference Materials.
3.3. Limit of Detection
3.3.1. SNVs and Indels
The Seraseq™ Solid Tumor Mutation Ladder-II (SeraCare®, LGC Clinical Diagnostics, Milford, MA, USA) was sequenced to assess the capacity of OCA+ for detecting variants at low VAF. The SeraseqTM Solid Tumor Mutation Ladder-II includes 36 variants, including 11 Indels and 25 SNVs, of which 5 occur in homopolymeric (HP) regions at low VAF (Table 5). OCA+ was able to call variants down to 4% allelic fraction. However, of the 36 variants, 2 (5.6%) Indels from HP regions were not called by OCA+, resulting in a limit of detection (LoD) of 4% for SNVs and small Indels, except when located in HP regions, where the LoD is 10%.
Table 5.
SNVs and Indels LoD.
3.3.2. Gene Fusions
Unlike the DNA variants, assessment of LoD for RNA variants can be challenging. To address this, we performed serial dilutions of the Seraseq® Fusion RNA Mix v4 in total RNA isolated from a normal sample (i.e., no containing fusions) and tested each dilution in triplicate. All 18 fusions were detected at each dilution point. The dilutions, in percentage, were correlated with the number of read counts measured by OCA+. The linearity illustrates the overall robustness of the assay for identification of fusions in specimens that may harbor a wide linear range of fusion transcripts. Notably, the fusion with the lower number of reads in the mix, the intragenic EGFR fusion corresponding the EGFRvIII isoform, showed the poorest linearity compared to those with higher read counts (Figure 3).
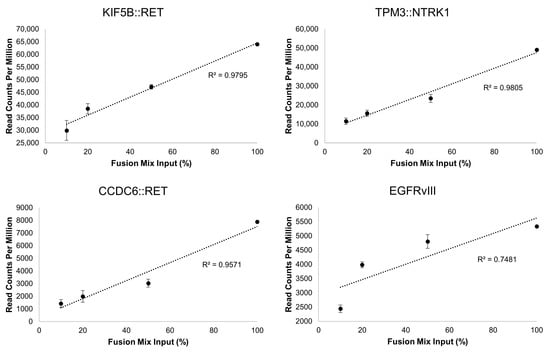
Figure 3.
Representative gene fusion correlations between dilutions of the Seraseq® Fusion RNA Mix v4 and the read counts obtained with OCA+. The dilutions span from 100% (undiluted) to 10% (1 in 10 dilution) of the Fusion Mix in total RNA from a normal sample.
3.4. Precision
3.4.1. SNVs and Indels
Repeatability (intra-assay variation) for DNA variants was assessed by sequencing three technical replicates (i.e., same library) of the FFPE DNA positive control in separate chips. Reproducibility (inter-assay variation) was assessed by preparing libraries and sequencing the FFPE DNA positive control on three separate days (Table 6).
Table 6.
Precision for SNVs and Indels.
3.4.2. Gene Fusions
Similarly, repeatability of RNA fusion detection was assessed by sequencing three technical replicates (i.e., same library) of the Seraseq™ Fusion RNA Mix v4 material in separate chips, obtaining coefficients of variation (CVs) ranging from 2.1 to 10.4%. Reproducibility was assessed by preparing libraries and sequencing the Seraseq™ Fusion RNA Mix v4 material on three separate days, obtaining CVs ranging from 6.5 to 52.5% (Supplementary Table S2).
3.4.3. CNVs and Genomic Signatures
Repeatability for CNVs and genomic signatures, such as TMB, MSI, and HRD, was assessed by sequencing nine patient samples harboring CNVs, MSI, TMB, and LOH at different levels in triplicate within the same chip. Reproducibility was assessed by preparing libraries and sequencing the same nine patient samples on three separate days by different medical technologists (Table 7).
Table 7.
Precision for CNVs and genomic signatures.
3.5. Performance on Clinical Specimens
3.5.1. SNVs and Indels
Thirty-three different tumor samples (30 FFPE and 3 cytology smears) corresponding to melanoma, soft tissue sarcoma, NSCLC, CRC, ovarian, bladder, cervical, gastric, and prostate cancer specimens, with tumor content ranging from 5% to 80%, were analyzed. We detected 127 DNA sequence variants (96 SNVs and 31 Indels) in 58 different genes. The OCA+ VAFs were compared to those obtained by reference laboratories (most of them performed on different tissue blocks), when reported, or those found by orthogonal methods in our laboratory. Thus, we observed a good correlation (ρ = 0.921) and a linear relationship between VAF values obtained with OCA+ and the reference methods, with a slope and y-intercept of 1.03 (95% CI 0.94 to 1.12) and −0.23 (95%CI −3.34 to 2.88), respectively (Figure 4). It is worth noting that, even though a good correlation was observed in VAF values (ρ > 0.9), a lower proportion of variance (R2 = 0.849) was observed, which could be due to tissue and tumor histologic heterogeneity in different specimen aliquots.
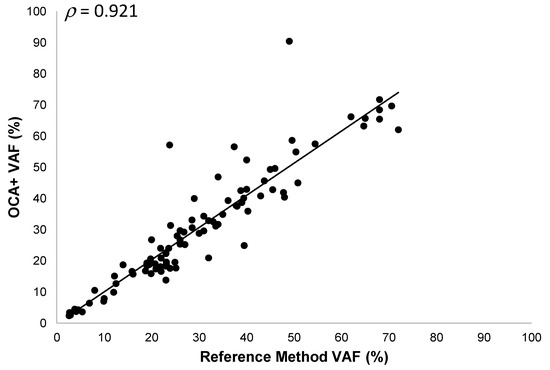
Figure 4.
Pearson correlation between OCA+ VAFs and those obtained by reference laboratories and/or orthogonal methods.
Based on the results obtained from these clinical specimens, we determined that OCA+ performs with 100.0% accuracy (95% CI, 97.3% to 100.0%), 100.0% sensitivity (95% CI, 95.8% to 100.0%), and 100.0% specificity (95% CI, 92.5% to 100.0%) for the detection of SNVs.
Likewise, OCA+ performs with 100.0% accuracy (95% CI, 95.7% to 100.0%), 100.0% sensitivity (95% CI, 85.8% to 100.0%), and 100.0% specificity (95% CI, 94.0% to 100.0%) for the detection of small Indels.
3.5.2. CNVs
Sixteen different tumor FFPE samples corresponding to glioma, soft tissue sarcoma, NSCLC, CRC, breast, ovarian, and bladder cancer specimens, with tumor content ranging from 50% to 90%, were analyzed. We detected 34 CNVs (18 gains and 16 losses) on 18 different genes and 3 chromosome/arms. The OCA+ CNV folds (×) were compared to those obtained by reference laboratories, which ranged from 3× to 40× for gains and from 0× to 1× for losses, as assessed by either NGS-based assays or FISH testing. Notably, blocks older than 5 years showed extremely high CNVs for ERBB2 by OCA+ compared to Her2 FISH results. This may be due to highly degraded DNA from archived specimens as reflected by the median of the absolute values of all pairwise differences (MAPD) metric. MAPD is an estimate of coverage variability between adjacent amplicons and it is used as a quality control (QC) criteria to assess CNV call confidence. Thus, we had established a cutoff of MAPD ≤ 0.3, and samples showing an MAPD above this value should be interpreted with lower confidence. Those samples are indicated with an asterisk in Figure 5.
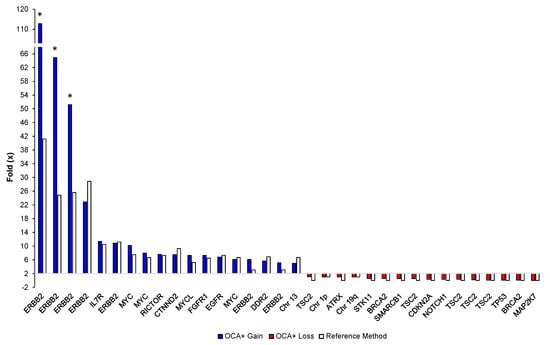
Figure 5.
Comparison of OCA+ CNV folds (×) with those obtained by reference laboratories and/or orthogonal methods per gene/sample. Asterisks indicate highly degraded samples.
Even though these samples had MAPD > 0.3, the ERBB2 gene amplification was clearly visible in the copy number profile for chromosome 17 (Figure 6a) in these cases. Interestingly, OCA+ was able to detect the hemizygous deletion on chromosomes 1p and 19q in an oligodendroglioma sample (Figure 6b), which had been previously detected by FISH. That sample also harbored IDH1 p.R132H and CIC p.R201W somatic mutations, which have been reported to be an intrinsic abnormality in the majority of oligodendrogliomas [18].
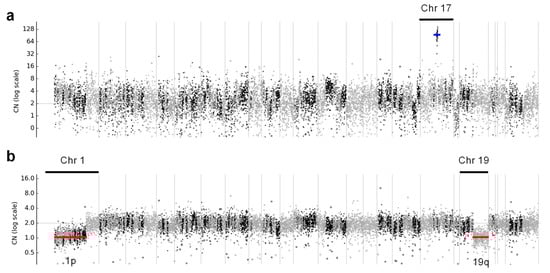
Figure 6.
Copy number profiles across all chromosomes, where (a) shows ERBB2 gene amplification in a breast cancer case, indicated with a blue line, and (b) shows hemizygous deletions of chromosome 1p and 19q arms in an oligodendroglioma case, indicated with red lines.
Based on the results obtained from these clinical specimens, we determined that OCA+ performs with 100.0% accuracy (95% CI, 96.0% to 100.0%), 100.0% sensitivity (95% CI, 89.7% to 100.0%), and 100.0% specificity (95% CI, 93.6% to 100.0%) for the detection of CNVs.
3.5.3. Gene Fusions
Twenty different tumor samples (19 FFPE and 1 cytology smear) corresponding to MASC, NSCLC, and prostate cancer specimens, with tumor content ranging from 5% to 85%, were analyzed. These samples had previously been tested for the presence of gene fusions by either FISH or NGS-based assays in reference laboratories and/or in our laboratory using a different NGS-based assay. OCA+ was able to correctly detect the gene fusions in this cohort, including in small samples and those with low tumor content (Table 8).
Table 8.
OCA+ gene fusion detection in clinical specimens.
Based on the results obtained from these clinical specimens, we determined that OCA+ performs with 100.0% accuracy (95% CI, 95.4% to 100.0%), 100.0% sensitivity (95% CI, 79.4% to 100.0%), and 100.0% specificity (95% CI, 94.2% to 100.0%) for the detection of CNVs.
3.5.4. TMB and MSI
Fifteen different tumor FFPE samples corresponding to NSCLC, CRC, soft tissue sarcoma, prostate, bladder, ovarian, and cervical cancer specimens, with tumor content ranging from 25% to 80%, were analyzed. These samples had previously been tested for TMB by reference laboratories and were classified as TMB-L (nine cases) or TMB-H (six cases). The OCA+ TMB scores were compared to those obtained by these reference laboratories on different tissue blocks from the same tumor sample. Thus, we observed a good correlation (ρ = 0.911) between TMB scores obtained with OCA+ and those reported by reference laboratories. Moreover, using a cutoff of 10 mut/Mb, the samples were assigned to the same class (TMB-L or TMB-H) by OCA+ (Figure 7). It is worth noting that, even though a good correlation was observed in TMB values (ρ > 0.9), a lower proportion of variance (R2 = 0.829) was observed, which could be due to tissue and tumor histologic heterogeneity in different specimen aliquots.
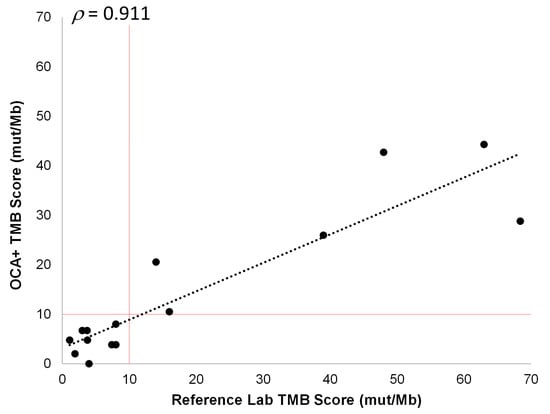
Figure 7.
Pearson correlation between OCA+ TMB score and those obtained by reference laboratories. The cutoff value of 10 mut/Mb is indicated by vertical and horizontal red lines.
It has been previously reported that the vast majority (83%) of MSI-H tumors also have high TMB, and 97% of them have TMB ≥ 10 mut/Mb, even though the converse is not true [19]. Therefore, we analyzed the 22 samples with known MSI status previously described (Section 3.2.4), and we observed a significant (one-sided p < 0.0001) difference in TMB scores between MSI-H and MSS cases (Figure 8).
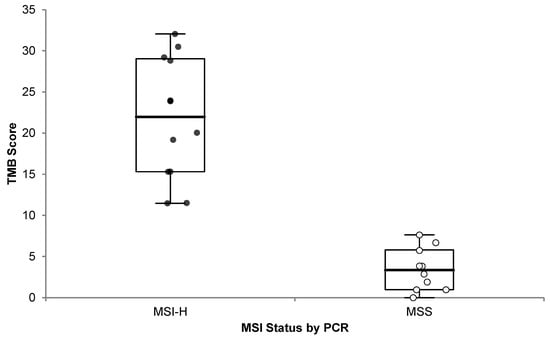
Figure 8.
OCA+ TMB score distribution compared to MSI status by PCR. Microsatellite Instability High (MSI-H; black dots) and Microsatellite Stable (MSS; white dots) cases are plotted.
In addition, we observed that the correlation between TMB values and MSI scores varied among different tumor types, gastrointestinal (GI), endometrial, and ovarian cancers being the most correlated and lung adenocarcinoma the least correlated (Figure 9).
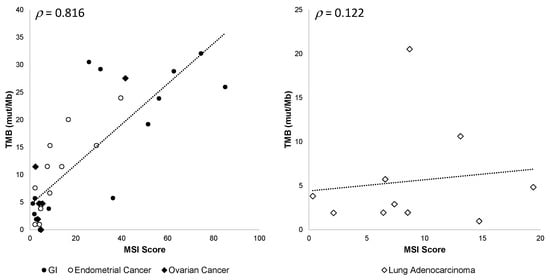
Figure 9.
OCA+ TMB and MSI score correlation among different tumor types. Pearson’s ρ correlation coefficients are shown.
Based on the results obtained on these clinical specimens, we determined that OCA+ performs with 100.0% accuracy (95% CI, 75.3% to 100.0%), 100.0% sensitivity (95% CI, 47.8% to 100.0%), and 100.0% specificity (95% CI, 63.1% to 100.0%) for TMB assessment.
On the other hand, we observed that the distribution of MSI scores varied depending on the tumor type. Thus, OCA+ performs with 100.0% accuracy (95% CI, 83.9% to 100.0%), 100.0% sensitivity (95% CI, 63.1% to 100.0%), and 100.0% specificity (95% CI, 75.3% to 100.0%) for MSI assessment for GI tumors; whereas it performs with 83.3% accuracy (95% CI, 51.6% to 97.9%), 66.7% sensitivity (95% CI, 22.3% to 95.7%), and 100.0% specificity (95% CI, 54.1% to 100.0%) for MSI assessment for EC tumors.
3.5.5. HRD
Twenty different tumor FFPE samples corresponding to CRC, bladder, ovarian, and cervical cancer specimens, with tumor content ranging from 30% to 80%, were analyzed. Eleven of those samples had previously been tested for HRD status by reference laboratories on different tissue blocks, using different approaches. Some laboratories assessed HRD status by %LOH, using a cutoff of 16% [20]; others used the presence of BRCA1/2 gene mutations and/or a genomic instability score (GIS) equal or greater than 42 [21] to classify a sample as HRD-positive (HRD-POS), as opposed to HRD-negative (HRD-NEG). It is worth noting that mutations found in some HRR DNA repair pathway genes (e.g., ATM, ATR, FANC/A/D2/M/G, and PALB2) may not necessarily yield high HRD scores [22]. In order to calculate an HRD score, the gLOH, TAI, and LST parameters were normalized by the average copy number () of the sample. In order to be able to compare these parameters to those obtained by reference laboratories, the Seraseq HRD-High RM, with a GIS = 72, was used as a reference. Thus, we compared the OCA+ normalized gLOH (nLOH) or the OCA+ calculated HRD score to those reported by reference laboratories, obtaining a good correlation overall (ρ = 0.965) (Table 9).
Table 9.
HRD classification of clinical specimens.
In addition, a new version of the bioinformatics pipeline in the Ion Reporter™ Software (v5.20) calculates a genomic instability metric (GIM) with a cutoff ≥ 16 to classify a sample as HRD-POS. GIM values showed a good correlation with calculated HRD scores (ρ = 0.958) (Table 10).
Table 10.
HRD score correlation with genomic instability metric (GIM).
Based on the results obtained from these clinical specimens, we determined that OCA+ performs with 100.0% accuracy (95% CI, 83.2% to 100.0%), 100.0% sensitivity (95% CI, 39.8% to 100.0%), and 100.0% specificity (95% CI, 79.4% to 100.0%) for HRD assessment.
4. Discussion
Molecular targeted therapies, immune checkpoint inhibitors, and poly(ADP-ribose) polymerase inhibitors are increasingly being used in oncology, resulting in improved survival rates in patients with various cancer types. NGS-based testing to guide therapeutic decisions is now standard-of-care in the management of oncology patients and it may also assist in treatment selection by identifying additional biomarkers when there are few or no options for them [23]. In the past decade, NGS assays with a variety of numbers of genes for tumor profiling have been introduced, intended for the detection of actionable variants to an ever-growing list of targeted therapies. As newer treatment approaches emerge and less invasive procedures yield smaller tissue samples for pathological analyses, complex genomic biomarkers have become clinically relevant, calling for genomic testing to be performed in a single test. In order to be clinically effective, comprehensive genomic profiling (CGP) should allow for the detection of DNA variants, including structural variants such as gene fusions, which can be better assessed using RNA-based testing [24], as well as genomic signatures, such as microsatellite instability (MSI), tumor mutational burden (TMB), and homologous recombination deficiency (HRD) [25]. In a previous study by Vestergaard et al., the implementation and validation of OCA+ was performed on a limited number of FFPE samples and tumor types and it was conducted as a comparison against a previous version of the assay, the Oncomine™ Comprehensive Assay v3 (OCAv3). In that report, the validation of MSI, TMB, and HRD was not addressed [26].
In this study, the performance characteristics of a CGP test, the Oncomine™ Comprehensive Assay Plus (OCA+), were validated by using reference materials and comparing patient sample results to those obtained by reference laboratories and orthogonal methods. In clinical settings, NGS-based testing is usually performed on diagnostic samples, which may include small core biopsy or FNA samples. The latter often lead to a sizeable rate of quantity not sufficient (QNS) results, varying from 18% [27] to 30% [28], mostly for lung cancer specimens. Thus, we included FFPE tissue blocks as well as cytology smears made from FNA samples in our validation. Of the 81 clinical specimens analyzed, 14% had less than the recommended nucleic acid concentration for sequencing and 9% had a tumor content less than 20% but were still considered for the study. OCA+ QC metrics for these small samples were acceptable and the variant results were in agreement with those obtained by reference laboratories and/or orthogonal methods. Thus, OCA+ enables the detection of actionable variants in low-quality/low-quantity DNA samples as well as low tumor content specimens. Accordingly, the limit of detection was found to be 4% for SNVs and small Indels (other than those found in homopolymeric regions, which was 10%). From our clinical sample cohort, OCA+ was able to detect CNV gains as low as 3× and gene fusions in samples containing as little as 5% neoplastic nuclei.
Besides clinically relevant variants, OCA+ is able to detect actionable genomic biomarkers, such as MSI, TMB, and HRD. Both MSI and TMB are genomic instability biomarkers predictive of response to immune checkpoint inhibitors (ICI) in a tumor-agnostic fashion. [29,30]. In agreement with previously published studies [18], we observed a good correlation between MSI-H tumors and TMB-H status; however, that correlation varied among different tumor types, GI, EC, and ovarian tumors being the most correlated and NSCLC tumors the least correlated, as has been previously reported [31].
OCA+ demonstrated a 100% accuracy, sensitivity, and specificity for MSI classification for GI cases, which showed 100% agreement between OCA+ and PCR, as well as MMR by IHC results. On the other hand, MSI classification for EC cases showed 83% accuracy and 67% sensitivity. This is in agreement with previously reported differences in MSI profiles between CRC and EC specimens, where the number of nucleotide (nt) shifts observed in MSI-H EC cases is 1–3 nt, as opposed to 6 nt in CRC cases [32]. Historically, testing for MSI by PCR or NGS-based assays has been validated for GI tumors in general and CRC in particular [33,34]. While IHC has shown 100% sensitivity in detecting dMMR CRC and EC cases, molecular methods have been reported to have a decreased sensitivity (from 58% to 75%, depending on the methodology) for EC compared to CRC [35]. Thus, OCA+ is performing as expected for this particular biomarker. Therefore, we conclude that dMMR detection in EC would benefit from a combination of IHC and molecular testing.
From our clinical sample cohort, OCA+ was able to classify samples as TMB-H or TMB-L with 100% accuracy when compared to reference laboratories using different NGS-based assays. The use of reference materials also allowed us to confirm that the assay renders comparable TMB values. This is crucial when using a cutoff value, i.e., 10 mut/Mb, to determine TMB status for pembrolizumab treatment in cancer patients [11].
PARPi have been recognized as an effective therapy for the treatment and maintenance of BRCA-mutated cancers and/or HRD-positive ovarian cancer, regardless of germline or somatic BRCA1/2 gene mutation status. HRD classification depends on different genomic instability cutoff values for markers, such as %LOH [20], or a GIS arising from gLOH, TAI, and LST [21], as developed by different reference laboratories. From our clinical samples cohort, OCA+ was able to classify samples as positive or negative for HRD with 100% accuracy when compared to reference laboratories, either by normalized gLOH (nLOH) or by a calculated HRD score, in samples containing 30% or more neoplastic nuclei. The use of reference materials allowed us to confirm that OCA+-calculated HRD score is comparable to Myriad’s myChoice® GIS (Myriad Genetics Inc., Salt Lake City, UT, USA). In addition, the genomic instability metric (GIM) obtained with the bioinformatics pipeline v5.20 also resulted in 100% concordance in HRD classification with the calculated HRD score using the bioinformatics pipeline v5.18.
In summary, our results show that OCA+ offers an optimal and labor-efficient workflow that combines DNA/RNA gene variant and fusion detection with MSI, TMB, and HRD assessment in a single semi-automated assay. These features are even more important when small biopsy samples or cytology smears are submitted for comprehensive genomic profiling in clinical settings.
Supplementary Materials
The following supporting information can be downloaded at: https://www.mdpi.com/article/10.3390/jmp4020012/s1, Table S1: List of clinical specimens; Table S2: Gene fusion precision data.
Author Contributions
Conceptualization, C.I.D. and J.A.A.; Data curation, R.K.; Formal analysis, C.I.D. and J.A.A.; Resources, J.H.H.; Validation, K.E.B., K.R.D., C.F., F.Z.I. and N.A.S.; Writing—original draft, C.I.D.; Writing—review & editing, C.I.D., R.K., J.A.A., S.R., D.P. and J.H.H. All authors have read and agreed to the published version of the manuscript.
Funding
This research received no external funding.
Institutional Review Board Statement
The study was conducted according to the guidelines of the Declaration of Helsinki and approved by the Western Institutional Review Board (WIRB) Copernicus Group (WCG) IRB (Study Number: 1334795 and date of approval: 22 June 2022).
Informed Consent Statement
Patient consent was waived by WCG IRB as the Board found that this research meets the requirements for a waiver of consent under 45 CFR 46 116 ((f) (2018 Requirements) 45 CFR 46.116 (d) (Pre-2018 Requirements)), since the study will use existing data/sample collection.
Data Availability Statement
The data presented in this study are available within the article.
Acknowledgments
The authors would like to thank Mark Wikstrom and Rick Curtis for their support in specimen selection for this study. We are grateful to Jean Benhattar, Stéphanie Bougel, and Marta Cotado for their insightful discussions.
Conflicts of Interest
The authors declare no conflict of interest.
References
- Herbst, R.S.; Morgensztern, D.; Boshoff, C. The biology and management of non-small cell lung cancer. Nature 2018, 553, 446–454. [Google Scholar] [CrossRef] [PubMed]
- Biller, L.H.; Schrag, D. Diagnosis and Treatment of Metastatic Colorectal Cancer: A Review. JAMA 2021, 325, 669–685. [Google Scholar] [CrossRef] [PubMed]
- Salama, A.K.S.; Li, S.; Macrae, E.R.; Park, J.-I.; Mitchell, E.P.; Zwiebel, J.A.; Chen, H.X.; Gray, R.J.; McShane, L.M.; Rubinstein, L.V.; et al. Dabrafenib and Trametinib in Patients With Tumors With BRAF V600E Mutations: Results of the NCI-MATCH Trial Subprotocol H. J. Clin. Oncol. 2020, 38, 3895–3904. [Google Scholar] [CrossRef] [PubMed]
- Chakravarty, D.; Solit, D.B. Clinical cancer genomic profiling. Nat. Rev. Genet. 2021, 22, 483–501. [Google Scholar] [CrossRef]
- Rizvi, N.A.; Hellmann, M.D.; Snyder, A.; Kvistborg, P.; Makarov, V.; Havel, J.J.; Lee, W.; Yuan, J.; Wong, P.; Ho, T.S.; et al. Cancer immunology. Mutational landscape determines sensitivity to PD-1 blockade in non-small cell lung cancer. Science 2015, 348, 124–128. [Google Scholar] [CrossRef]
- Ray-Coquard, I.; Pautier, P.; Pignata, S.; Pérol, D.; González-Martín, A.; Berger, R.; Fujiwara, K.; Vergote, I.; Colombo, N.; Mäenpää, J. Olaparib plus Bevacizumab as First-Line Maintenance in Ovarian Cancer. N. Engl. J. Med. 2019, 381, 2416–2428. [Google Scholar] [CrossRef]
- Mateo, J.; Porta, N.; Bianchini, D.; Ursula McGovern, U.; Elliott, T.; Jones, R.; Syndikus, I.; Ralph, C.; Jain, S.; Varughese, M. Olaparib in patients with metastatic castration-resistant prostate cancer with DNA repair gene aberrations (TOPARP-B): A multicentre, open-label, randomised, phase 2 trial. Lancet Oncol. 2020, 21, 162–174. [Google Scholar] [CrossRef]
- Hodgson, D.R.; Dougherty, B.A.; Lai, Z.; Fielding, A.; Grinsted, L.; Spencer, S.; O’Connor, M.J.; Ho, T.W.; Robertson, J.D.; Lanchbury, J.S.; et al. Candidate biomarkers of PARP inhibitor sensitivity in ovarian cancer beyond the BRCA genes. Br. J. Cancer 2018, 119, 1401–1409. [Google Scholar] [CrossRef]
- Subbiah, V.; Wolf, J.; Konda, B.; Kang, H.; Spira, A.; Weiss, J.; Takeda, M.; Ohe, Y.; Khan, S.; Ohashi, K.; et al. Tumour-agnostic efficacy and safety of selpercatinib in patients with RET fusion-positive solid tumours other than lung or thyroid tumours (LIBRETTO-001): A phase 1/2, open-label, basket trial. Lancet Oncol. 2022, 23, 1261–1273. [Google Scholar] [CrossRef]
- Marabelle, A.; Le, D.T.; Ascierto, P.A.; Di Giacomo, A.M.; De Jesus-Acosta, A.; Delord, J.P.; Geva, R.; Gottfried, M.; Penel, N.; Hansen, A.R.; et al. Efficacy of Pembrolizumab in Patients With Noncolorectal High Microsatellite Instability/Mismatch Repair–Deficient Cancer: Results From the Phase II KEYNOTE-158 Study. J. Clin. Oncol. 2020, 38, 1–10. [Google Scholar] [CrossRef]
- Marcus, L.; Fashoyin-Aje, L.A.; Donoghue, M.; Yuan, M.; Rodriguez, L.; Gallagher, P.S.; Philip, R.; Ghosh, S.; Theoret, M.R.; Beaver, J.A.; et al. FDA Approval Summary: Pembrolizumab for the treatment of tumor mutational burden-high solid tumors. Clin. Cancer Res. 2021, 27, 4685–4689. [Google Scholar] [CrossRef] [PubMed]
- Sha, D.; Jin, Z.; Budczies, J.; Kluck, K.; Stenzinger, A.; Sinicrope, F.A. Tumor Mutational Burden as a Predictive Biomarker in Solid Tumors. Cancer Discov. 2020, 10, 1808–1825. [Google Scholar] [CrossRef] [PubMed]
- Pisapia, P.; Malapelle, U.; Roma, G.; Saddar, S.; Zheng, Q.; Pepe, F.; Bruzzese, D.; Vigliar, E.; Bellevicine, C.; Luthra, R.; et al. Consistency and reproducibility of next-generation sequencing in cytopathology: A second worldwide ring trial study on improved cytological molecular reference specimens. Cancer Cytopathol. 2019, 127, 285–296. [Google Scholar] [CrossRef] [PubMed]
- Malapelle, U.; Pepe, F.; Pisapia, P.; Altimari, A.; Bellevicine, C.; Brunnström, H.; Bruno, R.; Büttner, R.; Cirnes, L.; De Andrea, C.E.; et al. Reference standards for gene fusion molecular assays on cytological samples: An international validation study. J. Clin. Pathol. 2023, 76, 47–52. [Google Scholar] [CrossRef]
- Redegalli, M.; Grassini, G.; Magliacane, G.; Pecciarini, L.; Schiavo Lena, M.; Smart, C.E.; Johnston, R.L.; Waddell, N.; Maestro, R. Routine Molecular Profiling in Both Resectable and Unresectable Pancreatic Adenocarcinoma: Relevance of Cytologic Samples. Clin. Gastroenterol. Hepatol. 2022. S1542-3565(22)01003-5. [Google Scholar] [CrossRef]
- Sherry, S.T.; Ward, M.H.; Kholodov, M.; Baker, J.; Phan, L.; Smigielski, E.M.; Sirotkin, K. dbSNP: The NCBI database of genetic variation. Nucleic Acids Res. 2001, 29, 308–311. [Google Scholar] [CrossRef]
- Li, M.M.; Datto, M.; Duncavage, E.J.; Kulkarni, S.; Lindeman, N.I.; Roy, S.; Tsimberidou, A.M.; Vnencak-Jones, C.L.; Wolff, D.J.; Younes, A.; et al. Standards and Guidelines for the Interpretation and Reporting of Sequence Variants in Cancer: A Joint Consensus Recommendation of the Association for Molecular Pathology, American Society of Clinical Oncology, and College of American Pathologists. J. Mol. Diagn. 2017, 19, 4–23. [Google Scholar] [CrossRef]
- Yip, S.; Butterfield, Y.S.; Morozova, O.; Chittaranjan, S.; Blough, M.D.; An, J.; Birol, I.; Chesnelong, C.; Chiu, R.; Chuah, E.; et al. Concurrent CIC mutations, IDH mutations and 1p/19q loss distinguish oligodendrogliomas from other cancers. J. Pathol. 2012, 226, 7–16. [Google Scholar] [CrossRef]
- Chalmers, Z.R.; Connelly, C.F.; Fabrizio, D.; Gay, L.; Ali, S.M.; Ennis, R.; Schrock, A.; Campbell, B.; Shlien, A.; Chmielecki, J.; et al. Analysis of 100,000 human cancer genomes reveals the landscape of tumor mutational burden. Genome Med. 2017, 9, 34. [Google Scholar] [CrossRef]
- Coleman, R.L.; Oza, A.M.; Lorusso, D.; Aghajanian, C.; Oaknin, A.; Dean, A.; Colombo, N.; Weberpals, J.I.; Clamp, A.; Scambia, G.; et al. Rucaparib maintenance treatment for recurrent ovarian carcinoma after response to platinum therapy (ARIEL3): A randomised, double-blind, placebo-controlled, phase 3 trial. Lancet 2017, 390, 1949–1961. [Google Scholar] [CrossRef]
- Telli, M.L.; Timms, K.M.; Reid, J.; Hennessy, B.; Mills, G.B.; Jensen, K.C.; Szallasi, Z.; Barry, W.T.; Winer, E.P.; Tung, N.M.; et al. Homologous Recombination Deficiency (HRD) Score Predicts Response to Platinum-Containing Neoadjuvant Chemotherapy in Patients with Triple-Negative Breast Cancers. Clin. Cancer Res. 2016, 22, 3764–3773. [Google Scholar] [CrossRef] [PubMed]
- Abkevich, V.; Timms, K.M.; Hennessy, B.T.; Potter, J.; Carey, M.S.; Meyer, L.A.; Smith-McCune, K.; Broaddus, R.; Lu, K.H.; Chen, J.; et al. Patterns of genomic loss of heterozygosity predict homologous recombination repair defects in epithelial ovarian cancer. Br. J. Cancer. 2012, 107, 1776–1782. [Google Scholar] [CrossRef] [PubMed]
- Chakravarty, D.; Johnson, A.; Jeffrey Sklar, J.; Lindeman, N.I.; Moore, K.; Ganesan, S.; Lovly, C.M.; Perlmutter, J.; Gray, S.W.; Hwang, J.; et al. Somatic Genomic Testing in Patients With Metastatic or Advanced Cancer: ASCO Provisional Clinical Opinion. J. Clin. Oncol. 2022, 40, 1231–1258. [Google Scholar] [CrossRef] [PubMed]
- Davies, K.D.; Lomboy, A.; Lawrence, C.A.; Yourshaw, M.; Bocsi, G.T.; Camidge, D.R.; Aisner, D.L. DNA-Based versus RNA-Based Detection of MET Exon 14 Skipping Events in Lung Cancer. J. Thorac. Oncol. 2019, 14, 737–741. [Google Scholar] [CrossRef]
- Parilla, M.; Ritterhouse, L.L. Beyond the Variants: Mutational Patterns in Next-Generation Sequencing Data for Cancer Precision Medicine. Front Cell Dev. Biol. 2020, 8, 370. [Google Scholar] [CrossRef]
- Vestergaard, L.K.; Oliveira, D.N.P.; Poulsen, T.S.; Høgdall, C.K.; Høgdall, E.V. Oncomine™ Comprehensive Assay v3 vs. Oncomine™Comprehensive Assay Plus. Cancers 2021, 13, 5230. [Google Scholar] [CrossRef]
- Mantripragada, K.C.; Olszewski, A.J.; Schumacher, A.; Perez, K.; Birnbaum, A.; Reagan, J.L.; Mega, A.; Khurshid, H.; Bartley, C.; Lombardo, A.; et al. Clinical Trial Accrual Targeting Genomic Alterations After Next-Generation Sequencing at a Non-National Cancer Institute-Designated Cancer Program. J. Oncol. Pract. 2016, 12, e396–e404. [Google Scholar] [CrossRef]
- Hagemann, I.S.; Devarakonda, S.; Lockwood, C.M.; Spencer, D.H.; Guebert, K.; Bredemeyer, A.J.; Al-Kateb, H.; Nguyen, T.T.; Duncavage, E.J.; Cottrell, C.E.; et al. Clinical next-generation sequencing in patients with non-small cell lung cancer. Cancer 2015, 121, 631–639. [Google Scholar] [CrossRef]
- Li, Y.; Ma, Y.; Wu, Z.; Zeng, F.; Song, B.; Zhang, Y.; Li, J.; Lui, S.; Wu, M. Tumor Mutational Burden Predicting the Efficacy of Immune Checkpoint Inhibitors in Colorectal Cancer: A Systematic Review and Meta-Analysis. Front. Immunol. 2021, 12, 751407. [Google Scholar] [CrossRef]
- Gjoerup, O.; Brown, C.A.; Ross, J.S.; Huang, R.S.P.; Schrock, A.; Creeden, J.; Fabrizio, D.; Tolba, K. Identification and Utilization of Biomarkers to Predict Response to Immune Checkpoint Inhibitors. AAPS J. 2020, 22, 132. [Google Scholar] [CrossRef]
- Zhao, Z.; Li, W.; Zhang, X.; Ge, M.; Song, C. Correlation between TMB and MSI in patients with solid tumors. J. Clin. Oncol. 2020, 38, e15169. [Google Scholar] [CrossRef]
- Wang, Y.; Shi, C.; Eisenberg, R.; Vnencak-Jones, C.L. Differences in Microsatellite Instability Profiles between Endometrioid and Colorectal Cancers: A Potential Cause for False-Negative Results? J. Mol. Diagn. 2017, 19, 57–64. [Google Scholar] [CrossRef] [PubMed]
- Buhard, O.; Cattaneo, F.; Wong, Y.F.; Yim, S.F.; Friedman, E.; Flejou, J.F.; Duval, A.; Hamelin, R. Multipopulation analysis of polymorphisms in five mononucleotide repeats used to determine the microsatellite instability status of human tumors. J. Clin. Oncol. 2006, 24, 241–251. [Google Scholar] [CrossRef] [PubMed]
- Lee, M.; Chun, S.-M.; Sung, C.O.; Kim, S.Y.; Kim, T.W.; Jang, S.J.; Kim, J. Clinical Utility of a Fully Automated Microsatellite Instability Test with Minimal Hands-on Time. J. Pathol. Transl. Med. 2019, 53, 386–392. [Google Scholar] [CrossRef]
- Dedeurwaerdere, F.; Claes, K.B.; Van Dorpe, J.; Rottiers, I.; Van der Meulen, J.; Breyne, J.; Swaerts, K.; Martens, G. Comparison of microsatellite instability detection by immunohistochemistry and molecular techniques in colorectal and endometrial cancer. Sci. Rep. 2021, 11, 12880. [Google Scholar] [CrossRef]


Disclaimer/Publisher’s Note: The statements, opinions and data contained in all publications are solely those of the individual author(s) and contributor(s) and not of MDPI and/or the editor(s). MDPI and/or the editor(s) disclaim responsibility for any injury to people or property resulting from any ideas, methods, instructions or products referred to in the content. |
© 2023 by the authors. Licensee MDPI, Basel, Switzerland. This article is an open access article distributed under the terms and conditions of the Creative Commons Attribution (CC BY) license (https://creativecommons.org/licenses/by/4.0/).