Article

Statistical Evaluation of NO2 Emissions in Mashhad City Using Cisco Network Model

1
Institute for Nanomaterials, Advanced Technologies and Innovation, Technical University of Liberec, 46117 Liberec, Czech Republic
2
Association of Talent under Liberty in Technology (TULTECH), 10615 Tallinn, Estonia
*
Author to whom correspondence should be addressed.
Gases 2024, 4(3), 273-294; https://doi.org/10.3390/gases4030016
Submission received: 7 June 2024 / Revised: 12 August 2024 / Accepted: 29 August 2024 / Published: 13 September 2024
(This article belongs to the Section Gas Sensors)

Abstract

:
This paper presents an analysis of NO2 emissions in Mashhad City utilizing statistical evaluations and the Cisco Network Model. The present study begins by evaluating NO2 emissions through statistical analysis, followed by the application of histograms and radar statistical appraisals. Subsequently, a model execution logic is developed using the Cisco Network Model to further understand the distribution and sources of NO2 emissions in the city. Additionally, the research incorporates managerial insights by employing Petri Net modeling, which enables a deeper understanding of the dynamic interactions within the air quality management system. This approach aids in identifying critical control points and optimizing response strategies, thus enhancing the overall effectiveness of urban air pollution mitigation efforts. The findings of this study provide valuable insights into the levels of NO2 pollution in Mashhad City and offer a structured approach to modeling NO2 emissions for effective air quality management strategies which can be extended to the other megacities as well.

1. Introduction

Urban air pollution is a pressing global issue with detrimental impacts on public health and the environment. Among the various pollutants, nitrogen dioxide (NO2) stands out as a significant contributor, primarily originating from vehicular emissions and industrial activities. NO2 is not only a precursor to other harmful pollutants, such as ozone and particulate matter, but also poses direct health risks [1]. Prolonged exposure to NO2 can lead to respiratory problems, exacerbate asthma, and reduce lung function, particularly affecting vulnerable populations such as children, the elderly, and those with pre-existing health conditions [2]. Understanding the distribution and levels of NO2 emissions within urban areas is crucial for effective air quality management strategies. Accurate assessment and monitoring can inform policy decisions, mitigate health risks, and enhance the overall quality of life for urban residents. From a governmental point of view, statistical evaluation approaches and innovative models can assist us to gain insight into the sources and dispersion of NO2 in the urban environment [3]. Air quality monitoring faces challenges such as a lack of sensor selectivity [4], but integrating air pollution and atmospheric parameters into traffic forecasting models shows promise for improving traffic management [5]. Continuous calibration efforts are essential for ensuring the accuracy of sensor-based air quality measurements [6]. Some studies in this field are as follows: Lai et al. [7] investigated the development of an ensemble machine learning model to combine commercial gas sensors for accurate concentration detection. Recurrent neural network (RNN) models were utilized to extract time series concentration data characteristics and improve detection accuracy. Ensemble models outperformed single weak models, especially after a retraining procedure, showcasing stable sensing performance in atmospheric environments. In industrial settings, the Industrial Internet of Things (IIoT) has introduced wireless sensor networks (WSNs) enabled by low-power wide-area network (LPWAN) technologies for monitoring environmental conditions such as temperature, humidity, and gas concentrations [8]. These systems, utilizing LoRa modulation and the LoRaWAN protocol, have demonstrated reliability even in extreme conditions [8].
Aroud et al. [9] examined the impact of chemicals on asthma patients by integrating a sensor system called MQ5 into a wristwatch to monitor smoke and nitrogen content in the atmosphere. Utilizing the artificial neural network (ANN) algorithm, the system issued warning alarms to asthma patients when gas levels exceeded safety thresholds, achieving a high classification accuracy rate. Mawrence et al. [10] endeavored to enhance the reliability of NO2 measurements detected from electrochemical sensors integrated with unmanned aerial vehicles (UAVs). By introducing rotor speed as part of the calibration model, they proposed a methodological approach to obtain more reliable air quality data in outdoor experiments. Low-cost gas sensors have enhanced urban air pollution monitoring, supplementing regulatory agency efforts [11]. Calibration models for these sensors, incorporating individual sensor performance and environmental factors, have improved accuracy in pollutant concentration predictions [11].
Panzardi et al. [12] proposed NO2 sensing utilizing single-wall carbon nanotube (SWCNT) networks decorated with nanoparticles made of TiO2 and Au. Through theoretical and experimental assessment, they demonstrated the effectiveness of this sensing strategy, particularly in improving sensor response under temperature pulsed working mode. Arroyo et al. [13] introduced a portable device for outdoor air quality measurement, integrating commercial electrochemical gas and optical particle matter sensors. Deployed in Badajoz, Spain, the system achieved good performance in measuring gaseous pollutants and particulate matter, offering real-time data transmission to a cloud platform. Vajs et al. [14] explored the impact of the COVID-19 lockdown in Serbia on air pollution levels of CO, NO2, and PM10, alongside the potential usage of low-cost sensors during this period. They utilized a device with low-cost sensors collocated with a reference public monitoring station in Belgrade, conducting measurements for 52 days in 2019 (pre-COVID-19), 2020 (lockdown), and 2021 (post-COVID-19). The results showed a notable decrease in NO2 levels during the lockdown, while CO and PM10 levels remained constant or slightly increased. By applying corrections using a convolutional neural network, the study enhanced the accuracy of low-cost sensor measurements, demonstrating satisfactory correlation with reference CO measurements during the lockdown.
Nadzir et al. [15] investigated changes in air quality during and post lockdown in the Klang Valley region amidst the COVID-19 pandemic. Utilizing the air sensor network AiRBOXSense, they measured carbon monoxide (CO), nitrogen dioxide (NO2), sulfur dioxide (SO2), and particulate matter (PM2.5 and PM10) at various locations. The results indicated reductions in air pollutants during lockdown phases, with variations observed based on sensor location and relaxation phases. The study highlighted the importance of controlling traffic and industrial emissions to achieve reductions in air pollutants. Han et al. [16] conducted a comprehensive evaluation of four Alphasense sensors in Beijing over 12 months, focusing on pollutant gases such as CO, NO2, O3, and SO2. They utilized various calibration models including single linear regression (SLR), multiple linear regression (MLR), random forest regressor (RFR), and neural networks (long short-term memory (LSTM)). The study found that LSTM models significantly improved the performance of sensors, suggesting their suitability for hot spot detection and emphasizing their potential benefits for assessing other low-cost sensors.
Pedowitz et al. [17] presented a room temperature gas sensor utilizing a δ-MnO2/epitaxial graphene/silicon carbide heterostructure for detecting toxic gases like NO2, NH3, IPA, and CH3OH. By leveraging the unique properties of manganese dioxide, the sensor demonstrated room-temperature detection capabilities, offering a promising solution for real-time toxic gas mapping in complex urban environments. Samad et al. [18] focused on developing a low-cost network of cloud-based air quality measurement platforms to obtain air quality data with higher spatial and temporal resolution. They tested three prototypes in both busy traffic sites and remote locations, demonstrating the robustness and efficiency of the developed platform. Additionally, the study explored the use of a Proportional–Integral–Derivative (PID) controller to improve data quality captured by low-cost sensors, offering insights for enhancing air quality monitoring systems. Gómez-suárez et al. [19] developed a device utilizing low-cost electrochemical and optical sensors attached to bicycle handlebars for monitoring urban air quality. The system, equipped with electrochemical sensors for NO2 and O3 and an optical particle matter (PM) sensor for PM2.5 and PM10 concentrations, was tested in real field conditions in Badajoz, Spain. The results showed a high correlation with a reference urban air quality monitoring station (R2 > 0.83), providing valuable spatio-temporal variability information through a dedicated cloud-based data platform. Laref et al. [20] investigated the long-term drift phenomenon affecting electrochemical sensors used to monitor nitrogen dioxide concentrations [NO2] in real environmental conditions. They proposed an empirical, linear, and unsupervised drift correction model, extending the time between successive full calibrations. The correction model compensated for sensor sensitivity and baseline changes over time, maintaining adequate [NO2] estimation accuracy for at least 3 consecutive months without needing recalibration. Additional studies in the field are also summarized in Table 1.
In all of the above literature reviews provided, there is a significant emphasis on various aspects related to gas sensing technology, including materials, modeling, characterization, control, and managerial aspects which can be summarized as follows:
  • Materials: Several studies focus on the development and characterization of novel materials for gas sensors, such as SnO2 nanowires, CuS quantum dots, Bi2S3 nanosheets, and carbon nanotubes. These materials play a crucial role in enhancing the sensitivity and selectivity of gas sensors.
  • Modeling: Some papers employ mathematical models, neural networks, and simulation techniques to understand sensor behavior, predict gas concentrations, and optimize sensor performance. These models provide insights into the underlying mechanisms of gas sensing and help improve sensor design.
  • Characterization: Characterization techniques like scanning electron microscopy (SEM), X-ray diffraction (XRD), and density functional calculation are utilized to analyze the morphology, structure, and properties of gas sensing materials and devices. This characterization is essential for understanding the structure–property relationships and optimizing sensor performance.
  • Control: Control strategies are explored to enhance the sensitivity, stability, and response time of gas sensors. This includes optimizing electrode materials, surface-to-volume ratios, and charge transfer pathways to improve gas adsorption and charge transportation efficiency.
  • Managerial: While most studies focus on technical aspects of gas sensing technology, there is a lack of emphasis on managerial insights, such as the implementation of sensor networks in real-world environments, policy interventions to address air pollution, and decision-making processes for deploying sensor systems.
  • Macroscopic Scale: Some studies address broader environmental issues related to air pollution, transportation emissions, and public health concerns. They discuss the impact of sensor technology on urban environments, the effectiveness of ventilation systems in mitigating air pollution, and the need for regulatory measures to reduce emissions.
As an example, to provide an overview and explain how meteorological variables influence NO2 emissions, in the Beijing–Tianjin–Hebei (BTH) region, meteorological conditions significantly influenced NO2 concentrations, particularly in winter. For instance, according to [42], in the winter of 2017, favorable weather conditions contributed to a notable reduction of 7.3 mg/m3 in NO2 levels. Similarly, in the winter of 2018, weather changes were responsible for an additional decrease of 5.3 mg/m3. These reductions highlight the role of meteorology in improving air quality during specific periods, emphasizing the importance of understanding seasonal weather impacts when designing air quality interventions. In the Yangtze River Delta (YRD) and Cheng-Yu (CY) regions, both emissions reductions and meteorological conditions played critical roles in the observed NO2 trends. During the summer of 2018, emission reductions in YRD contributed to a substantial 78.5% decrease in NO2 concentrations, demonstrating the effectiveness of pollution control measures. Similarly, in CY, emission reductions accounted for a 73.8% decrease in NO2 levels in the winter of 2018. These findings underscore the importance of targeted emission controls, particularly in industrial regions, to achieve significant air quality improvements. The Hohhot–Baotou–Erdos–Yulin (HBEY) region experienced a significant increase in NO2 concentrations in the winter of 2018, where the levels rose by 31.4 mg/m3. This increase was primarily driven by changes in anthropogenic emissions, which accounted for 23.5 mg/m3 of the rise, while meteorological changes contributed 7.9 mg/m3. The substantial impact of emission changes in this region highlights the need for stringent emission control policies, especially considering the heavy industrial activities prevalent in the area. Both the Central Plains (CP) and Northern Slope of Tianshan Mountain (NSTM) regions exhibited a general downward trend in NO2 concentrations from 2014 to 2019. This decline was mainly attributed to emission reductions, reflecting the positive outcomes of national and regional air pollution control efforts. The sustained decrease in these regions suggests that continuous emission reduction strategies can lead to long-term improvements in air quality, even in areas with diverse meteorological conditions [42].
As urban centers grapple with rising air quality challenges, the findings of this study aim to contribute to the development of targeted interventions and policies aimed at mitigating NO2 emissions in Mashhad City which can be expanded to other similar megacities. This study can potentially fill the gap regarding the managerial insight viewpoint. By utilizing a network model, the research can affect the deployment, operation, and management of gas sensor networks in urban environments. This study integrates two innovative elements: the Cisco Network Model and Petri Net modeling. The Cisco Network Model is utilized to understand the dynamics of NO2 emissions in Mashhad City as a structured approach to identifying critical control points and optimizing response strategies for urban air pollution management. Meanwhile, Petri Net modeling enhances managerial insights into the air quality management system by providing a comprehensive understanding of dynamic interactions within the system. This approach focuses on maintaining optimal conditions in the sensor network’s operation, adjusting factors such as Fe3O4 percentage and temperature. This study successfully demonstrates that the combination of these models provides a robust framework for managing air quality, offering valuable insights that can be applied to other megacities. It can address questions related to sensor data collection, analysis, and decision-making processes for air quality management. Additionally, it can explore the role of policy interventions and community engagement in addressing air pollution issues at the city level. Overall, this study can provide a more comprehensive understanding of the managerial aspects of gas sensing technology and its application in environmental monitoring and management.

Bibliometrics Overview

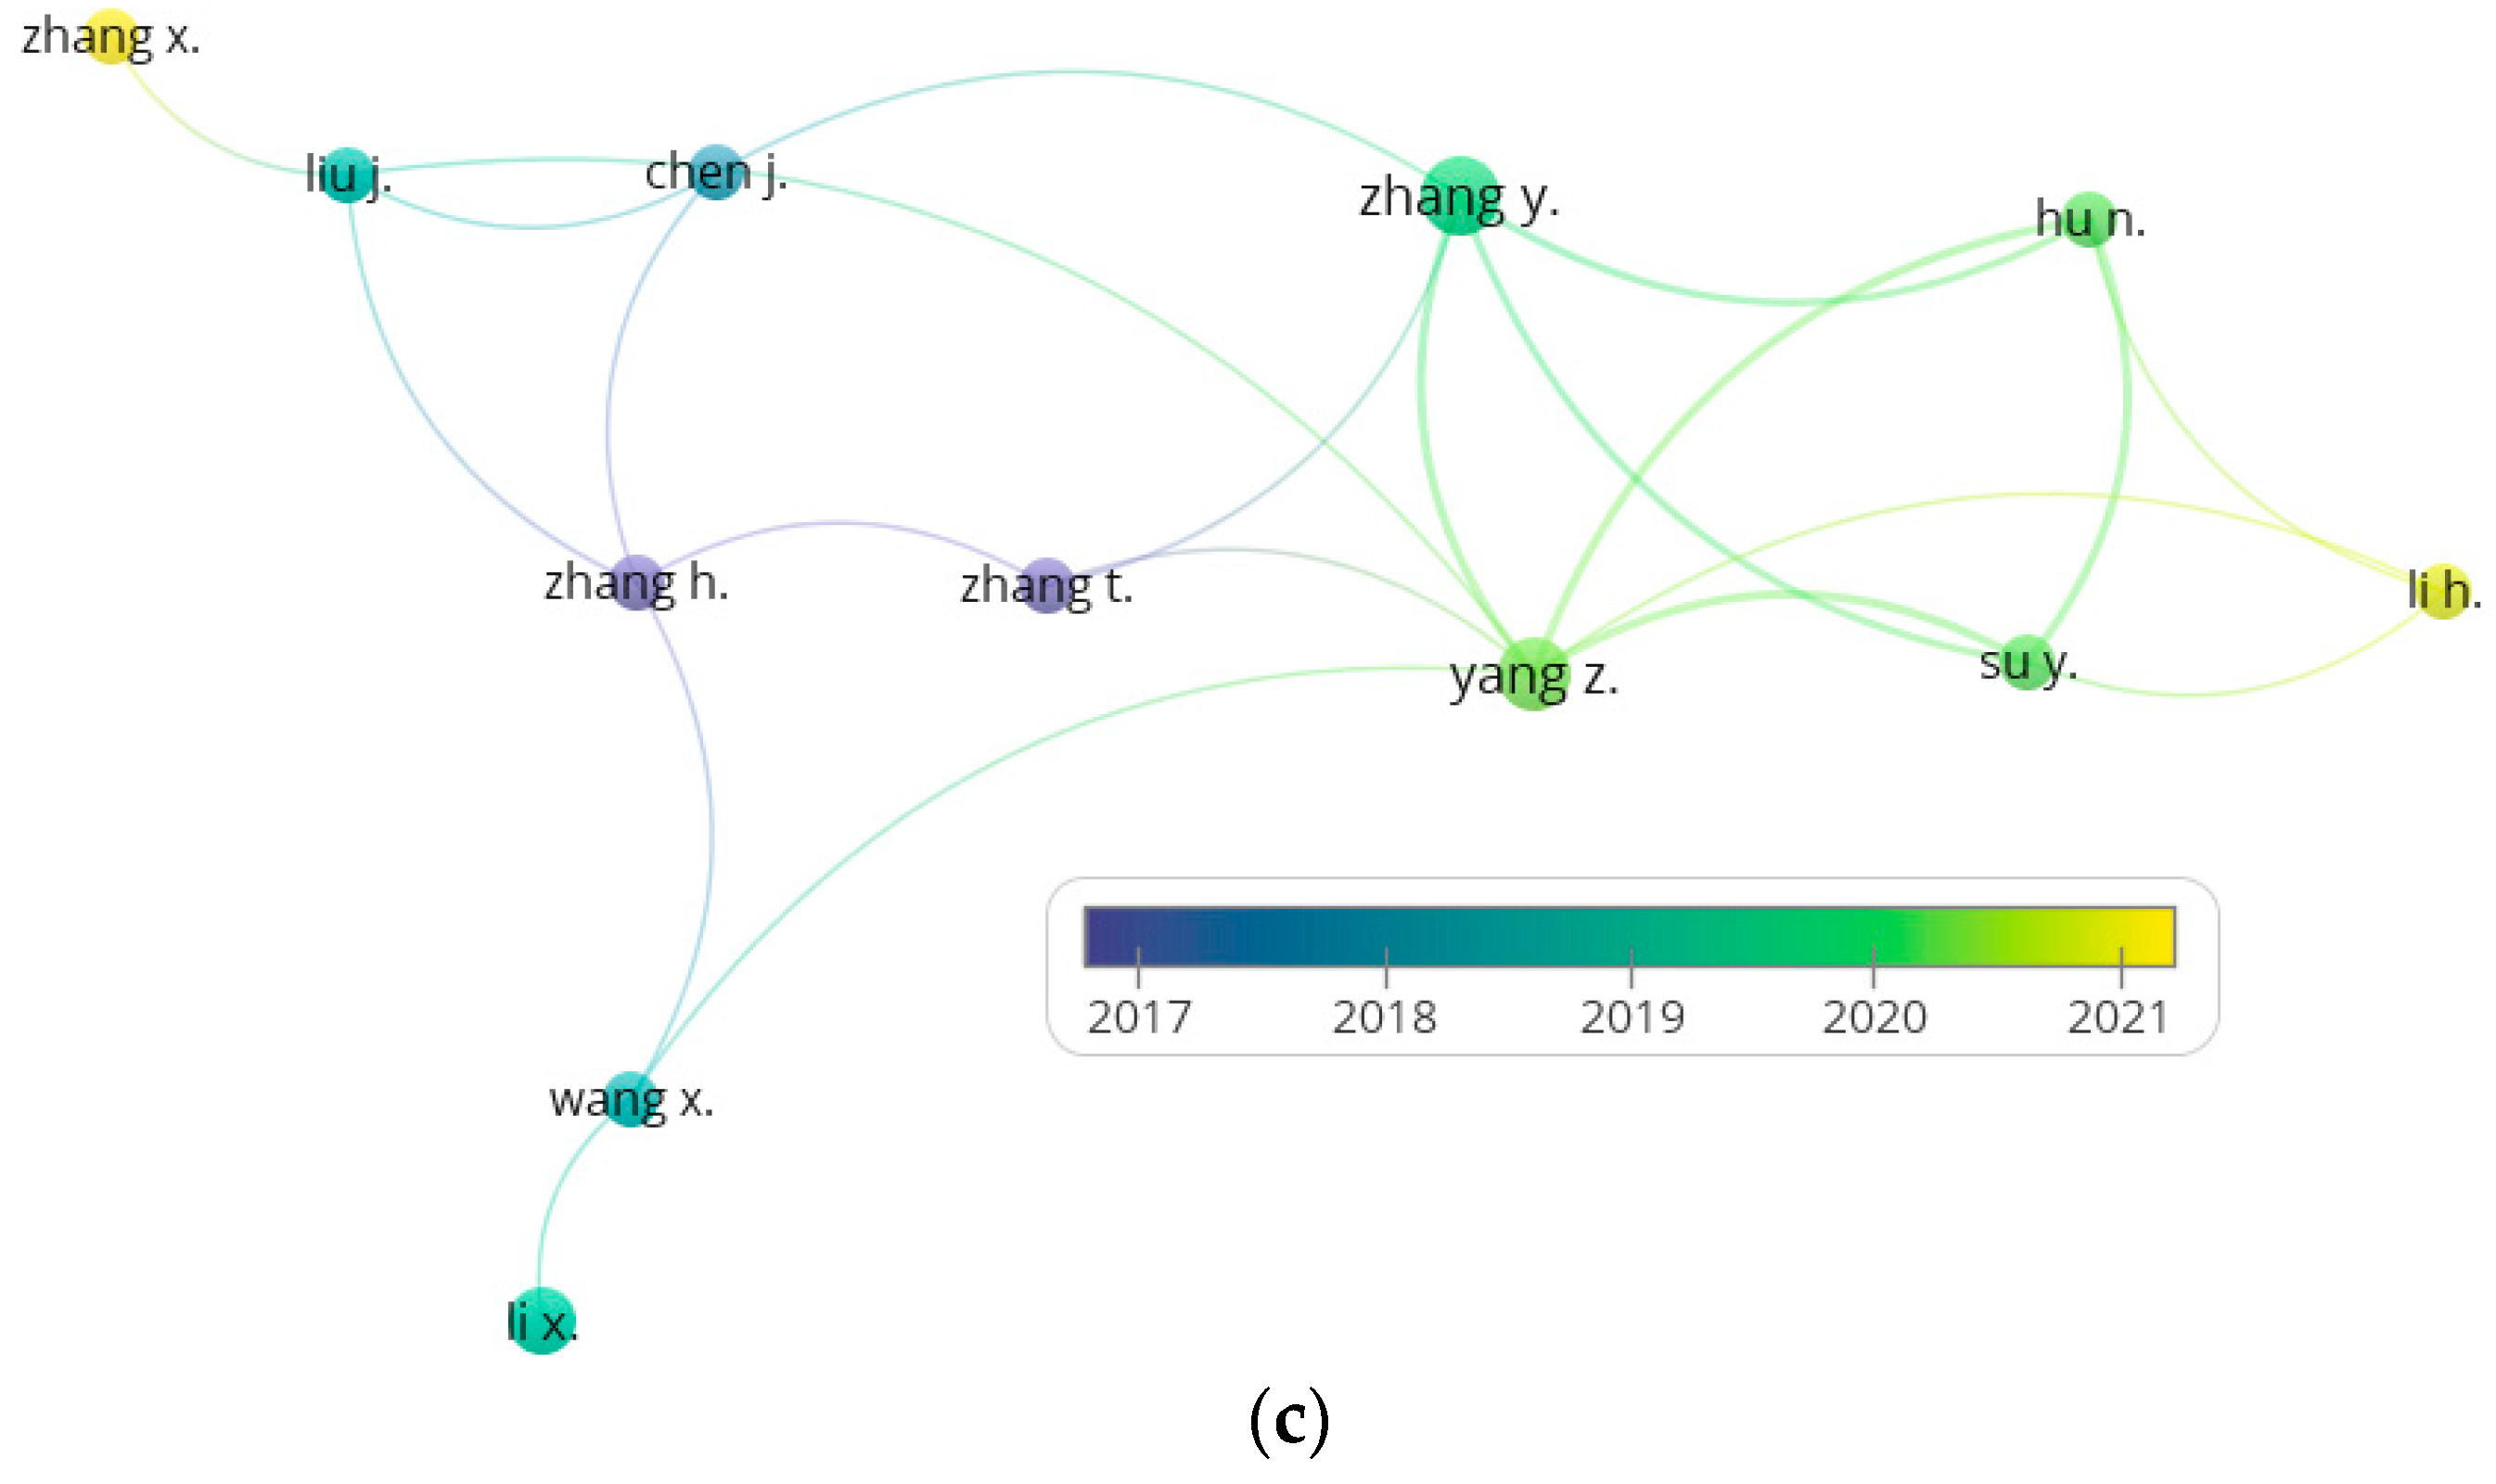
For exact determination of the knowledge gap, a Bibliometrics analysis is performed based on the Scopus databank and VOSviewer platform. To achieve this goal, the search detail contains “sensor+Nanomaterials+NO2”. Based on Figure 1a, it can be seen that this field of research is a hot issue in scientific communities, and also, gas sensor creation by nanomaterial synthesizing has developed over the years more and more. Also, as per Figure 1b, the greatest contribution of this research field is related to China and its main collaborator India. Finally, the most prominent researchers in nanomaterial-based NO2 gas sensors are presented in Figure 1c.

2. Materials and Methods

This section provides the methods to deploy the synthesized sensor effectively in megacities for NO2 detection as part of an alarm management system. The methodology involves three distinct steps:
  • Statistical Evaluation of NO2 Pollution Emission: This step involves conducting a thorough statistical evaluation of NO2 pollution emissions, focusing on a specific case study, namely Mashhad City in Iran. Various statistical analyses are performed to assess the extent and distribution of NO2 pollution in the city, providing valuable insights into the spatial and temporal patterns of air pollution.
  • Determination of Thresholds: After the statistical evaluation, thresholds for NO2 pollution are determined based on the observed pollution levels and environmental standards.
  • Conceptual Modeling of Sensor Network Operation: The final step involves developing a conceptual model for the operation of a sensor network on a large scale. This model utilizes the Cisco Network Model framework to design and optimize the deployment of the sensor network across the megacity environment. Considerations such as sensor placement, data transmission, network architecture, and data analysis are incorporated into the conceptual model to ensure efficient and effective operation of the sensor network.

3. NO2 Sensor Application in Mashhad, Iran, as a Megacity

This section of the study investigates the implementation of the developed NO2 sensor in a megacity in Iran, building upon the authors’ previous research [43]. The case study deals with Mashhad City, the second largest megacity in Iran. Figure 2 depicts the location of the described region and its NO2 detection stations.
Mashhad City holds significant importance for this study for several reasons. Firstly, it is the second largest city in Iran, with a population exceeding 2.5 million. This large urban population, coupled with the influx of more than 14 million pilgrims annually, underscores the city’s demographic and social significance. The city is a major religious and cultural center, attracting visitors from across Iran and the world. This high density of residents and visitors increases the potential for widespread exposure to air pollutants, making Mashhad a critical case study for evaluating the health impacts of NO2 emissions. In addition to its demographic factors, Mashhad is noted as the second most polluted city in Iran, primarily due to emissions from vehicles and industrial activities. The city’s Central Business District (CBD) and suburban areas host numerous pollution sources, including factories, compost plants, and incompatible industrial units that contribute to the city’s air quality challenges. These factors make Mashhad an ideal location to study the correlation between air pollution and public health outcomes, providing valuable insights that can inform policy decisions and interventions aimed at reducing pollution-related health risks [44].
Mashhad experiences a temperate climate characterized by significant air inversion conditions for approximately 270–300 days per year. These inversions occur when a layer of warm air traps cooler air at the surface, preventing the dispersion of pollutants and causing them to accumulate near the ground. This meteorological phenomenon exacerbates air quality issues in the city, as it hinders the natural dispersion of NO2 and other pollutants, leading to prolonged exposure for residents. The city’s geographical location on a plain between the Binalood and Hezar-Masjed mountains contributes to these inversion conditions, further complicating the air quality dynamics in Mashhad. The climate’s role in pollution dynamics is significant, as it influences the seasonal variation in NO2 levels observed in this study. The data show higher concentrations of NO2 during the winter months, likely due to reduced atmospheric mixing and increased combustion activities for heating. In contrast, summer months experience lower NO2 levels, possibly due to enhanced photochemical reactions and increased air turbulence. Understanding these climatic influences is crucial for interpreting pollution patterns and implementing effective air quality management strategies in Mashhad [44]. This study utilizes data from 12 air pollution monitoring stations (Figure 2) distributed throughout Mashhad City. These stations play a crucial role in observing and documenting the city’s air pollution status, providing the data necessary for assessing NO2 concentrations and their health impacts. The stations are strategically located to capture a comprehensive picture of air quality across different regions, including areas identified as having the highest pollution levels, such as Daneshgah, Qale-sakhteman, Panjrah, and Sajad regions.
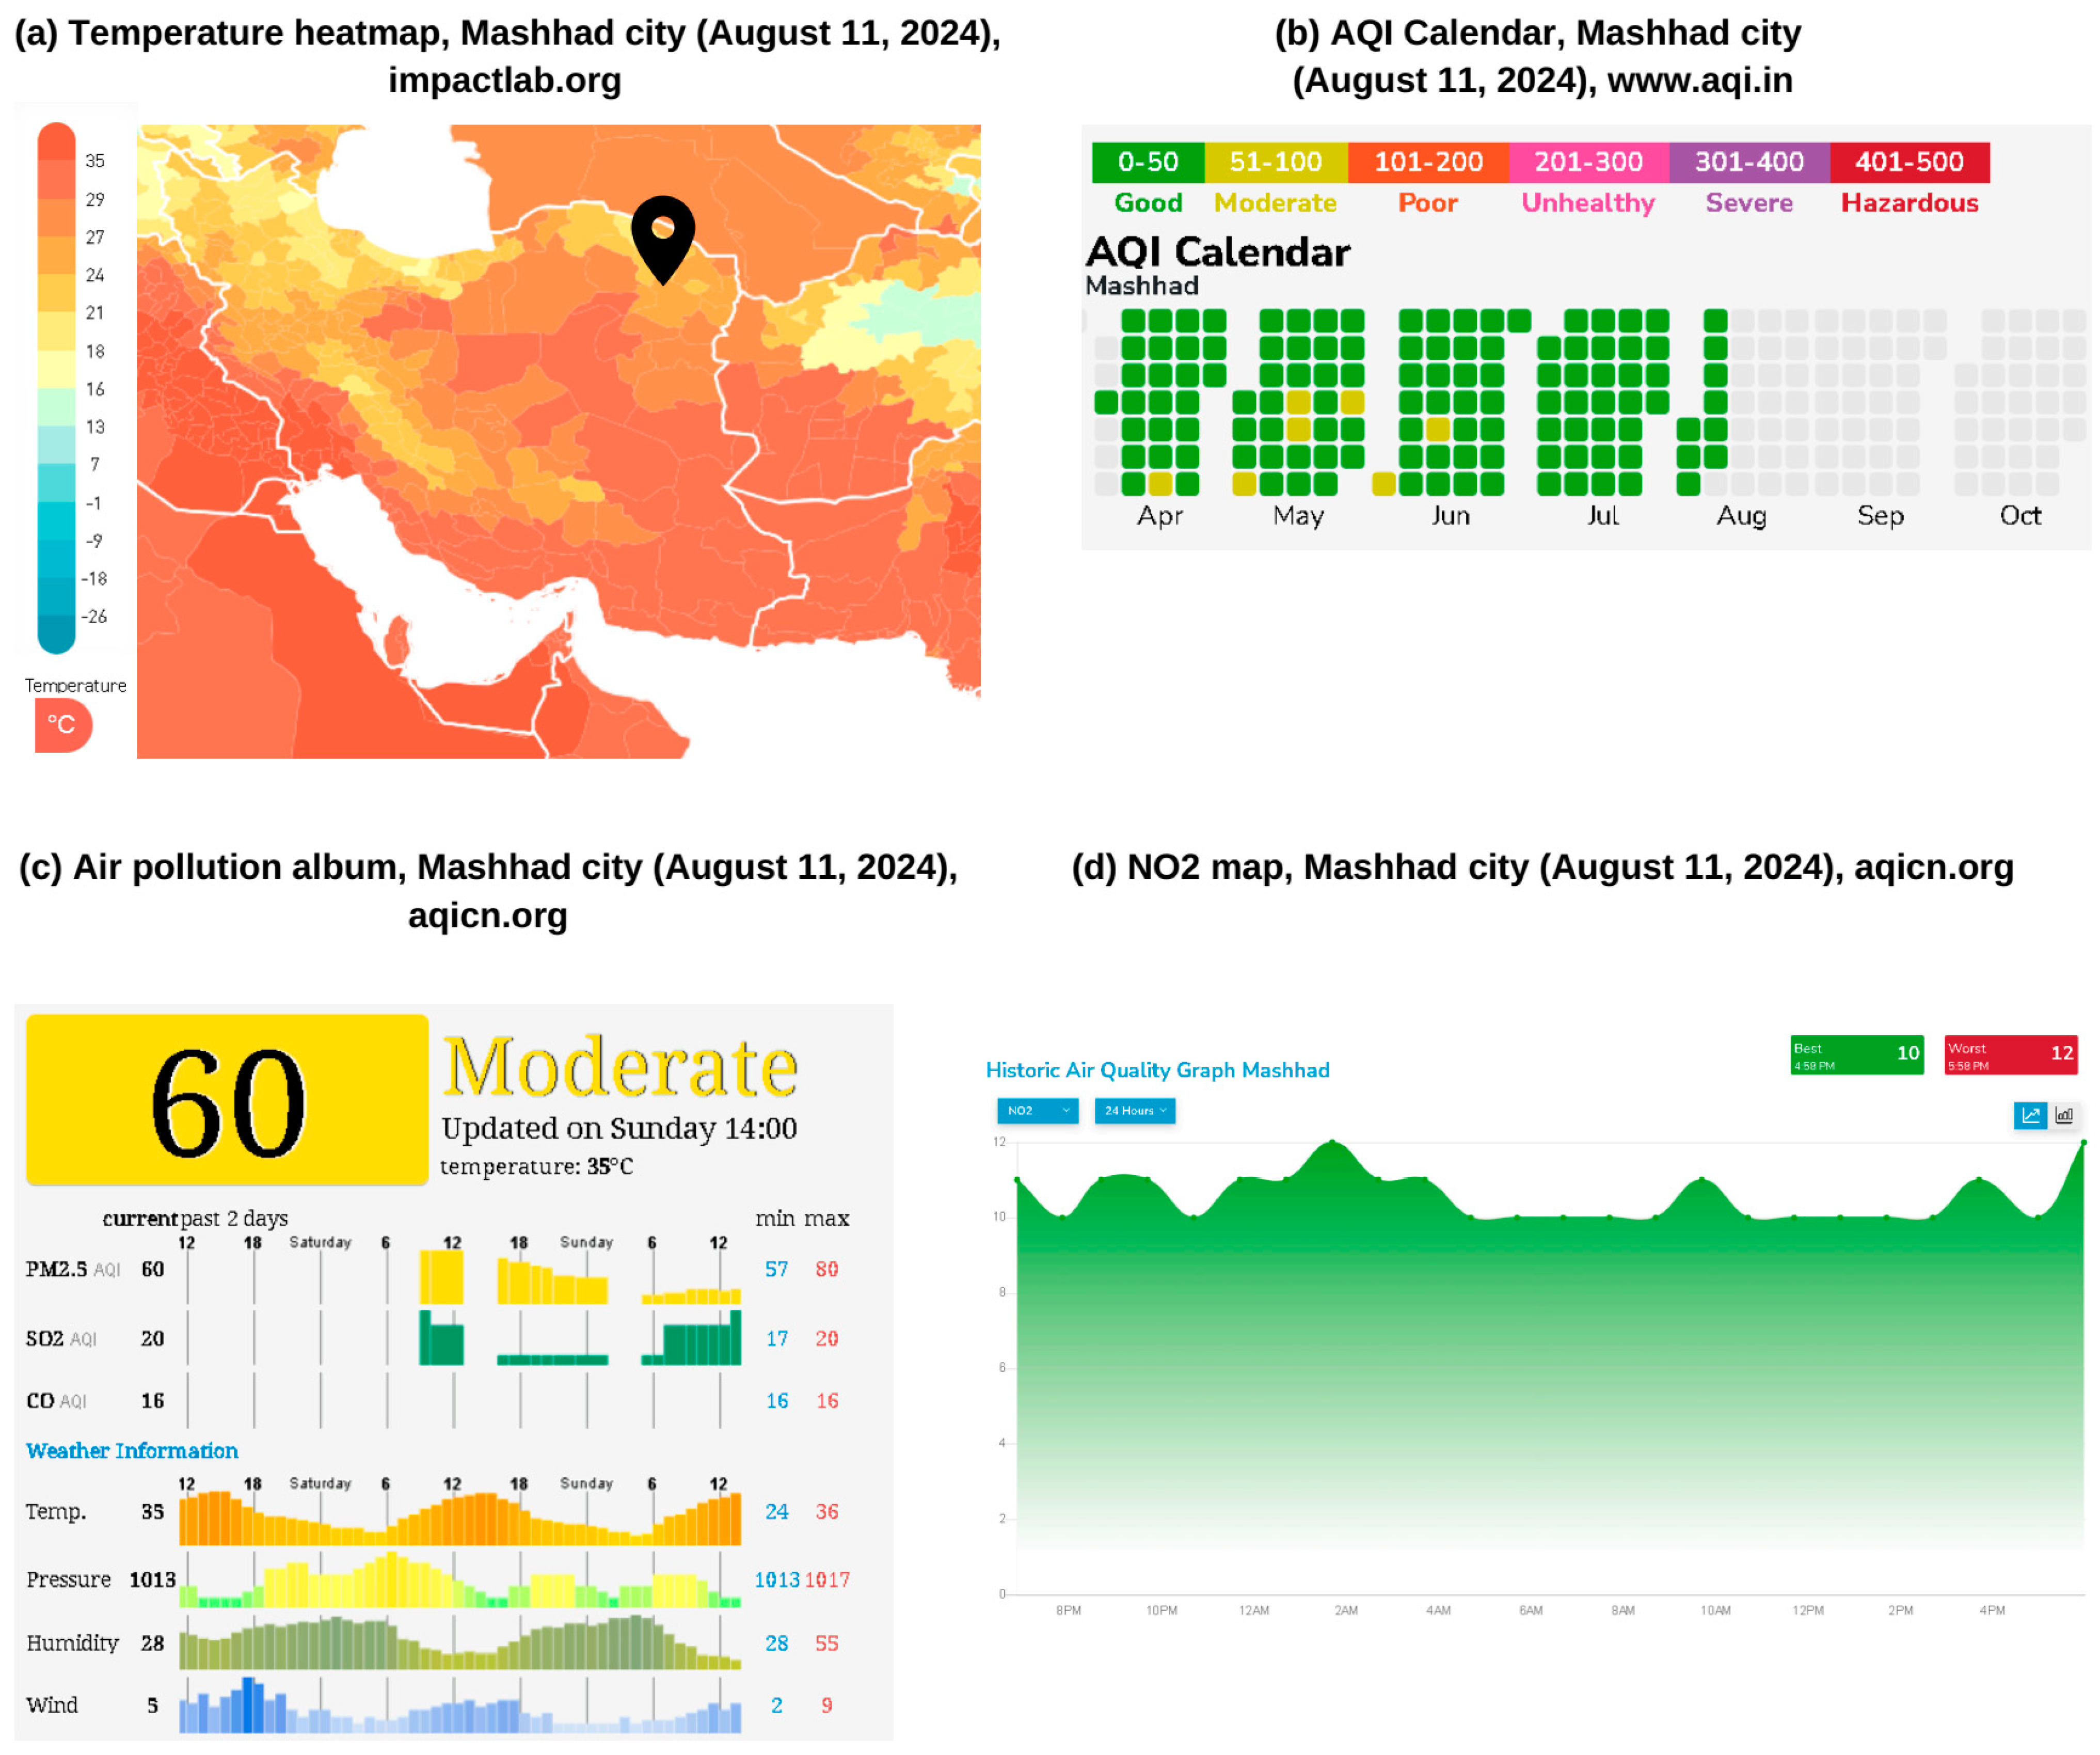
Figure 3 shows a comprehensive analysis of the environmental conditions in Mashhad City on 11 August 2024, through a series of detailed visual data representations. The figure is divided into four key segments, each focusing on different aspects of the environmental data. Figure 3a, a temperature heatmap, uses a color gradient to illustrate the day’s temperatures across Mashhad, peaking at 35 °C in certain zones, as shown in deep red. Next, the air quality index (AQI) calendar presents a year-round view of Mashhad’s air quality through color-coded days, predominantly green to indicate good air quality, with a few instances of moderate to poor conditions highlighted in yellow and orange. This visual tool effectively outlines the air quality trends over time, providing a quick reference for understanding seasonal variations in pollution levels (Figure 3b). Figure 3c, labeled as the air pollution album, delivers real-time and historical data on key pollutants such as PM2.5, SO2, and CO, alongside critical weather information like temperature, pressure, humidity, and wind speed. Updated to show conditions at a specific hour, this part conveys a snapshot of both the current state and recent trends in air quality, indicating a moderate level of PM2.5 at the time of the update. Finally, the NO2 map offers an hourly breakdown of nitrogen dioxide levels, consistently showcasing low pollution levels across Figure 3d. This indicates a stable environmental condition regarding NO2, aligning with the city’s overall manageable air quality levels, as reflected in other parts of Figure 3.
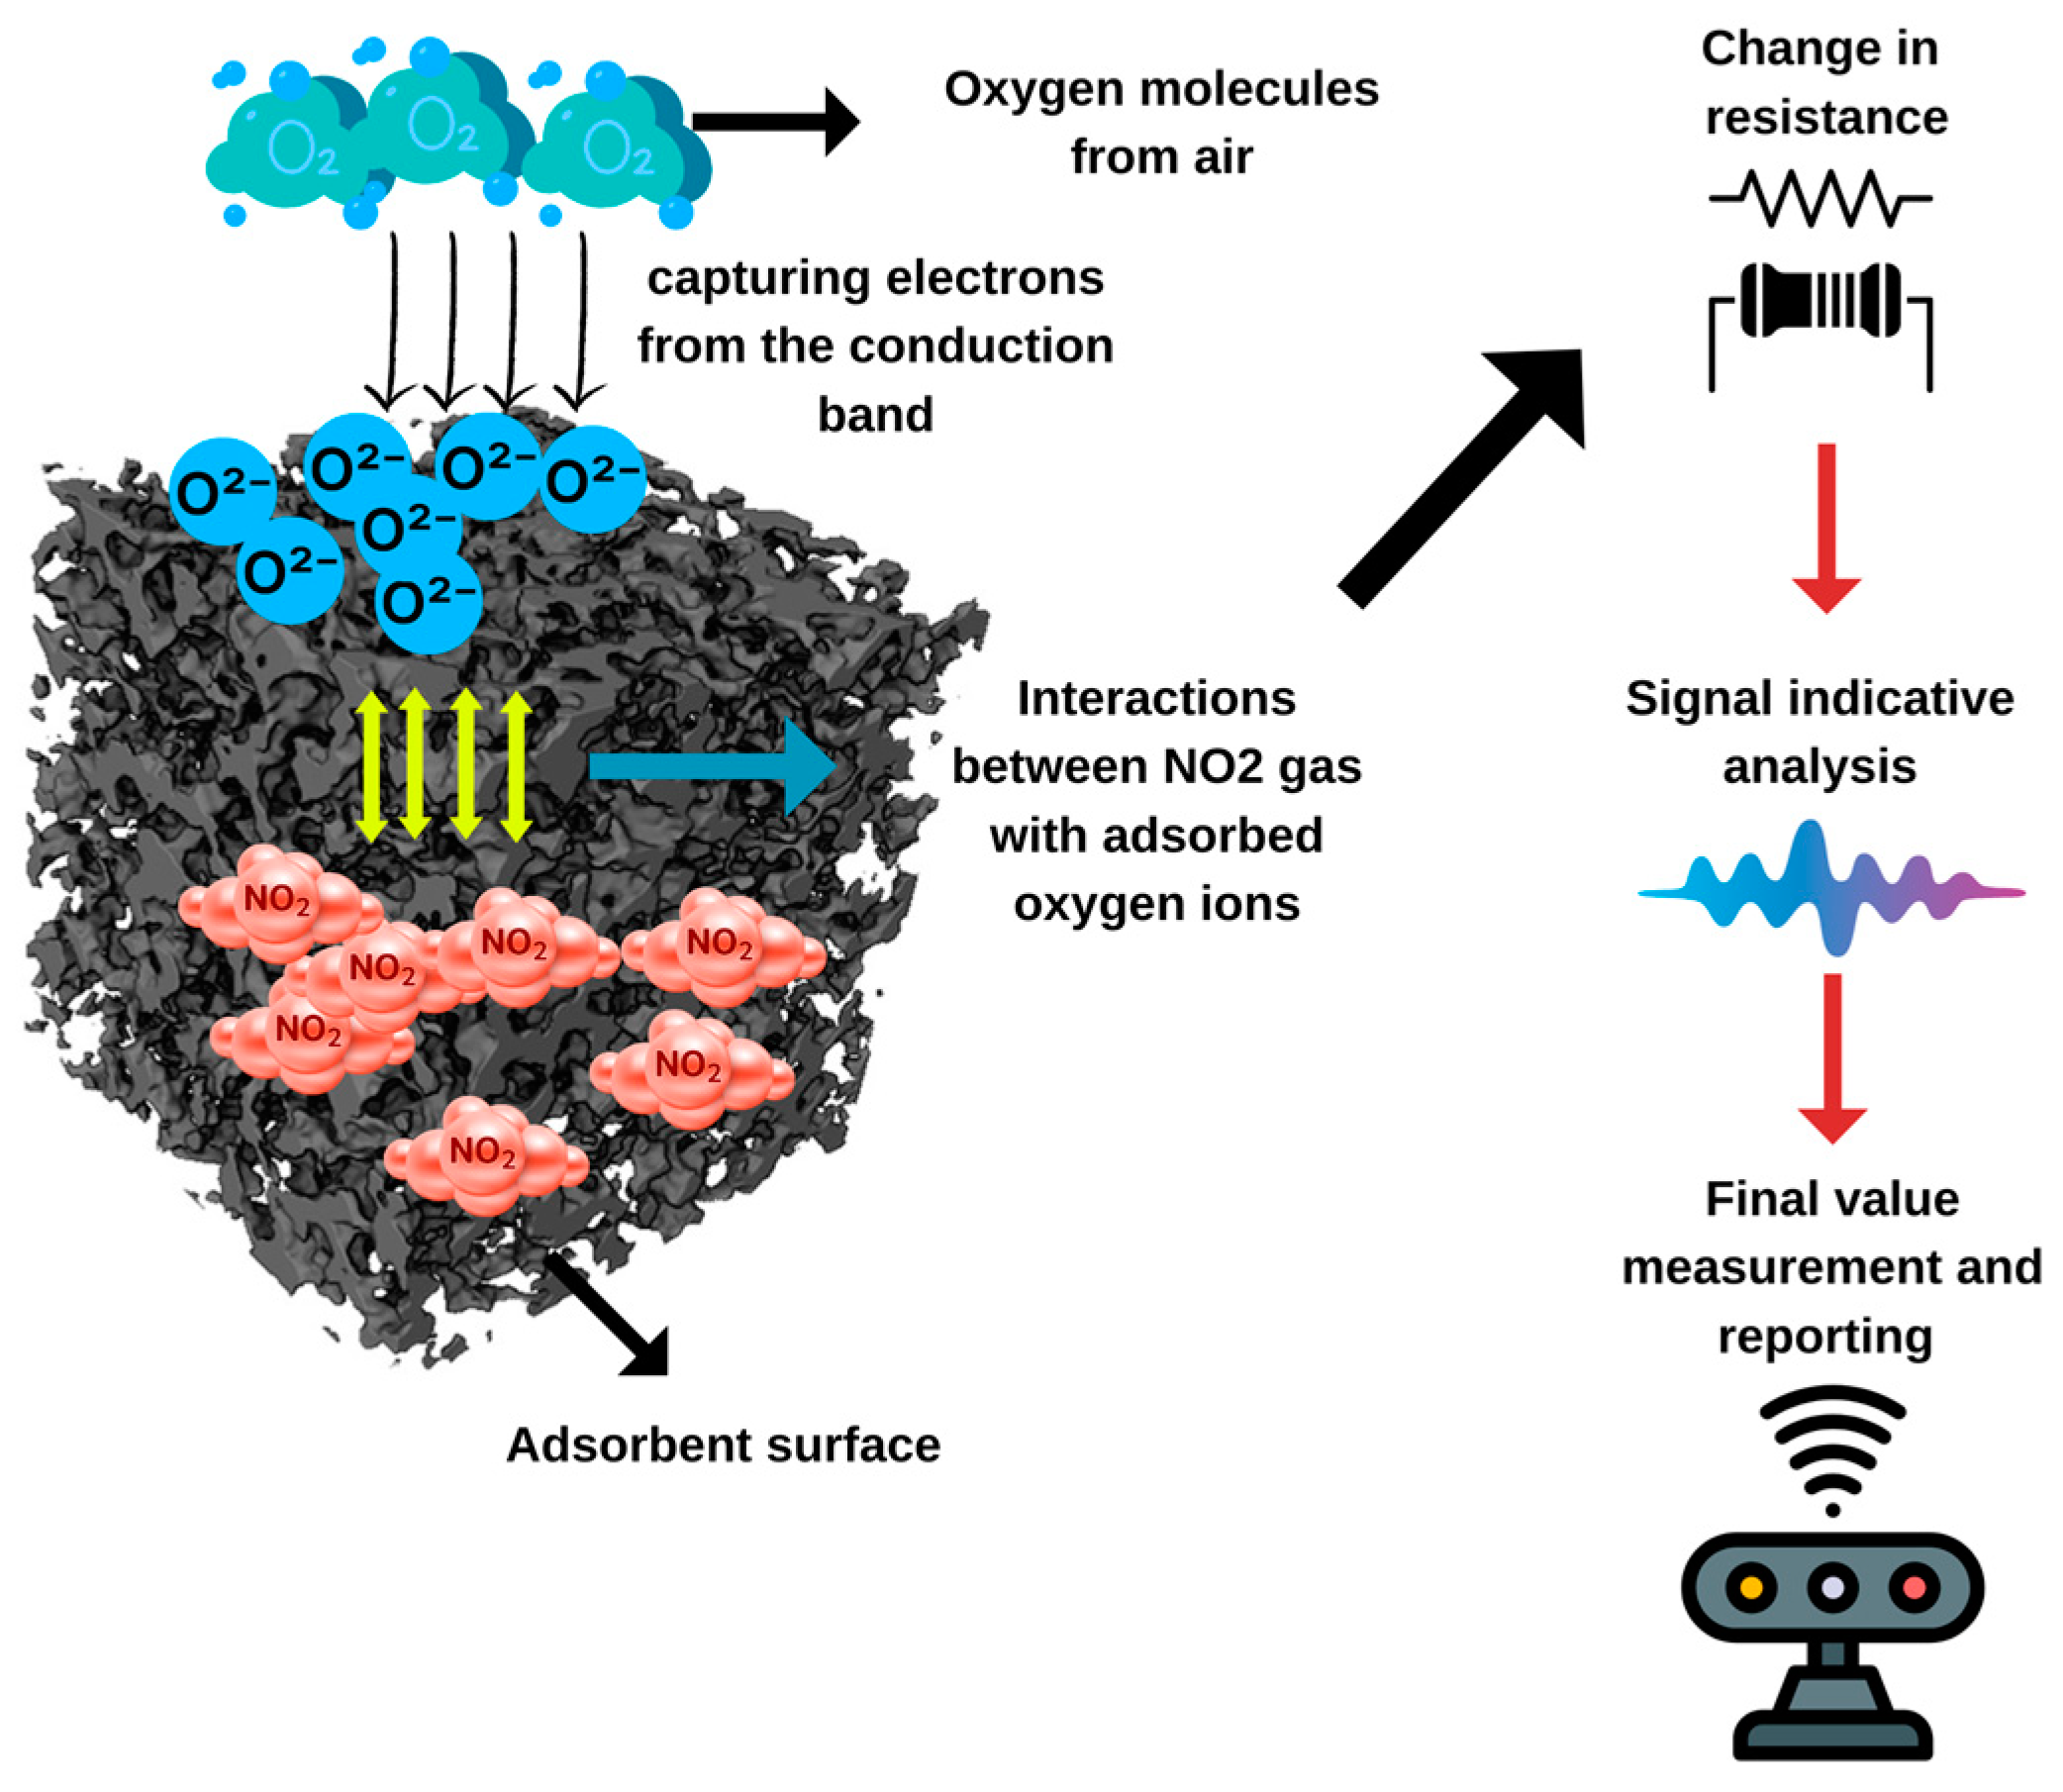
Regarding the sensors and their mechanism, generally, gas sensors that operate by the adsorption process detect gas molecules through their interaction with a sensitive material’s surface. When gas molecules come into contact with the sensor’s surface, they are adsorbed, altering the material’s electrical properties, such as conductivity or resistance. This change is measured and converted into an electrical signal proportional to the gas concentration. Common materials used include metal oxides like SnO2, which change conductivity when exposed to gases like CO or H2. The sensor’s sensitivity depends on factors like surface area, temperature, and the nature of the gas–material interaction, enabling the detection of specific gases. Likewise, the present study used the application of Fe3O4-rGOQD-SO3H due to the detection of NO2 gas, which is evaluated in our previous study [43]. Gas sensors based on adsorption detect gases through surface interactions with a sensitive material. Initially, oxygen is adsorbed, extracting electrons from the conduction band, which raises the resistance. When the target gas, like NO2, contacts the surface, it reacts with oxygen ions, causing trapped electrons to return to the conduction band. This reduces the resistance and increases conductivity, providing a measurable signal [45]. The sensor’s sensitivity depends on the surface material and gas concentration, and its behavior can vary with temperature. The schematic plan of the gas sensor mechanism is demonstrated in Figure 4.
The sensor developed from Fe3O4-rGOQD-SO3H is designed for NO2 gas detection. It uses gas suppliers, flow controllers, a quartz reactor, and a volt-amperometry technique to measure conductance. Sensitivity is calculated as S = (ΔR/R) × 100, where ΔR is the signal change, and R is the original signal [45]. Tests were conducted at room temperature with NO2 concentrations ranging from 2.5 to 50 ppm using dry air and NO2 mixtures. The optimization of the NO2 gas sensor involves two main objectives: minimizing response time and maximizing sensitivity. For minimizing response time, the optimal conditions are a Fe3O4 additive percentage of 19.44%, a NO2 gas concentration of 25.46 mg/L, and a sensitivity of 95.37%, leading to an estimated response time of 1.97 s. These conditions result in high model desirability, indicating accurate predictions of response time under these parameters. For maximizing sensitivity, the optimal values are a Fe3O4 agent concentration of 16.06%, a NO2 gas concentration of 36.48 mg/L, and a response time of 38.24 s, achieving an estimated sensitivity of 99.9%. These values demonstrate high model desirability but also highlight significant sensitivity to variations in the independent variables [43].
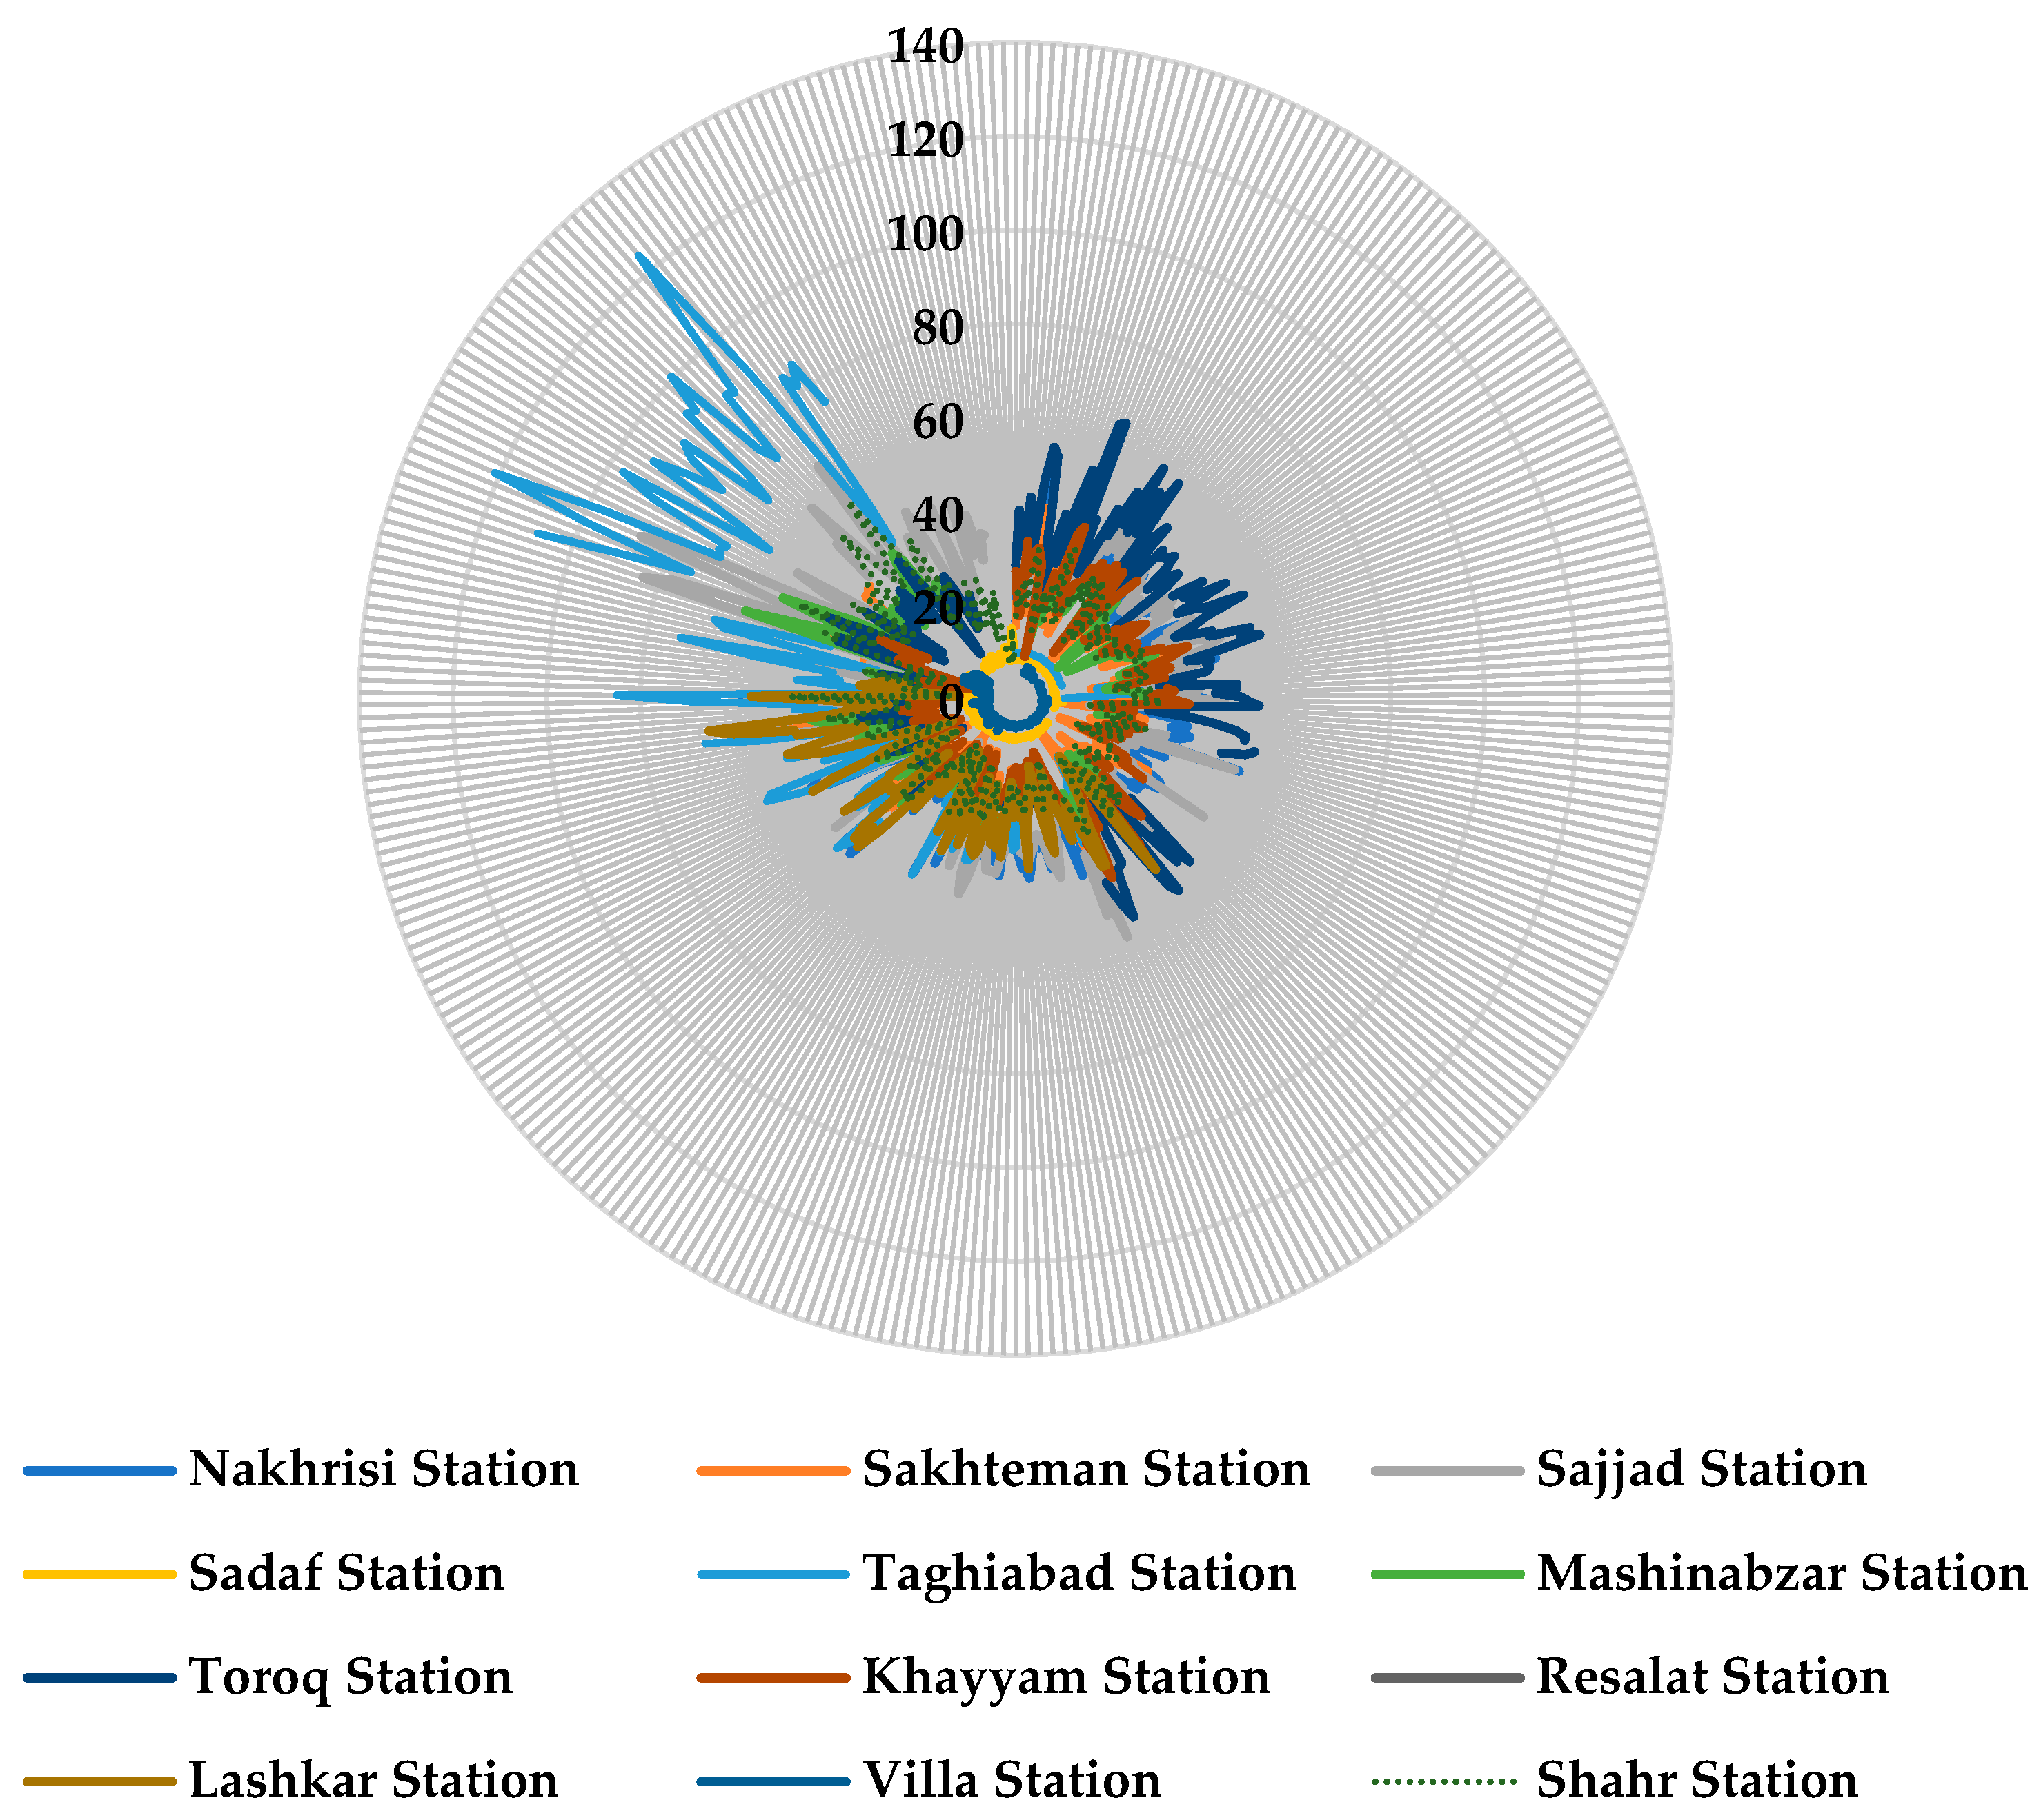
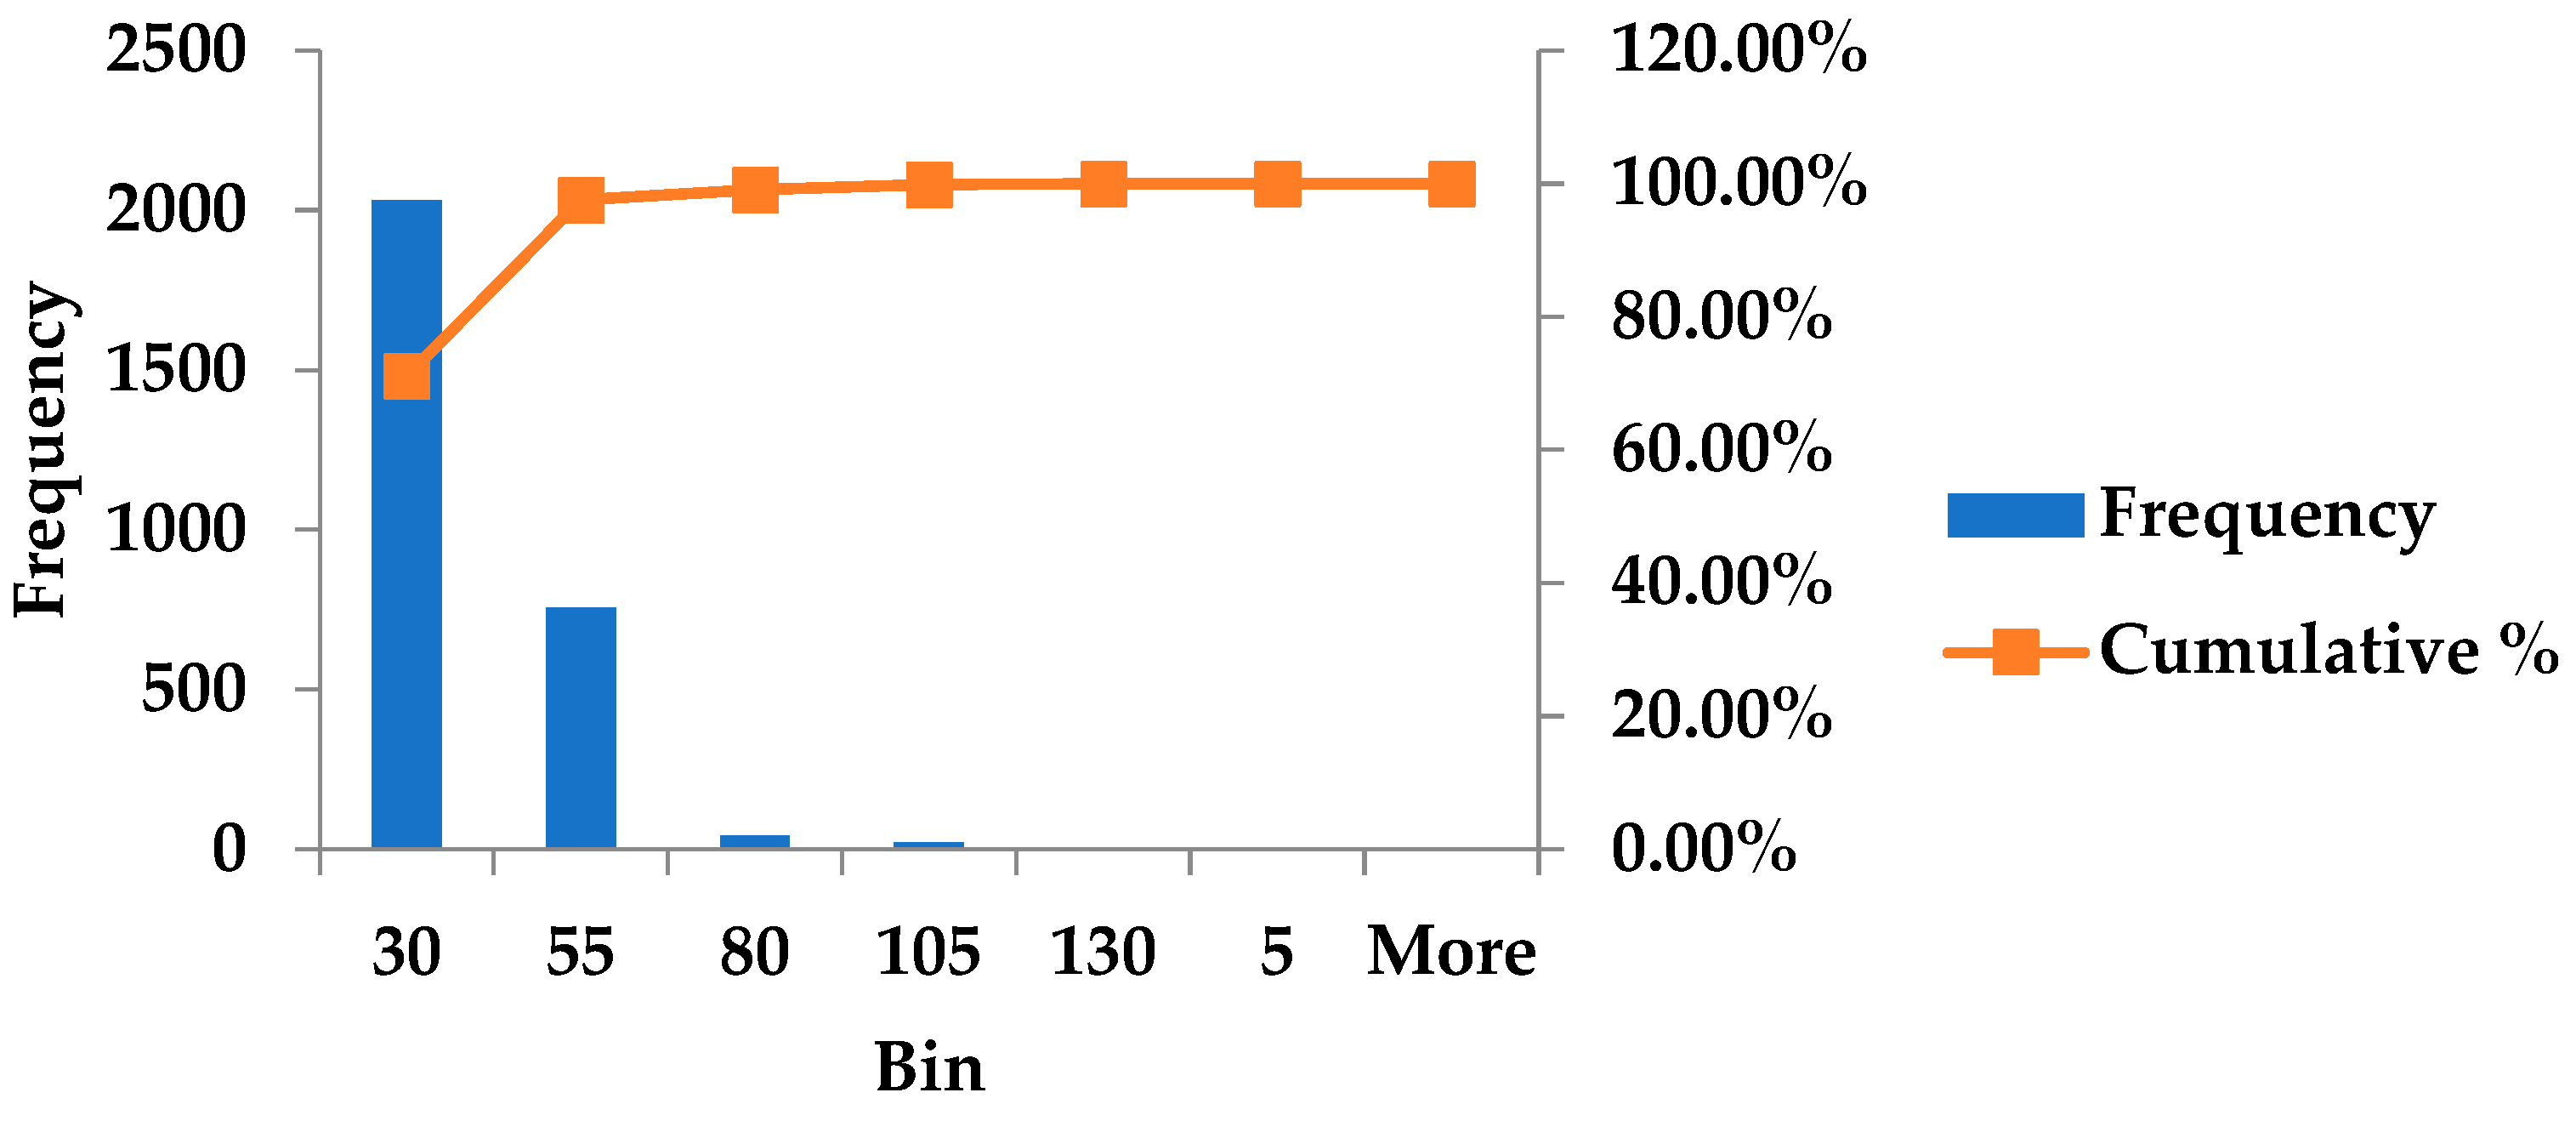
For implementation of the nanocomposite-based sensor in Mashhad City, first, the condition of NO2 pollution should be evaluated in a one-year time series. The time series NO2 pollution of Mashhad City is related to 2017 and it contains 12 NO2 detection stations (Figure 5). Also, the histogram statistical data of the collected databank are presented in Figure 6.
According to Figure 6, it is clear that the accumulation of NO2 concentration is between [5–30 ppm] and [30–55 ppm] ranges. Therefore, the sensor should have an appropriate response time and sensitivity in the declared ranges.
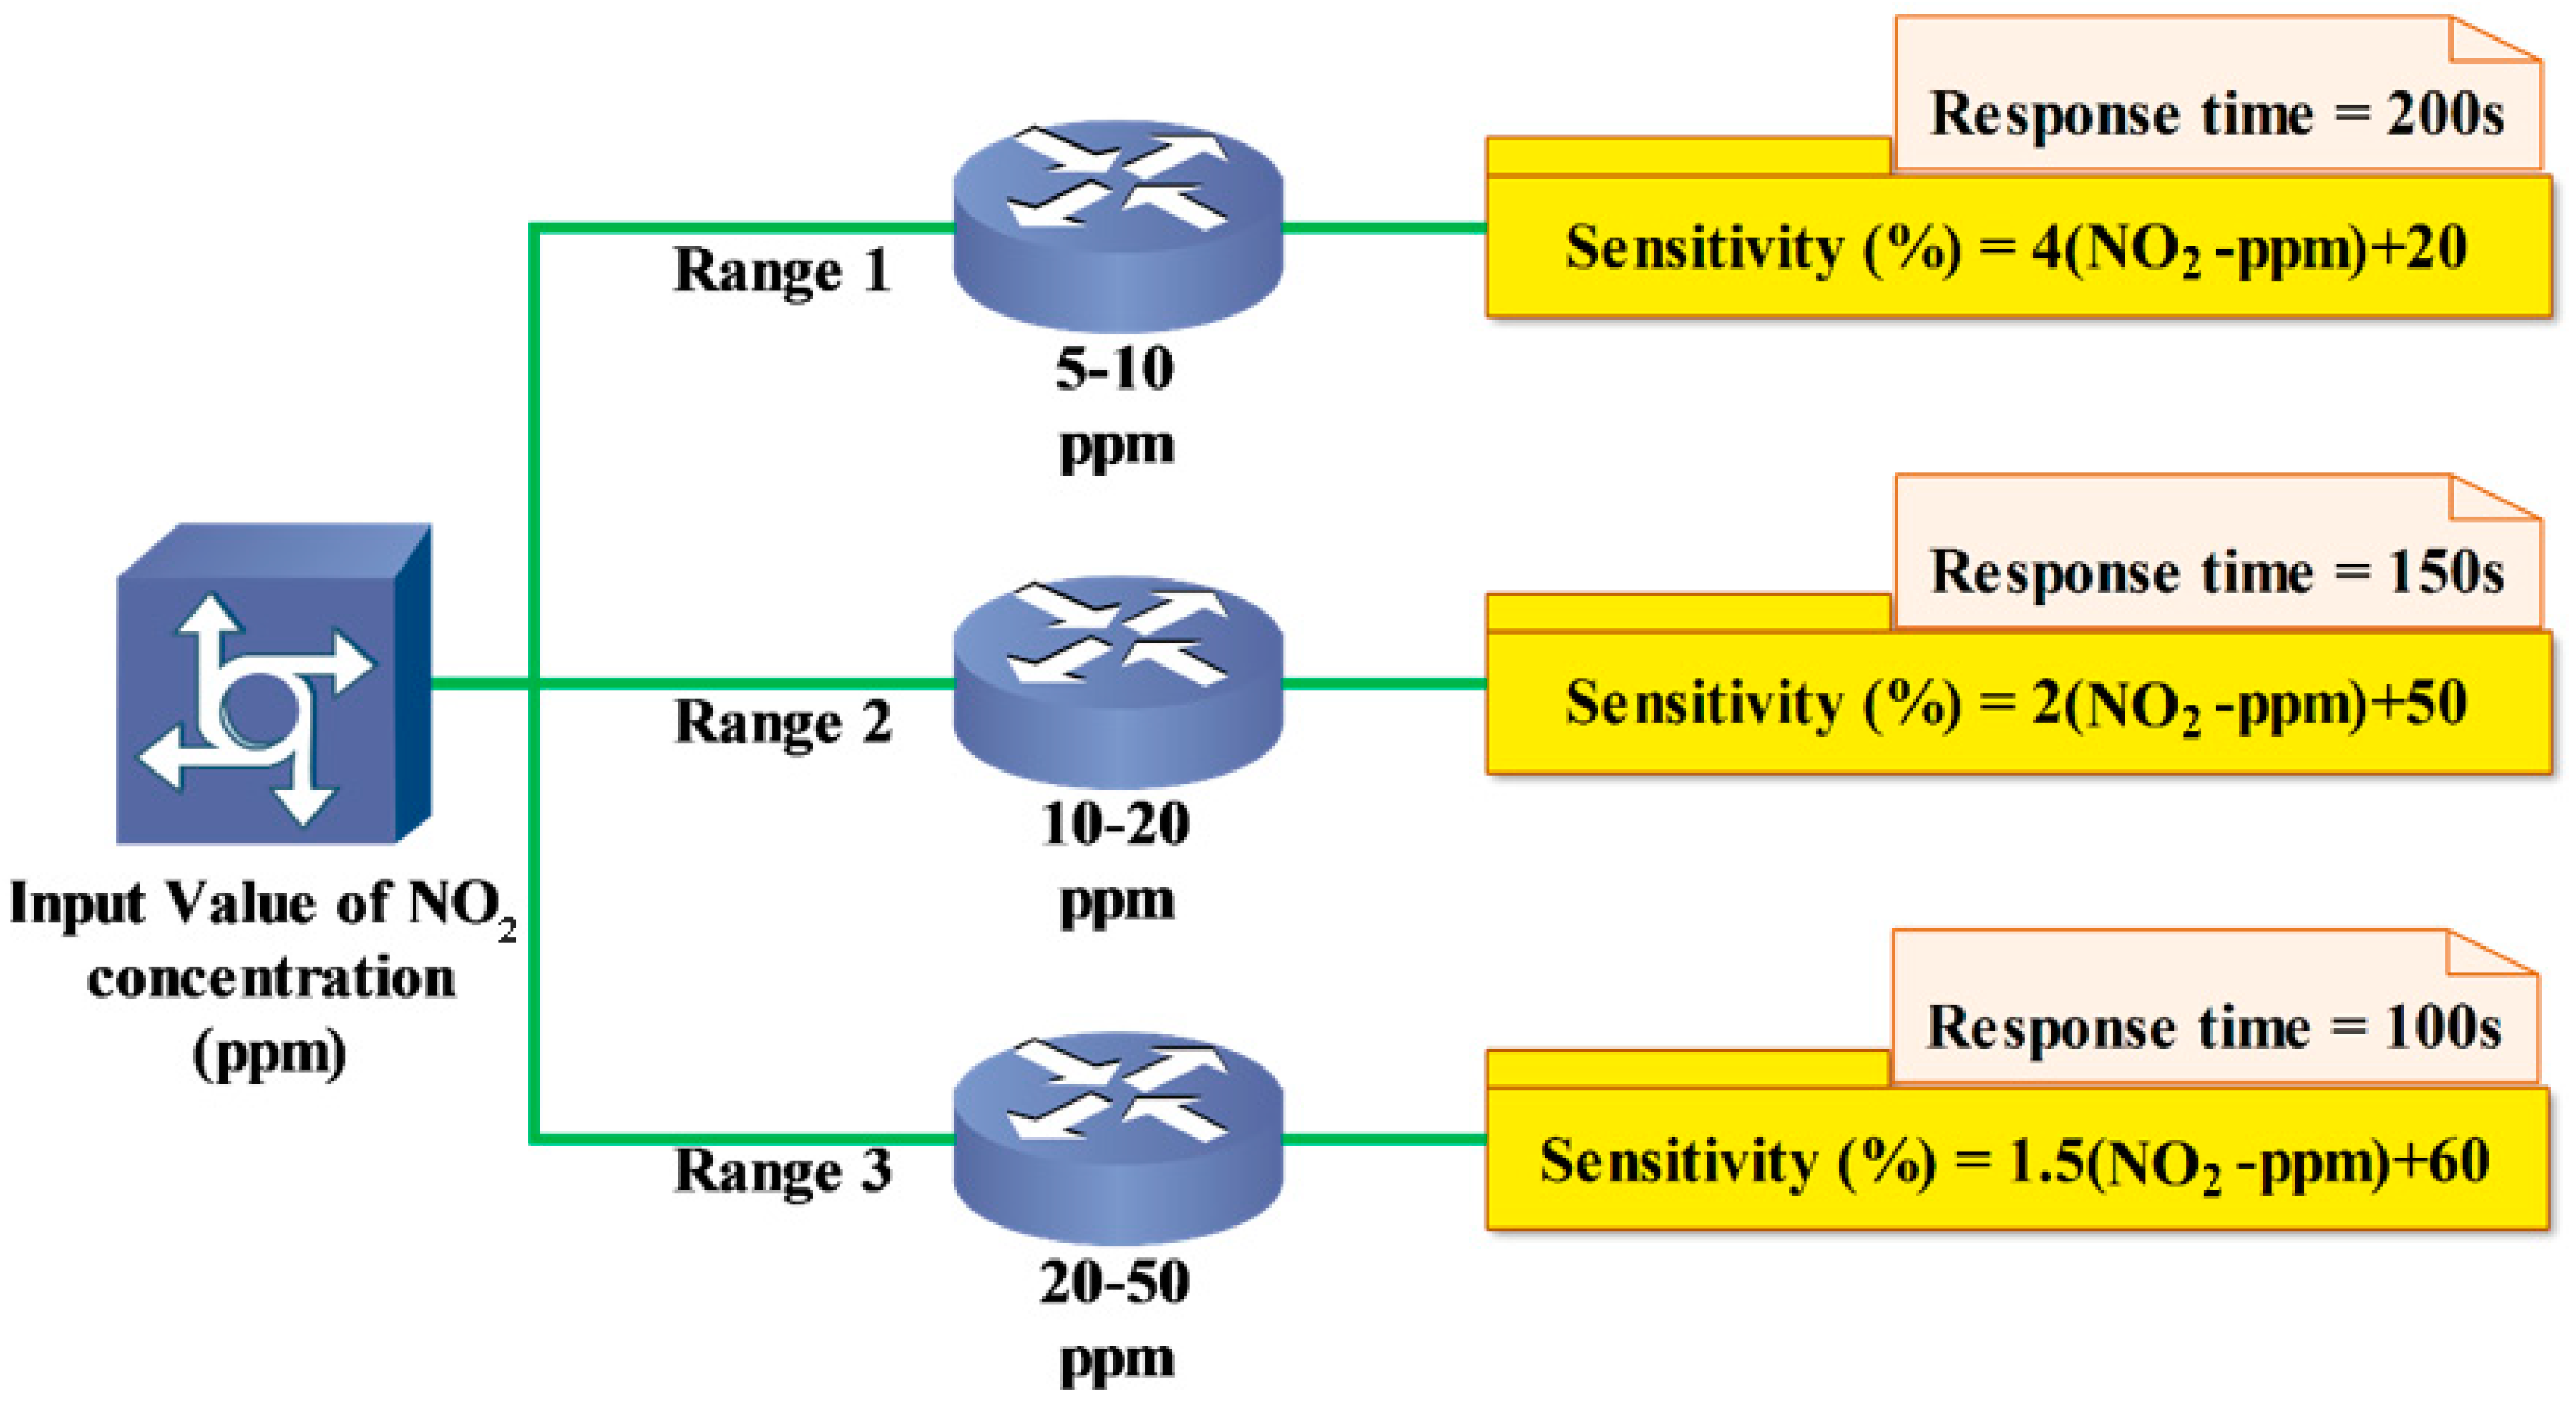
Based on the achievements of the present study, the logic of sensor performance is illustrated in Figure 7. According to the concentrations of NO2 in Mashhad City, it is clear that the amounts of Fe3O4 should be set at 15% (optimum condition). Based on the scheme of the sensor logic (Figure 6), it can be found that the detection range is divided into three categories, 5–10 ppm, 10–20 ppm, and 20–50 ppm, which are obtained from the experimental practices. Also, based on the obtained data from the practical tests, the sensitivity values in the ranges can be computed with the interpolation practices which are displayed in Figure 7, whereas the response time can be determined according to experimental efforts. Therefore, if the system is planned to be executed in Mashhad City, the concept and logic of its programming is modeled in the present study based on the Cisco Network Model.
The regulatory thresholds for NO2 across various air quality standards indicate the allowable concentration limits for different exposure times. For the 24 h average, both the Chinese Ambient Air Quality Standards (CAAQS) Grade-I and Grade-II set the limit at 80 µg/m3. For the annual average, the CAAQS Grade-I and Grade-II, the European Union (EU) ambient air quality tandard (AQS), and the WHO Air Quality Guidelines (AQG) all maintain a standard of 40 µg/m3. In terms of 1 h average exposure, CAAQS Grade-I sets a limit of 150 µg/m3, whereas Grade-II allows up to 500 µg/m3. The European Union air quality standard (EUAQS) suggests a 1 h threshold of 350 µg/m3, with a provision for 24 (days/hours) exceedances per year. These varying limits reflect the different levels of protection and varying public health objectives aimed at controlling NO2 pollution within each regulatory framework [47]. These guidelines and standards are critical for protecting public health and the environment by setting clear limits on NO2 concentrations in the air. They provide a framework for policymakers and environmental agencies to develop strategies and regulations that reduce NO2 emissions and promote cleaner air quality globally. Therefore, as per the local standard in each region, the created concept can be implemented as an alarm management system in megacities. According to sensor networks, the data are received at datacenters, and then, with these concepts of thresholding, the analysis and alarms can be programmed.
The dose–response function is an essential tool for assessing the health impacts associated with changes in NO2 concentration. This function helps researchers and policymakers understand the relationship between NO2 exposure levels and various health outcomes, enabling them to estimate the potential benefits of reducing air pollution. In studies and policy assessments, specific dose–response values are used to quantify these impacts [48]. Based on the study, the dose–response relationship for NO2 exposure and mortality varies depending on whether the analysis considers NO2 in isolation or alongside other pollutants. In the single-pollutant model, an increase of 24.0 ppb in NO2 concentration is associated with a 2.8% increase in all-cause mortality, with a 95% confidence interval ranging from 2.1% to 3.5%. This suggests a clear and significant impact of NO2 on mortality when considered alone. However, when evaluated using multipollutant models, which account for the presence of other air pollutants, the effect size is reduced to a 0.9% increase in mortality per 24.0 ppb rise in NO2 concentration, with a 95% confidence interval from −0.1% to 2.0%. This reduction highlights the complex interactions between NO2 and other pollutants and suggests that NO2’s effect on mortality may be partially confounded or modulated by the presence of other air contaminants. Therefore, according to the values, thresholds could be designed in different conditions dynamically [49].
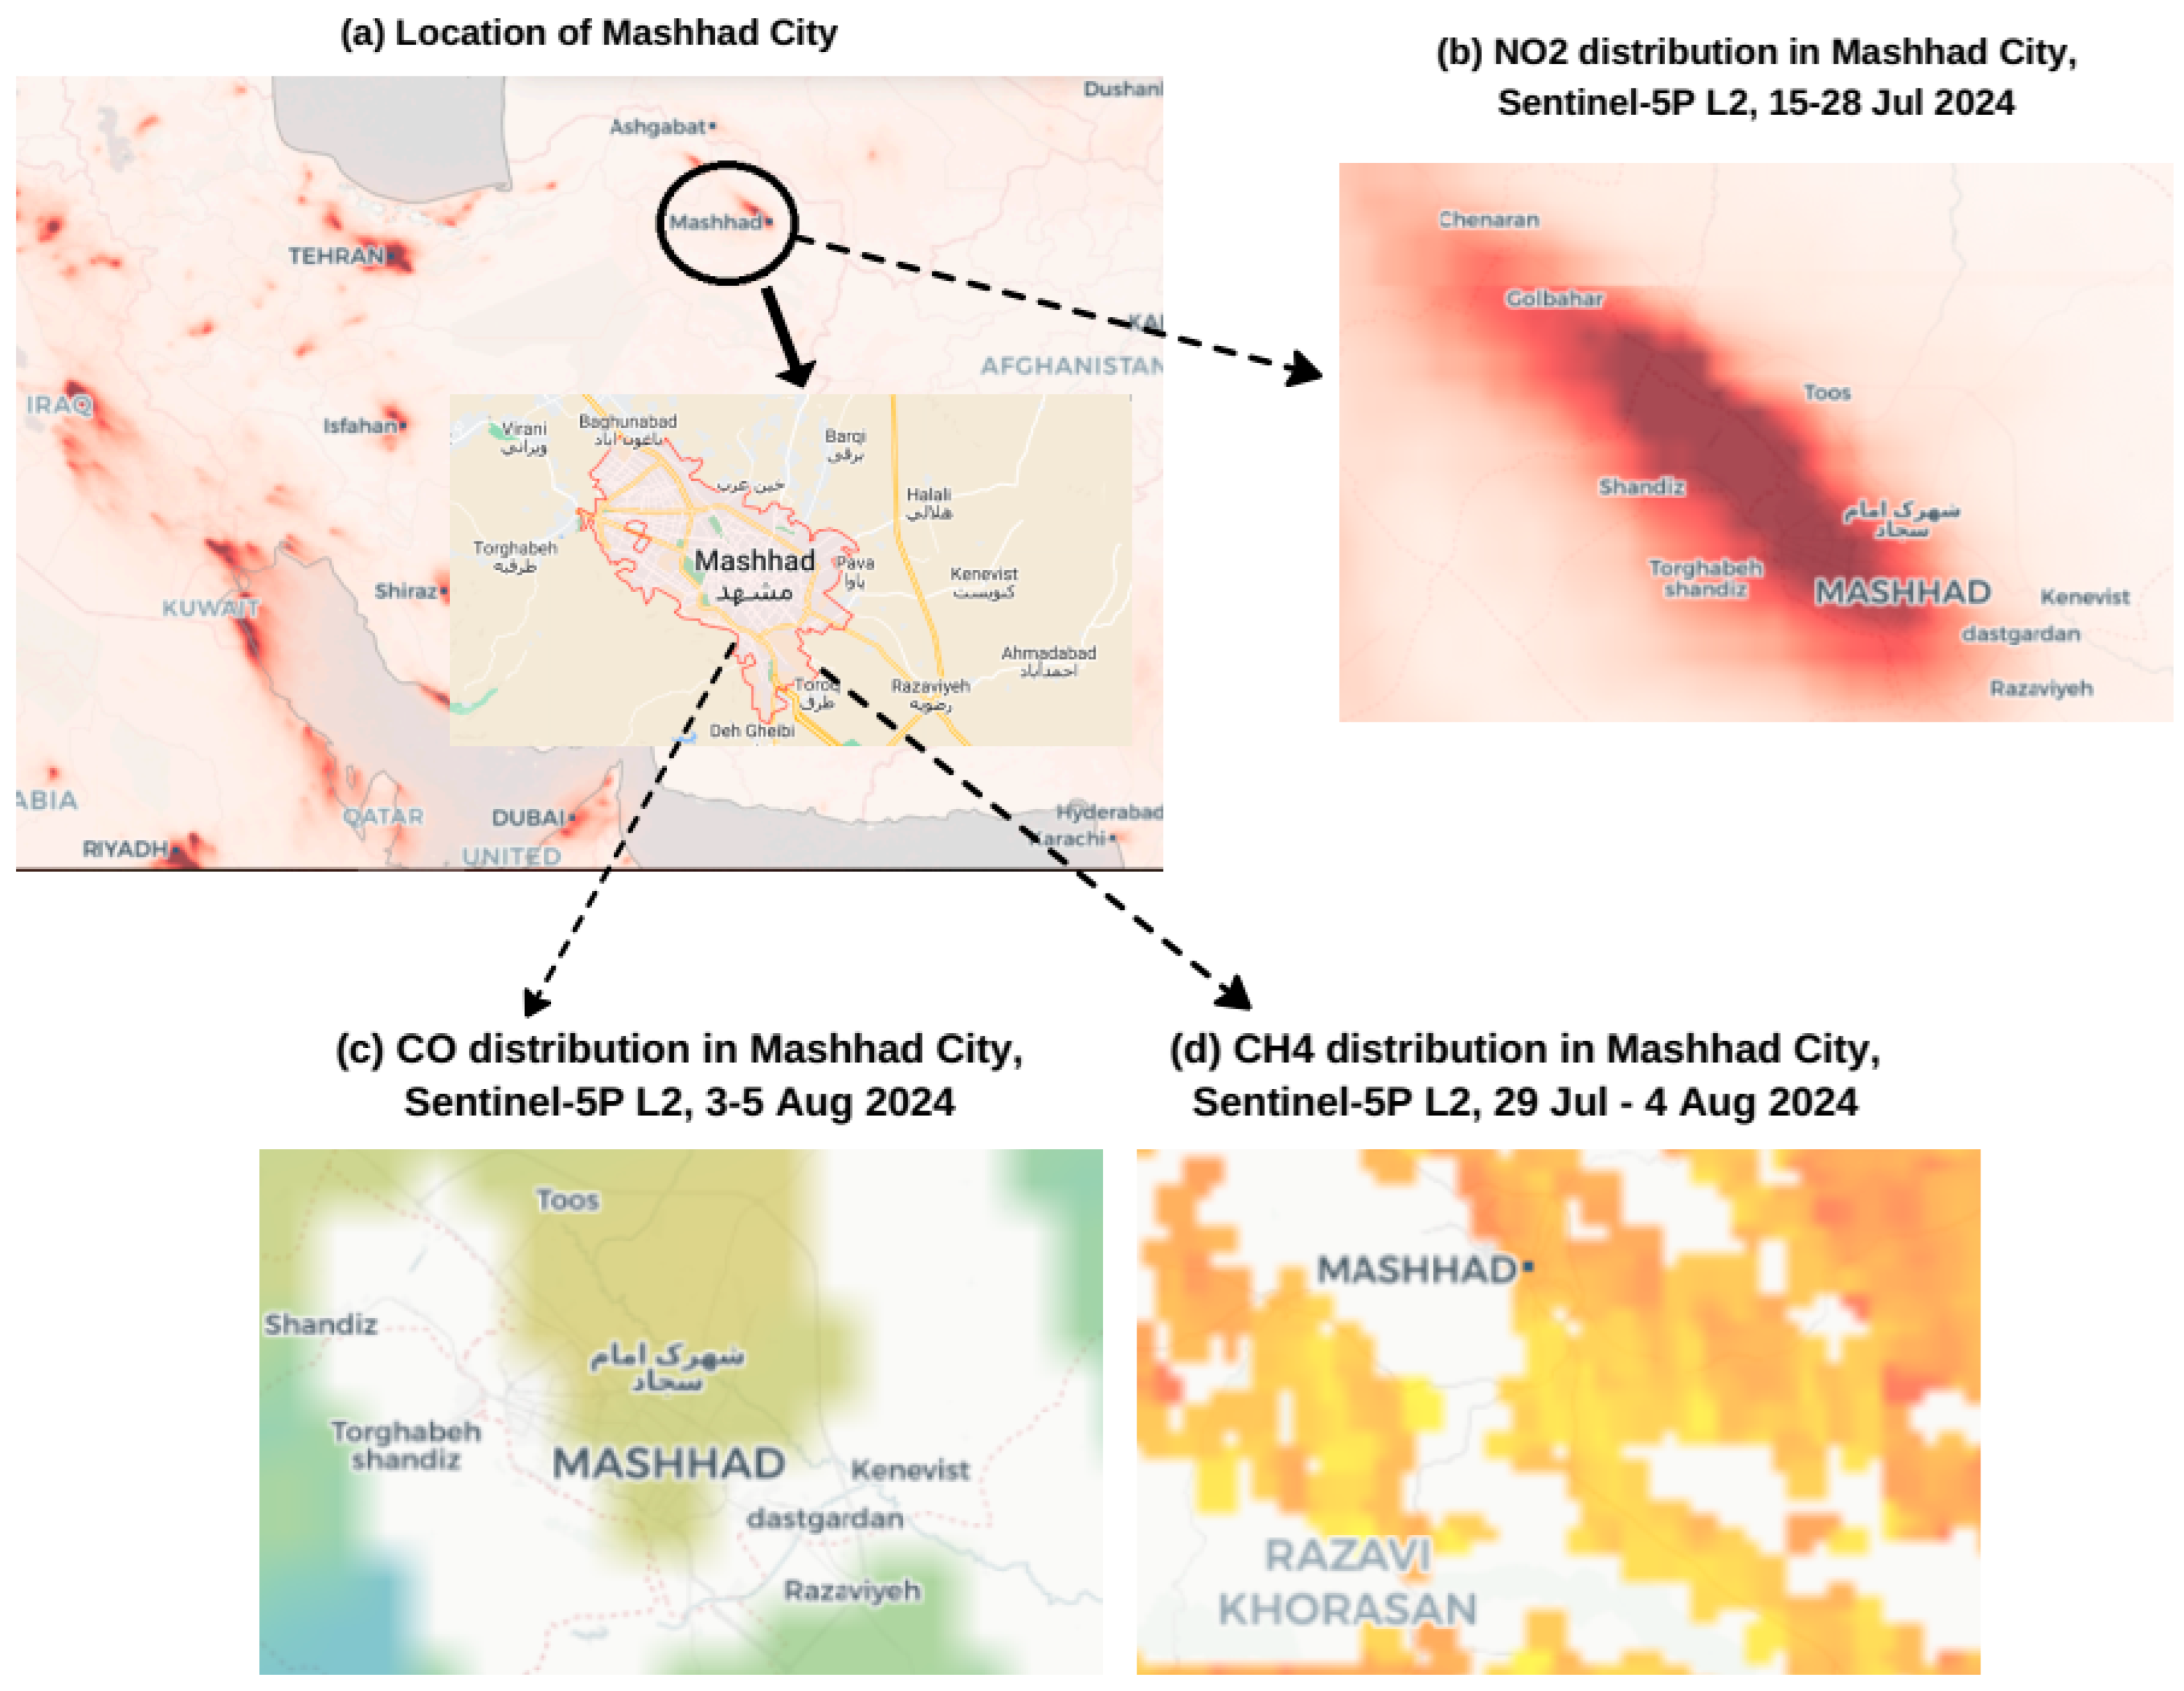
Figure 8 displays a composite map highlighting pollutant distribution in Mashhad City, Iran, derived from Sentinel-5P satellite data across different dates in July and August 2024. The map is segmented into four main parts. Figure 8a shows a regional map indicating the location of Mashhad relative to neighboring countries, marked by varying shades of red to reflect different pollution levels. Figure 8b presents the distribution of nitrogen dioxide (NO2) in Mashhad from 15 July to 28 July 2024, depicted by a color gradient ranging from yellow to red, signifying various concentrations of NO2. In Figure 8c, the distribution of carbon monoxide (CO) from 3 August to 5 August 2024 is visualized, with lighter shades indicating lower concentrations and darker shades representing higher levels. Figure 8d illustrates the methane (CH4) distribution from 29 July to 4 August 2024, using a color transition from light yellow to deep orange to indicate increasing methane levels [50].

4. Managerial Insights

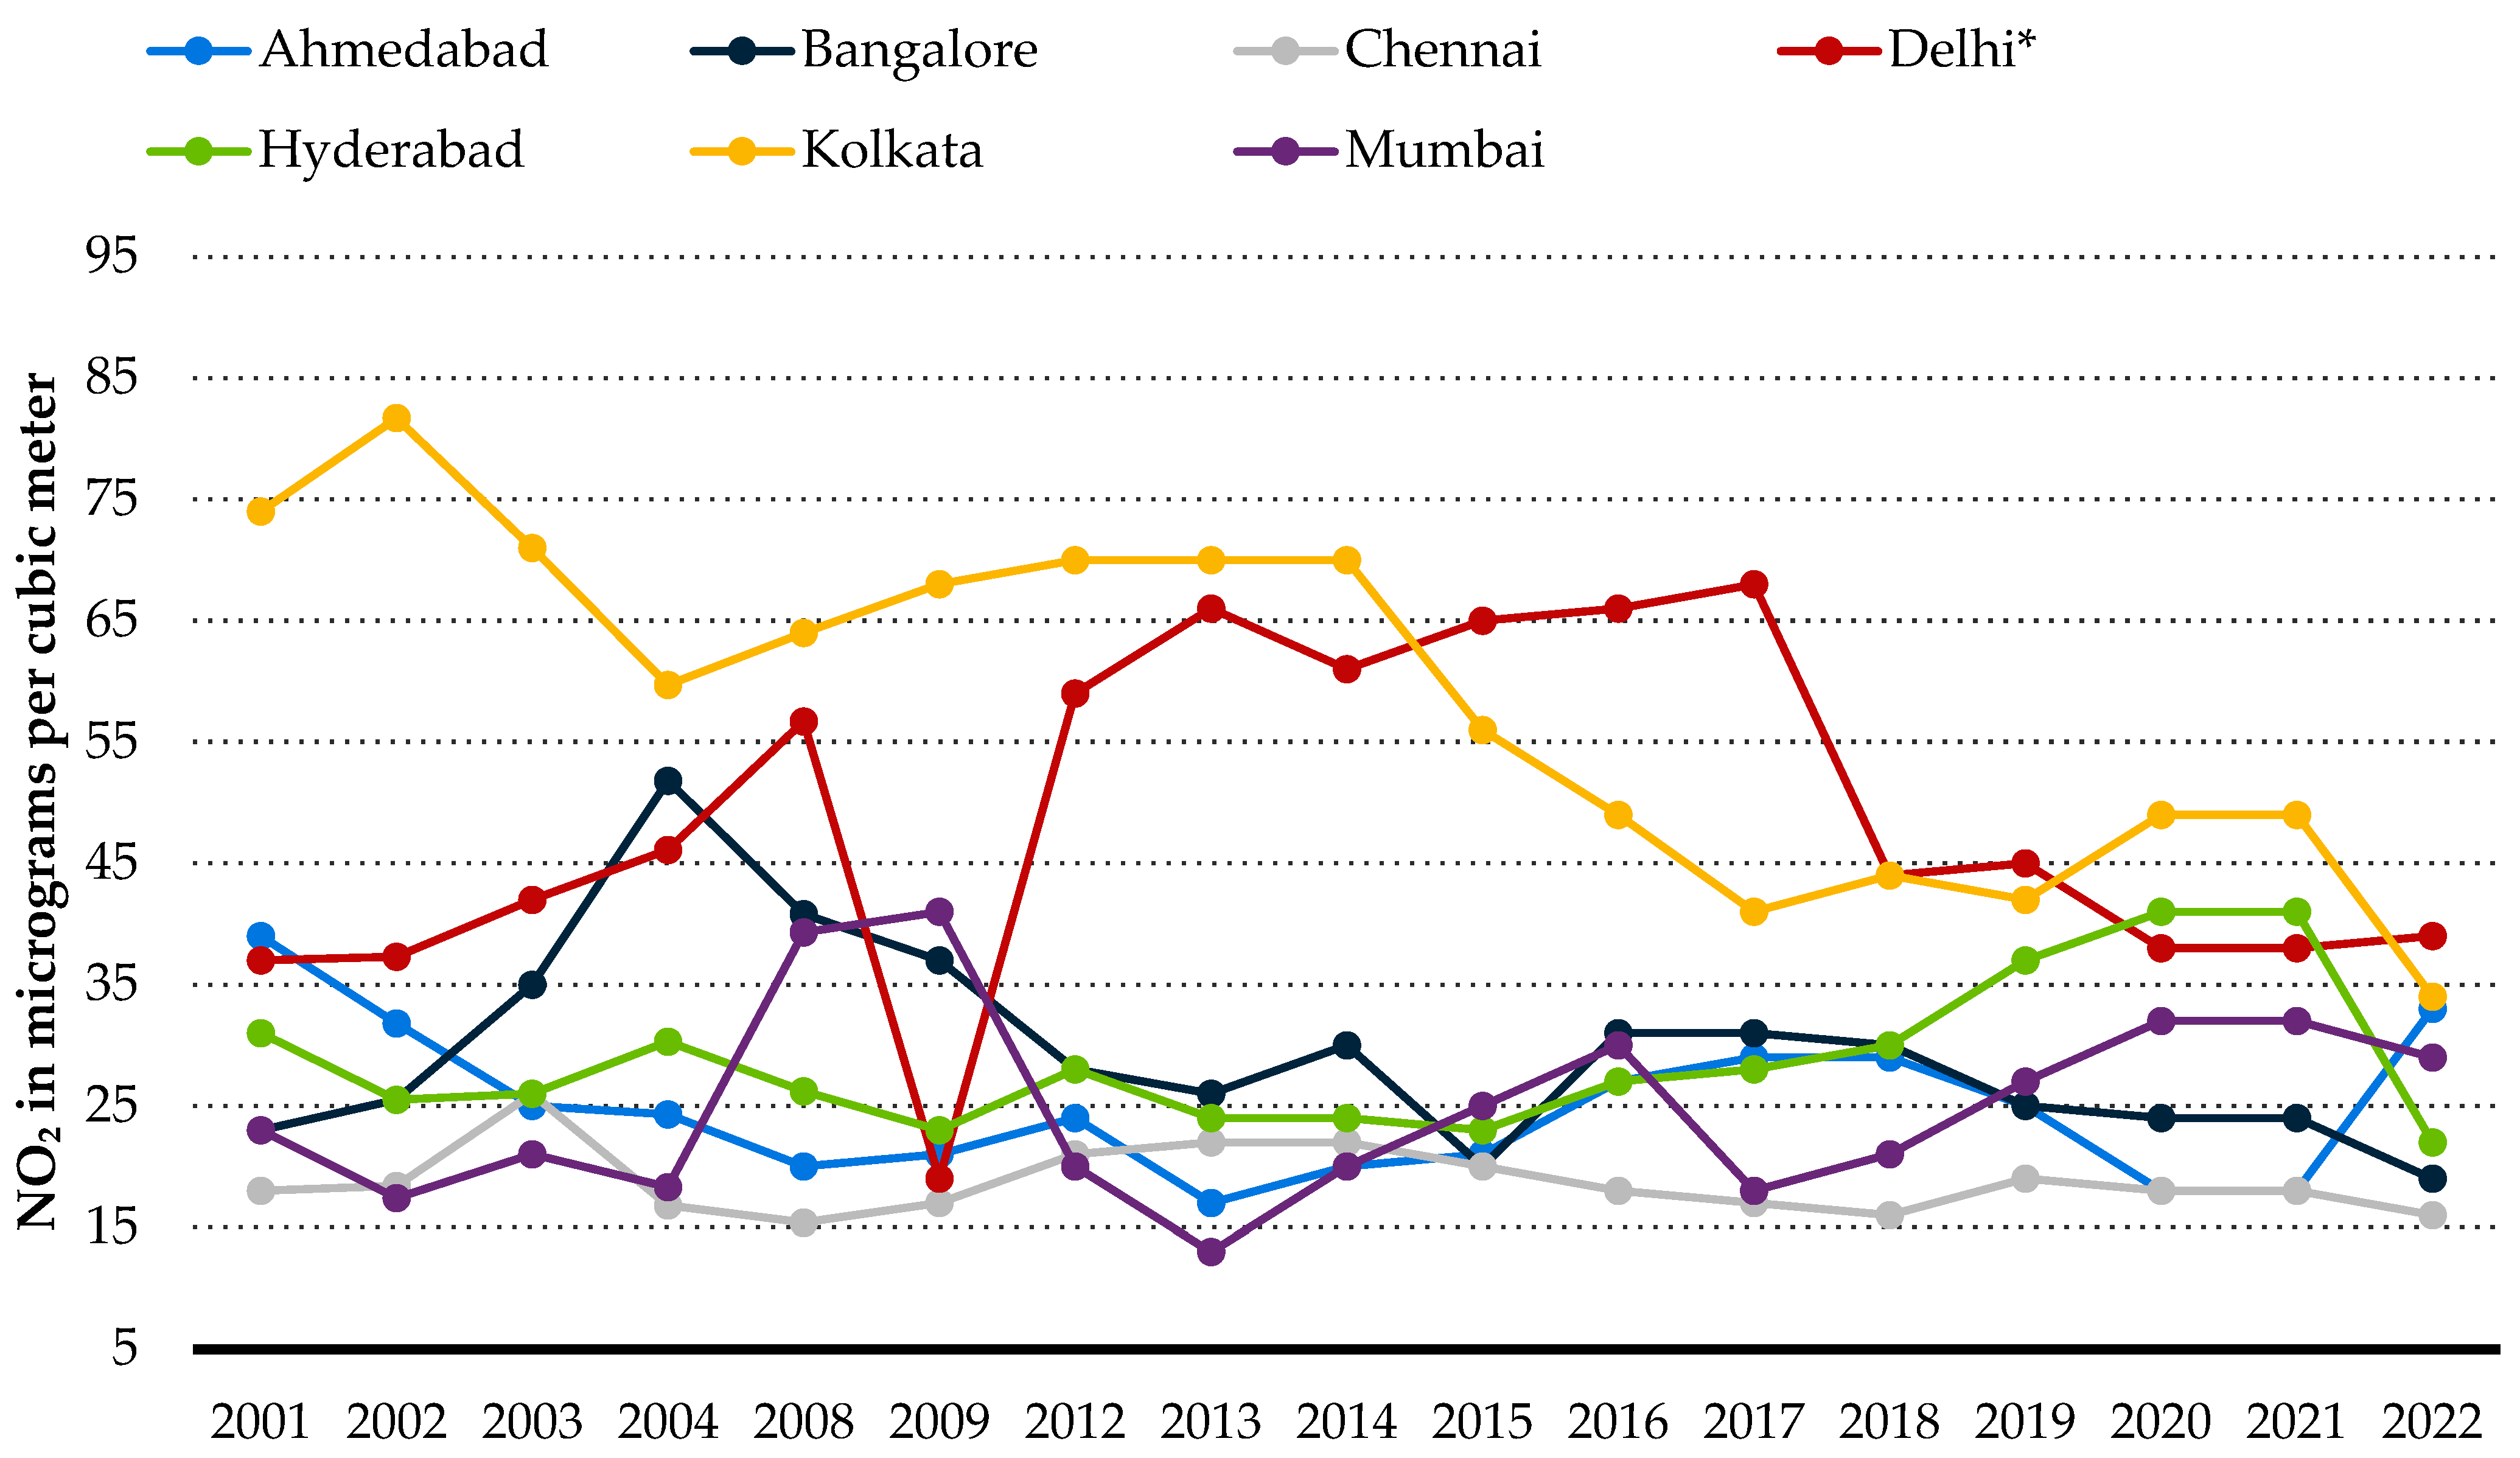
This section of the present study focuses on the utilization of the developed NO2 sensor for various purposes. According to Figure 9, it is evident that India faces a significant issue in terms of the concentration of NO2 in the air. By utilizing the sensor introduced in this study, it is possible to establish a sensor network in India. India was chosen as the comparative country because there were no available data from Iran. India was selected due to its similar geographical aspects and pollution levels.
Figure 10a–d provide a comparative overview of the air quality index (AQI) [52] on 11 August 2024 in both India and Iran, specifically focusing on the capitals, Delhi and Tehran. These visuals show a notable similarity in the AQI status, with both cities marked as “Unhealthy” due to similar levels of pollutants, with Tehran at an AQI of 159 and Delhi slightly lower at 153. This proximity in AQI readings suggests that residents in both cities are likely experiencing comparable adverse health effects due to air pollution (Figure 10a,b). A deeper look into the specific pollutants reveals that PM2.5, NO2, and SO2 are significant contributors to the poor air quality in both capitals. These pollutants are typically linked to urban settings dense with vehicular traffic and industrial activities, indicating similar sources of pollution. Both cities also show high temperatures on the same day, which can worsen air quality issues. High temperatures can accelerate the formation of ground-level ozone and increase electricity demand (for cooling), thereby indirectly boosting pollutant emissions from power generation (Figure 10c,d). Furthermore, the meteorological data indicate that neither city expects rain on this date, which is crucial as precipitation can help alleviate pollution by removing pollutants from the air. The absence of rain could be a contributing factor to the persistence of high pollution levels. The forecasts also suggest that both cities might continue to experience similar trends in pollutant levels, enabling city managers to anticipate and manage air quality issues more effectively (Figure 10c,d). These parallels suggest that environmental managers in Iran and India could benefit from sharing insights and strategies, particularly those related to pollution prediction, public health advisories, and proactive pollution control measures. Understanding and reacting to weather patterns, along with implementing effective pollution management strategies, could significantly improve urban air quality management in both cities. Therefore, due to the managerial insights for Mashhad City in terms of NO2 management, the strategies of Delhi could be considered.
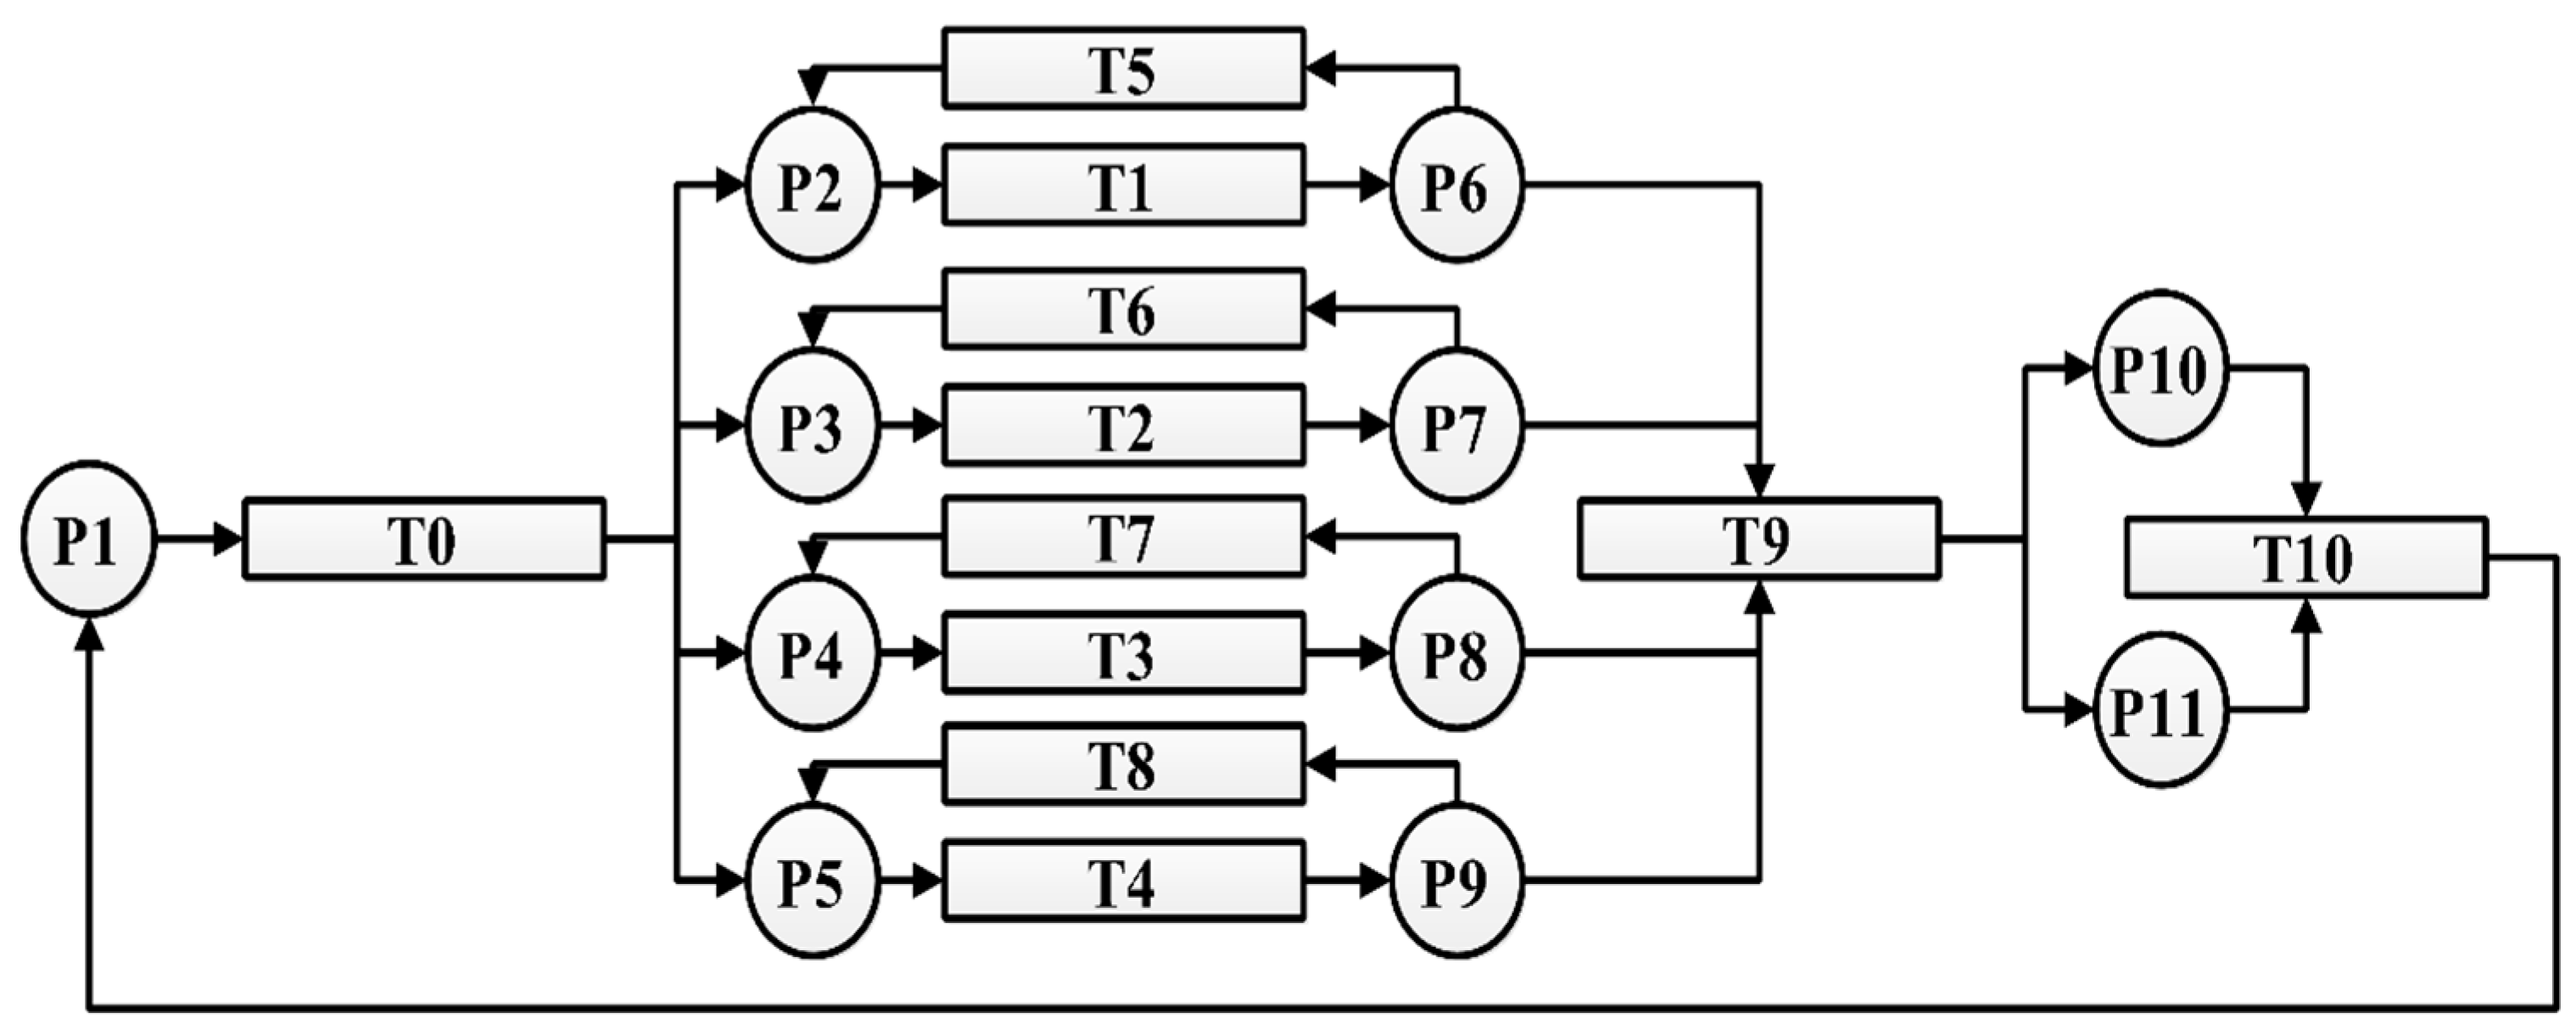
In the following, the operation system of the created model is presented based on the Petri Net technique in Figure 11. The Petri Net technique is a method for conceptual modeling of designed systems as a controlling framework [53]. In the described model, the circles and rectangles are applied for acts and conditions, respectively. In terms of the scheme, it can be seen that four factors, pollution concentration (P1), resistance amount (P2), Fe3O4 percentage (P3), and temperature (P4), are checked and two functions (sensitivity and response time) [43] are controlled. The main goal of using Petri Net modeling is related to maintaining the optimum condition in real field operations of the sensor network for different case studies.
In Figure 11 (the structure of Petri Net modeling), it can be seen that in the first step, the raw data of the monitoring sensor are imported to the model (P0), the data are validated (T0) based on the experimental thresholds, and then, the data are approved (P1–P4). Then, the value of the input operational condition is compared with the optimal condition which is deduced during this investigation (P6–P9). Therefore, the temperature should be set at room temperature and Fe3O4 should be adjusted to 15%. Likewise, the concentration of NO2 in the sample chamber should be more than 5 ppm. The concentration of pollution is not related to the value of contamination in the air, because the volume of air is not comparable with that of the test chamber. Therefore, the precision of the sensor is greater than the demand of cities for air pollution control. Finally, the value of resistance is related to air injection, and it should be controlled with trial-and-error practices; it is assumed to be the most flexible feature in the present system. After comparing the input data with optimal amounts and readjusting the process, they will be checked again in T5–T8. Then, after setting the effective features in P6–P9, the optimum conditions of all the features are tested at the same time. In the last step of this study, sensitivity and response time are controlled in P10 and P11. When the sensitivity and response time are not less than 140 and 300 s (based on the optimum condition of the experiments), the loop is recycled to achieve the best functional amount. With the application of this system, a sensor network can be applied in developed and developing countries.
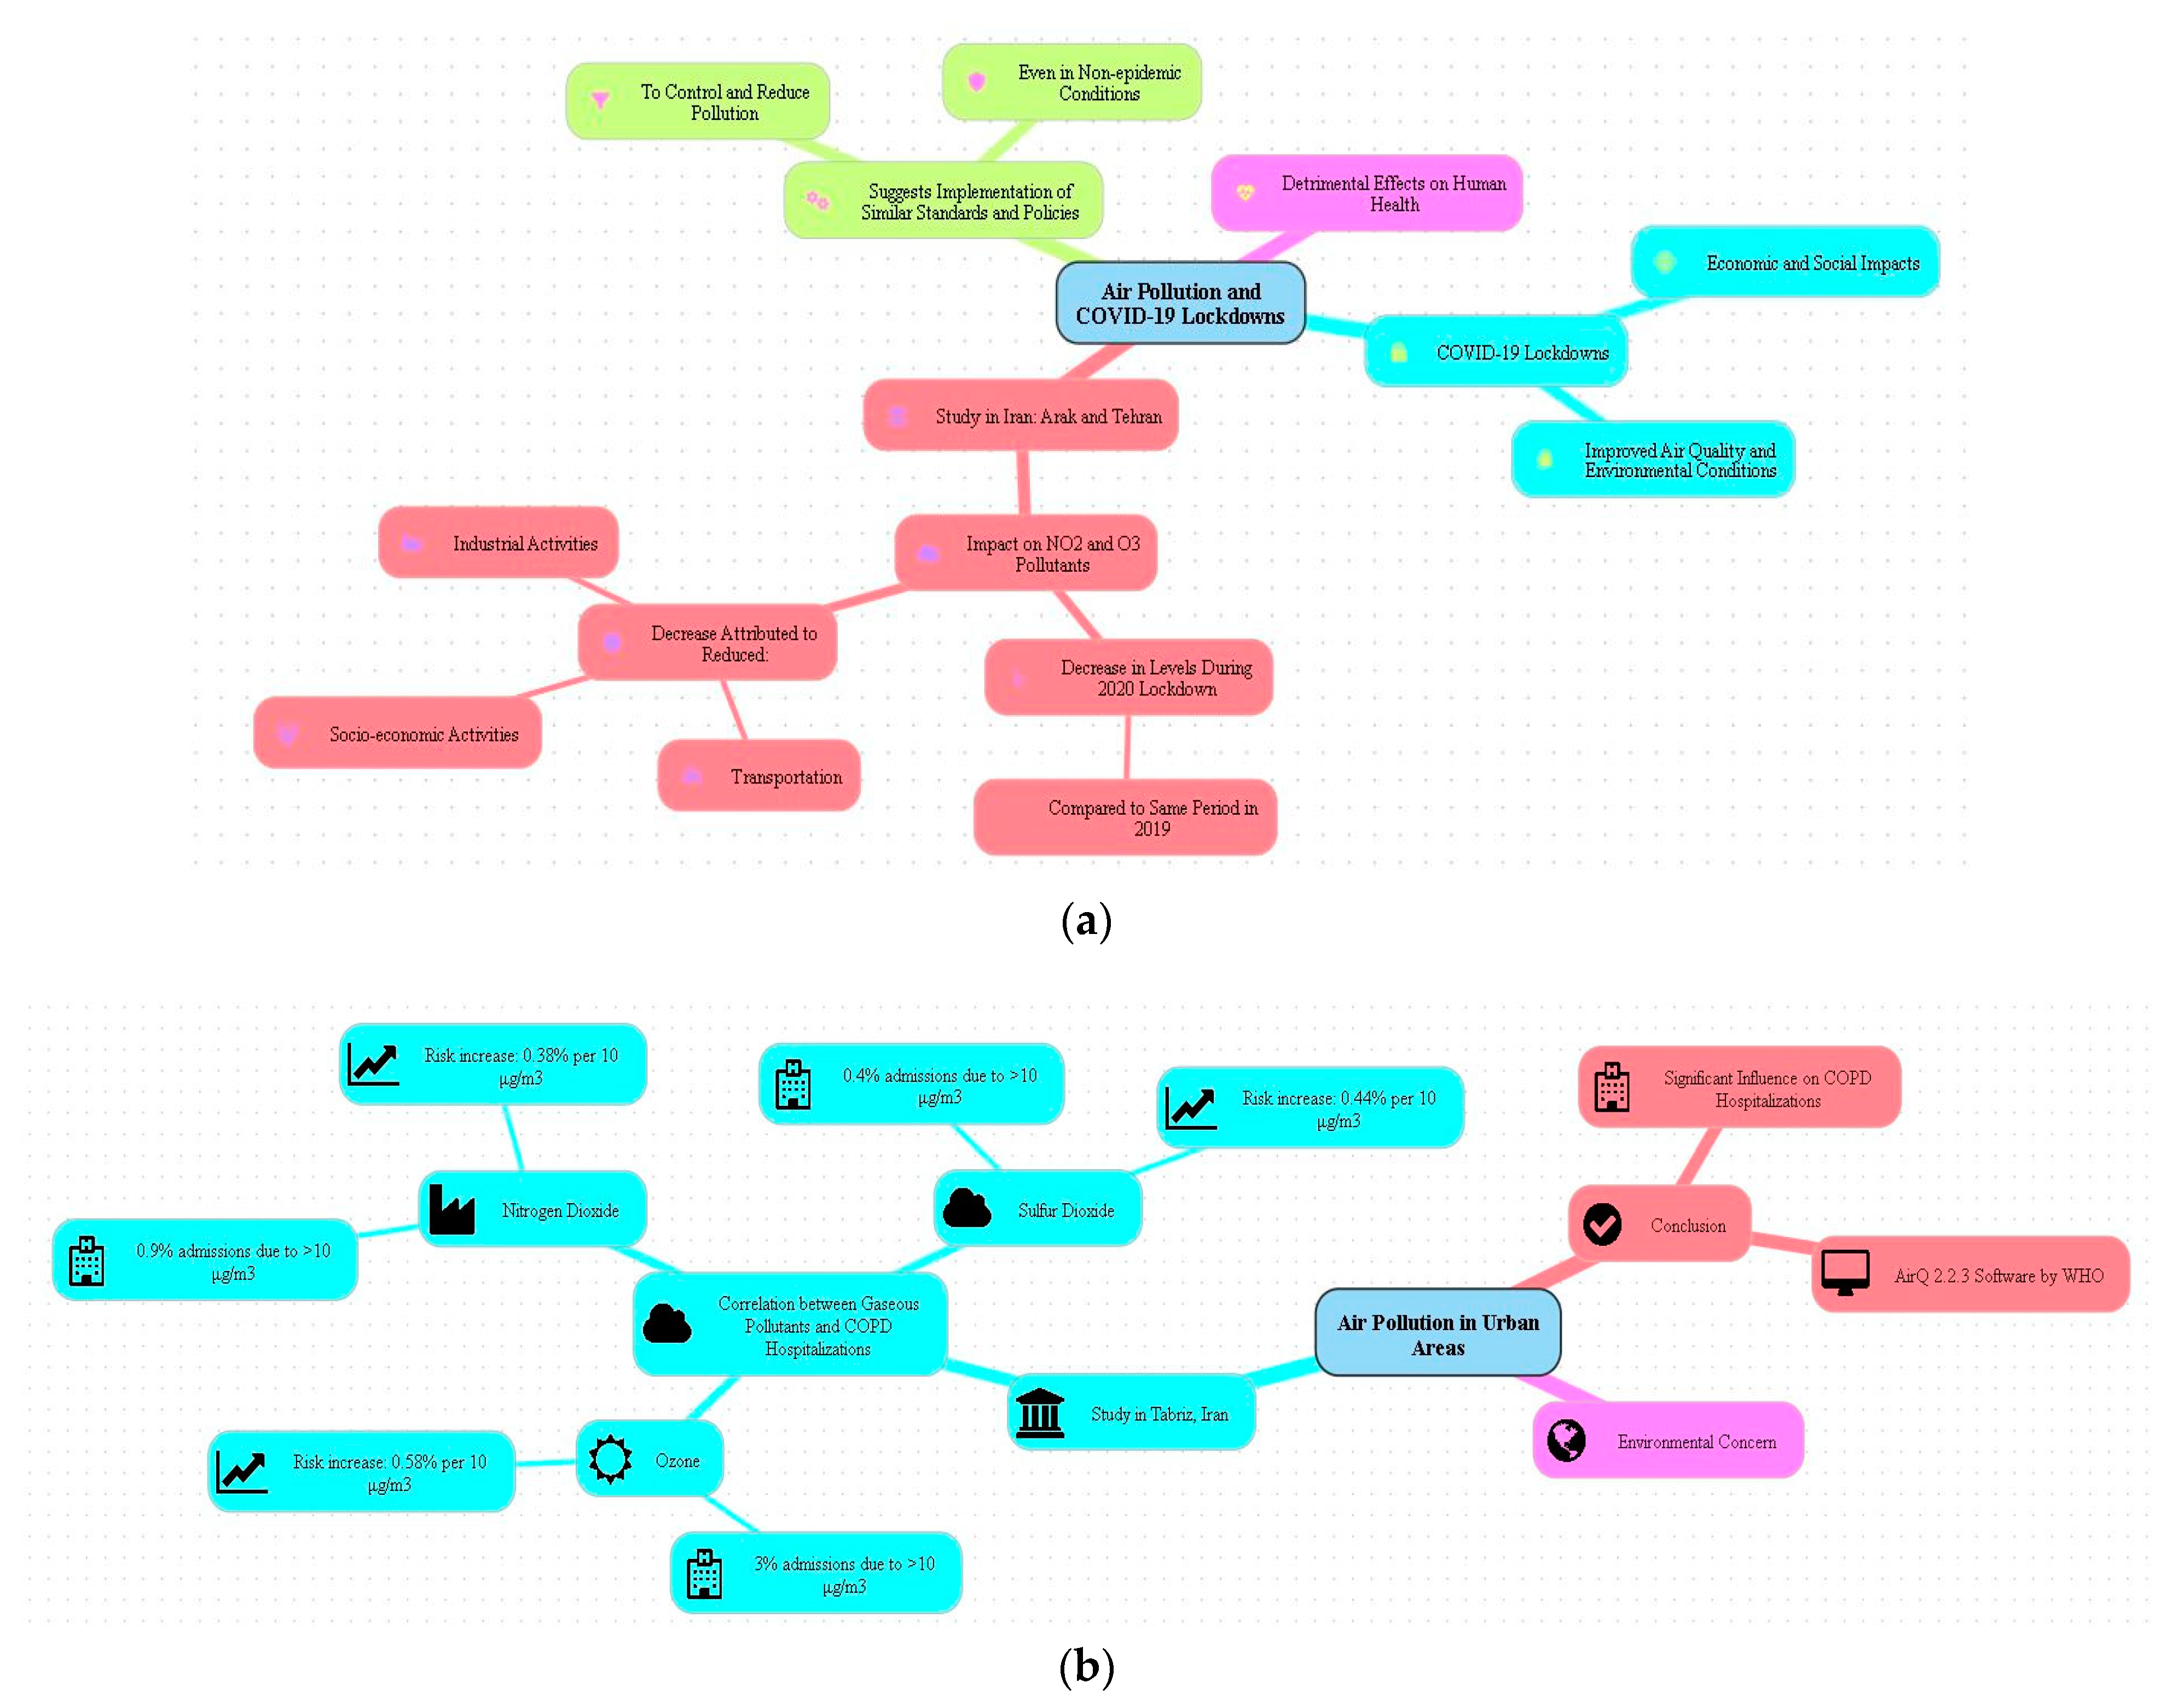
From a managerial point of view, the key takeaway is that targeted interventions can significantly reduce pollution levels and improve public health outcomes. The case study of Tehran and Arak during the COVID-19 lockdown by Gharibvand et al. [54] provides a practical example of how reducing industrial activities and vehicular emissions can lead to tangible improvements in air quality. This suggests that similar policies, such as restricting vehicle use during peak pollution periods and promoting remote work, could be strategically employed to maintain air quality improvements post-pandemic (Figure 12a). From a managerial perspective, the research by Ghozikali et al. [55] offers valuable insights into the direct impact of air pollution on healthcare systems. With a clear link established between pollution levels and hospital admissions for COPD, there is a compelling case for investing in pollution control technologies and public awareness campaigns. Managers in urban planning and public health sectors should consider integrating air quality improvement measures into broader health and infrastructure policies. This could involve enhancing green spaces, improving public transport networks, and implementing stricter emissions standards for industries and vehicles, thereby reducing the burden on healthcare systems and improving community health (Figure 12b).
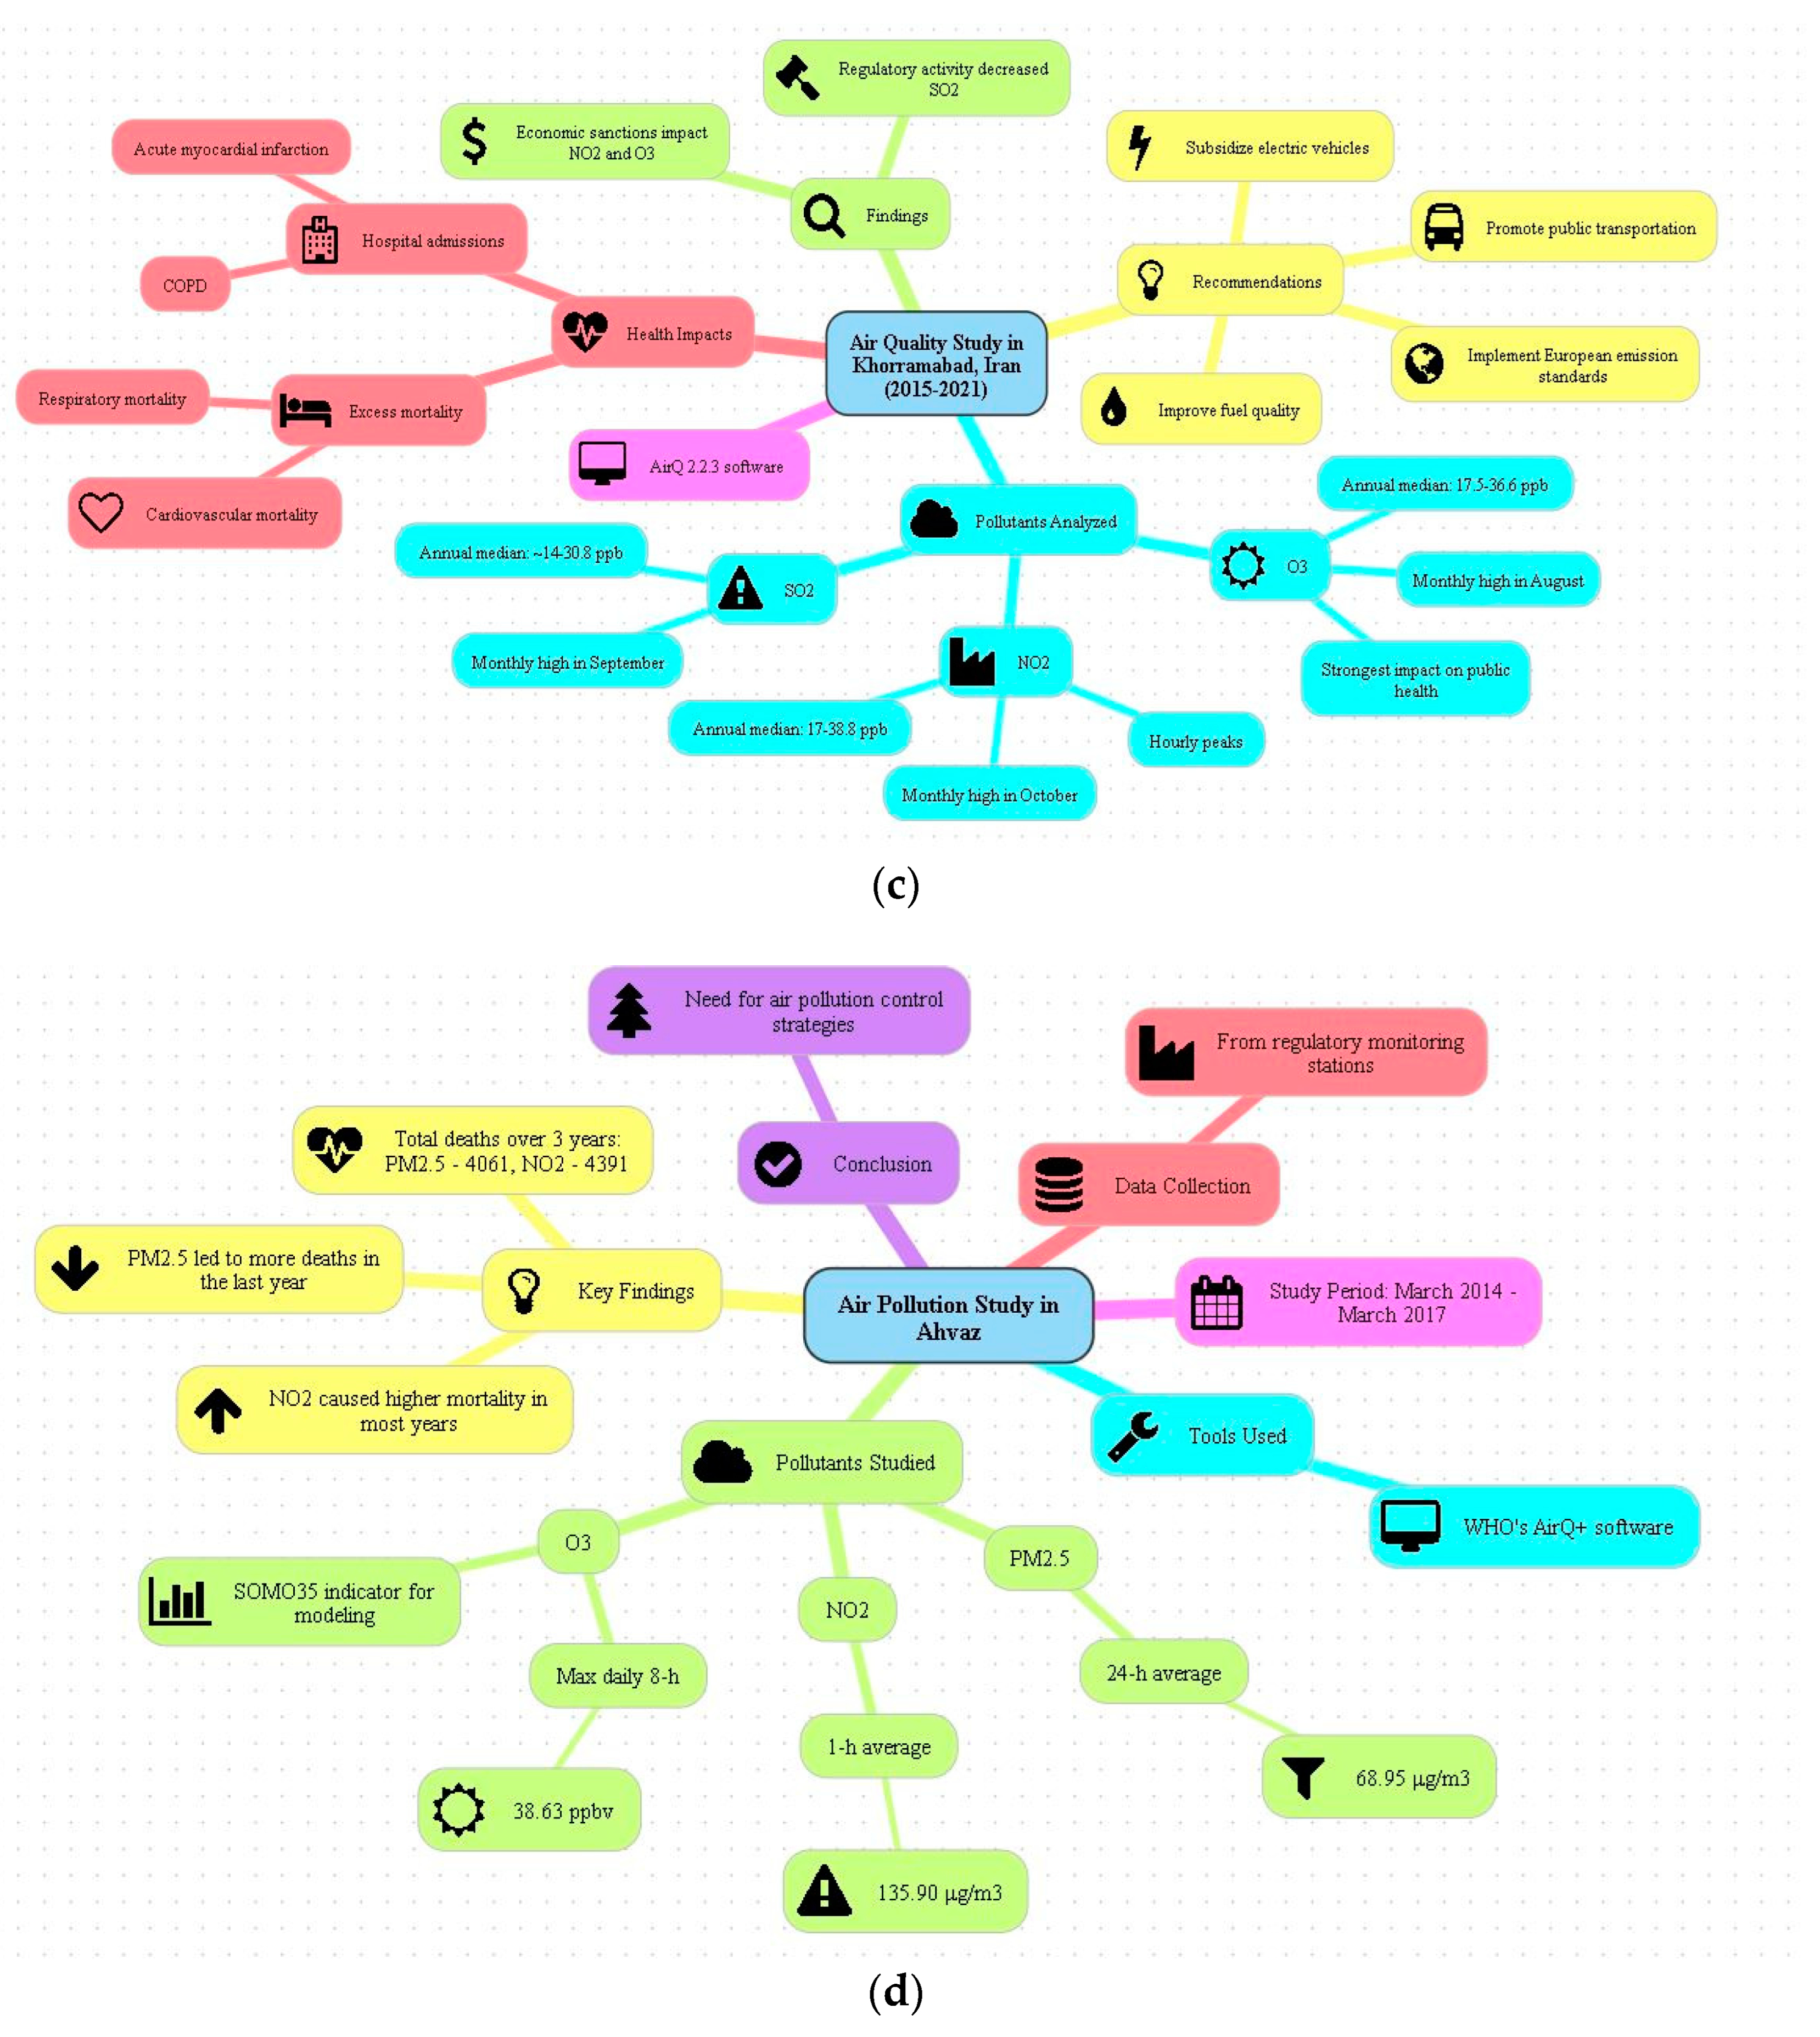
The study by Azimi et al. [56] highlighted the seasonal and temporal dynamics of air pollution, providing a basis for more nuanced management approaches. For instance, understanding that pollutant levels peak at certain times of the day or year allows managers to implement time-specific interventions, such as adjusting traffic flow, regulating industrial operations, or increasing public transit options during these periods. Additionally, by promoting sustainable practices such as the use of cleaner fuels and electric vehicles, cities can achieve long-term reductions in air pollutant levels. Managers can leverage these insights to design policies that not only address immediate pollution issues but also contribute to sustainable urban development goals (Figure 12c). Karimi et al. [57] emphasize the significant health and economic impacts of air pollution, reinforcing the need for comprehensive air quality management strategies. For business and government leaders, this study provides a strong argument for investing in air pollution mitigation measures, which can lead to substantial savings in healthcare costs and productivity gains. Managers should advocate cross-sector collaboration to develop and implement effective pollution control strategies, such as integrating environmental considerations into economic planning and encouraging corporate social responsibility initiatives focused on reducing environmental footprints. By prioritizing air quality improvements, managers can not only enhance public health but also contribute to the overall economic resilience and sustainability of urban environments (Figure 12d).
There is a possibility that predictive or machine learning applications could be beneficial for this purpose too. Alnaim et al. [58] have conducted a study on the utilization of machine learning (ML) to forecast and manage nitrogen dioxide (NO2) emissions from power plants. Their work utilizes remote sensing data and ground-based observations to construct a model that captures the intricate and non-linear connections between emissions and atmospheric conditions. Machine learning, specifically deep learning models such as long short-term memory (LSTM) networks, is utilized to forecast NO2 emissions using data obtained from the TROPOspheric Monitoring Instrument (TROPOMI) satellite, the EPA eGRID network, and NASA’s MERRA meteorological data. The purpose of these models is to offer precise and up-to-date calculations of emissions, while avoiding the excessive computing burden associated with conventional atmospheric models. The study underscores the advantages of machine learning (ML) compared to traditional approaches, specifically emphasizing its capacity to effectively manage extensive, multi-dimensional information and identify concealed patterns in emission trends. Alnaim et al. [58] have built machine learning models that can estimate emissions reliably by combining data from several sources and using daily remote sensing measurements. Preprocessing techniques, such as feature scaling and column shifting, are used to improve the performance of the model. The analysis reveals that the TROPOMI NO2 data, the day of the year, and the average monthly cloud percentage are the primary elements that have a substantial impact on emission forecasts. The findings indicate that machine learning algorithms, particularly LSTM networks, can accurately identify patterns in NO2 emissions and offer dependable estimations for power plants. The models exhibit a Mean Absolute Error (MAE) that varies from 0.126 to 0.166 and a Mean Squared Error (MSE) that falls within the range from 0.0348 to 0.0506. The measurements demonstrate the greater performance of ML models in comparison to classic linear regression methods, which exhibit higher error rates. As an example, initial linear regression tests yielded a Mean Absolute Error (MAE) of 0.081 and an error rate of 54.86%, highlighting the necessity of employing sophisticated machine learning (ML) approaches to enhance accuracy. Although the study shows positive outcomes, it recognizes the difficulties in obtaining detailed predictions because of the limited precision of current satellite data. This constraint can result in challenges when differentiating emissions from power plants in metropolitan regions where numerous sources contribute to NO2 levels. In order to reduce the impact of external factors on the measurements, the study initially concentrates on power plants located in rural areas.
In the context of air quality monitoring, our study presents a novel application of the Cisco Network Model for analyzing NO2 emissions in a large urban environment, specifically Mashhad City. This approach differs significantly from other studies that have utilized similar methodologies in more confined and controlled environments, such as the work by Bhraguram et al. [59] which introduced an innovative method for monitoring indoor air quality (IAQ) during home quarantine. Their research utilized the IoT to maintain hygienic indoor conditions crucial for disease prevention, particularly during the COVID-19 pandemic. Their study employed the Cisco IoT-based toxic measurement system to monitor carbon monoxide levels within indoor spaces. While this application is highly relevant for individual or small-scale environments, the scope and scale differ markedly from our study. In contrast, our study extends the use of the Cisco Network Model beyond small, enclosed environments to a complex and dynamic urban setting. Building upon the findings of our study, several promising topics for future research can be identified, particularly in the field of advancing sensor technologies and their applications in urban air quality monitoring. One key direction involves the integration of low-cost sensors into urban networks [60,61]. The potential of low-cost sensors (LCSs) to expand the spatial density of atmospheric measurements is significant, mostly in megacities like Mashhad. Future research could focus on developing and deploying a dense network of these sensors to enhance the granularity of air quality data [62]. While these sensors may have lower sensitivity and precision, their widespread deployment can provide a vast amount of data, enabling a more detailed spatial and temporal analysis of pollutants like NO2. Another promising area is the enhancement of sensor accuracy through the use of machine learning. By integrating machine learning algorithms into the data processing pipeline, the limitations of microsensors, such as measurement uncertainty and parameter dependencies, can be mitigated. This would improve the reliability of real-time air quality monitoring in urban settings, making the data more actionable for both researchers and policymakers. Standardization and performance evaluation of air sensors also represent critical areas for future research [63,64]. There is a clear need for consistent performance metrics and certification programs for air quality sensors, as variability in data quality can significantly impact their usability. And lastly, another important issue for future research is to extend the analysis of the Cisco Network Model and Petri Net model to other cities beyond Mashhad. Testing these models in diverse urban environments would provide insights into their robustness and transferability. By applying these models to different megacities, researchers could evaluate their effectiveness in various contexts and assess whether the findings from Mashhad are generalizable to other locations with different environmental and infrastructural characteristics.

5. Conclusions

This study, as a continuation of our previous study [43], conducted an analysis of NO2 emissions in Mashhad City by integrating statistical evaluations and the Cisco Network Model. By leveraging histograms and radar statistical appraisals, we have successfully mapped the distribution and sources of NO2 emissions, offering valuable insights into the urban air pollution landscape. The implementation of the Cisco Network Model has enabled a structured approach to understanding the dynamics of NO2 emissions, highlighting critical control points and optimizing response strategies. Furthermore, the incorporation of Petri Net modeling has enhanced our managerial insights, allowing for a more profound comprehension of the interactions within the air quality management system. This study’s findings underscore the importance of optimal sensor configurations, particularly the adjustment of Fe3O4 to 15%, and the establishment of sensitivity and response time thresholds. The present study has demonstrated that the developed sensor network, when deployed under the modeled conditions, is highly effective for real-time air quality monitoring and management. The framework presented in this study, characterized by its adaptability and accuracy, provides a robust foundation for implementing similar air quality management systems in other megacities, thereby contributing to global efforts in combating urban air pollution.

Author Contributions

M.G. and R.M. contributed to the development of this work equally. All authors have read and agreed to the published version of the manuscript.

Funding

This research received no external funding.

Data Availability Statement

The data that support the findings of this study are available on request from the corresponding author. The data are not publicly available due to ongoing collaborations.

Conflicts of Interest

The authors declare no conflicts of interest.

References

  1. Maleki, A.A.; Tanjah, F.; Vaezi, G. Relationship between Air Pollutants and Mortality from Cardiorespiratory Diseases in Mashhad: A Step Towards Increasing Citizens’ Awareness of Adverse Effects of Pollutants. J. Environ. Educ. Sustain. Dev. 2019, 7, 117–126. [Google Scholar] [CrossRef]
  2. Hatami, M.; Mohammadi, M.M.; Esmaeli, R.; Mohammadi, M. Assessing the Relationship Between Meteorological Parameters, Air Pollution and Cardiovascular Mortality of Mashhad City Based on Time Series Model. Iran. J. Health Saf. Environ. 2017, 5, 894–903. [Google Scholar]
  3. Afif, C.; Dutot, A.L.; Jambert, C.; Abboud, M.; Adjizian-Gérard, J.; Farah, W.; Perros, P.E.; Rizk, T. Statistical Approach for the Characterization of NO2 Concentrations in Beirut. Air Qual. Atmos. Health 2009, 2, 57–67. [Google Scholar] [CrossRef]
  4. Dmitrzak, M.; Jasinski, P.; Jasinski, G. Limited Selectivity of Amperometric Gas Sensors Operating in Multicomponent Gas Mixtures and Methods of Selectivity Improvement. Bull. Pol. Acad. Sci. Tech. Sci. 2020, 68, 1275–1282. [Google Scholar] [CrossRef]
  5. Awan, F.M.; Minerva, R.; Crespi, N. Improving Road Traffic Forecasting Using Air Pollution and Atmospheric Data: Experiments Based on LSTM Recurrent Neural Networks. Sensors 2020, 20, 3749. [Google Scholar] [CrossRef] [PubMed]
  6. Masey, N.; Gillespie, J.; Ezani, E.; Lin, C.; Wu, H.; Ferguson, N.S.; Hamilton, S.; Heal, M.R.; Beverland, I.J. Temporal Changes in Field Calibration Relationships for Aeroqual S500 O3 and NO2 Sensor-Based Monitors. Sens. Actuators B Chem. 2018, 273, 1800–1806. [Google Scholar] [CrossRef]
  7. Lai, W.-I.; Chen, Y.-Y.; Sun, J.-H. Ensemble Machine Learning Model for Accurate Air Pollution Detection Using Commercial Gas Sensors. Sensors 2022, 22, 4393. [Google Scholar] [CrossRef]
  8. Di Renzone, G.; Landi, E.; Mugnaini, M.; Parri, L.; Peruzzi, G.; Pozzebon, A. Assessment of LoRaWAN Transmission Systems Under Temperature and Humidity, Gas, and Vibration Aging Effects Within IIoT Contexts. IEEE Trans. Instrum. Meas. 2022, 71, 1–11. [Google Scholar] [CrossRef]
  9. Aroud, R.A.; Blasi, A.H.; Alsuwaiket, M. Intelligent Risk Alarm for Asthma Patients Using Artificial Neural Networks. Int. J. Adv. Comput. Sci. Appl. 2020, 11, 95–100. [Google Scholar] [CrossRef]
  10. Mawrence, R.; Munniks, S.; Valente, J. Calibration of Electrochemical Sensors for Nitrogen Dioxide Gas Detection Using Unmanned Aerial Vehicles. Sensors 2020, 20, 7332. [Google Scholar] [CrossRef]
  11. Zuidema, C.; Schumacher, C.S.; Austin, E.; Carvlin, G.; Larson, T.V.; Spalt, E.W.; Zusman, M.; Gassett, A.J.; Seto, E.; Kaufman, J.D.; et al. Deployment, Calibration, and Cross-Validation of Low-Cost Electrochemical Sensors for Carbon Monoxide, Nitrogen Oxides, and Ozone for an Epidemiological Study. Sensors 2021, 21, 4214. [Google Scholar] [CrossRef] [PubMed]
  12. Panzardi, E.; Lo Grasso, A.; Vignoli, V.; Mugnaini, M.; Lupetti, P.; Fort, A. NO2 Sensing with SWCNT Decorated by Nanoparticles in Temperature Pulsed Mode: Modeling and Characterization. Sensors 2020, 20, 4729. [Google Scholar] [CrossRef] [PubMed]
  13. Arroyo, P.; Gómez-Suárez, J.; Suárez, J.I.; Lozano, J. Low-Cost Air Quality Measurement System Based on Electrochemical and PM Sensors with Cloud Connection. Sensors 2021, 21, 6228. [Google Scholar] [CrossRef] [PubMed]
  14. Vajs, I.; Drajic, D.; Cica, Z. COVID-19 Lockdown in Belgrade: Impact on Air Pollution and Evaluation of a Neural Network Model for the Correction of Low-Cost Sensors’ Measurements. Appl. Sci. 2021, 11, 10563. [Google Scholar] [CrossRef]
  15. Mohd Nadzir, M.S.; Mohd Nor, M.Z.; Mohd Nor, M.F.F.; A Wahab, M.I.; Ali, S.H.M.; Otuyo, M.K.; Abu Bakar, M.A.; Saw, L.H.; Majumdar, S.; Ooi, M.C.G.; et al. Risk Assessment and Air Quality Study during Different Phases of COVID-19 Lockdown in an Urban Area of Klang Valley, Malaysia. Sustainability 2021, 13, 12217. [Google Scholar] [CrossRef]
  16. Han, P.; Mei, H.; Liu, D.; Zeng, N.; Tang, X.; Wang, Y.; Pan, Y. Calibrations of Low-Cost Air Pollution Monitoring Sensors for CO, NO2, O3, and SO2. Sensors 2021, 21, 256. [Google Scholar] [CrossRef]
  17. Pedowitz, M.D.; Kim, S.; Lewis, D.I.; Uppalapati, B.; Khan, D.; Bayram, F.; Koley, G.; Daniels, K.M. Fast Selective Sensing of Nitrogen-Based Gases Utilizing δ-MnO2-Epitaxial Graphene-Silicon Carbide Heterostructures for Room Temperature Gas Sensing. J. Microelectromechanical Syst. 2020, 29, 846–852. [Google Scholar] [CrossRef]
  18. Samad, A.; Kieser, J.; Chourdakis, I.; Vogt, U. Developing a Cloud-Based Air Quality Monitoring Platform Using Low-Cost Sensors. Sensors 2024, 24, 945. [Google Scholar] [CrossRef]
  19. Gómez-Suárez, J.; Arroyo, P.; Alfonso, R.; Suárez, J.I.; Pinilla-Gil, E.; Lozano, J. A Novel Bike-Mounted Sensing Device with Cloud Connectivity for Dynamic Air-Quality Monitoring by Urban Cyclists. Sensors 2022, 22, 1272. [Google Scholar] [CrossRef]
  20. Laref, R.; Losson, E.; Sava, A.; Siadat, M. Empiric Unsupervised Drifts Correction Method of Electrochemical Sensors for in Field Nitrogen Dioxide Monitoring. Sensors 2021, 21, 3581. [Google Scholar] [CrossRef]
  21. González, E.; Casanova-Chafer, J.; Romero, A.; Vilanova, X.; Mitrovics, J.; Llobet, E. LoRa Sensor Network Development for Air Quality Monitoring or Detecting Gas Leakage Events. Sensors 2020, 20, 6225. [Google Scholar] [CrossRef] [PubMed]
  22. Dautzenberg, E.; Claassen, F.W.; de Smet, L.C.P.M. Functionalized Modulators in Imine-Linked Covalent Organic Frameworks (COFs). Microporous Mesoporous Mater. 2023, 350, 112318. [Google Scholar] [CrossRef]
  23. Pfister, V.; Prato, M.; Penza, M. Field Performance Evaluation of Air Quality Low-Cost Sensors Deployed in a Near-City Space-Airport. Eng. Proc. 2023, 48, 27. [Google Scholar] [CrossRef]
  24. Mumtaz, R.; Zaidi, S.M.H.; Shakir, M.Z.; Shafi, U.; Malik, M.M.; Haque, A.; Mumtaz, S.; Zaidi, S.A.R. Internet of Things (IoT) Based Indoor Air Quality Sensing and Predictive Analytic—A COVID-19 Perspective. Electronics 2021, 10, 184. [Google Scholar] [CrossRef]
  25. Saravana Ram, R.; Venkatachalam, K.; Masud, M.; Abouhawwash, M. Air Pollution Prediction Using Dual Graph Convolution LSTM Technique. Intell. Autom. Soft Comput. 2022, 33, 1639–1652. [Google Scholar] [CrossRef]
  26. Alhasa, K.; Mohd Nadzir, M.; Olalekan, P.; Latif, M.; Yusup, Y.; Iqbal Faruque, M.; Ahamad, F.; Abd. Hamid, H.; Aiyub, K.; Md Ali, S.; et al. Calibration Model of a Low-Cost Air Quality Sensor Using an Adaptive Neuro-Fuzzy Inference System. Sensors 2018, 18, 4380. [Google Scholar] [CrossRef]
  27. Loganathan, V.; Ravikumar, D.; Devaraj, V.; Kannan, U.M.; Kesavan, R. Development of a Compact IoT-Enabled Device to Monitor Air Pollution for Environmental Sustainability. Eng. Proc. 2023, 58, 18. [Google Scholar] [CrossRef]
  28. Manikandan, S.; Arun Francis, G.; Mithya, V.; Kamal, C.; Dhilip Kumar, S.; Harriprasath, R.; Sankar, P. A Smart Helmet for Air Quality and Hazardous Event Detection for the Mining Industry. Int. J. Innov. Technol. Explor. Eng. 2019, 8, 1447–1449. [Google Scholar] [CrossRef]
  29. Suriano, D.; Cassano, G.; Penza, M. Design and Development of a Flexible, Plug-and-Play, Cost-Effective Tool for on-Field Evaluation of Gas Sensors. J. Sens. 2020, 2020, 8812025. [Google Scholar] [CrossRef]
  30. Si Tayeb, M.; Anis Benallal, M.; Salim Benabadji, M.; Houari, A. IoT Monitoring System for Air Quality Assessment and Collecting Data. Indones. J. Electr. Eng. Comput. Sci. 2022, 28, 1592. [Google Scholar] [CrossRef]
  31. Duangsuwan, S.; Prapruetdee, P.; Subongkod, M.; Klubsuwan, K. 3D AQI Mapping Data Assessment of Low-Altitude Drone Real-Time Air Pollution Monitoring. Drones 2022, 6, 191. [Google Scholar] [CrossRef]
  32. Bizak, Z.; Faleiros, M.C.; Vijjapu, M.T.; Yaqoob, U.; Salama, K.N. Highly Sensitive Wireless NO2 Gas Sensing System. IEEE Sens. J. 2023, 23, 15667–15674. [Google Scholar] [CrossRef]
  33. Kałużyński, P.; Mucha, W.; Capizzi, G.; Lo Sciuto, G. Chemiresistor Gas Sensors Based on Conductive Copolymer and ZnO Blend—Prototype Fabrication, Experimental Testing, and Response Prediction by Artificial Neural Networks. J. Mater. Sci. Mater. Electron. 2022, 33, 26368–26382. [Google Scholar] [CrossRef]
  34. Jin, H.; Yu, J.; Cui, D.; Gao, S.; Yang, H.; Zhang, X.; Hua, C.; Cui, S.; Xue, C.; Zhang, Y.; et al. Remote Tracking Gas Molecular via the Standalone-Like Nanosensor-Based Tele-Monitoring System. Nano-Micro Lett. 2021, 13, 1–14. [Google Scholar] [CrossRef]
  35. Fort, A.; Panzardi, E.; Al-Hamry, A.; Vignoli, V.; Mugnaini, M.; Addabbo, T.; Kanoun, O. Highly Sensitive Detection of NO2 by Au and TiO2 Nanoparticles Decorated SWCNTs Sensors. Sensors 2019, 20, 12. [Google Scholar] [CrossRef]
  36. Drozdowska, K.; Rehman, A.; Krajewska, A.; Lioubtchenko, D.V.; Pavłov, K.; Rumyantsev, S.; Smulko, J.; Cywiński, G. Effects of UV Light Irradiation on Fluctuation Enhanced Gas Sensing by Carbon Nanotube Networks. Sens. Actuators B Chem. 2022, 352, 131069. [Google Scholar] [CrossRef]
  37. Tancev, G.; Toro, F.G. Stochastic Online Calibration of Low-Cost Gas Sensor Networks with Mobile References. IEEE Access 2022, 10, 13901–13910. [Google Scholar] [CrossRef]
  38. Kim, Y.; Bak, S.-Y.; Lee, J.; Lee, S.-H.; Woo, K.; Lee, S.; Yi, M. Highly Sensitive and Selective NO2 Gas Sensor at Low Temperature Based on SnO2 Nanowire Network. J. Sens. Sci. Technol. 2021, 30, 175–180. [Google Scholar] [CrossRef]
  39. Chen, X.; Wang, T.; Shi, J.; Lv, W.; Han, Y.; Zeng, M.; Yang, J.; Hu, N.; Su, Y.; Wei, H.; et al. A Novel Artificial Neuron-Like Gas Sensor Constructed from CuS Quantum Dots/Bi2S3 Nanosheets. Nano-Micro Lett. 2022, 14, 8. [Google Scholar] [CrossRef]
  40. Thornes, J.E.; Hickman, A.; Baker, C.; Cai, X.; Delgado-Saborit, J.M.; Quaiyoom, A. Proposed Interventions to Reduce Noxious Air Pollution at Birmingham New Street Station. Proc. Inst. Civ. Eng.—Transp. 2022, 175, 387–392. [Google Scholar] [CrossRef]
  41. Ly, H.-B.; Le, L.M.; Phi, L.V.; Phan, V.-H.; Tran, V.Q.; Pham, B.T.; Le, T.-T.; Derrible, S. Development of an AI Model to Measure Traffic Air Pollution from Multisensor and Weather Data. Sensors 2019, 19, 4941. [Google Scholar] [CrossRef] [PubMed]
  42. Shen, Y.; Jiang, F.; Feng, S.; Zheng, Y.; Cai, Z.; Lyu, X. Impact of weather and emission changes on NO2 concentrations in China during 2014–2019. Environ. Pollut. 2021, 269, 116163. [Google Scholar] [CrossRef]
  43. Gheibi, M.; Taghavian, H.; Moezzi, R.; Waclawek, S.; Cyrus, J.; Dawiec-Lisniewska, A.; Koci, J.; Khaleghiabbasabadi, M. Design of a Decision Support System to Operate a NO2 Gas Sensor Using Machine Learning, Sensitive Analysis and Conceptual Control Process Modelling. Chemosensors 2023, 11, 126. [Google Scholar] [CrossRef]
  44. Nemati, F.; Mahvi, A.; Mohseni, S.M. Health Impacts of NO2 in Mashhad, Iran. J. Air Pollut. Health 2016, 1, 15–20. [Google Scholar]
  45. Park, J.; Kim, Y.; Park, S.Y.; Sung, S.J.; Jang, H.W.; Park, C.R. Band Gap Engineering of Graphene Oxide for Ultrasensitive NO2 Gas Sensing. Carbon 2020, 159, 175–184. [Google Scholar] [CrossRef]
  46. Mashhad Air Quality Index (AQI) and Iran Air Pollution IQAir. 2024. Available online: https://www.iqair.com/iran/razavi-khorasan/mashhad (accessed on 1 June 2024).
  47. Huang, D.; Li, Q.; Li, G.; Wang, X.; Sun, L. Tougher targets for China’s clean air cities? Implications from air quality assessment in Shenzhen. Preprints 2018, 2018100101. [Google Scholar] [CrossRef]
  48. Hesterberg, T.W.; Bunn, W.B.; McClellan, R.O.; Hamade, A.K.; Long, C.M.; Valberg, P.A. Critical review of the human data on short-term nitrogen dioxide (NO2) exposures: Evidence for NO2 no-effect levels. Crit. Rev. Toxicol. 2009, 39, 743–781. [Google Scholar] [CrossRef]
  49. Stieb, D.M.; Judek, S.; Burnett, R.T. Meta-analysis of time-series studies of air pollution and mortality: Effects of gases and particles and the influence of cause of death, age, and season. J. Air Waste Manag. Assoc. 2002, 52, 470–484. [Google Scholar] [CrossRef]
  50. Copernicus Sentinel-5P Mapping Portal. Available online: https://maps.s5p-pal.com/no2-tropospheric/ (accessed on 8 August 2024).
  51. India: NO₂ Concentration by City. Statista. Available online: https://www.statista.com/statistics/1284361/india-concentration-of-nitrogen-dioxide-by-city/ (accessed on 1 June 2024).
  52. Live Animated Air Quality Map (AQI, PM 2.5...). IQAir. Available online: https://www.iqair.com/air-quality-map (accessed on 10 August 2024).
  53. Tudoroiu, E.-R.; Neacsu, G.; Astilean, A.; Zoltan, M.; Letia, T.; Tudoroiu, N. Fuzzy UML and Petri nets modeling investigations on the pollution impact on the air quality in the vicinity of the Black Sea Constanta Romanian resort. In Proceedings of the 2011 Federated Conference on Computer Science and Information Systems (FedCSIS), Szczecin, Poland, 18–21 September 2011; 2011; pp. 763–766. [Google Scholar]
  54. Gharibvand, L.K.; Jamali, A.A.; Amiri, F. Changes in NO2 and O3 levels due to the pandemic lockdown in the industrial cities of Tehran and Arak, Iran using Sentinel 5P images, Google Earth Engine (GEE) and statistical analysis. Stoch. Environ. Res. Risk Assess. 2023, 37, 2023–2034. [Google Scholar] [CrossRef]
  55. Ghozikali, M.G.; Mosaferi, M.; Safari, G.H.; Jaafari, J. Effect of exposure to O3, NO2, and SO2 on chronic obstructive pulmonary disease hospitalizations in Tabriz, Iran. Environ. Sci. Pollut. Res. 2015, 22, 2817–2823. [Google Scholar] [CrossRef]
  56. Azimi, F.; Hafezi, F.; Ghaderpoori, M.; Kamarehie, B.; Karami, M.A.; Sorooshian, A.; Baghani, A.N. Temporal characteristics and health effects related to NO2, O3, and SO2 in an urban area of Iran. Environ. Pollut. 2024, 349, 123975. [Google Scholar] [CrossRef] [PubMed]
  57. Karimi, A.; Shirmardi, M.; Hadei, M.; Birgani, Y.T.; Neisi, A.; Takdastan, A.; Goudarzi, G. Concentrations and health effects of short-and long-term exposure to PM 2.5, NO2, and O3 in ambient air of Ahvaz city, Iran (2014–2017). Ecotoxicol. Environ. Saf. 2019, 180, 542–548. [Google Scholar] [CrossRef] [PubMed]
  58. Alnaim, A.; Sun, Z.; Tong, D. Evaluating machine learning and remote sensing in monitoring NO2 emission of power plants. Remote Sens. 2022, 14, 729. [Google Scholar] [CrossRef]
  59. Bhraguram, T.M.; Rajesh, R.K.; Mohanan, S.; Tabassum, M. A novel approach to indoor air quality monitoring by Cisco IoT-based toxic measurement system. In Next Generation Communication Networks for Industrial Internet of Things Systems; Perumal, S., Tabassum, M., Sharma, M., Mohanan, S., Eds.; CRC Press: Boca Raton, FL, USA, 2023. [Google Scholar]
  60. Lewis, A.; Peltier, W.R.; von Schneidemesser, E. Low-Cost Sensors for the Measurement of Atmospheric Composition: Overview of Topic and Future Applications; World Meteorological Organization (WMO): Geneva, Switzerland, 2018. [Google Scholar]
  61. World Meteorological Organization (WMO). An Update on Low-Cost Sensors for the Measurement of Atmospheric Composition. Available online: https://library.wmo.int/records/item/37465-an-update-on-low-cost-sensors-for-the-measurement-of-atmospheric-composition. (accessed on 8 August 2024).
  62. Sofia, D.; Giuliano, A.; Gioiella, F.; Barletta, D.; Poletto, M. Modeling of an Air Quality Monitoring Network with High Space-Time Resolution. In Computer Aided Chemical Engineering; Friedl, A., Klemeš, J.J., Radl, S., Varbanov, P.S., Wallek, T., Eds.; Elsevier: Amsterdam, The Netherlands, 2018; Volume 43, pp. 193–198. ISBN 9780444642356. [Google Scholar]
  63. Borrego, C.; Ginja, J.; Coutinho, M.; Ribeiro, C.; Karatzas, K.; Sioumis, T.; Katsifarakis, N.; Konstantinidis, K.; De Vito, S.; Esposito, E.; et al. Assessment of Air Quality Microsensors versus Reference Methods: The EuNetAir Joint Exercise—Part II. Atmos. Environ. 2018, 193, 127–142. [Google Scholar] [CrossRef]
  64. Williams, R.; Duvall, R.; Kilaru, V.; Hagler, G.; Hassinger, L.; Benedict, K.; Rice, J.; Kaufman, A.; Judge, R.; Pierce, G.; et al. Deliberating Performance Targets Workshop: Potential Paths for Emerging PM 2.5 and O3 Air Sensor Progress. Atmos. Environ. X 2019, 2, 100031. [Google Scholar] [CrossRef]
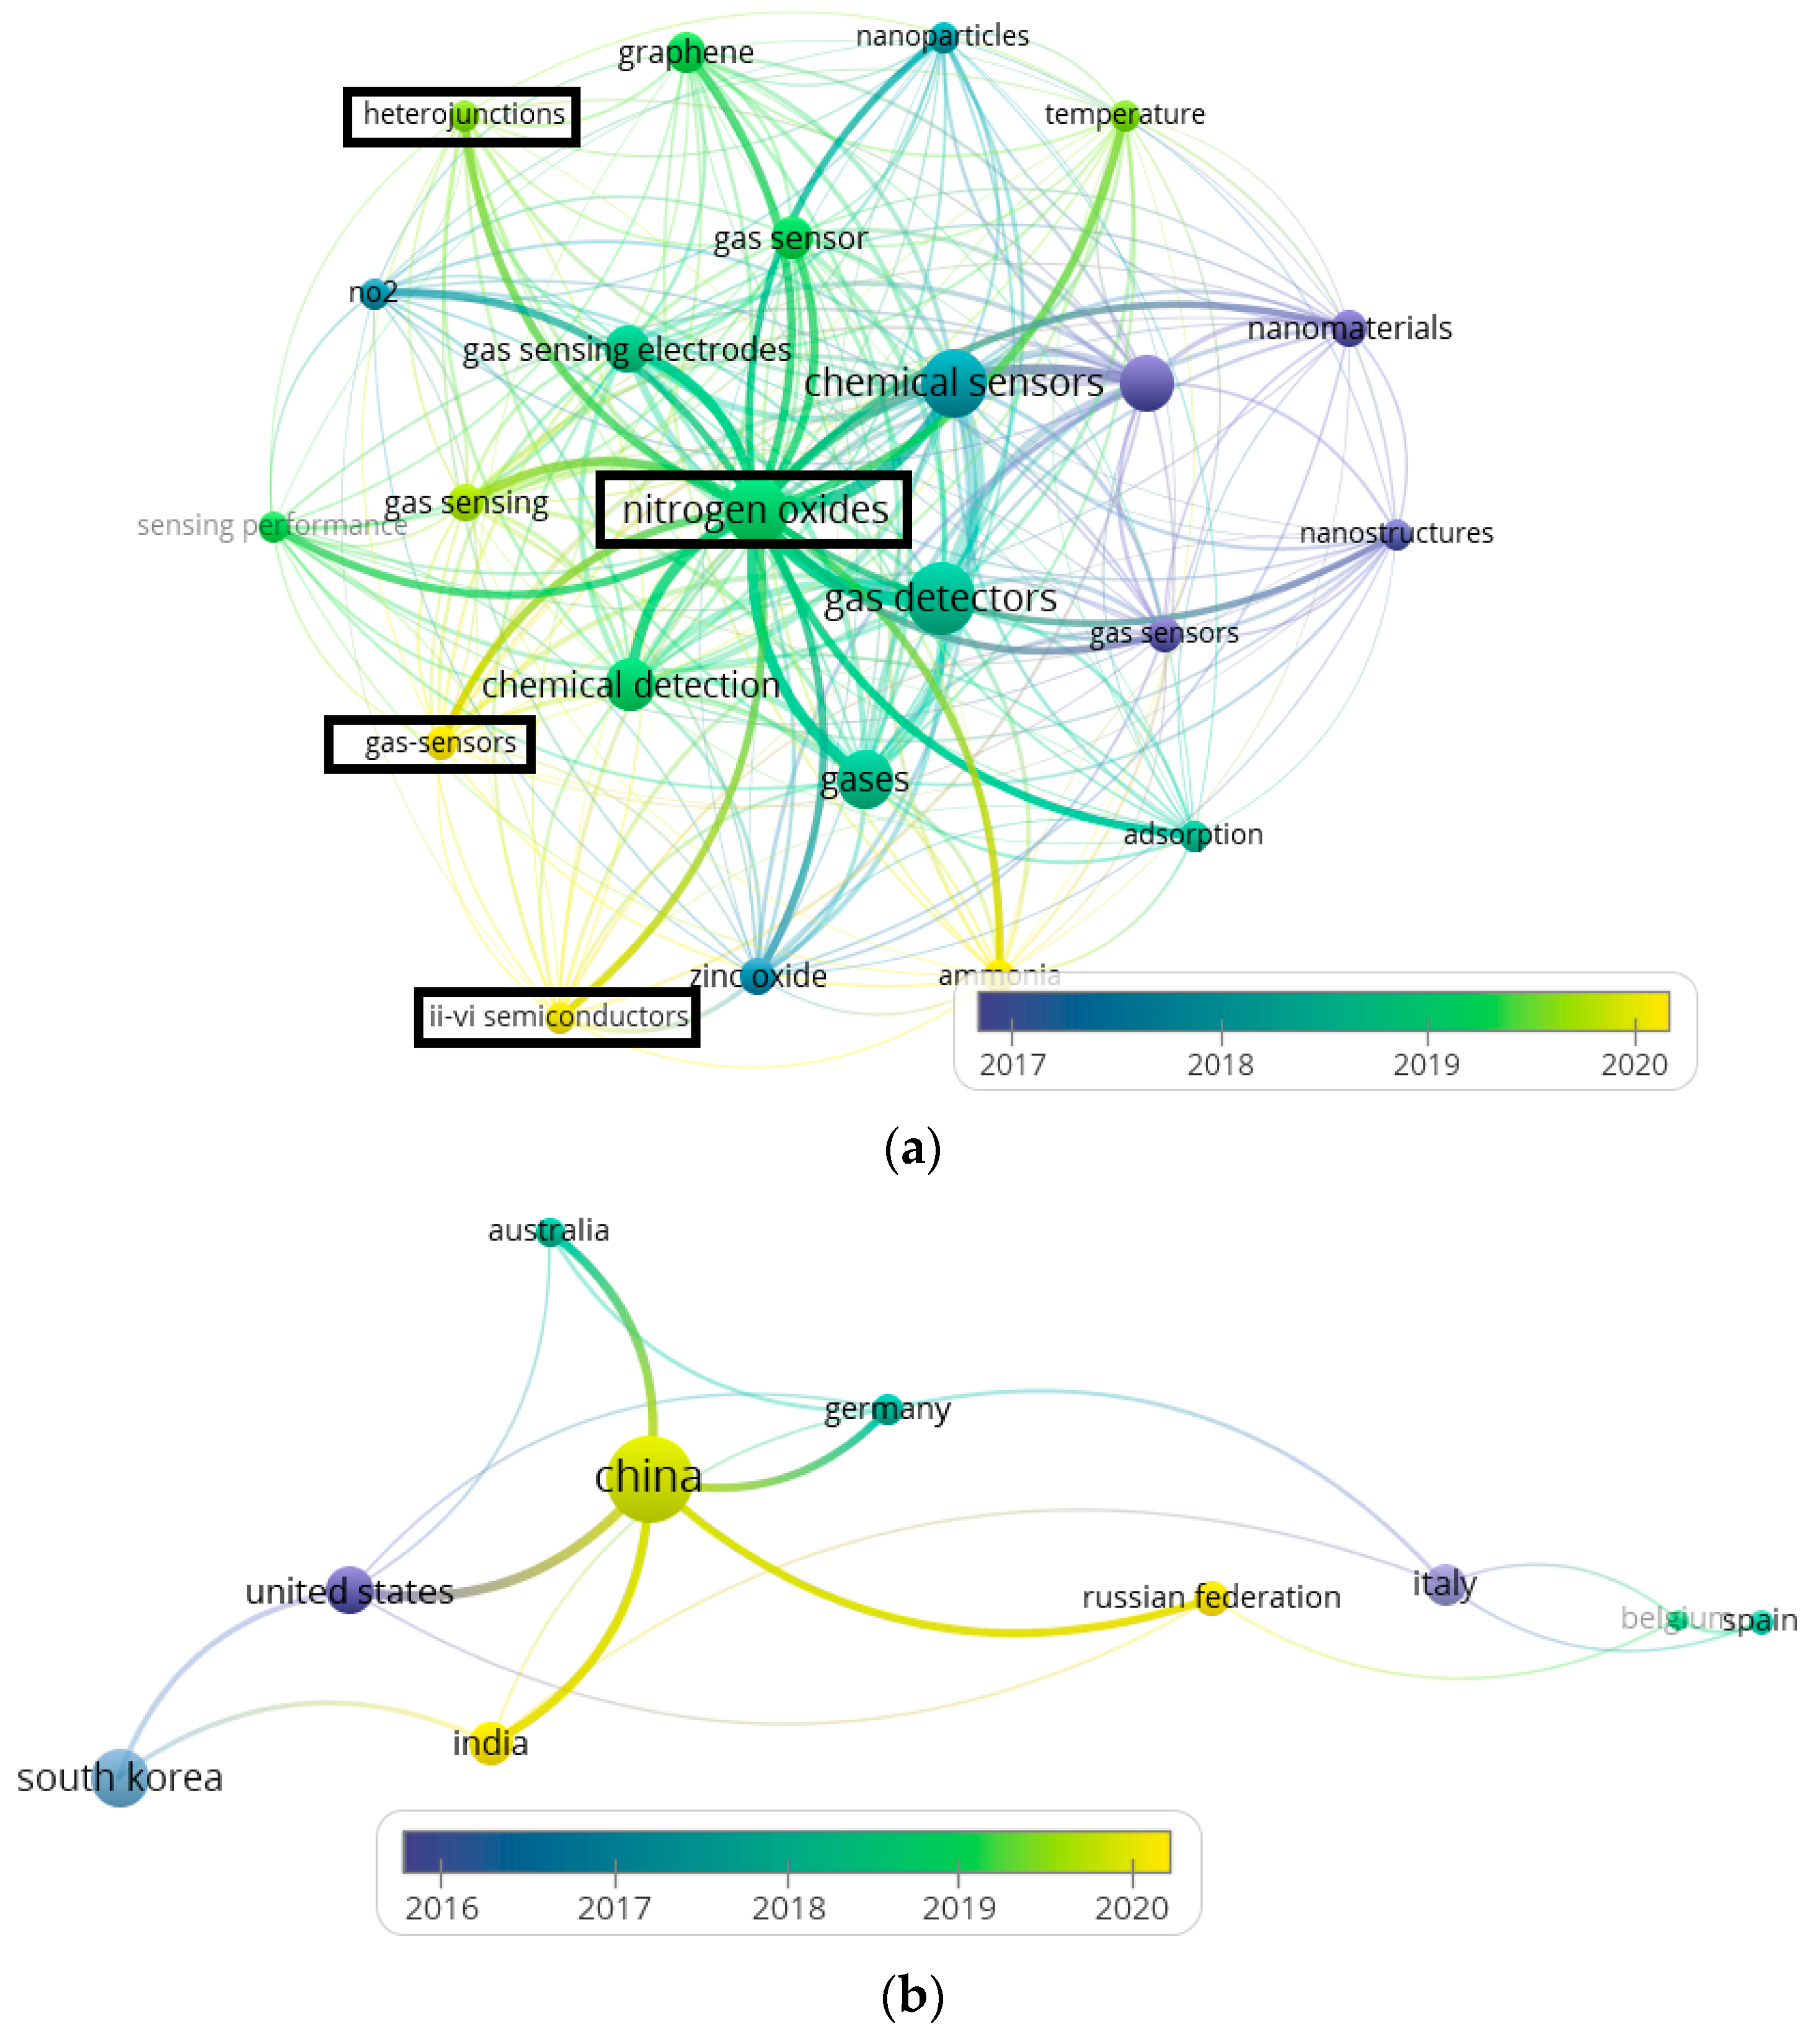
Figure 1. The Scientometry of nanomaterial applications for NO2 sensor design based on (a) keyword occurrence, (b) country contributions, and (c) author contributions.
Gases 04 00016 g001aGases 04 00016 g001b
Figure 2. The location of different air pollution stations in twelve regions of Mashhad City.
Gases 04 00016 g002
Figure 3. Climate data of Mashhad City on 11 August 2024 shown by (a) heat map, (b) AQI calendar, (c) weather and pollution distribution, and (d) NO2 level.
Gases 04 00016 g003
Figure 4. The schematic plan of the NO2 sensor based on the adsorption process in the present study.
Gases 04 00016 g004
Figure 5. The NO2 air pollution concentration (ppm) in different stations of Mashhad City, 2017 [46].
Gases 04 00016 g005
Figure 6. The histogram distribution of all NO2 pollution emissions between all stations of the case study.
Gases 04 00016 g006
Figure 7. The logic of the created sensor in the present study.
Gases 04 00016 g007
Figure 8. (a) The geographical location and distribution of (b) NO2, (c) CO, and (d) CH4 on the map of Mashhad City, Iran, based on Sentinel-5P L2 data.
Gases 04 00016 g008
Figure 9. The average NO2 concentration in different cities of India [51]. * Delhi has an uninterrupted ambient air quality monitoring data from 2018 onwards.
Gases 04 00016 g009
Figure 10. (a) AQI of Iran, (b) AQI of India, (c) Tehran’s AQI details, and (d) Delhi’s AQI details.
Gases 04 00016 g010
Figure 11. The structure of Petri Net modeling as a controlling framework of the created sensor in the present study.
Gases 04 00016 g011
Figure 12. The managerial insight into air pollution management for case studies of Iran based on (a) Gharibvand et al. (2023) [54], (b) Ghozikali et al. (2014) [55], (c) Azimi et al. (2024) [56], and (d) Karimi et al. (2019) [57].
Gases 04 00016 g012aGases 04 00016 g012b
Table 1. Summary of recent studies on air quality monitoring and NO2 emission detection.
NrMethodologyApplicationResultsReference
1LoRa-based sensor network, commercial gas sensor, graphene chemoresistive sensorsAir quality monitoring and gas leakage detectionLow-cost, low-power, real-time monitoring; suitable for wireless air quality monitoring[21]
2Covalent Organic Frameworks (COFs), para-functionalized amine modulatorsGas separation and sensingEnhanced gas selectivity for CO2/N2 separation under flue gas conditions[22]
3Sensor system, low-cost air quality gas sensors, particulate matter sensorsUrban air quality monitoringHigh correlation with reference instrumentation; potential for high spatial–temporal resolution[23]
4IoT sensors, machine learning techniques, neural network (NN), long short-term memory (LSTM) modelsIndoor air quality monitoring and predictionHigh accuracy in classification and prediction of 8 pollutants[24]
5Wireless sensor networks (WSNs), deep learning-based approachAir quality index (AQI) predictionsAchieved maximum accuracy of 95%[25]
6Custom-made low-cost air quality sensor (LAQS), adaptive neuro-fuzzy inference system (ANFIS)Air quality sensor calibration and performance evaluationPromising sensor accuracy improvement through ANFIS model[26]
7IoT-based air pollution surveillance system (APSS), regression and classification algorithmsUrban and industrial air quality monitoringReal-time monitoring and alerts, effective forecasting and categorization of air quality[27]
8Smart helmet, sensors for hazardous gases and temperature, IR sensor for helmet removalMining industry safetyEnhanced safety measures through hazardous event detection[28]
9SentinAir system, CO2, NO2, and O3 sensorsPersonal exposure monitoring to pollutant gasesPromising results for real-world scenarios[29]
10Hardware and software solution, low-cost deployable air quality monitoring deviceReal-time environmental data acquisitionEffective in obtaining real-time data, potential for environmental mapping[30]
11Dr-TAPM, drone-based air pollution monitoring, hybrid model for data assessmentReal-time air pollution monitoringHigh accuracy in predicting air quality index (AQI) data[31]
12Indium gallium zinc oxide (IGZO) thin-film transistor-based NO2 sensing systemWireless NO2 detectionExcellent sensitivity and low detection limit for NO2[32]
13Chemiresistor NOx gas sensors, conductive copolymer and zinc oxide blendNOx gas sensingProposed a neural network for classifying sensor responses to gas concentration variations[33]
14Standalone smart device, hollow polyhedral ZnO, photoluminescence-enhanced Li-FiRemote air pollutant trackingEnhanced sensor selectivity and sensitivity to NO2, novel telecommunication technique[34]
15SWCNT-based conductive sensors, gold and TiO2 nanoparticlesRoom-temperature NO2 sensingEnhanced sensitivity and reduced response time to NO2[35]
16Carbon nanotube network, UV irradiationNO2 gas sensingEnhanced sensitivity to lower concentrations of NO2, reduced DC resistance drift[36]
17Wireless sensor network, mobile references, stochastic gradientsUrban air quality monitoringAchieved long-term reliable measurements with low absolute errors for CO, NO2, and O3[37]
18SnO2 nanowire network, vapor phase growth method, fluorine-doped tin oxide (FTO) electrodeNO2 gas sensingImproved sensitivity at low temperatures and concentrations, characterized via SEM and XRD analysis[38]
19CuS quantum dots/Bi2S3 nanosheets, artificial neuron networksReal-time rapid detection of toxic gasesHigh-sensitivity NO2 sensing, excellent responsiveness and recovery rate, low detection limit[39]
20Ventilation system, nitrogen monoxide/dioxide sensors, electric/hybrid trainsAir pollution control at Birmingham New Street railway stationProposed interventions to address air pollution problem[40]
21Fuzzy logic, simulated annealing (SA), particle swarm optimization (PSO)Air quality index predictions, multisensor devicesPSO performed best; identified sensitive inputs for predicting NO2 and CO concentrations[41]
Disclaimer/Publisher’s Note: The statements, opinions and data contained in all publications are solely those of the individual author(s) and contributor(s) and not of MDPI and/or the editor(s). MDPI and/or the editor(s) disclaim responsibility for any injury to people or property resulting from any ideas, methods, instructions or products referred to in the content.