Article

Using Carbon Dioxide for Subsea Long-Duration Energy Storage

Department of Mechanical Engineering, University of Malta, 2080 Msida, Malta
*
Author to whom correspondence should be addressed.
Gases 2024, 4(3), 295-309; https://doi.org/10.3390/gases4030017
Submission received: 9 August 2024 / Revised: 8 September 2024 / Accepted: 16 September 2024 / Published: 18 September 2024

Abstract

:
This paper investigates the operating benefits and limitations of utilizing carbon dioxide in hydro-pneumatic energy storage systems, a form of compressed gas energy storage technology, when the systems are deployed offshore. Allowing the carbon dioxide to transition into a two-phase fluid will improve the storage density for long-duration energy storage. A preliminary comparative study between an air-based and a carbon dioxide-based subsea hydro-pneumatic energy storage system is first presented. The analysis is based on thermodynamic calculations assuming ideal isothermal conditions to quantify the potential augmentation in energy storage capacity for a given volume of pressure containment when operating with carbon dioxide in lieu of air. This is followed by a transient thermal analysis of the carbon dioxide-based hydro-pneumatic energy storage system, taking into account the real scenario of a finite thermal resistance for heat exchange between the gas and the surrounding seawater. Results from numerical modelling revealed that the energy storage capacity of a carbon dioxide-based subsea hydro-pneumatic energy storage system operating under ideal isothermal conditions can be theoretically increased by a factor of 2.17 compared to an identical air-based solution. The numerical modelling revealed that, under real conditions under which transient effects resulting from a finite thermal resistance are accounted for, the achievable factor is lower, depending on the charging and discharging time, the initial temperature, and whether a polyethene liner for corrosion prevention is considered or not.

1. Introduction

Long-duration energy storage (LDES) systems are becoming a critical means for safeguarding the reliability and flexibility of power systems, for a high penetration of intermittent renewables, such as wind and solar power, into the grid. Compressed air energy storage (CAES) systems [1], in particular hydro-pneumatic energy storage (HPES) solutions [2,3], have been favoured due to their high thermal efficiencies and ability to deploy at sea for co-location with offshore renewable energy parks.
Despite the simplicity of operation, the large volume requirements of HPES systems have been identified as a major technical and financial barrier to achieving the required storage capacities. Recently, the idea of utilizing carbon dioxide (CO2) in lieu of air has been regarded as an attractive opportunity to increase the energy storage densities (ESDs) of HPES systems.
Liquid CO2 energy storage (LCES) has been gaining interest due to the favourable thermo-physical properties of CO2 that allow the gas to be liquefied and stored at relatively low pressures (i.e., <73.8 bar) and ambient temperatures (i.e., <304.25 K) [4], thus driving significant cost reductions associated with the pressure containment of the storage system. Moreover, liquefying CO2 rather than liquefying air itself prevents the necessity of dealing with the cryogenic temperatures (i.e., <83.15 K) linked to liquid air energy storage (LAES) [5]. In addition, the limited ESDs of HPES systems can be effectively increased upon condensation of the CO2 gas. A gas like air, which does not condensate during operation, limits the liquid-piston travel, and thus the amount of energy stored. Conversely, with the gas undergoing phase change and partially liquefying, the accumulator volume that can be exploited for energy storage is maximized.
Counter-arguments about using CO2 in HPES systems have been linked to the costly corrosion mitigation measures required, especially when considering offshore energy storage. The condensation of CO2 on low-carbon steels typically used for offshore accumulators is highly corrosive in the presence of seawater. The reaction involves the formation of carbonic acid (H2CO3) which results in a pitting attack on the steel. Consequently, reliable corrosion preventive measures like anti-corrosion paint and/or linings would be necessary. For example, high-density polyethylene (HDPE) liners are widely used in oil and gas pipelines due to the enhanced corrosion resistivity offered at competitive prices. Yet, when tested for offshore HPES applications [6], HDPE liners were reported to significantly lower the thermal efficiency of operation due to low thermal conductivity [6]. A further difficulty is the high solubility of CO2 in water, whereby the liquid-piston mechanism of a CO2-based HPES system will fail unless a diaphragm which separates the two fluids, seawater and CO2, is present. A separator, similar to a pipeline inspection gauge (PIG), which is already widely used in the pipeline industry, would be an effective way to create a partition between the distinct fluid bodies [6].
Several analyses [7,8,9] have been conducted to quantify the augmented storage capacities when shifting from conventional CAES systems to LCES, and values up to 2.8 times were reported in the literature [9]. The quoted value is however dependent on the systems being considered. In [7,8,9], the investigations were limited to onshore-based systems or storage of air/liquid CO2 in aquifers [7,8], both of which demand complex thermal energy storage techniques that inflate the size and cost of the system. Commercially, CO2 is already being exploited for energy storage by what is known as the CO2 Battery, currently under development by Energy Dome [10]. The operation of the onshore LDES plant is able to sustain the provision of electricity for up to 10 h with round-trip efficiencies being claimed to be above 75% [10].
More pertinent to the scope of the present research is, however, the utilization of CO2 undergoing phase change in HPES systems operating in a closed-cycle configuration. Yet, research in this specific field is somewhat limited. Abu-Heiba et al. [11] investigated the potential increase in the storage capacity of what is known as the GLIDES solution by almost fully replacing air in the system with CO2. The ESD of the GLIDES system was reported to be augmented by 56.8% (or an augmentation factor of 1.568) from 4.67 MJ/m3 (i.e., 1.30 kWh/m3) when using pure nitrogen (N2) representing air to 7.33 MJ/m3 (i.e., 2.04 kWh/m3) when using a mixture of 88% CO2 and 12% N2.
In a previous work, Cutajar et al. [12] investigated the potential increase in the ESD of subsea HPES systems when operating with CO2 in place of air. The analyses were limited to isothermal considerations only, with the transient effects resulting from a finite thermal resistance to heat transfer between the compressible fluid storing the energy and the surrounding seawater being ignored. The study [12] revealed that CO2 can theoretically provide up to three times the ESD of an equivalent air-based HPES system. The augmentation factor was, however, observed to vary with several parameters including the operating pressure ratio, sea depth, initial fluid temperature, and extent of CO2 liquefaction (i.e., the dryness fraction).
Briffa et al. [6] investigated subsea CO2-based HPES systems in more detail by modelling the transient effects resulting from thermal resistances. It was estimated that the use of CO2 in lieu of air boosted the energy storage capacity (ESC) by up to 55.2%. However, the investigations also revealed that the air-based system was much more efficient, reaching round-trip thermal efficiencies beyond 90%. Contrastingly, the CO2-based alternative attained thermal efficiencies between 78 and 87% [6].
This paper extends the work of Cutajar et al. [12] and Briffa et al. [6] by investigating different operating conditions of an offshore HPES system. Situating the system subsea addresses the challenge of land constraints whilst enhancing the thermal efficiency during operation due to the surrounding seawater environment which acts as an excellent heat sink during charging (compression) and as a heat source during discharging (expansion). The study employs (i) the ideal isothermal thermodynamic and (ii) transient thermal models from [12] and [6], respectively, to investigate further potential benefits and limitations of utilizing CO2 for subsea HPES systems which have not yet been explored in [6,12]. This study aims to narrow the knowledge gap in terms of subsea HPES systems operating on CO2 as the energy storage medium. The investigations conducted thus far [6,7,8,9,11,12] fall short of indicating the main factors that contribute to the liquefaction of CO2, which is essential to achieve higher ESCs. By analyzing the thermal performance of the CO2-based unit, the parameters governing the efficiency and the ESC of the system are identified. Therefore, a better comparison can be made to the air-based unit, highlighting the prominent differences introduced by a change in the compressible fluid.
The mathematical groundwork for the two distinct numerical models is reviewed in Section 2, followed by the description of the research approach adopted in Section 3. The results obtained from the two models and interpretation of plots thereof are presented in Section 4. Finally, the key and novel findings are highlighted in Section 5 together with suggestions for future work.

2. Mathematical Models

Figure 1 and Figure 2 illustrate the two HPES systems being investigated in the present study. Both systems are considered to be geometrically identical pipelines exposed to the same subsea conditions. The only difference is that HPES-1 operates with air as the energy storage medium, whereas HPES-2 utilizes CO2 for storing energy. Note that, for the present study, the sea depth Zsw was maintained constant at 10.5 m while including the effect of hydrostatic pressure in the analysis.
A PIG is included in both HPES systems to act as a diaphragm. For HPES-1, the PIG is important to prevent the dilution of the compressed air into the seawater. For HPES-2, the PIG is compulsory for the purpose explained in Section 1. Furthermore, the thermodynamic and transient thermal models put forward in Section 2.1 and Section 2.2, respectively, both assume a horizontal liquid-piston travel. Thus, the seawater–PIG–compressible fluid interface is considered to be vertical, as depicted in Figure 1 and Figure 2.
The systems operate on the fundamental concept of closed-gas HPES solutions. A pump is driven by excess renewable energy to pump seawater inside the subsea accumulator which is pre-charged with air or CO2. The injection of seawater inside the pressure containment system causes the other fluid to compress (and condense in the case of CO2). Thus, the HPES system is said to be charging and energy storage takes place. Recovering the stored energy requires discharging the system by expelling the seawater out through a hydraulic turbine and allowing the compressed fluid to expand back (and evaporate in the case of CO2). The turbine would then drive a generator, supplying electricity to the grid. It is worth emphasizing that neither the air nor the CO2 flow through the hydraulic circuit, but are simply enclosed within the accumulator.

2.1. Thermodynamic Model for Ideal Isothermal Conditions (CO2HPES Model)

The thermodynamic model CO2HPES [12] aims to quantify the difference in the ideal energy storage capacity ESCi between the two subsea HPES systems: HPES-1 operating with air and HPES-2 utilizing CO2. The model is based on the assumption that the compression and expansion processes occur in an ideal isothermal manner and the thermal resistance to heat transfer between the compressible fluid and the surrounding seawater is neglected. Furthermore, air in HPES-1 is treated as a dry, ideal gas, whereas the CO2 in HPES-2 is considered to always exist at superheated or dry conditions at the initial working state, yet changes phase during the compression/expansion process.
The ESCi of an HPES system in kilowatt hours (kWh) is derived from the work done ΔWi in Joules (J) during isothermal compression/expansion via Equation (1):
ESCi = ΔWi/(3.6 × 106)
In turn, the thermodynamic work ΔWi can be evaluated by applying the energy conservation principle:
ΔWi = ΔQ − ΔU
where ΔQ is the heat exchange and ΔU is the change in internal energy of the system, both in J. For air as an ideal, single-phase gas, Equation (2) transforms into
ESCi (air) = ΔWi (air)/(3.6 × 106) = [{pf vf mair ln(rp)} − {phyd vf mair(rp − 1)}][1/(3.6 × 106)]
In Equation (3), pf and vf are the final air pressure in Pascals (Pa) and specific volume in cubic metres per unit mass (m3/kg), respectively. Moreover, mair is the mass of air in HPES-1 in kilograms (kg) and rp is the operating pressure ratio. Also, phyd is the hydrostatic pressure. Indeed, the second term in curly {} brackets on the right-hand side of Equation (3) represents the work done against hydrostatic pressure, which has to be accounted for in a subsea energy storage system.
Conversely, for CO2 undergoing a phase change, ΔQ is represented by a change in the specific entropy s (in J/kg K) of the fluid:
ΔQ = mCO2TΔs = mCO2T(sf − s0)
and ΔU is expressed as the change in the specific enthalpy h (in J/kg) of the fluid:
ΔU = mCO2 [(hf − h0) − (pf vf − p0 v0)]
Therefore, for CO2, Equation (2) transposes into
ESCi (CO2) = ΔWi (CO2)/(3.6 × 106) = [mCO2/3.6 × 106] [{T(sf − s0)} − {(hf − h0) − (pf vf − p0 v0)}]
For a complete derivation, reference can be made to the previous work by the authors in [12]. In Equations (4)–(6), mCO2 is the mass of CO2 in HPES-2, which, despite a phase change, remains constant by the conservation of mass principle. Moreover, T is the operating temperature in Kelvin (K), which is maintained unchanged under the assumed isothermal conditions. The subscripts 0 and f indicate the initial and final stages of compression, respectively, where the CO2 changes from a dryness fraction of x = 1 to being completely liquefied at x = 0.
The extent of increase in ESCi when compressing CO2 instead of air could thus be determined from the augmentation factor α:
α = ESCi (CO2)/ESCi (air)

2.2. Transient Thermal Model (C2O2 Model)

The transient thermal model C2O2 [6] is also based on the energy conservation law defined in Equation (2). However, the model incorporates the thermal resistance to heat transfer between the compressible fluid and the surrounding seawater, thus accounting for transient effects. The model is thus able to capture the conditions when the HPES compression and expansion processes deviate from the ideal (i.e., isothermal) behaviour. Therefore, to cater to temperature changes, instead of Equation (6), which assumed isothermal conditions, Equation (2) is modified into
ΔWr (CO2)/(3.6 × 106) = [{ΔQ − (mCO2CvΔT)} − Wf ][1/(3.6 × 106)]
In Equation (8), ΔWr is the real work done under non-isothermal conditions. Moreover, Cv is the specific heat capacity at constant volume in J/kg K and ΔT is the change in fluid temperature during operation. The term Wf accounts for the work lost against the frictional forces in moving the PIG along the pipeline.
For the computation of ΔQ, only the cylindrical surface area in contact with CO2 is considered (refer to Figure 2) to be the predominant interface for heat exchange to occur. The correlations for the Nusselt (Nu) number to compute the external and internal heat transfer coefficients HTCo and HTCi (refer to Figure 2) depend on several factors, including whether the location of interest is internal or external to the accumulator, and the type of convective flow (i.e., free or forced). For the two-phase transition region of CO2, empirical correlations are distinguished in terms of whether the fluid is condensing (as is the case during the charging cycle of HPES-2) or evaporating (which occurs during the discharging period of HPES-2). The correlations developed by various scholars as utilized in C2O2 [6] in the present study are listed in Table 1 and Table 2 and may be reviewed in full detail from the respective sources [13,14,15,16,17,18].
The HTCs during operation could then be computed via Equation (9), with k being the thermal conductivity of CO2 and D the (internal or external) diameter of the accumulator. The ΔQ in Equation (8) could thus be determined through a thermal network, accounting for convective effects internal and external to the accumulator, in series with the conductive heat transfer mechanism across the thickness of the steel wall of the accumulator.
HTC = Nu(k/D)
Equation (8) was employed separately for the charging and discharging process to obtain the real work done during each process ΔWr-c (CO2) and ΔWr-d (CO2), respectively. The former parameter was considered to also reflect the real ESC under real operating conditions. In mathematical terms and analogous to Equation (6),
ESCr (CO2) = ΔWr-c (CO2)/(3.6 × 106)
The thermal efficiency η could thus be defined as the ratio of the actual energy (or work) recovered during discharging ΔWr-d (CO2) as compared to the work done (i.e., energy stored) during charging ΔWr-c (CO2):
η = ΔWr-d (CO2)/ΔWr-c (CO2)
Solving for Equations (8) and (10) also allows for an ESC factor β to be established as a measure of how close the real ESC is to the ideal scenario estimated from the thermodynamic model outlined in Section 2.1. In other words,
β = ESCr (CO2)/ESCi (CO2)
Values of η and β close to unity imply exceptional operating conditions approximating the ideal isothermal scenario.

3. Methodology

Figure 3 illustrates the overall research approach undertaken and how the different numerical models were executed to converge towards the research goals. The mathematical models described in Section 2 were implemented into two distinct numerical codes in Python© Version 3.7 [19]. The properties of air and CO2 (as applicable) were derived from the in-built Python© library CoolProp. Validation procedures were conducted for both numerical models. The numerical outcomes from CO2HPES [12] for parameters including the ideal energy storage capacity ESCi (CO2), the enthalpy h, the entropy s, and other fluid parameters were always within ±0.30% of analytical results. Further information may be found in [6,12].
For the thermodynamic analysis, the sizing of the accumulator for the air-based HPES system HPES-1 was derived from the optimization algorithm SmartPVB [20]. The latter was specifically developed to yield optimum structural design (i.e., maximize the ESC per unit mass of steel requirement for the accumulator) and operating parameters for offshore HPES accumulators operating with air as the energy storage medium. The geometric parameters of HPES-1 were then input into the model CO2HPES [12] to analyze the operation of HPES-2. In other words, the same accumulator was modelled to operate with CO2 undergoing phase change in lieu of air. The difference between HPES-1 and HPES-2 in terms of thermodynamic parameters could thus be identified, as discussed in Section 4.1.
For the transient thermal analysis conducted using the model C2O2 [6], only HPES-2 was considered. The equations described in Section 2.2 were systemized in a time-marching approach to model charging–hold–discharging–hold periods t that fall under LDES criteria (i.e., >6 h). A total of twelve different simulations were executed to identify the parameters which highly influenced the operation, as outlined in Section 4.2. The parameters for the sensitivity analysis were chosen to reproduce new data sets for interpretation that were not considered in previous works [6,12].
Test conditions and outcomes from both analyses are presented in the upcoming section together with a detailed discussion.

4. Results and Discussion

4.1. Results from Thermodynamic Analysis Assuming Ideal Isothermal Conditions

For the parametric thermodynamic analysis, only the operating pressure ratio rp was varied with assumed values of 1.5, 2.5, and 3.5, since a detailed parametric investigation had already been performed and is documented in [12].
Table 3 presents the comparison between the air-based HPES-1 and the CO2-based HPES-2 at an optimum rp of 1.5. The operating conditions for the two HPES systems were maintained the same except that the compressible fluid was air for the former and CO2 for the latter system. In fact, HPES-1 shall serve as a reference model with respect to HPES-2, to identify the differences arising due to a change in the energy storage fluid.
The operating pressure and temperature were limited to the subcritical conditions of CO2 as per the pressure–enthalpy plots [21] which allowed the fluid to undergo phase change. The length L and outer diameter Do of the accumulator for both systems were kept constant throughout, thus also resulting in an identical volumetric capacity Vc. For HPES-2, the mass of CO2 is higher than the mass of air requirement in HPES-1, due to the lower density of the former fluid. The 24 tonnes (t) needed in HPES-2 is equivalent to simply 0.16% of the CO2 emissions resulting from a total of 2034 private flights departing from Malta in 2022 [22].
Table 3 further lists the ideal ESC of both HPES systems. The value of 320 kWh for HPES-2 represents the maximum theoretical ESCi at an rp of 1.5 (marked in Figure 4a with a red circle). In other words, the ESCi value reflects isothermal conditions, with CO2 reaching a dryness fraction x of zero (i.e., full liquefaction). However, Figure 4a illustrates how the ESCi varies linearly with the value of x. The higher the mass of CO2 that manages to turn into a liquid (or the lower the value of x), the more energy is stored. Moreover, the lower the value of rp (or the higher the value of the pre-charge pressure p0 for a given pf), the higher the ESC that can be attained.
In a similar manner, Figure 4b demonstrates the increase in α with a reduction in the value of x, which is also a linear relationship. Considering all test cases, the ESC (in kWh) of HPES-2 relative to that of HPES-1 can be augmented by a factor ranging between 1.17 and 2.17. The ESD (in kWh/m3) thus augments by the same factor, given that there are no geometric differences between the accumulator of HPES-1 and HPES-2. The magnitude of α depends on the test conditions, mainly rp and x. For example, in the worst-case scenario with an rp of 3.5, CO2 remains in a gaseous state (i.e., x = 1) and the increase in ESC is minimal, with α equating to 1.17. Conversely, lowering rp to 1.5 and increasing x such that more than 80% of the mass of CO2 is liquefied can more than double the ESC and/or ESD of the HPES system.

4.2. Results from Transient Thermal Analysis

The conditions for the tests performed simulating transient thermal effects, taking into account the thermal resistance to heat transfer between the compressible fluid storing energy (i.e., CO2) and the surrounding seawater, are given in the first five columns of Table 4. The latter indicates how rp, T0, and t were varied, one at a time to assess the influence of every parameter on the ideal and real ESCs of HPES-2, as well as the thermal efficiency η and the ESC factor β. Indeed, the outcomes for ESCi (CO2), ESCr (CO2), η and β are given in the same table for every corresponding test. Note also how the dis/charging periods were maintained higher than 6 h to simulate LDES conditions. Test G is an exception where t was limited to 3 h to investigate the effect of short dis/charging periods.
All tests (i.e., Tests A and L) were conducted to account for the presence of a bi-directional PIG with the design parameters listed in Table 5. The size of the PIG was selected based on market-ready solutions [23]. The diameter of the seal discs was chosen to be slightly larger than the inner diameter Din of the accumulator, as described in Table 3. Made from a polymeric material, the discs are allowed to bend and fit inside the accumulator, whilst creating a seal to properly separate the CO2 from the seawater inside the system. For a specified number of simulations (i.e., Tests K and L), the presence of the HDPE liner was also incorporated. The liner properties are listed in Table 6, with the liner thickness value chosen after a preliminary study.
Table 4 indicates the maximum ESCi of the system derived from the CO2HPES model [12] and Equation (6) as outlined in Section 2.1. The values are thus representative of ideal isothermal conditions, with fully liquefied CO2 at the end of the charging process (i.e., x = 0 ). The ESCr magnitudes are the values derived from the transient thermal simulations representing real conditions performed using the C2O2 model [6] as described in Section 2.2 (refer to Equations (8) and (10)).
For every test, the charging–hold–discharging–hold cycle is superimposed on the p-h plots of Figure 5, Figure 6, Figure 7, Figure 8, Figure 9, Figure 10 and Figure 11, which also indicate the saturated liquid and saturated vapour CO2 lines. The two lines create what can be referred to as a dome-like region: the region which indicates the two-phase transition of CO2. The fluid is fully liquefied if it reaches the conditions specified by the saturated liquid line on the left-hand side of the plots. Outside the dome, the right-hand side region beyond the saturated vapour line signifies superheated CO2 gas.
Firstly, Figure 5 compares Tests A to C, thus reflecting any variations due to a distinct rp (or p0). The figure reveals that, in all three cases, the CO2 does not manage to change phase. Indeed, despite η values above 0.90 (refer to Table 4) due to narrow hysteresis loops, the real ESCr is low as compared to the ideal ESCi. Moreover, the magnitudes in Table 4 suggest that rp does not have a significant influence on the efficiency η. On the other hand, higher values of rp, or smaller values of p0, result in better β values.
The effect of initial temperature T0 on the operation of HPES-2 is visualized in Figure 6. The latter suggests that for the modelled conditions, the CO2 changes phase only for T0 values lower than 288.15 K. Referring to the outcomes in Table 4, the η values for Tests A, D, E, and F all exceed 0.85. Yet, an exceptional ESC factor β of 0.95 is only recorded for Test D, when 80% (i.e., x = 0.20) of the mass of CO2 in the system liquefies prior to the first hold period.
The outcomes from Tests A, G, H, and I are superimposed on Figure 7. The latter confirms that longer dis/charging durations result in smaller hysteresis loops, and thus more efficient operating cycles, as may also be realized from the corresponding η values in Table 4. Yet, increasing the dis/charging period does not contribute to CO2 liquefaction. For example, doubling the dis/charging duration from 12 to 24 h improves β by simply 2%. Indeed, the average β value for Tests A, G, H, and I, equates to 0.51, thus implying that augmenting the operating period up to 24 h still leaves half of the system’s capacity untapped. Comparing Tests D and J in Figure 8 is an alternative approach to isolating the effect of dis/charging period at an initial temperature T0 which permits CO2 to enter the transition region. The magnitude of η for Test J is higher than that recorded for Test D due to lengthier dis/charging periods. Indeed, the hysteresis effect for Test J is much smaller than that observed for Test D. Nonetheless, both η and β for Tests D and J exceed 0.85 as CO2 liquefies to low dryness fractions (i.e., x 0.20).
Figure 9 depicts the difference between Tests I and J, verifying that T0 governs the phase change of CO2, and thus the β value. Indeed, with reference to Table 4, the outcomes of η for both scenarios are very similar. Yet, the β magnitude increases by 68% from Tests I to J, as a substantial amount of the gas is allowed to condense.
In Tests K and L, the effect of the HDPE liner is studied. Firstly, comparing Tests K to A via Table 4, it is evident that the liner reduces both η and β when CO2 remains in the gaseous phase. Figure 10 further confirms the digitized outcomes, as a larger (i.e., wider) cycle is observed for Test K on the p-h plot. Analyzing Tests J and L in Figure 11 uncovers the effect of the liner when CO2 does not remain in the gaseous phase. Despite the presence of the liner, CO2 still liquefies under the conditions prescribed in Test L. Yet, the liner causes the path on the p-h plot to be very particular and to substantially deviate from following an isotherm. Interestingly, after 24 h of discharge, the CO2 under the conditions of Test L does not return back to the initial state, as has been observed with Test J in the absence of the liner, and all other tests in Figure 5, Figure 6, Figure 7, Figure 8, Figure 9 and Figure 10. Indeed, the plot for Test L in Figure 11 does not complete a closed cycle. Upon complete discharge, the CO2 cools down to the initial temperature of 283.15 K. Yet, the pressure drop down to 44.6 bar (rather than 38.2 bar) retains 30% of the mass of CO2 in a liquid state. Thus, the η value diminishes to 0.22.

5. Conclusions

Through numerical modelling, this study has unravelled the opportunities and challenges arising from the use of CO2 as the energy storage medium in a subsea HPES system. Thermodynamic and transient thermal analyses have established that maintaining subcritical operating conditions and allowing CO2 to undergo a phase change can provide multiple benefits. The following could be concluded:
  • In an ideal scenario, where the CO2 gas is completely liquefied and the phase change process follows an isothermal path, the ESC (or ESD) of the HPES system operating at a peak pressure of 57.3 bar can be increased by a maximum augmentation factor α, of 2.17;
  • The magnitude of α depends on multiple aspects including the dryness fraction x and the pressure ratio rp;
  • The minimum α value of 1.17 has been achieved at an rp value of 3.5 and an x value of unity.
Notwithstanding the key benefits listed in the previous paragraph, operation on CO2 in lieu of air also presents a number of limitations:
  • Being limited to operate below the critical pressure of 73.8 bar limits the augmentation factor α that can be achieved;
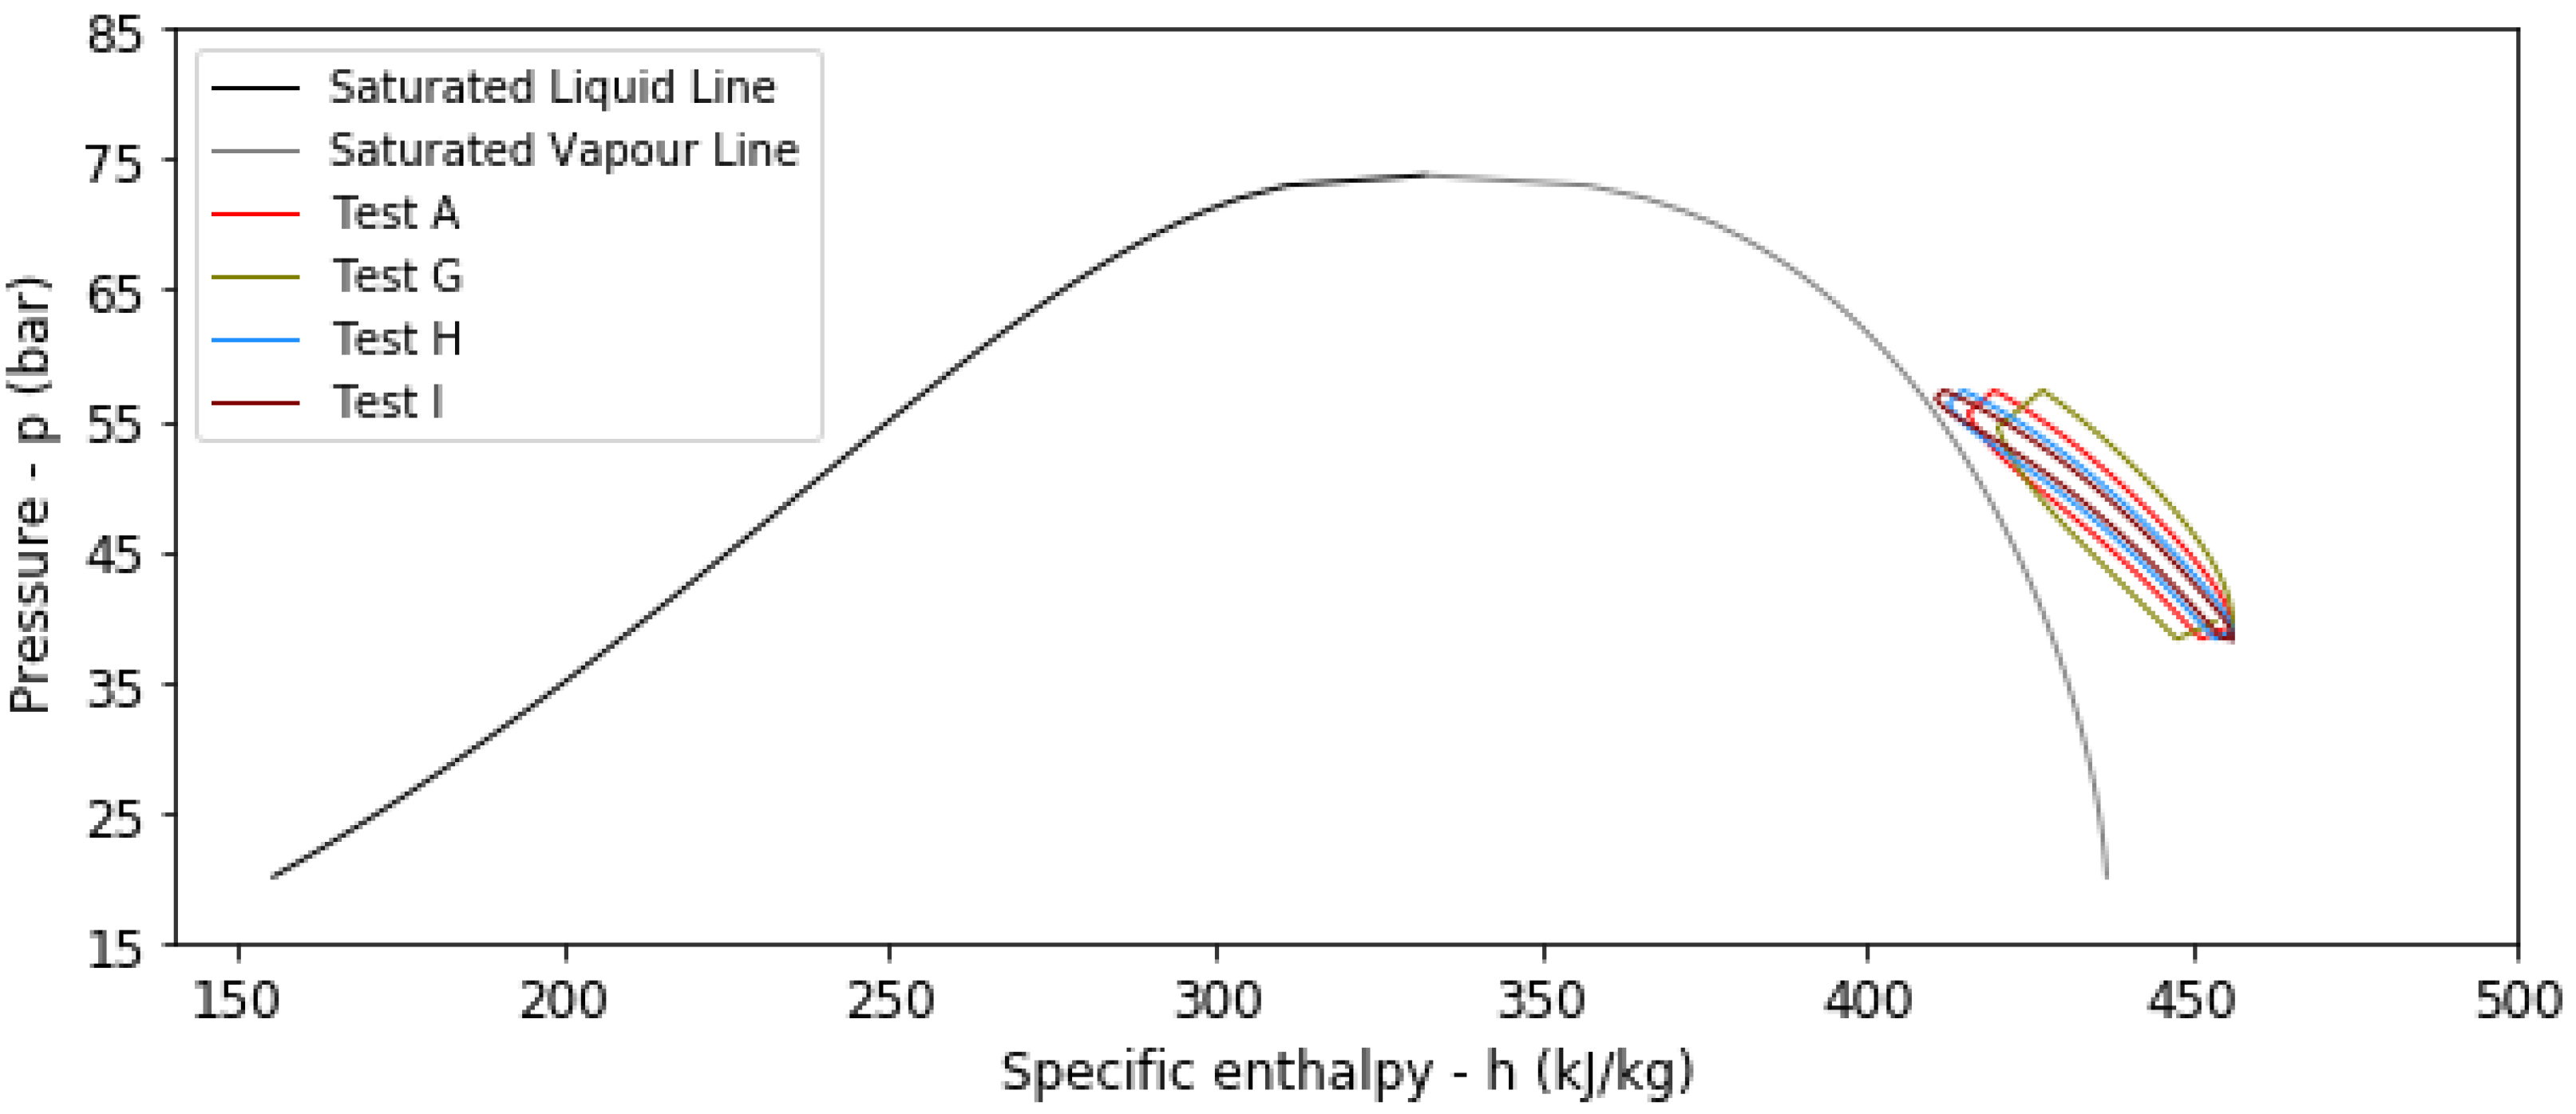
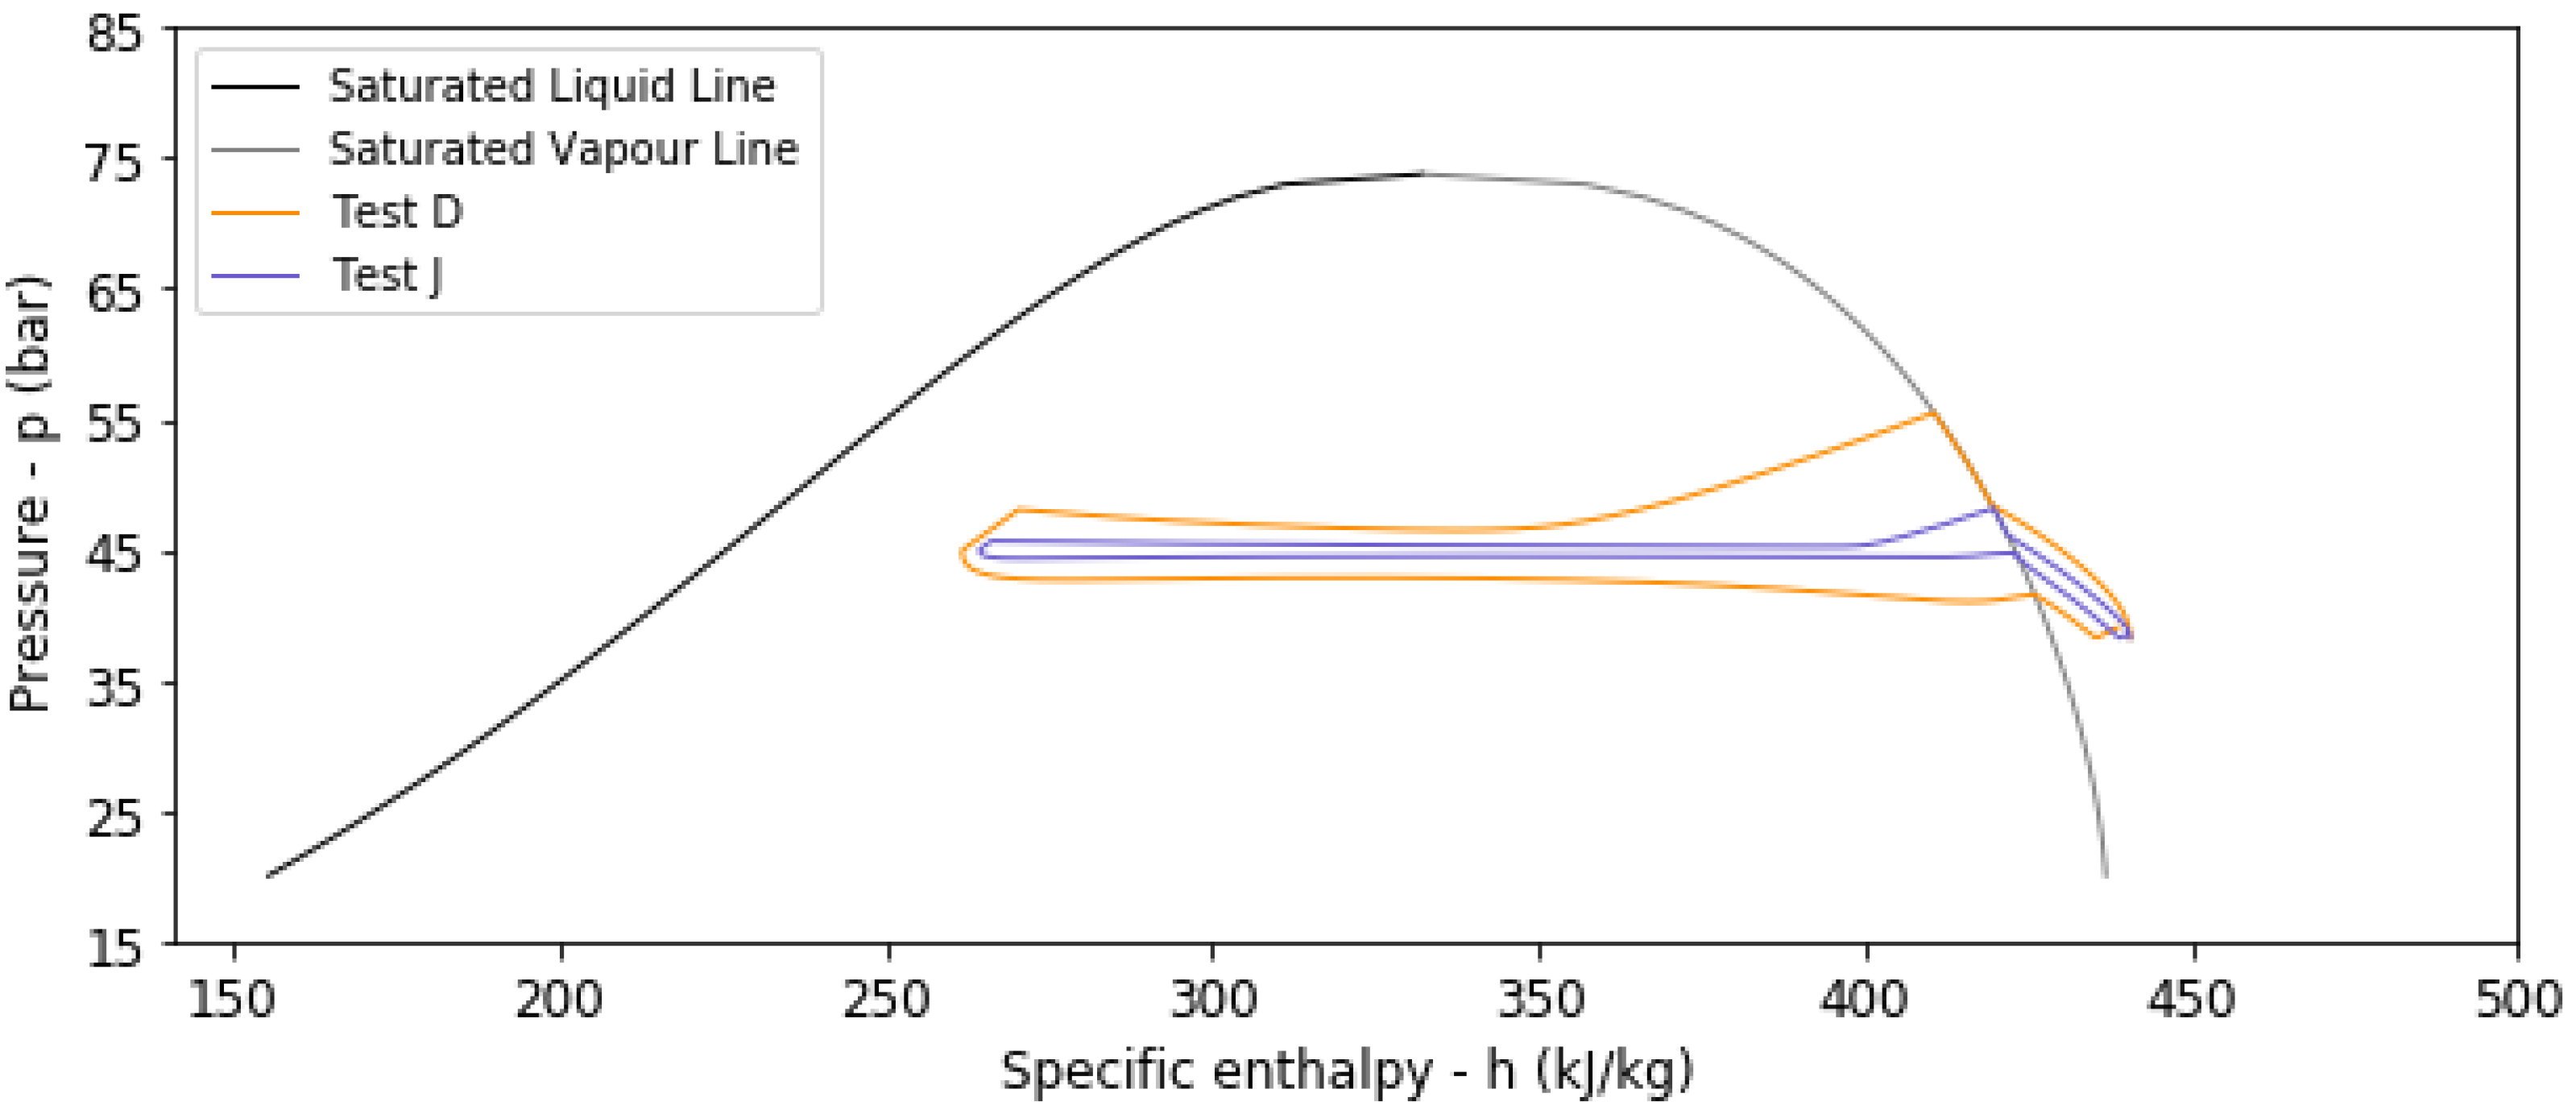
  • Transient thermal modelling that takes into account the resistance to heat transfer between the CO2 and the surrounding seawater has indicated that under certain conditions, the real operating cycle deviates appreciably from the ideal, isothermal scenario, resulting in instances when the CO2 remains in a gaseous state. Thus, despite a value of η beyond 0.90 being achievable, the ESC still remains significantly low;
  • Simulations have also revealed that, for the test cases considered, operation of HPES-2 must be maintained below 288.15 K for CO2 to enter the transition region;
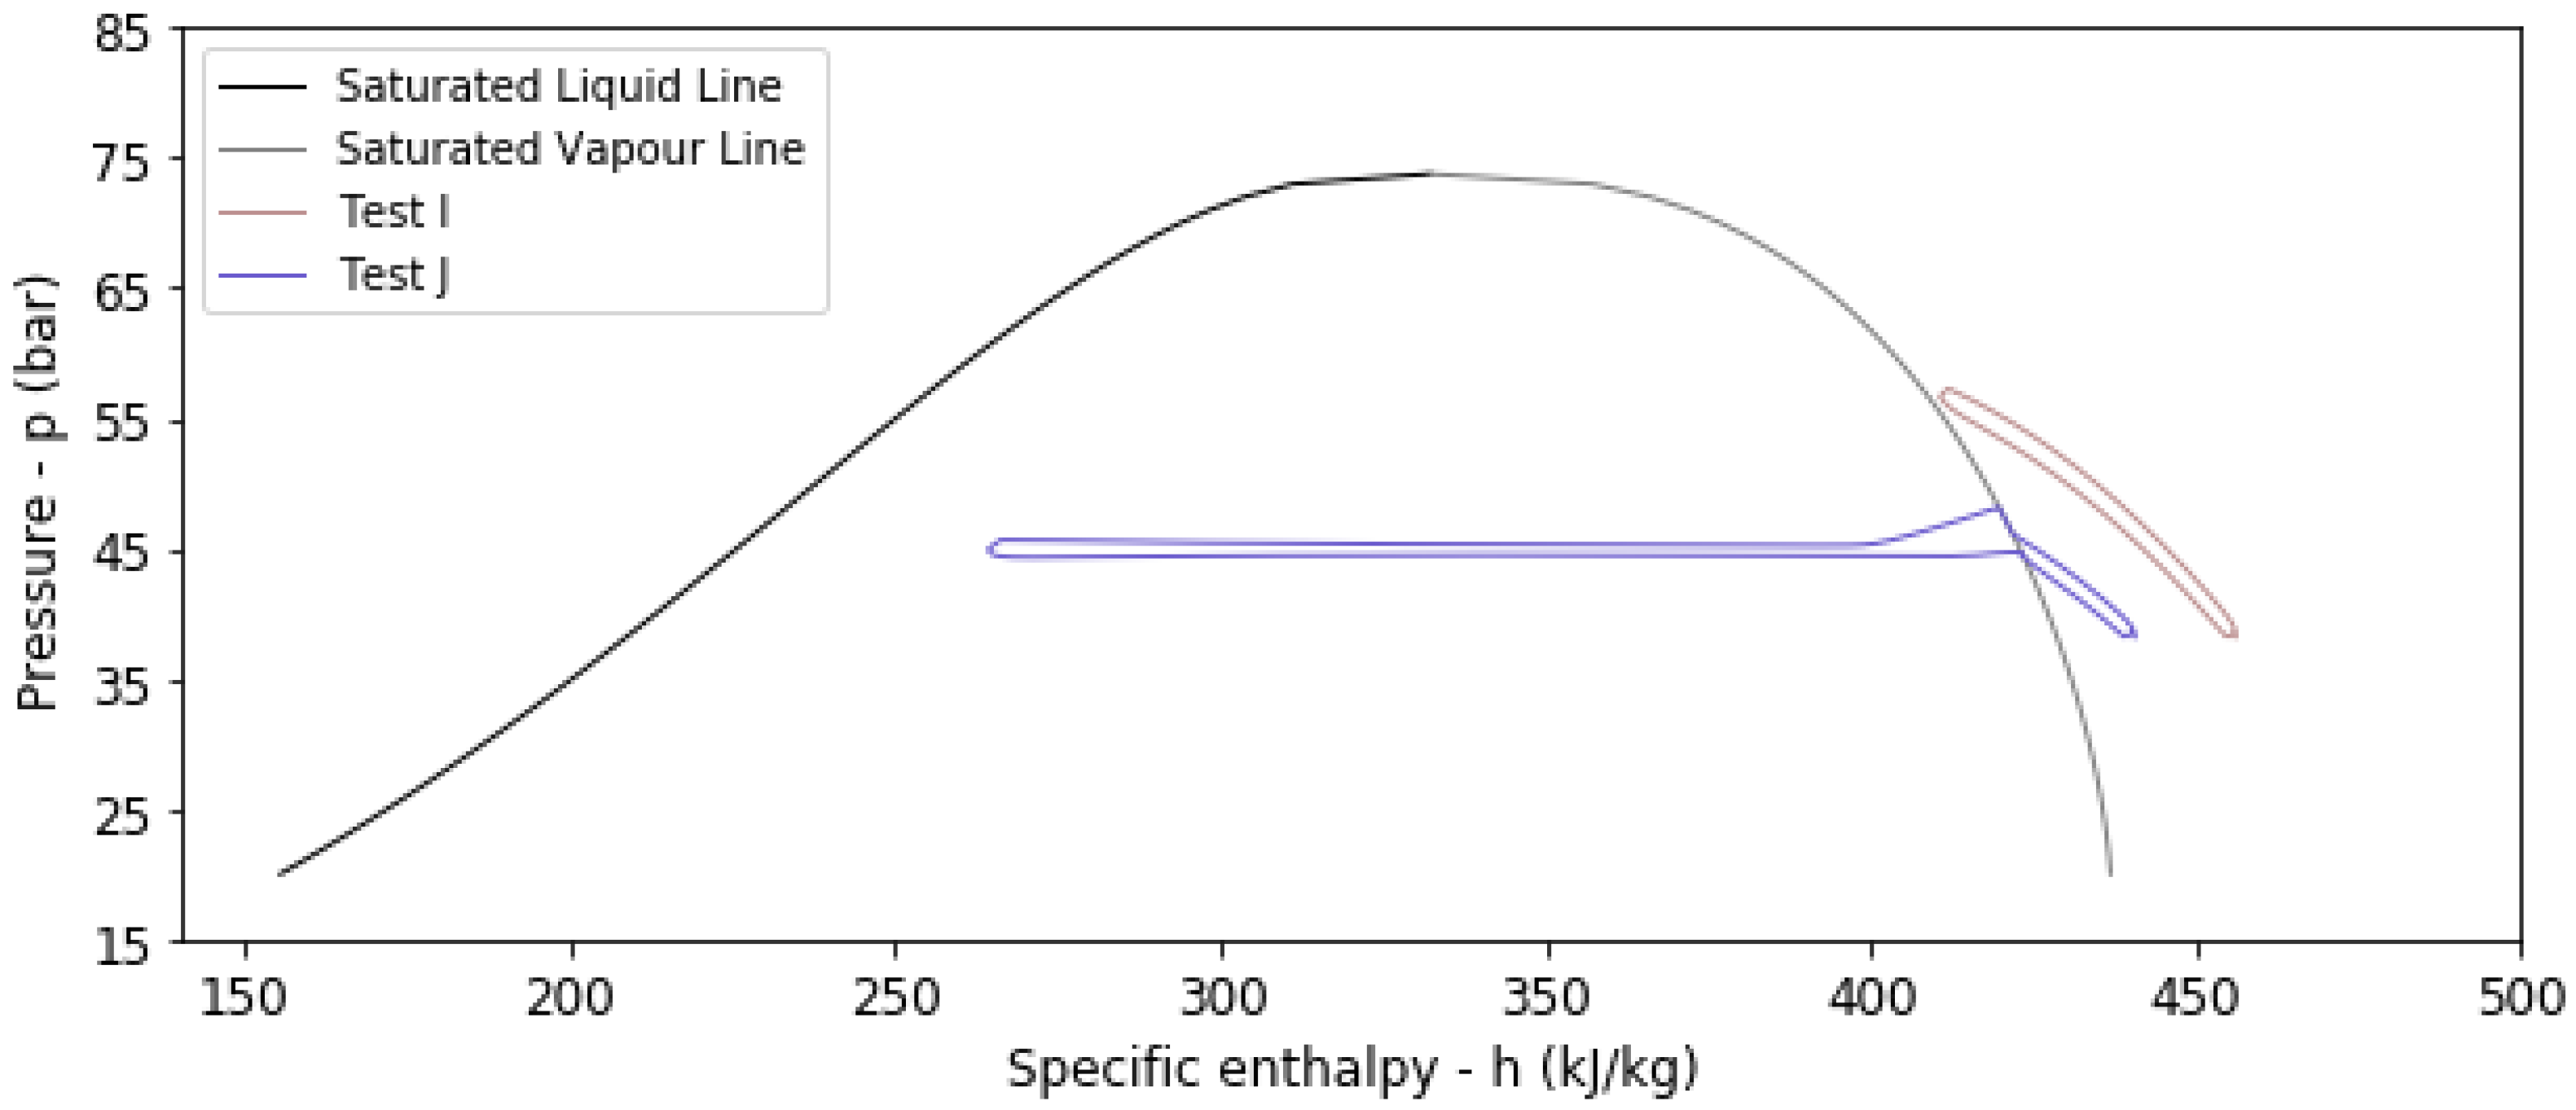
  • Adding on to the previous point, the initial operating temperature T0 has been noted to be the main controlling parameter in determining whether the CO2 undergoes a phase change during the storage cycle (gas–liquid–gas);
  • A change in dis/charging duration has been observed to contribute to a change in the η value. Yet, it does not regulate the condensation and evaporation of CO2;
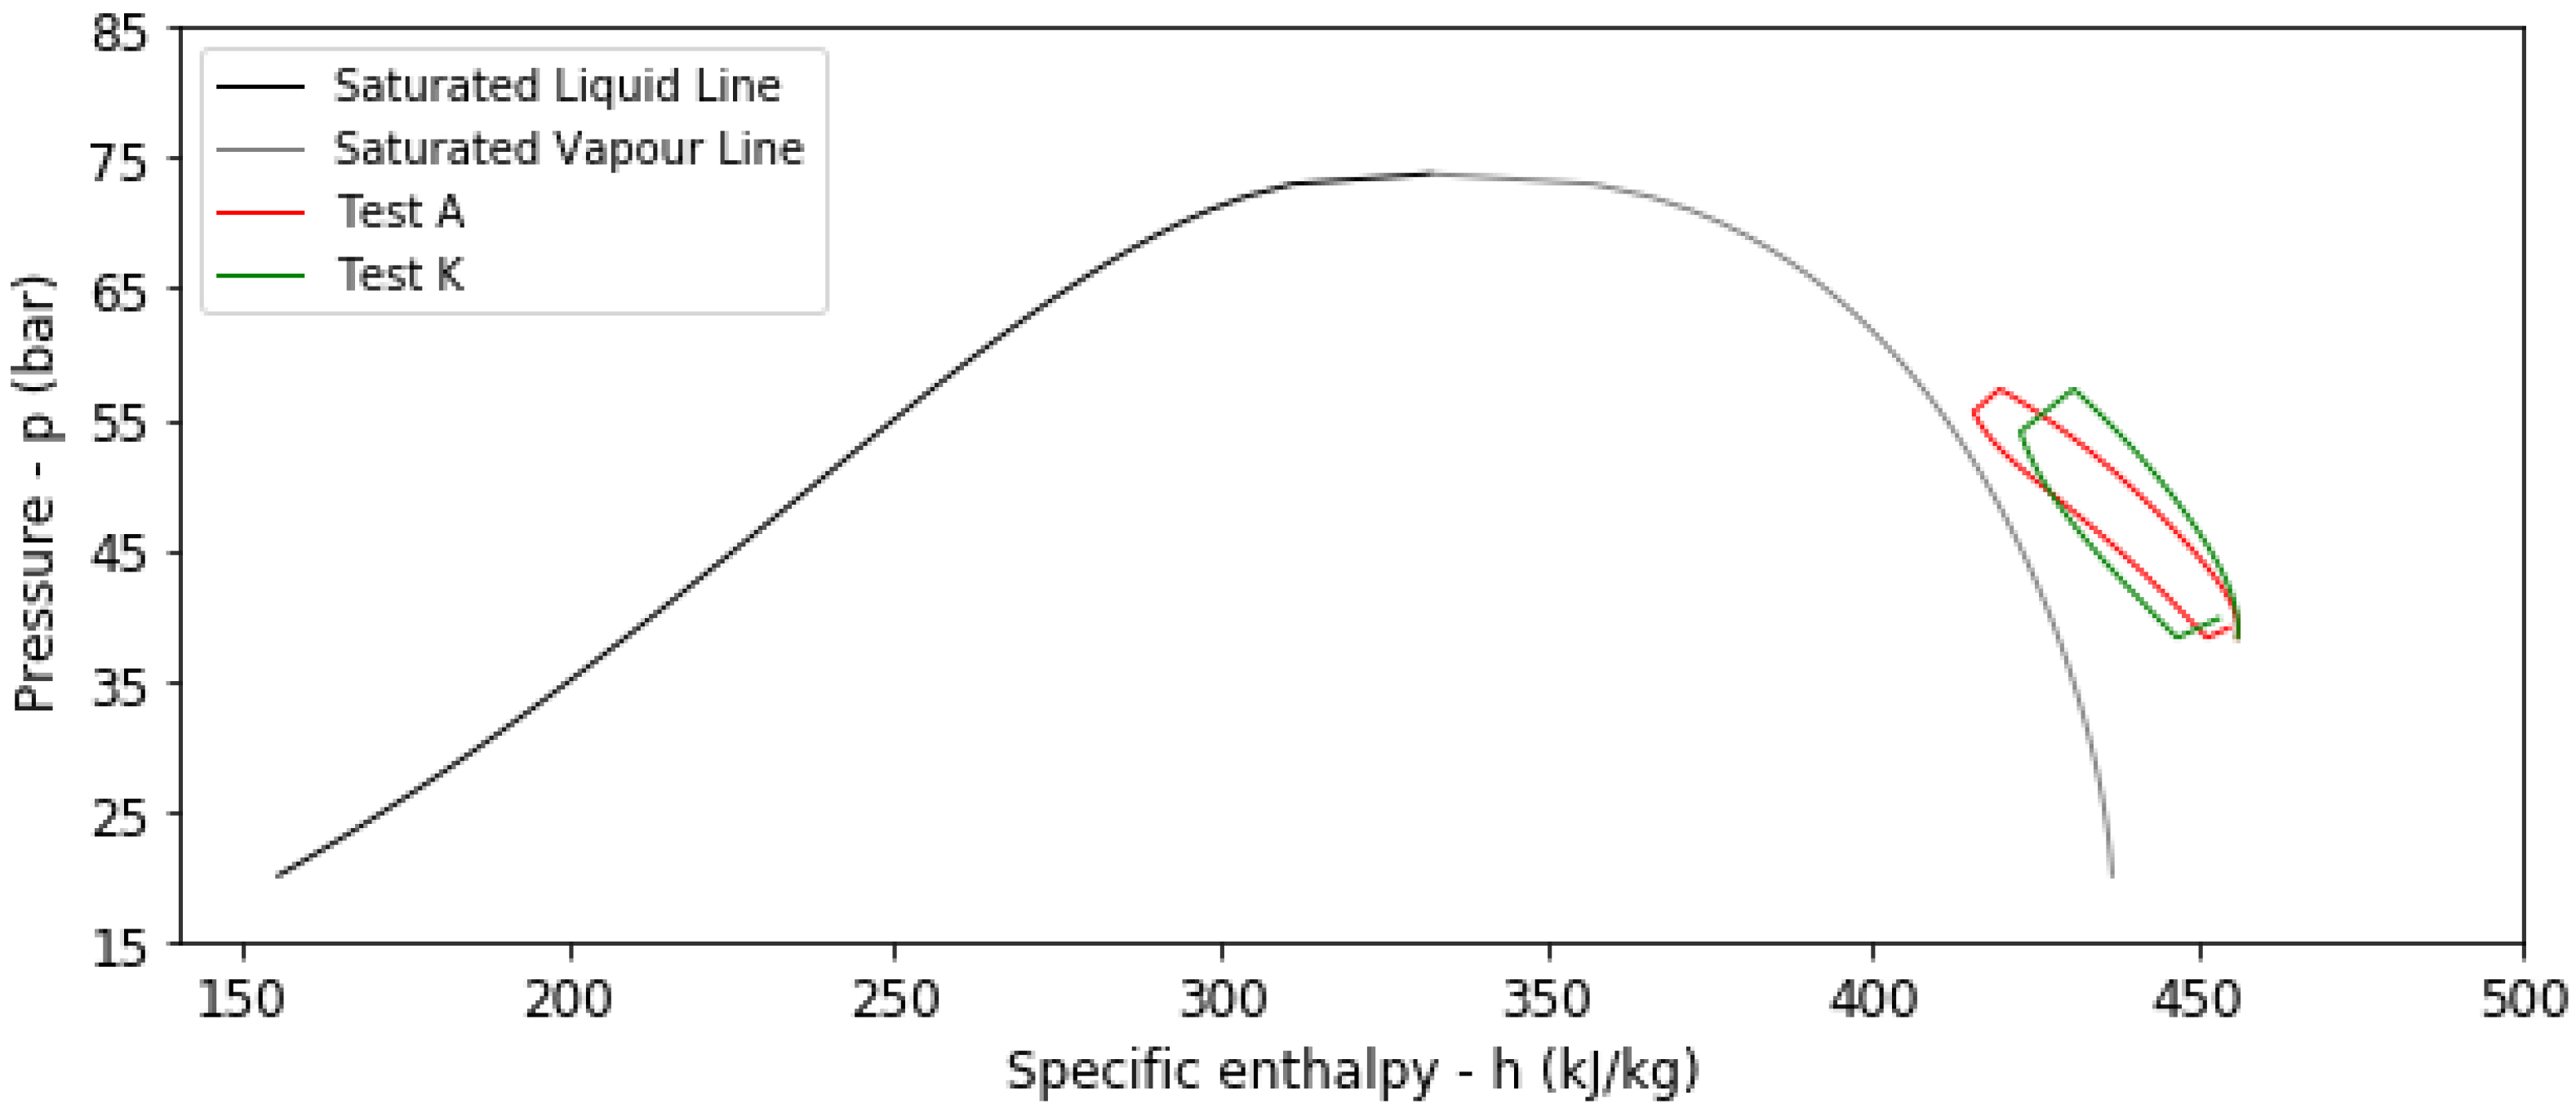
  • The presence of an HDPE liner reduces both the η and the β values.
Given the observations above, it is therefore important to emphasize that, when considering the operation of subsea HPES systems with CO2 (or a fluid undergoing phase change), it is crucial to examine both the η and the β parameters. Unless the gas is allowed to liquefy in subcritical conditions, it will be impossible to achieve an ESC close to the ideal value. For the cases considered, an initial temperature T0 of 283.15 K, a pressure ratio rp of 1.5, and a dis/charging duration between 6 and 24 h were identified as optimal conditions to obtain both a η and a β value above 0.85.
The presented analysis thus provides motivation to explore in further depth the potential of subsea CO2-based accumulators for energy storage applications. More comprehensive analysis incorporating measurements from scaled HPES systems in laboratory and/or subsea environments is necessary to validate the outcomes made known in this article. Thermal analysis utilizing alternative techniques as computational fluid dynamics (CFD) can provide further validation of the results laid forward in this study. Flow visualization experiments and a better understanding of the chemical phenomena occurring during the two-phase state of the fluid will also assist in acknowledging aspects that might not be apparent through numerical modelling.
The conclusions drawn in the present study provide insight into how future research can improve the performance of a CO2-based HPES system operating subsea. Evidently, regulating the initial and operating temperature is the main contributing parameter to obtain a high thermal efficiency combined with augmented ESC.

Author Contributions

Conceptualization, T.S.; methodology, C.C.; software, C.C. and L.J.B.; validation, C.C. and L.J.B.; formal analysis, C.C.; investigation, C.C.; resources, T.S.; data curation, C.C.; writing—original draft preparation, C.C.; writing—review and editing, T.S. and L.J.B.; visualization, C.C.; supervision, T.S.; project administration, T.S.; funding acquisition, T.S. All authors have read and agreed to the published version of the manuscript.

Funding

The research presented in this article has been supported by two projects being funded by Xjenza Malta under the FUSION R&I Research Excellence Program: (1) SEA2F (Investigating the Thermal Performance of Subsea Energy Storage Accumulators with a 2-Phase Fluid Transition; project reference REP-2021-008) and (2) SAICOPES (Subsea Air Isothermal Compression using Offshore Pipelines in Long Duration Energy Storage Applications; project reference REP-2023-004).

Institutional Review Board Statement

Not applicable.

Informed Consent Statement

Not applicable.

Data Availability Statement

Data are contained within the article.

Conflicts of Interest

The authors declare no conflicts of interest. The funder had no role in the design of the study; in the collection, analyses, or interpretation of data; in the writing of the manuscript; or in the decision to publish the results.

References

  1. Budt, M.; Wolf, D.; Span, R.; Yan, J. A Review on Compressed Air Energy Storage: Basic Principles, Past Milestones and Recent Developments. Appl. Energy 2016, 170, 250–268. [Google Scholar] [CrossRef]
  2. Odukomaiya, A.; Abu-Heiba, A.; Graham, S.; Momen, A.M. Experimental and Analytical Evaluation of a Hydro-pneumatic Compressed-Air Ground-Level Integrated Diverse Energy Storage (GLIDES) System. Appl. Energy 2018, 221, 75–85. [Google Scholar] [CrossRef]
  3. Enabling Large-Scale Offshore Energy Storage, FLASC—Renewable Energy Storage. Available online: https://offshoreenergystorage.com/ (accessed on 11 July 2024).
  4. Messer Group GmbH. Properties of Carbon Dioxide; Messer Group GmbH: Sulzbach, Germany.
  5. Vecchi, A.; Li, Y.; Ding, Y.; Mancarella, P.; Sciacovelli, A. Liquid air energy storage (LAES): A review on technology state-of-the-art, integration pathways and future perspectives. Adv. Appl. Energy 2021, 3, 10047. [Google Scholar] [CrossRef]
  6. Briffa, L.J.B.; Cutajar, C.; Sant, T.; Buhagiar, D. Numerical Modeling of the Thermal Behavior of Subsea Hydro-Pneumatic Energy Storage Accumulators Using Air and CO2. Energies 2022, 15, 8706. [Google Scholar] [CrossRef]
  7. Li, Y.; Yu, H.; Tang, D.; Li, Y.; Zhang, G.; Liu, Y. A Comparison of Compressed Carbon Dioxide Energy Storage and Compressed Air Energy Storage in Aquifers using Numerical Methods. Ren. Energy 2022, 187, 1130–1153. [Google Scholar] [CrossRef]
  8. Sun, W.; Liu, X.; Yang, X.; Yang, X.; Liu, Z. Design and Thermodynamic Performance Analysis of a New Liquid Carbon Dioxide Energy Storage System with Low Pressure Stores. Energy Convers. Manag. 2021, 239, 114227. [Google Scholar] [CrossRef]
  9. Zhang, Y.; Yang, K.; Hong, H.; Zhong, X.; Xu, J. Thermodynamic Analysis of a Novel Energy Storage System with Carbon Dioxide as Working Fluid. Ren. Energy 2016, 99, 682–697. [Google Scholar] [CrossRef]
  10. CO2 Battery, Energy Dome. Available online: https://energydome.com/co2-battery/ (accessed on 20 July 2024).
  11. Abu-Heiba, A.; Ally, M.R.; Smith, B.; Momen, A. Increasing Compressed Gas Energy Storage Density Using CO2–N2 Gas Mixture. Energies 2020, 13, 2431. [Google Scholar] [CrossRef]
  12. Cutajar, C.; Sant, T.; Briffa, L.J.B.; Buhagiar, D. Assessing the potential increase in the energy storage density of subsea hydro-pneumatic accumulators using CO2 in lieu of air. J. Therm. Sci. Eng. App. 2022, 15, 031001. [Google Scholar] [CrossRef]
  13. Churchill, S.W.; Chu, H.H.S. Correlation Equations for Laminar and Turbulent Free Convection from a Horizontal Cylinder. Int. J. Heat Mass Transf. 1975, 18, 1049–1053. [Google Scholar] [CrossRef]
  14. Churchill, S.W.; Bernstein, M.A. Correlating Equation for Forced Convection from Gases and Liquids to a Circular Cylinder in Crossflow. J. Heat Transf. 1977, 99, 300–306. [Google Scholar] [CrossRef]
  15. Ludovisi, D.; Garza, I.A. Natural Convection Heat Transfer in Horizontal Cylindrical Cavities: A Computational Fluid Dynamics (CFD) Investigation. In Proceedings of the ASME 2013 Power Conference, Boston, MA, USA, 29 July–1 August 2013. [Google Scholar]
  16. Gnielinski, V. New Equations for Heat and Mass Transfer in Turbulent Pipe and Channel Flow. Int. Chem. Eng. 1976, 16, 359–368. [Google Scholar]
  17. Thome, J.; El Hajal, J.; Cavallini, A. Condensation in horizontal tubes, part 2: New heat transfer model based on flow regimes. Int. J. Heat Mass Transf. 2003, 46, 3365–3387. [Google Scholar] [CrossRef]
  18. Fang, X. A new correlation of flow boiling heat transfer coefficients for carbon dioxide. Int. J. Heat Mass Transf. 2013, 64, 802–807. [Google Scholar] [CrossRef]
  19. Welcome to Python.org, Python. Available online: https://www.python.org/ (accessed on 25 July 2024).
  20. Cutajar, C.; Sant, T.; Farrugia, R.N.; Buhagiar, D. A Software Tool for the Design and Operational Analysis of Pressure Vessels Used in Offshore Hydro-Pneumatic Energy Storage. J. Energy Storage 2021, 40, 102750. [Google Scholar] [CrossRef]
  21. Download Mollier Charts, ChemicaLogic. Available online: https://www.chemicalogic.com/Pages/DownloadMollierCharts.html (accessed on 25 July 2024).
  22. Committed to the Environment (CE). CO2 Emissions of Private Aviation in Europe; Committed to the Environment (CE): Delft, The Netherlands, 2023. [Google Scholar]
  23. Williamson, T.D. Pipeline Services Pigging Products, Bulletin No: 3000.05.02; TDW: Tulsa, OK, USA, 2017. [Google Scholar]
  24. Zhu, X.; Zhang, S.; Li, X.; Wang, D.; Yu, D. Numerical simulation of contact force on bi-directional pig in gas pipeline: At the early stage of pigging. J. Nat. Gas Sci. Eng. 2015, 23, 127–138. [Google Scholar] [CrossRef]
  25. Canada’s Oil and Natural Gas Producers (CAPP). Use of High Density Polyethylene (HDPE) Lined Pipelines; Canada’s Oil and Natural Gas Producers (CAPP): Calgary, AB, Canada, 2022. [Google Scholar]
Figure 1. Subsea HPES system under investigation: air-based HPES-1 (not to scale).
Gases 04 00017 g001
Figure 2. Subsea HPES system under investigation: CO2-based HPES-2 (not to scale).
Gases 04 00017 g002
Figure 3. Flowchart illustrating overall research approach [6,12,20].
Gases 04 00017 g003
Figure 4. Potential increase in the ESC of a subsea HPES system when using CO2 in lieu of air. (a) Variation of theoretical ideal ESC with dryness fraction of CO2 for different pressure ratios. (b) Variation of augmentation factor with dryness fraction of CO2 for different pressure ratios.
Gases 04 00017 g004
Figure 5. The p-h plot for Tests A, B, and C showing the state of CO2 during operation for different operating pressure ratios rp.
Gases 04 00017 g005
Figure 6. The p-h plot for Tests A, D, E, and F showing the state of CO2 during operation for different initial temperatures T0.
Gases 04 00017 g006
Figure 7. The p-h plot for Tests A, G, H, and I showing the state of CO2 during operation for different dis/charging periods t at an initial temperature T0 of 293.15 K.
Gases 04 00017 g007
Figure 8. The p-h plot for Tests D and J showing the state of CO2 during operation for different dis/charging periods t at an initial temperature T0 of 283.15 K.
Gases 04 00017 g008
Figure 9. The p-h plot for Tests I and J showing the state of CO2 during operation for different initial temperatures T0 at a dis/charging period t of 24 h.
Gases 04 00017 g009
Figure 10. The p-h plot for Tests A and K showing the state of CO2 during operation with and without HDPE liner at an initial temperature T0 of 293.15 K and a dis/charging period t of 6 h.
Gases 04 00017 g010
Figure 11. The p-h plot for Tests J and L showing the state of CO2 during operation with and without HDPE liner at an initial temperatures T0 of 283.15 K and a dis/charging period t of 24 h.
Gases 04 00017 g011
Table 1. Correlations implemented in C2O2 [6] to determine the Nu number for single-phase fluids.
LocationHTCType of ConvectionFluidHTC
ExternalHTCoFreeSeawaterChurchill-Chu [13]
ExternalHTCoForcedSeawaterChurchill-Bernstein [14]
InternalHTCiFreeGaseous CO2Ludovisi-Garza [15]
InternalHTCiForcedGaseous CO2Gnielinski [16]
Table 2. Correlations implemented in C2O2 [6] to determine the Nu number for two-phase CO2.
LocationHTCFluidPhase Change ModeHTC
InternalHTCiTwo-phase CO2CondensingThome et al. [17]
InternalHTCiTwo-phase CO2EvaporatingFang et al. [18]
Table 3. Comparison of the geometric and thermodynamic parameters of an air-based (HPES-1) and a CO2-based (HPES-2) system.
Parameter (Unit)HPES-1HPES-2
Compressible fluidAirCO2
Peak pressure—pf (bar)57.3057.30
Initial pressure—p0 (bar)38.2038.20
Accumulator length—L (m)150150
Accumulator outer diameter—Do (m)1.5241.524
Accumulator inner diameter—Din (m)1.491.49
Accumulator wall thickness—ew (mm)17.0617.06
Volumetric capacity—Vc (m3)261261
Mass of steel—ms (t)9595
Mass of working fluid—mair or mCO2 (t)724
Ideal ESC—ESCi (kWh)148320
Table 4. Test conditions of and outcomes from the transient thermal analysis for the CO2-based HPES-2.
TestHDPE Liner
(-)
Initial Temp
T0 (K)
Pressure Ratio
rp (-)
Dis/Charging Time
t (h)
Ideal ES C 1 ESCi (kWh)Real ES C 2 ESCr (kWh)Efficiency η (-)ESC Factor β (-)
ANo293.151.563201600.90810.5056
BNo293.152.562621770.91510.6778
CNo293.153.562201610.90740.7337
DNo283.151.562602480.85910.9519
ENo288.151.562881660.87520.5774
FNo298.151.563401490.91090.4369
GNo293.151.533201500.84370.4765
HNo293.151.5123201650.94670.5240
INo293.151.5243201690.96900.5351
JNo283.151.5242602340.96480.8973
KYes293.151.562851310.82930.4584
LYes283.151.5242351780.22550.7580
1 Obtained from thermodynamic model CO2HPES [12]. 2 Obtained from transient thermal model C2O2 [6].
Table 5. Design parameters of bi-directional PIG.
Parameter (Unit)ValueSource
Disc diameter—Dd (m)1.50[23]
Disc thickness—ed (m)0.04[23]
Static friction coefficient—µs (-)0.60[24]
Kinetic friction coefficient—µk (-)0.50[24]
Table 6. Properties of HDPE liner included in Tests K and L.
Parameter (Unit)ValueSource
Density—ρl (kg/m3)948[25]
Thermal conductivity—kl (W/m K)0.40[25]
Specific heat capacity—cl (J/kg K)1810[25]
Liner thickness—el (m)0.036
Liner roughness—εl (m)0.000005[25]
Disclaimer/Publisher’s Note: The statements, opinions and data contained in all publications are solely those of the individual author(s) and contributor(s) and not of MDPI and/or the editor(s). MDPI and/or the editor(s) disclaim responsibility for any injury to people or property resulting from any ideas, methods, instructions or products referred to in the content.

