
The Impact of Retrofitting Natural Gas-Fired Power Plants on Carbon Footprint: Converting from Open-Cycle Gas Turbine to Combined-Cycle Gas Turbine

 ,
,
Abstract
:1. Introduction
2. Materials and Methods
2.1. An Overview of Natural Gas-Fired Power Generation
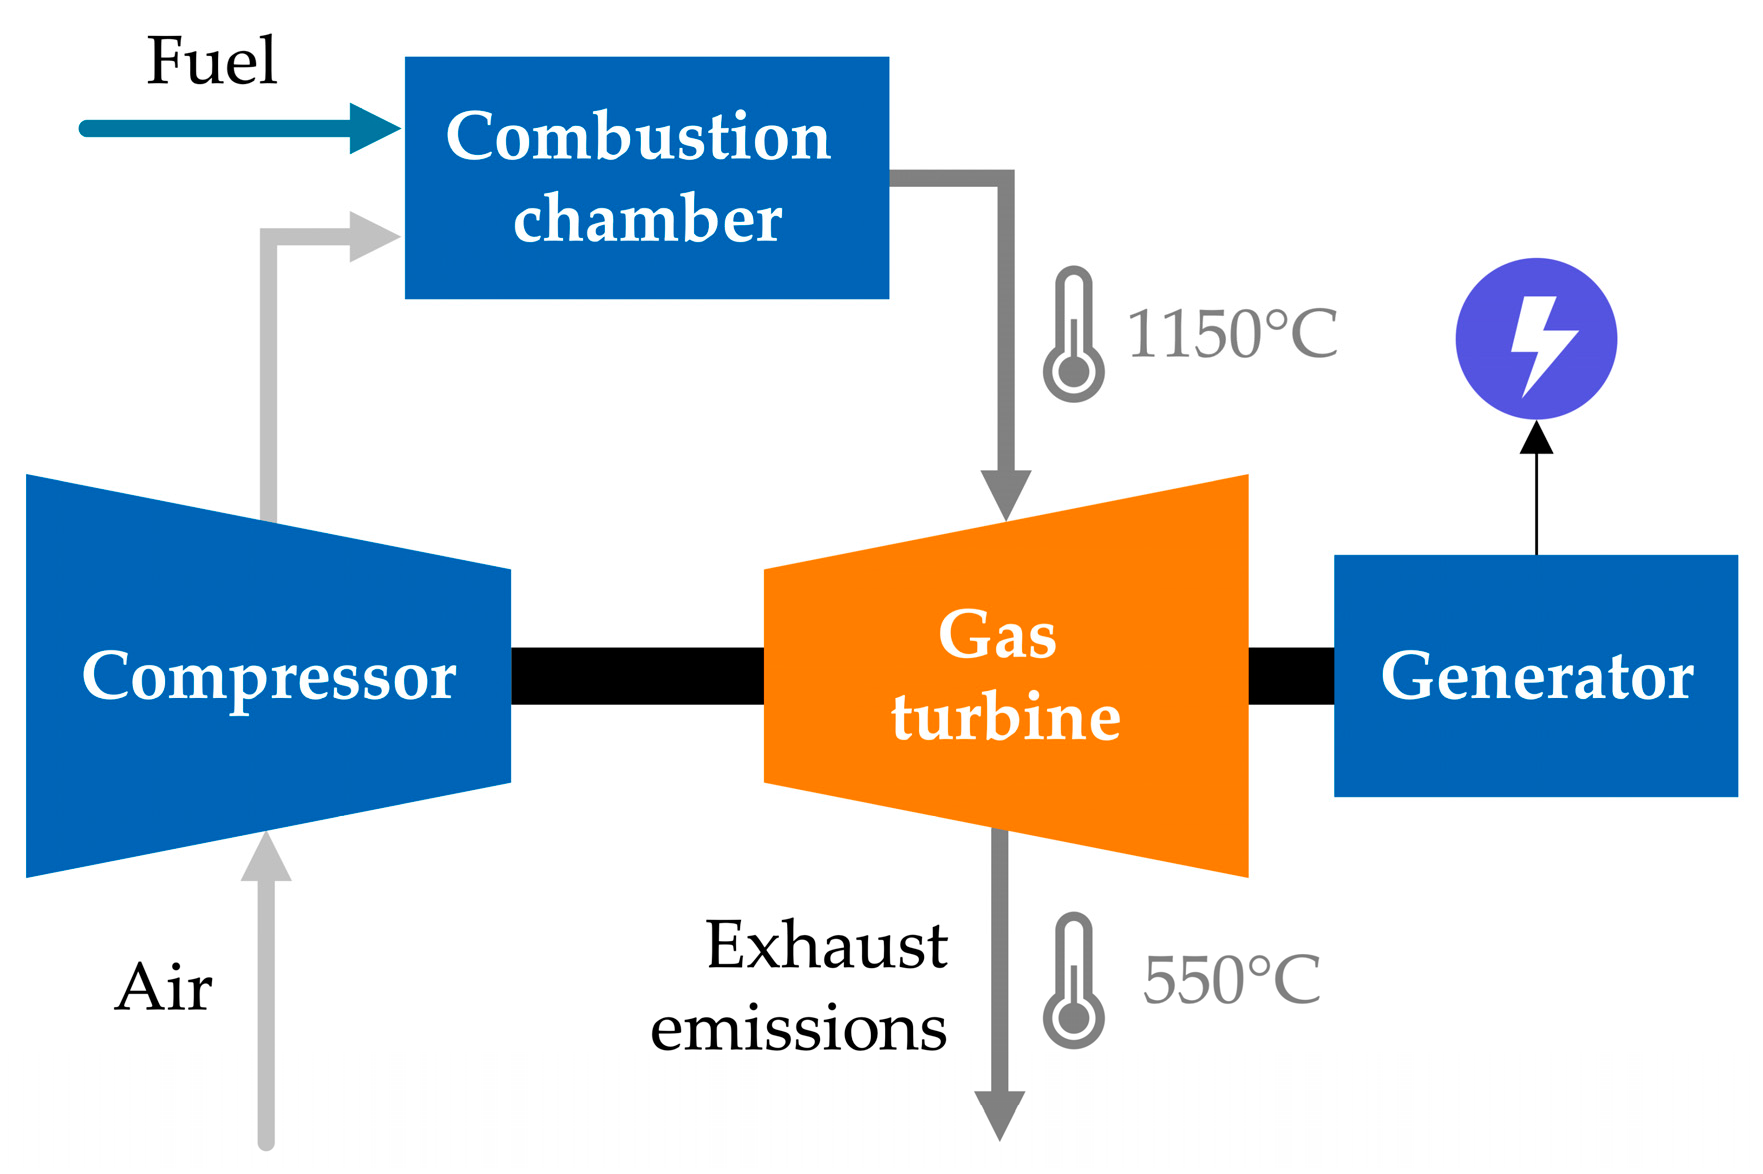
2.1.1. Open-Cycle Gas Turbine
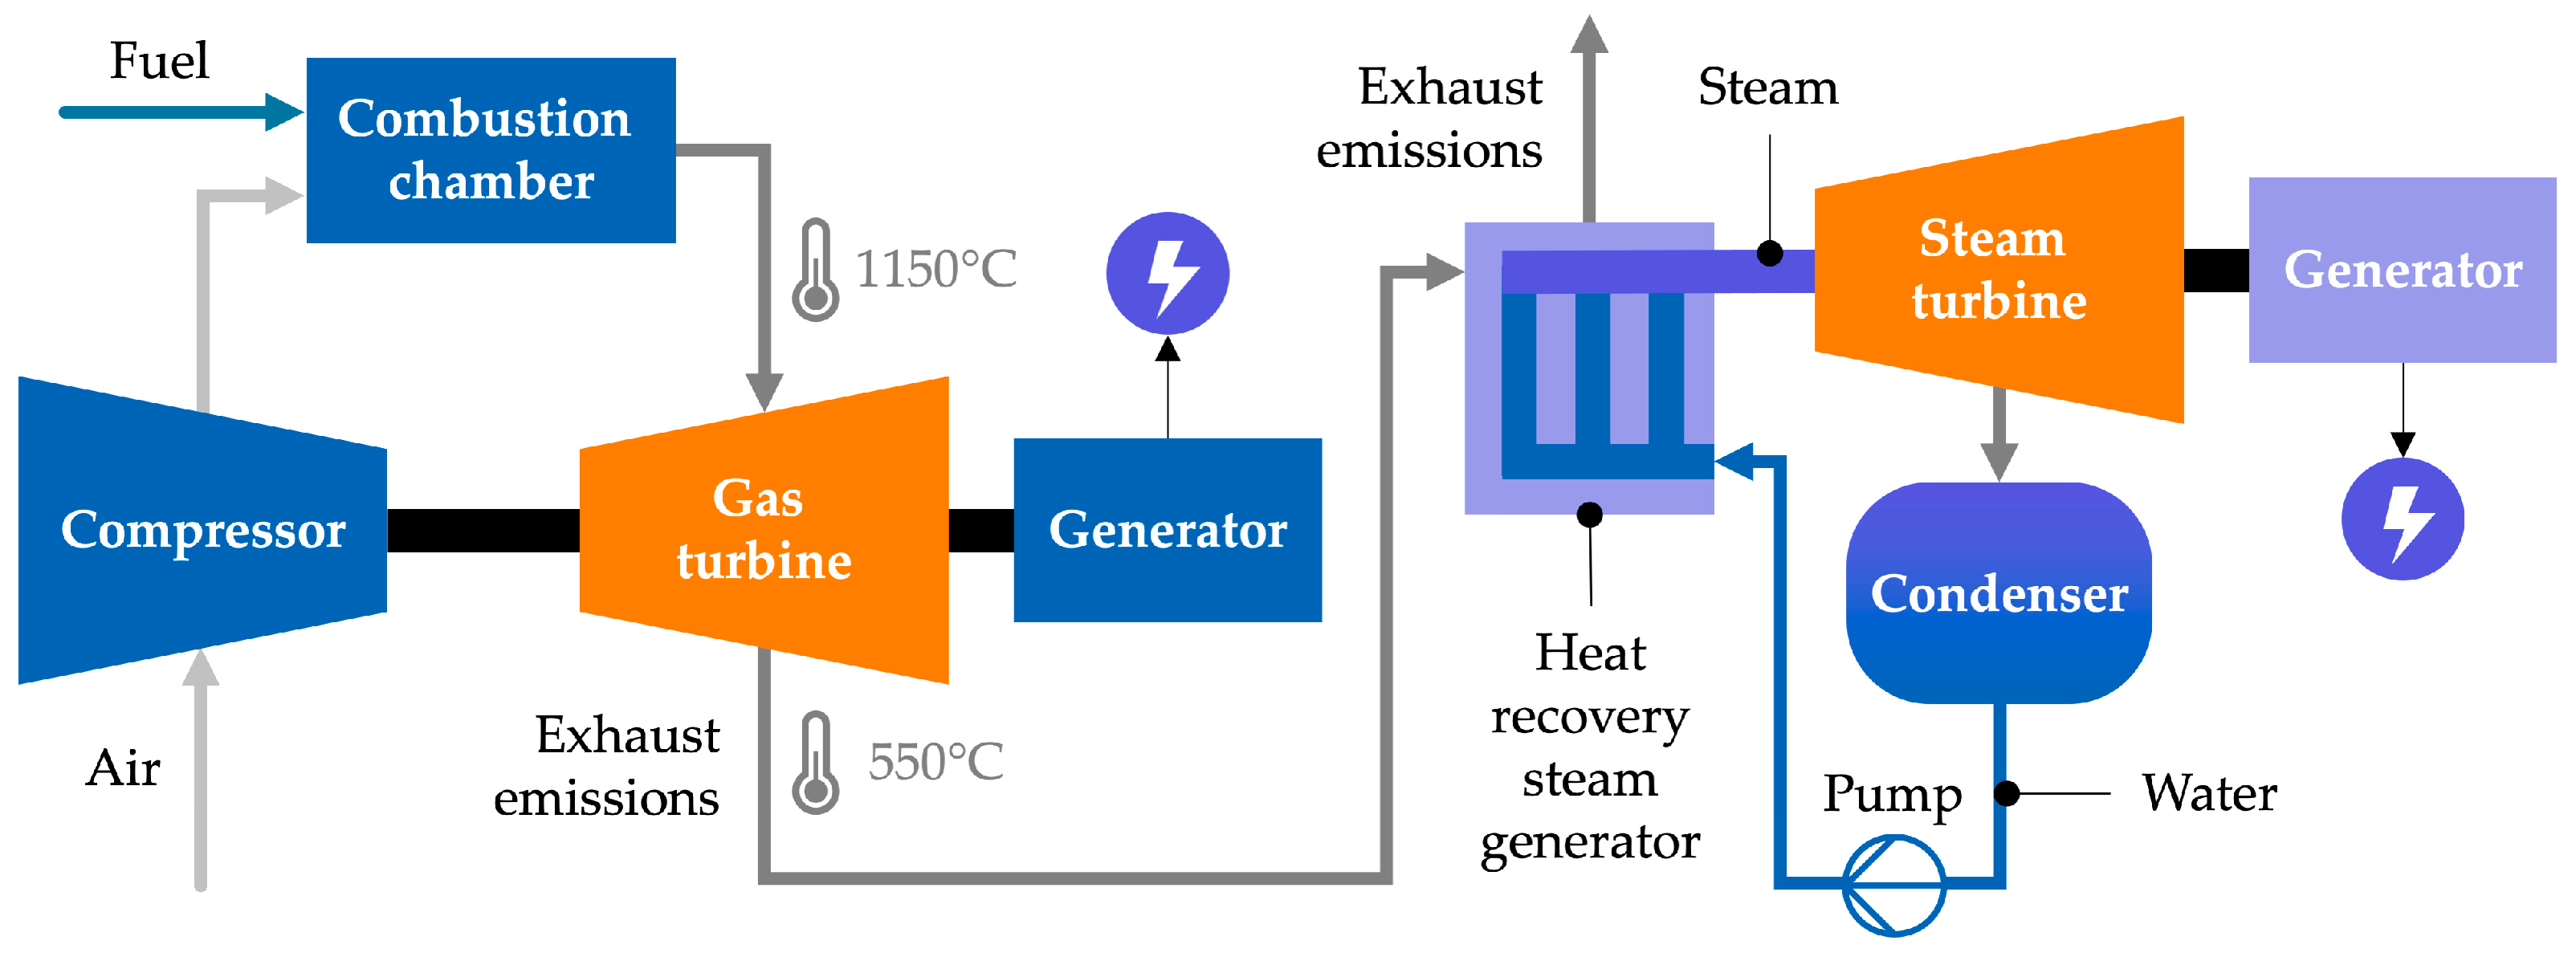
2.1.2. Combined-Cycle Gas Turbine
2.2. Carbon Footprint
2.3. Case Study
2.3.1. BR-NGF Power Plant Presentation
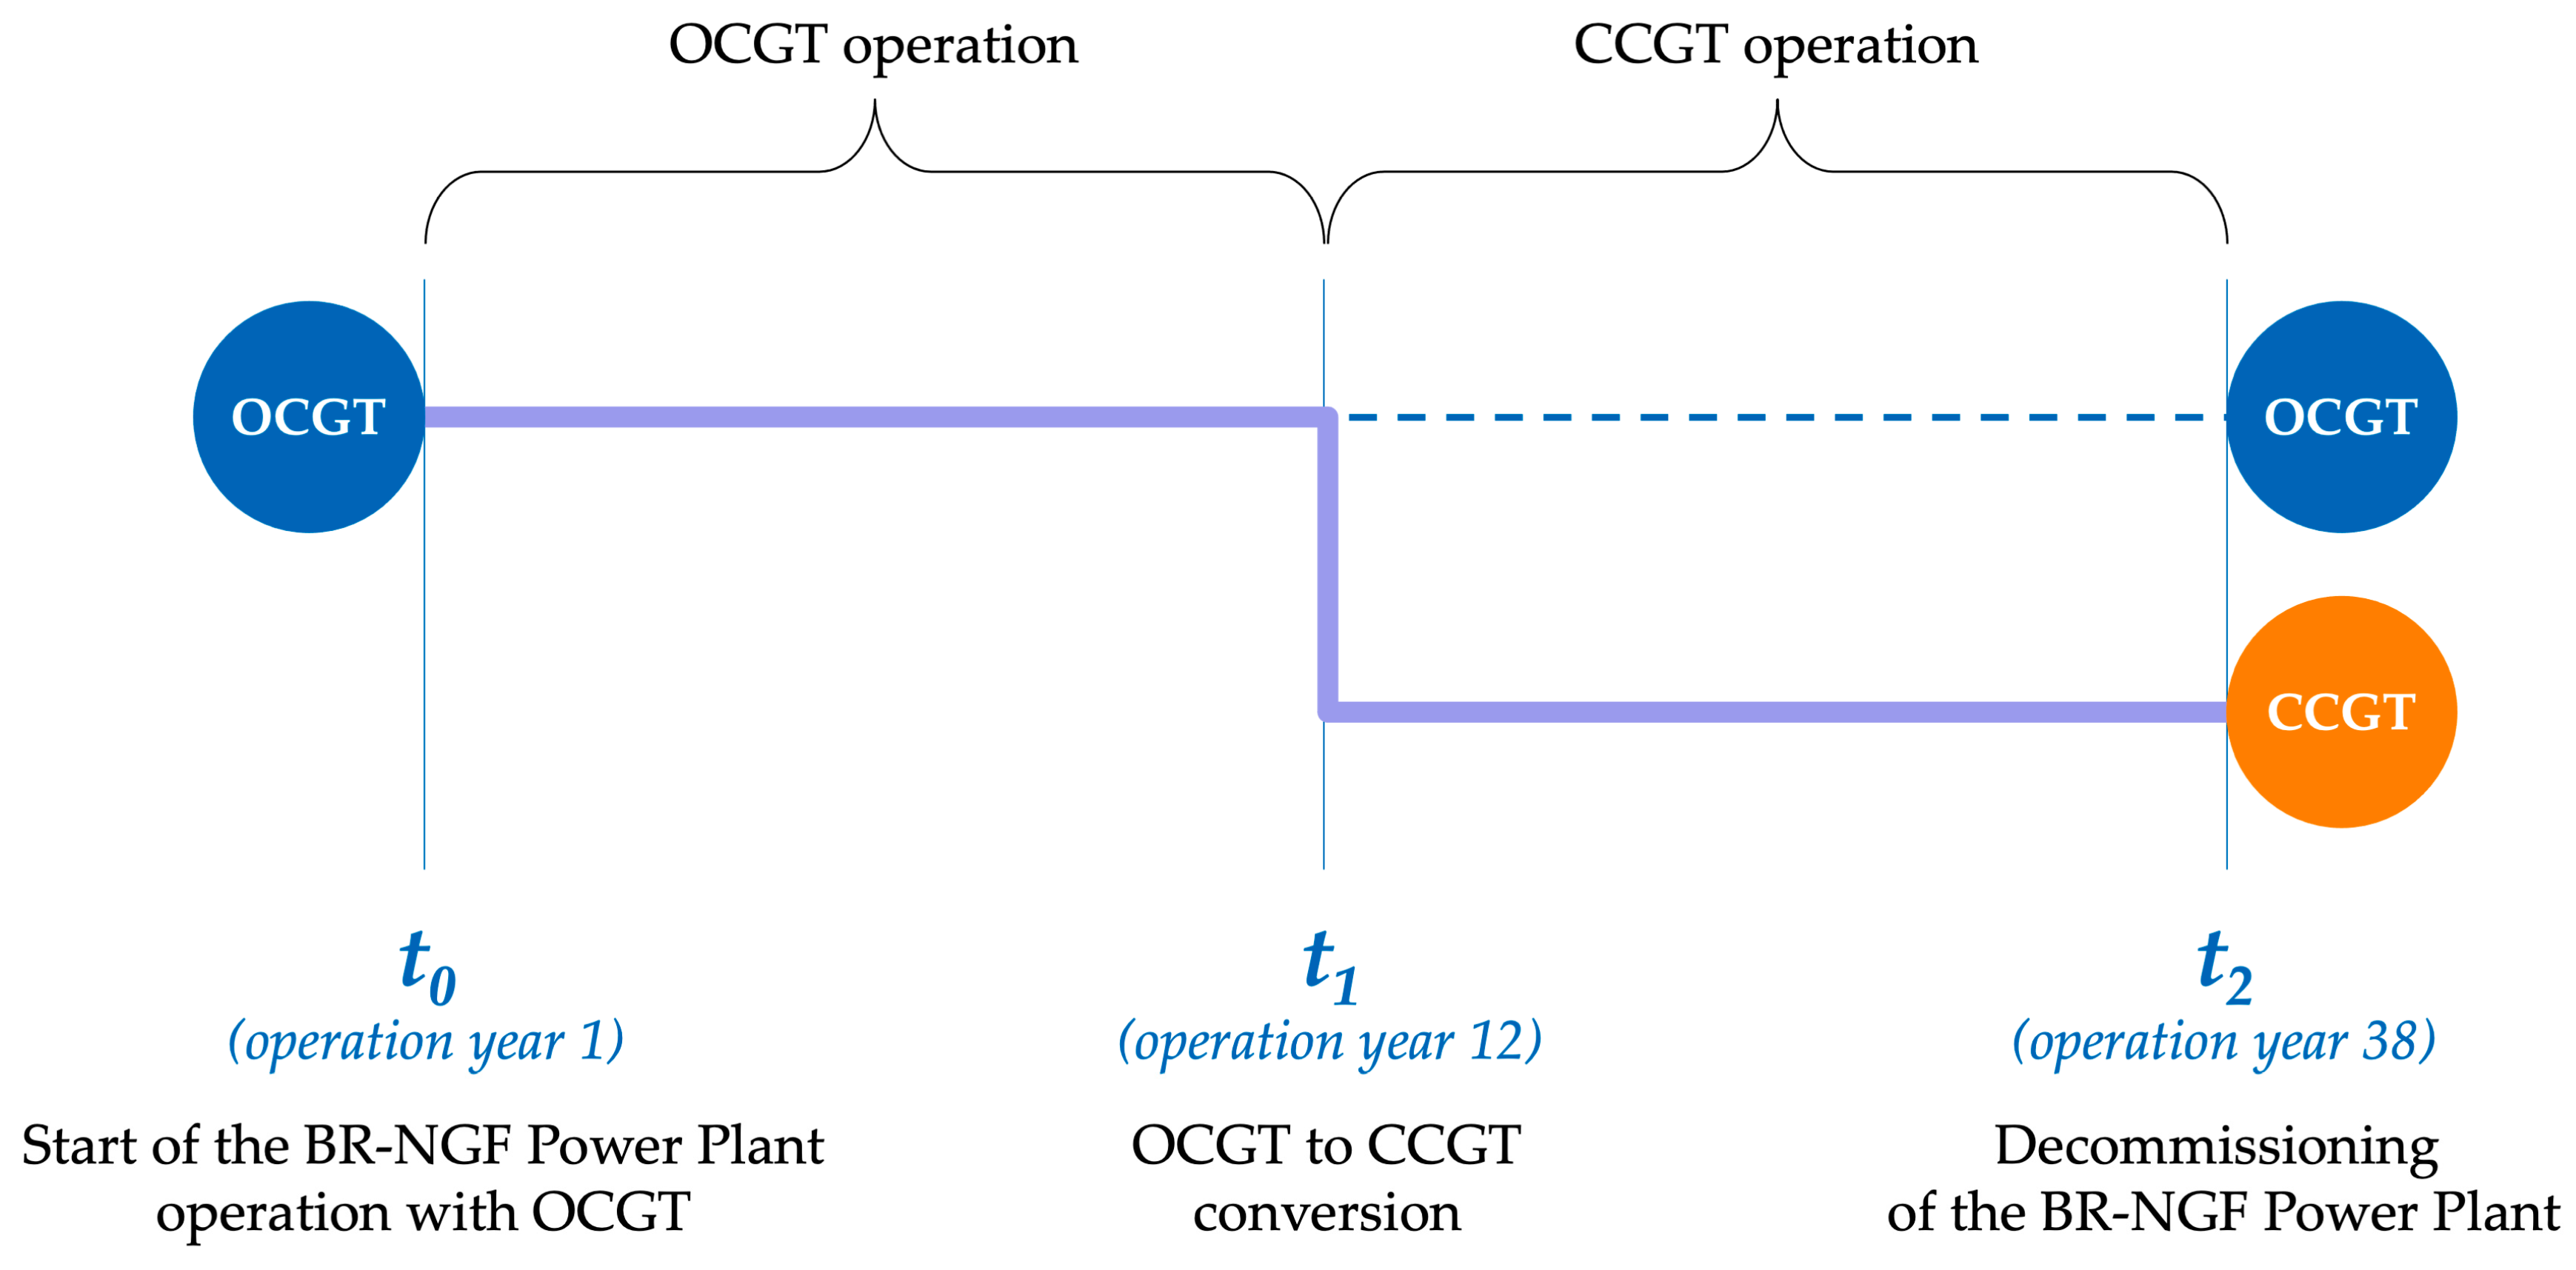
2.3.2. Electricity Generation Scenarios
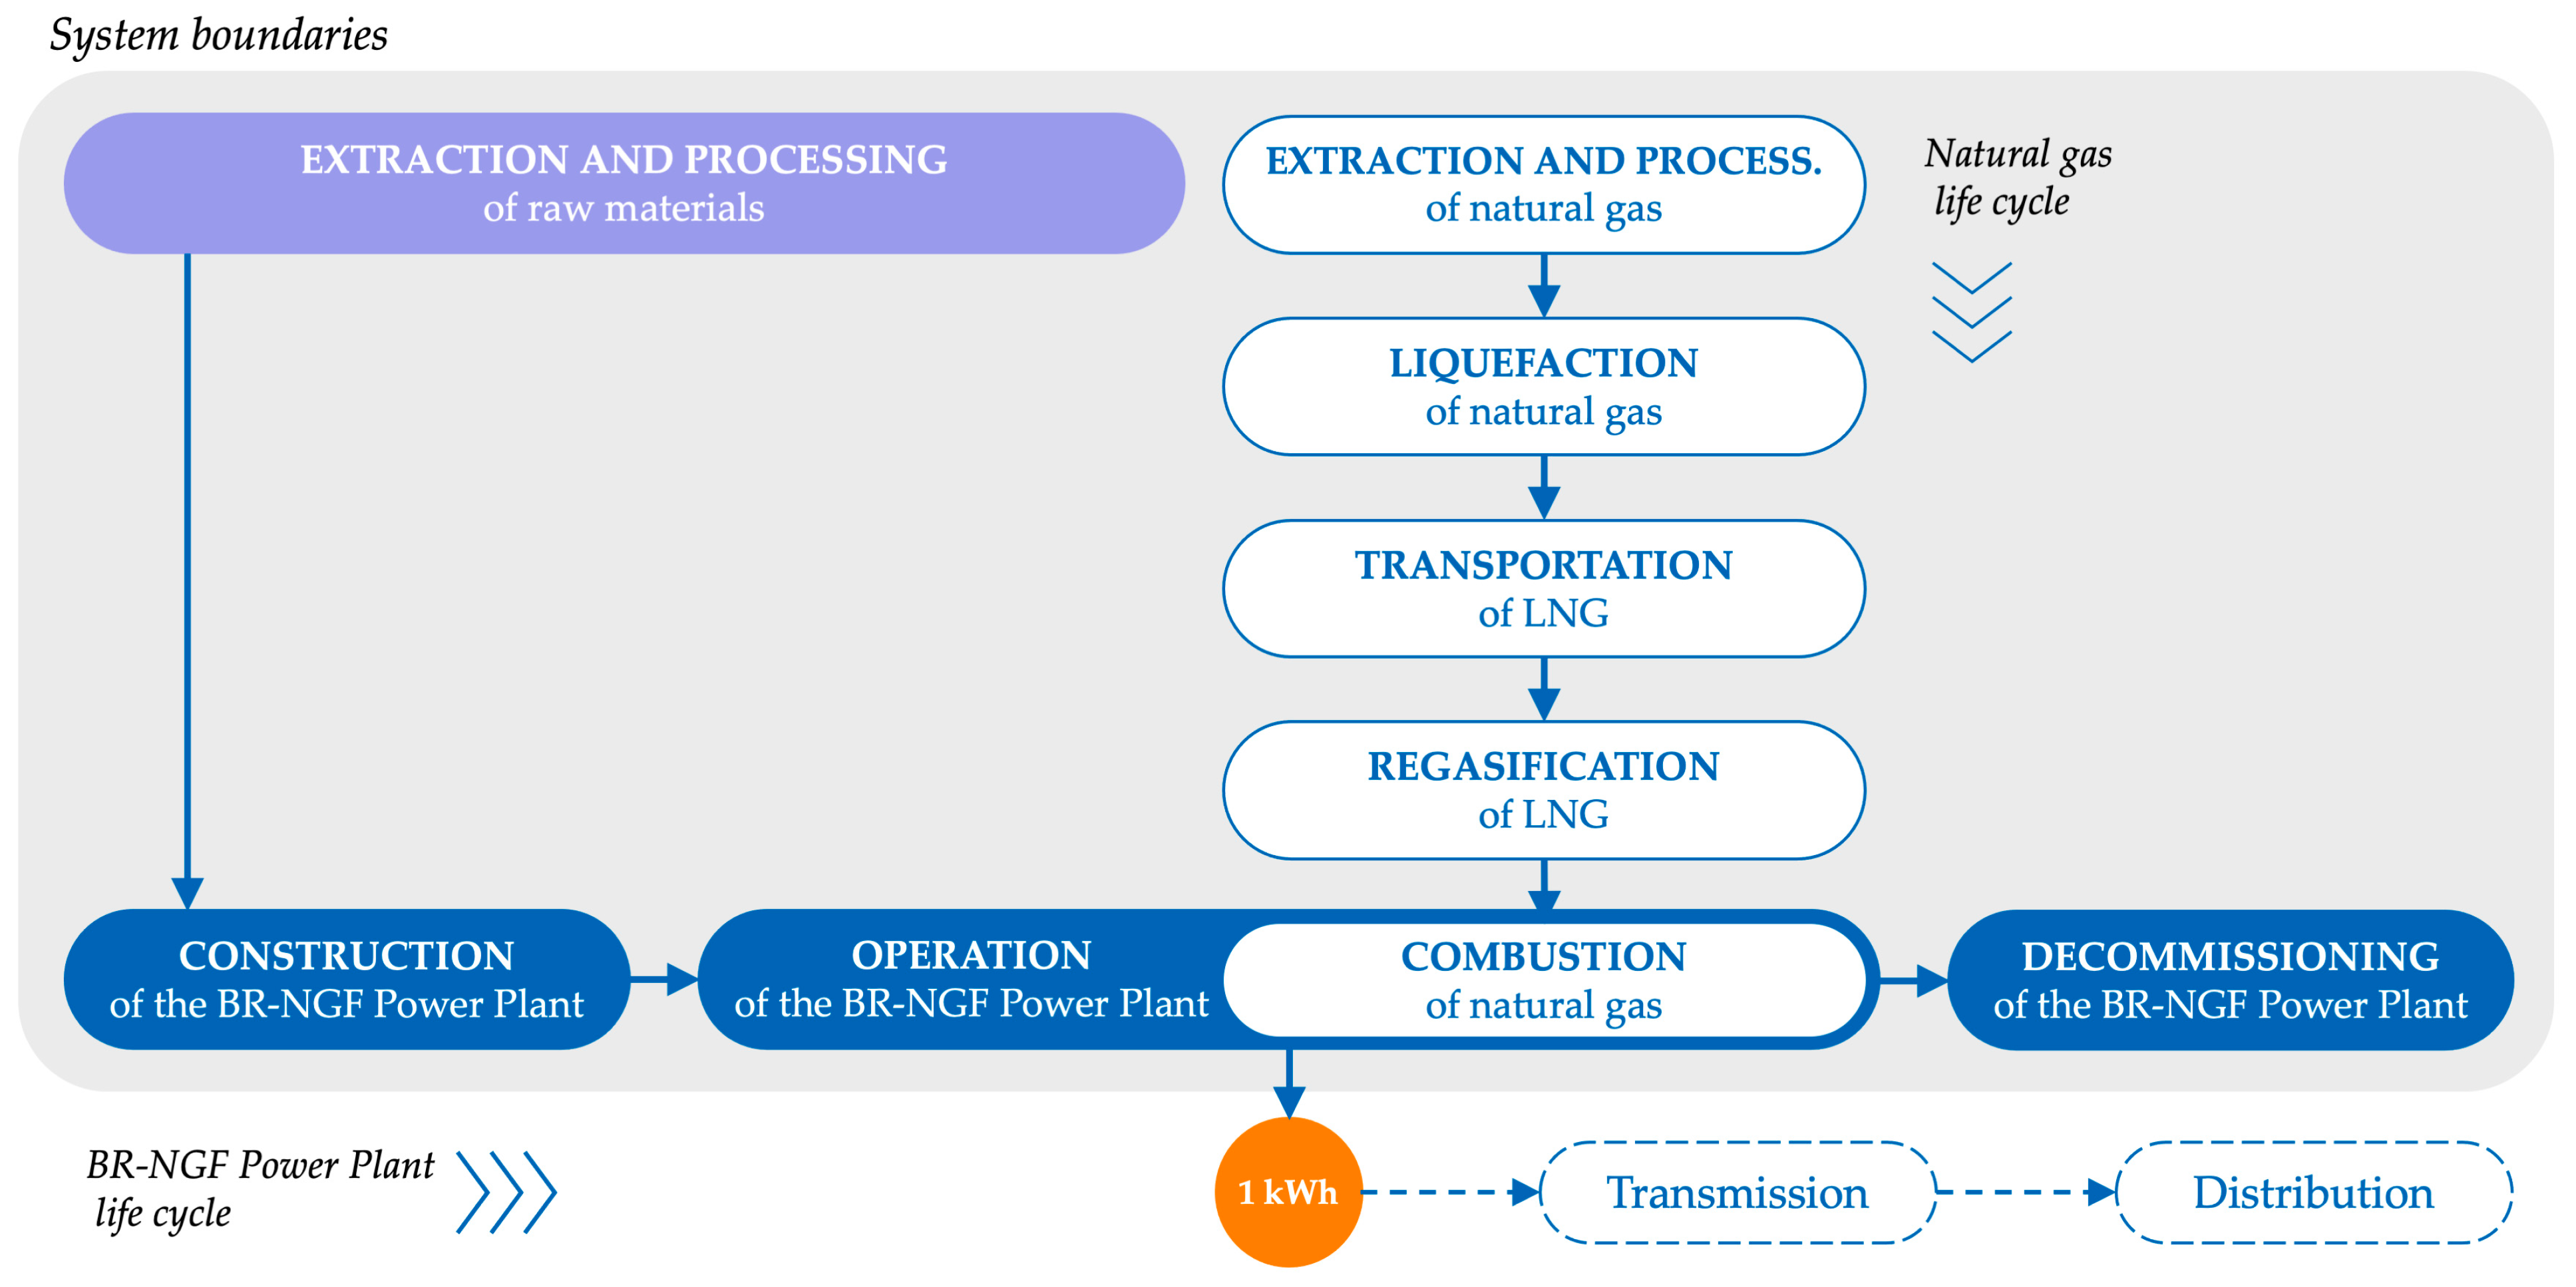
2.3.3. Life Cycle Inventory
3. Results and Discussion
3.1. Life Cycle Impact Assessment
3.2. Interpretation
3.2.1. Analysis of Relevant Issues
3.2.2. Sensitivity Analysis
3.2.3. Limitations
4. Conclusions
Author Contributions
Funding
Data Availability Statement
Acknowledgments
Conflicts of Interest
References
- Yaman, C. A Review on the Process of Greenhouse Gas Inventory Preparation and Proposed Mitigation Measures for Reducing Carbon Footprint. Gases 2024, 4, 18–40. [Google Scholar] [CrossRef]
- IPCC. IPCC Fifth Assessment Report: Climate Change 2014 (AR5)—Synthesis Report; IPCC: Geneva, Switzerland, 2014. [Google Scholar]
- Matos, D.; Lassio, J.G.; Castelo Branco, D.; Pereira Júnior, A.O. Perspectives for Expansion of Concentrating Solar Power (CSP) Generation Technologies in Brazil. Energies 2022, 15, 9286. [Google Scholar] [CrossRef]
- Egging-Bratseth, R. A Techno-Economic Perspective on Natural Gas and Its Value Chain. Gases 2020, 1, 1–18. [Google Scholar] [CrossRef]
- Ghosh, S.; Majumder, R.; Chatterjee, B. Natural Gas Matters: LNG and India’s Quest for Clean Energy. Gases 2024, 4, 1–17. [Google Scholar] [CrossRef]
- Brazil. The Ten-Yeat Energy Expansion Plan 2031; Ministry of Mines and Energy: Brasília, Brazil, 2022.
- IEA. World Energy Outlook 2023; IEA: Paris, France, 2023. [Google Scholar]
- Brazil. Brazilian Energy Balance 2023; Ministry of Mines and Energy: Brasília, Brazil, 2024.
- Zarei, M.; Cherif, A.; Khaligh, V.; Yoon, T.; Lee, C.-J. Techno-Economic Assessment of Amine-Based CO2 Capture Process at Coal-Fired Power Plants: Uncertainty Analysis. ACS Sustain. Chem. Eng. 2023, 11, 14901–14912. [Google Scholar] [CrossRef]
- IEA. World Energy Outlook 2019; IEA: Paris, France, 2019. [Google Scholar]
- Islam, M.M.; Hasanuzzaman, M.; Pandey, A.K.; Rahim, N.A. Modern Energy Conversion Technologies. In Energy for Sustainable Development; Elsevier: Amsterdam, The Netherlands, 2020; pp. 19–39. [Google Scholar]
- Elias, R.S.; Wahab, M.I.M.; Fang, L. Retrofitting Carbon Capture and Storage to Natural Gas-Fired Power Plants: A Real-Options Approach. J. Clean. Prod. 2018, 192, 722–734. [Google Scholar] [CrossRef]
- Lassio, J.G.; Magrini, A.; Castelo Branco, D. Life Cycle-Based Sustainability Indicators for Electricity Generation: A Systematic Review and a Proposal for Assessments in Brazil. J. Clean. Prod. 2021, 311, 127568. [Google Scholar] [CrossRef]
- Barros, M.V.; Piekarski, C.M.; De Francisco, A.C. Carbon Footprint of Electricity Generation in Brazil: An Analysis of the 2016–2026 Period. Energies 2018, 11, 1412. [Google Scholar] [CrossRef]
- La Picirelli de Souza, L.; Eduardo Silva Lora, E.; Rajabi Hamedani, S.; Escobar Palacio, J.C.; Cioccolanti, L.; Villarini, M.; Comodi, G.; Colantoni, A. Life Cycle Assessment of Prospective Scenarios Maximizing Renewable Resources in the Brazilian Electricity Matrix. Renew. Energy Focus 2023, 44, 1–18. [Google Scholar] [CrossRef]
- Sakamoto, H.; Maciel, M.; Henrique Cardoso, F.; Kulay, L. Energy and Environmental Contributions for Future Natural Gas Supply Planning in Brazil. Energy Technol. 2020, 8, 1900976. [Google Scholar] [CrossRef]
- Darabkhani, H.G.; Varasteh, H.; Bazooyar, B. Oxyturbine Power Cycles and Gas-CCS Technologies. In Carbon Capture Technologies for Gas-Turbine-Based Power Plants; Elsevier: Amsterdam, The Netherlands, 2023; pp. 39–74. [Google Scholar]
- ETSAP. Gas-Fired Power. ETSAP. 2012. Available online: https://iea-etsap.org/E-TechDS/PDF/E02-gas_fired_power-GS-AD-gct_FINAL.pdf (accessed on 3 September 2024).
- MME. Supplementary Information to the Monthly Monitoring Bulletin of the Natural Gas Industry; Ministry of Mines and Energy: Brasília, Brazil, 2023.
- IEMA. Thermoelectricity in Focus: Use of Water in Thermoelectric Power Plants; IEMA: São Paulo, Brazil, 2016. [Google Scholar]
- Arrieta, F.R.P.; Lora, E.E.S. Influence of Ambient Temperature on Combined-Cycle Power-Plant Performance. Appl. Energy 2005, 80, 261–272. [Google Scholar] [CrossRef]
- Junior, N.P.; Gazoli, J.R.; Sete, A.; Velasquez, R.M.G.; Hunt, J.D.; Bindemann, F.T.; Wounnsoscky, W.; de Freitas, M.A.V.; de Ávila Condessa, G.; Ismail, K.A.R. Climate Impact on Combined Cycle Thermoelectric Power Plant in Hot and Humid Regions. Results Eng. 2023, 19, 101342. [Google Scholar] [CrossRef]
- Rosenbaum, R.K.; Hauschild, M.Z.; Boulay, A.-M.; Fantke, P.; Laurent, A.; Núñez, M.; Vieira, M. Life Cycle Impact Assessment. In Life Cycle Assessment; Hauschild, M., Rosenbaum, R., Olsen, S., Eds.; Springer International Publishing: Cham, Switzerland, 2018; pp. 167–270. [Google Scholar]
- Laurent, A.; Espinosa, N.; Hauschild, M.Z. LCA of Energy Systems. In Life Cycle Assessment; Hauschild, M., Rosenbaum, R., Olsen, S., Eds.; Springer International Publishing: Cham, Switzerland, 2018; pp. 633–668. ISBN 9783319564753. [Google Scholar]
- ISO 14067:2013; Greenhouse Gases—Carbon Footprint of Products—Requirements and Guidelines for Quantification and Communication. International Organization for Standardization: Geneva, Switzerland, 2013.
- ONS. Operation History—Power Generation. 2024. Available online: https://www.ons.org.br/Paginas/resultados-da-operacao/historico-da-operacao/geracao_energia.aspx (accessed on 3 September 2024).
- CEPEL. EMISFERA Platform—Emissions Calculation and Analysis Tool; CEPEL: Rio de Janeiro, Brazil, 2018. [Google Scholar]
- Gommes, D.; Watterson, J. Chapter 2: Stationary Combustion 2006 IPCC Guidelines for National Greenhouse Gas Inventories 2.1 Volume 2: Energy 2.2; IPCC: Geneva, Switzerland, 2006. [Google Scholar]
- Wernet, G.; Bauer, C.; Steubing, B.; Reinhard, J.; Moreno-Ruiz, E.; Weidema, B. The Ecoinvent Database Version 3 (Part I): Overview and Methodology. Int. J. Life Cycle Assess. 2016, 21, 1218–1230. [Google Scholar] [CrossRef]
- Meng, F.; Dillingham, G. Life Cycle Analysis of Natural Gas-Fired Distributed Combined Heat and Power versus Centralized Power Plant. Energy Fuels 2018, 32, 11731–11741. [Google Scholar] [CrossRef]
- Abdulsamad, A.; George-Ikoli, T. Strengthening Methane Emissions Reduction in Nigeria’s Oil and Gas Sector. 2024. Available online: https://resourcegovernance.org/sites/default/files/2024-07/strengthening-methane-emissions-reduction-in-nigeria%E2%80%99s-oil-and-gas-sector-6552.pdf (accessed on 3 September 2024).
- ANP. Consolidated Production Report 2021: Oil and Natural Gas Production; ANP: Rio de Janeiro, Brazil, 2022. [Google Scholar]
- Turconi, R.; Boldrin, A.; Astrup, T. Life Cycle Assessment (LCA) of Electricity Generation Technologies: Overview, Comparability and Limitations. Renew. Sustain. Energy Rev. 2013, 28, 555–565. [Google Scholar] [CrossRef]
- Spath, P.; Mann, M. Life Cycle Assessment of a Natural Gas Combined—Cycle Power Generation System; National Renewable Energy Lab.(NREL): Golden, CO, USA, 2000.


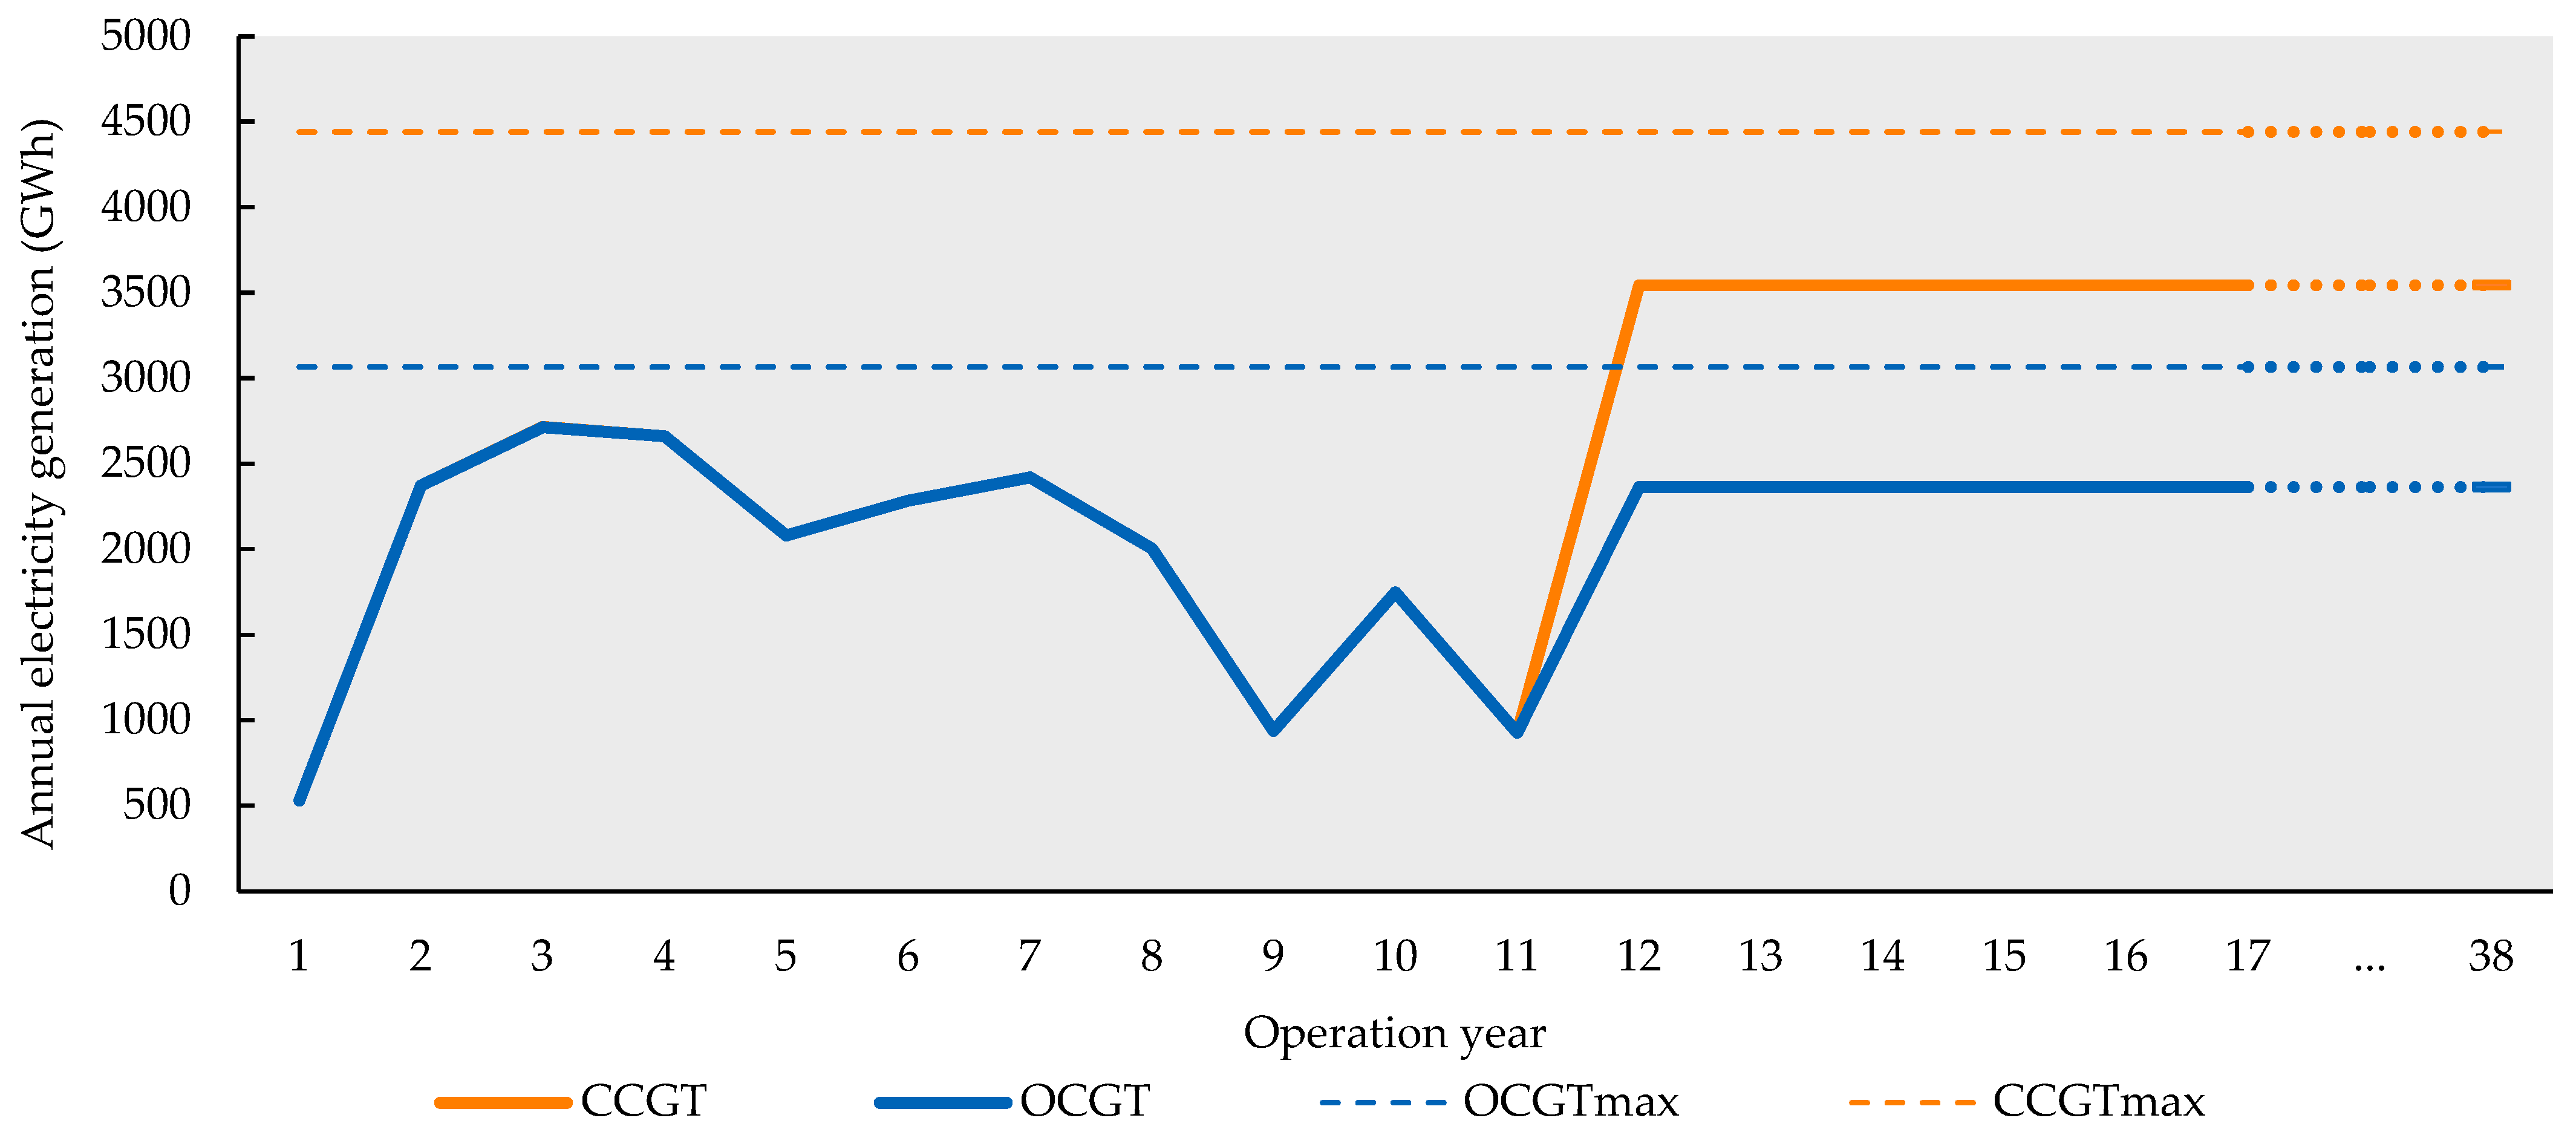
| Operation Year | Electricity Generation (MWh) [26] | Natural Gas Consumption (m3) [27] | GHG Emissions (tCO2) [28] |
|---|---|---|---|
| Year 1 | 530,094 | 147,601,681 | 305,084 |
| Year 2 | 2,371,448 | 695,587,898 | 1,437,738 |
| Year 3 | 2,714,770 | 850,714,133 | 1,758,375 |
| Year 4 | 2,659,809 | 789,345,600 | 1,631,530 |
| Year 5 | 2,079,994 | 626,539,060 | 1,295,018 |
| Year 6 | 2,284,152 | 688,440,211 | 1,422,964 |
| Year 7 | 2,419,366 | 721,607,550 | 1,491,519 |
| Year 8 | 2,003,096 | 600,464,564 | 1,241,124 |
| Year 9 | 936,981 | 282,518,539 | 583,949 |
| Year 10 | 1,746,734 | 515,911,731 | 1,066,358 |
| Year 11 | 925,087 | 241,135,360 | 498,412 |
| Inputs/Outputs | Unit | OCGT | CCGT | Source |
|---|---|---|---|---|
| Construction stage | ||||
| Products | ||||
| BR-NGF power plant | un. | 1 | 1 | – |
| Material inputs | ||||
| Reinforcing steel | kg | 1,925,000.00 | 9,383,000.00 | Adapted from the Ecoinvent 3.5 database [29] |
| Stainless steel | kg | – | 2,313,000.00 | |
| Cast alloy aluminium | kg | 84,000.00 | 96,928.00 | |
| Wrought alloy aluminiun | kg | 178,500.00 | 205,972.00 | |
| Concrete | m3 | 6358.33 | 1351.67 | |
| Ceramic tile | kg | – | 5397.00 | |
| Chromium | kg | – | 1254.16 | |
| Cobalt | kg | – | 925.20 | |
| Copper | kg | 262,500.00 | 302,900.00 | |
| Nickel | kg | – | 8095.50 | |
| Low density polyethylene (LDPE) | kg | 525,000.00 | 1,145,500.00 | |
| Stone wool | kg | 525,000.00 | 323,100.00 | |
| Energy inputs | ||||
| Electricity | kWh | 826,000.00 | 3,054,700.00 | Adapted from the Ecoinvent 3.5 database [29] |
| Diesel | MJ | 40,600,000.00 | 149,580,000.00 | |
| Heat | MJ | 38,570,000.00 | 142,101,000.00 | |
| Emissions to air | ||||
| CO2 fossil | kg | 2,963,800.00 | 10,919,340.00 | Adapted from the Ecoinvent 3.5 database [29] |
| CH4 fossil | kg | 152.25 | 560.93 | |
| N2O | kg | 113.68 | 418.82 | |
| Operation stage | ||||
| Products | ||||
| Electricity | MWh | 86,844,924.00 | 119,931,620.00 | ONS [26] |
| Material inputs | ||||
| Natural gas | m3 | 2.70 × 10¹⁰ | 2.70 × 10¹⁰ | Emisfera [27] |
| Emission to air | ||||
| CO2 fossil | t | 53,845,141.00 | 53,845,141.00 | Estimated based on IPCC [28] |
| CH4 fossil | t | 951 | 951 | |
| N2O | t | 95 | 95 |
| Inputs/Outputs | Unit | OCGT/CCGT | Source |
|---|---|---|---|
| Extraction and processing stage | |||
| Products | Adapted from the Ecoinvent 3.5 database [29] | ||
| Natural gas | m3 | 1.053 | |
| Energy inputs | |||
| Natural gas (sweet gas) | MJ | 1.203 | |
| Emissions to air | |||
| Fugitive CH4 emissions | m3 | 0.019 | |
| Liquefaction stage | |||
| Products | Adapted from the Ecoinvent 3.5 database [29] | ||
| LNG | m3 | 1.025 | |
| Material inputs | |||
| Natural gas | m3 | 1.053 | |
| Energy inputs | |||
| Natural gas | MJ | 4.118 | |
| Outputs | |||
| CO2 fossil | kg | 2.306 | |
| CH4 fossil | kg | 7.001 × 10⁻⁵ | |
| N2O | kg | 8.236 × 10⁻⁵ | |
| Transportation stage | |||
| Products | Adapted from the Ecoinvent 3.5 database [29] | ||
| Transported LNG | tkm | 4.831 | |
| Energy inputs | |||
| Heavy fuel oil | MJ | 0.328 | |
| Natural gas | m3 | 0.021 | |
| Emission to air | |||
| CO2 fossil | kg | 0.042 | |
| CH4 fossil | kg | 3.391 × 10⁻⁷ | |
| N2O | kg | 7.536 × 10⁻⁸ | |
| Regasification stage | |||
| Products | Adapted from the Ecoinvent 3.5 database [29] | ||
| Natural gas | m3 | 1.0 | |
| Material inputs | |||
| LNG | m3 | 1.004 | |
| Energy inputs | |||
| Electricity | kWh | 0.012 | |
| Emissions to air | |||
| CO2 fossil | kg | 0.042 | |
| CH4 fossil | kg | 3.391 × 10⁻⁷ |
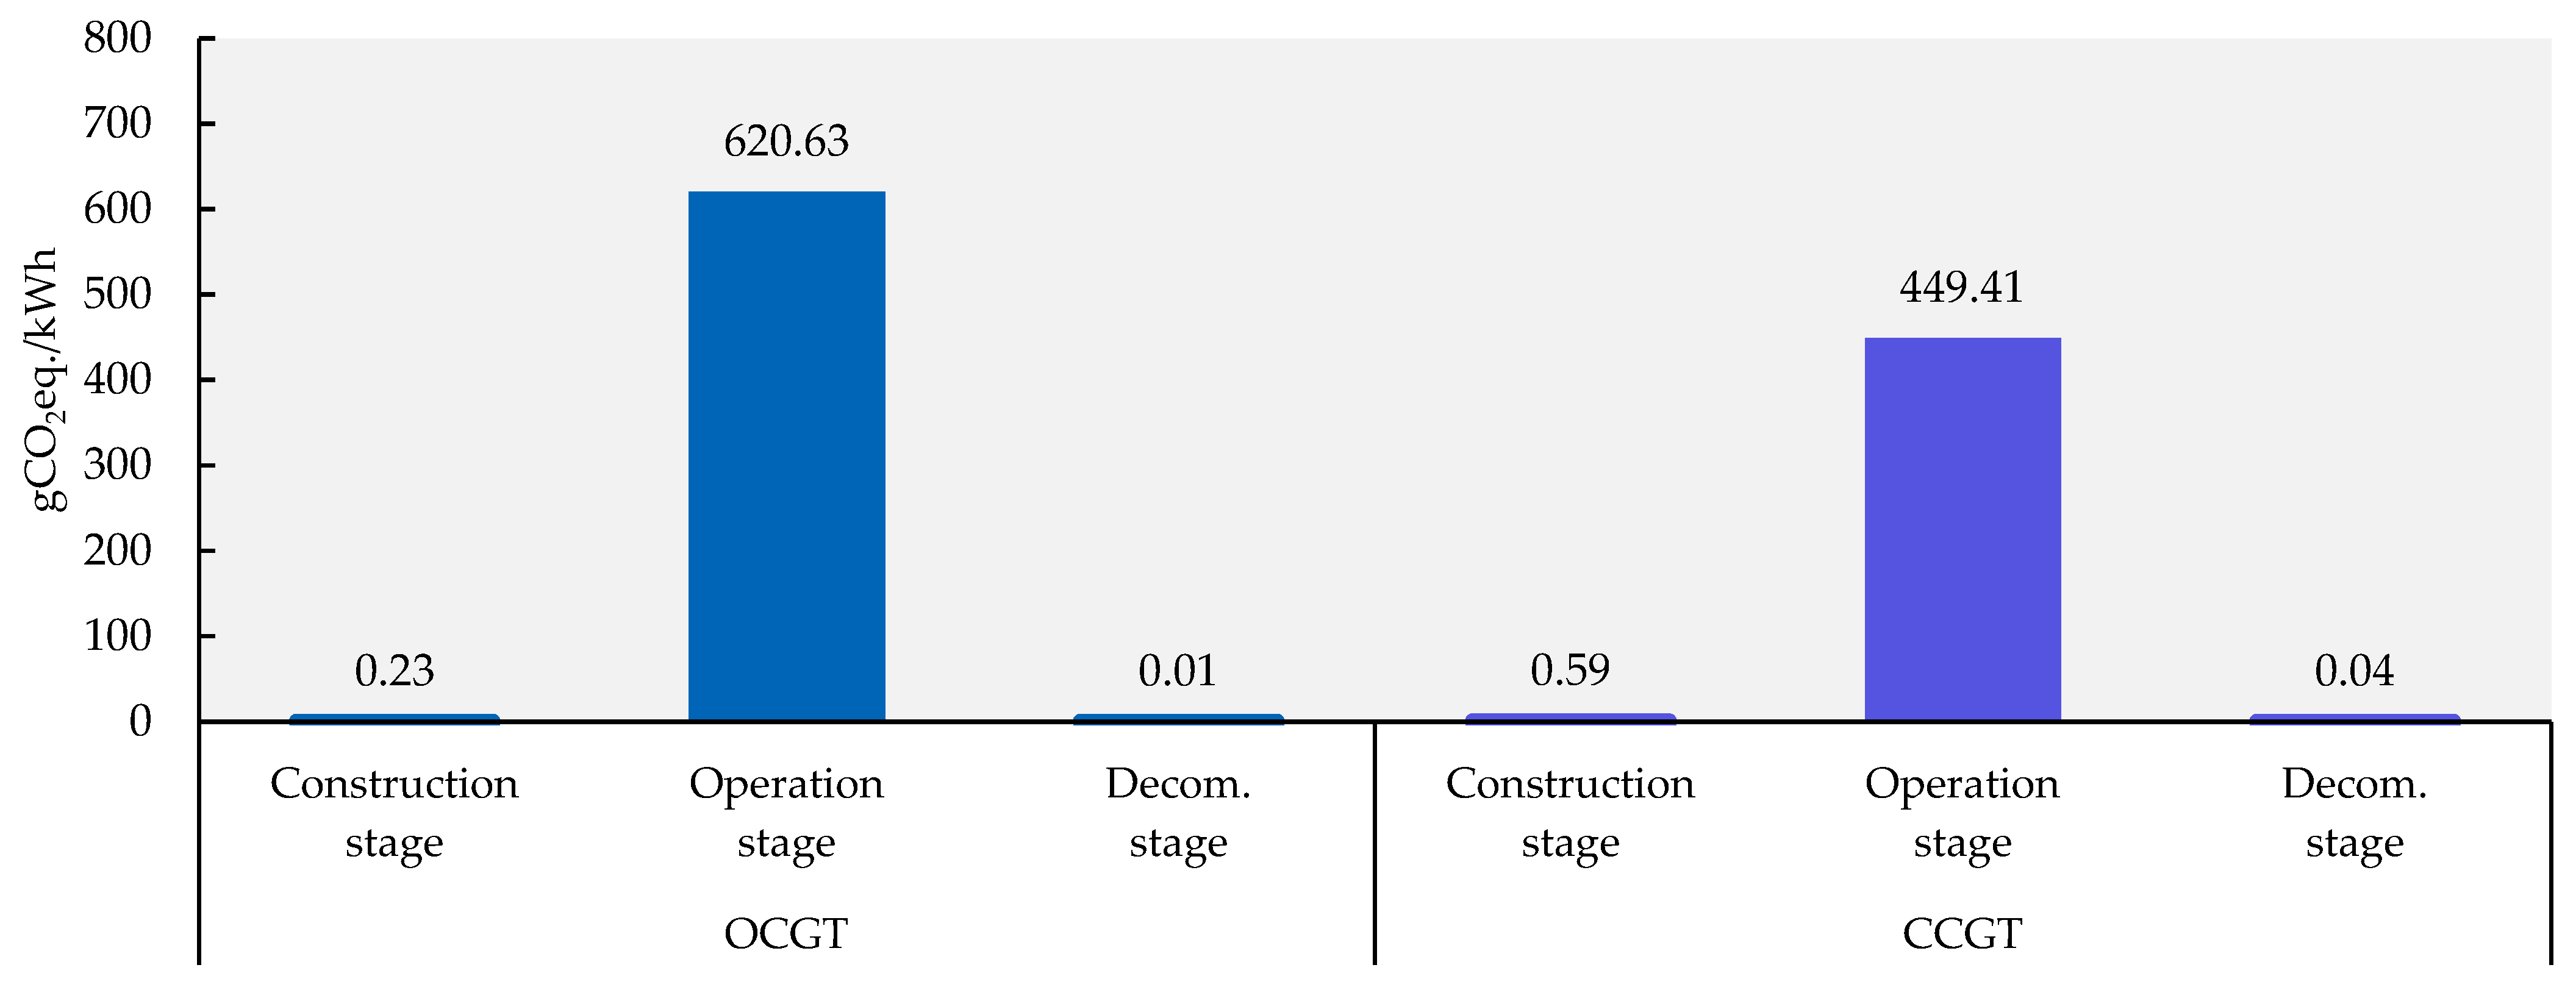
| Inputs/Outputs | OCGT (gCO2eq./kWh) | CCGT (gCO2eq./kWh) |
|---|---|---|
| Construction stage | 0.22771 | 0.58877 |
| Products | ||
| BR-NGF power plant | – | – |
| Material inputs | ||
| Reinforcing steel | 0.04760 | 0.16800 |
| Stainless steel | – | 0.09365 |
| Cast alloy aluminium | 0.00507 | 0.00424 |
| Wrought alloy aluminiun | 0.02550 | 0.02131 |
| Concrete | 0.01648 | 0.00254 |
| Ceramic tile | – | 0.00004 |
| Chromium | – | 0.00029 |
| Cobalt | – | 0.00008 |
| Copper | 0.01206 | 0.01008 |
| Nickel | – | 0.00074 |
| Low density polyethylene (LDPE) | 0.01426 | 0.02253 |
| Stone wool | 0.00832 | 0.00371 |
| Energy inputs | ||
| Electricity | 0.00068 | 0.00183 |
| Diesel | 0.00845 | 0.02183 |
| Heat | 0.05466 | 0.14582 |
| Emissions to air | ||
| CO2 fossil | 0.03413 | 0.09105 |
| CH4 fossil | 5.26×10⁻⁵ | 0.00014 |
| N2O | 0.00035 | 0.00093 |
| Operation stage | 620.63 | 449.41 |
| Products | ||
| Electricity | – | – |
| Material inputs | ||
| Natural gas | – | – |
| Emission to air | ||
| CO2 fossil | 620.01 | 448.97 |
| CH4 fossil | 0.33 | 0.24 |
| N2O | 0.29 | 0.21 |
| Decommissioning stage | 0.014 | 0.035 |
| Inputs/Outputs | OCGT (gCO2eq./kWh) | CCGT (gCO2eq./kWh) |
|---|---|---|
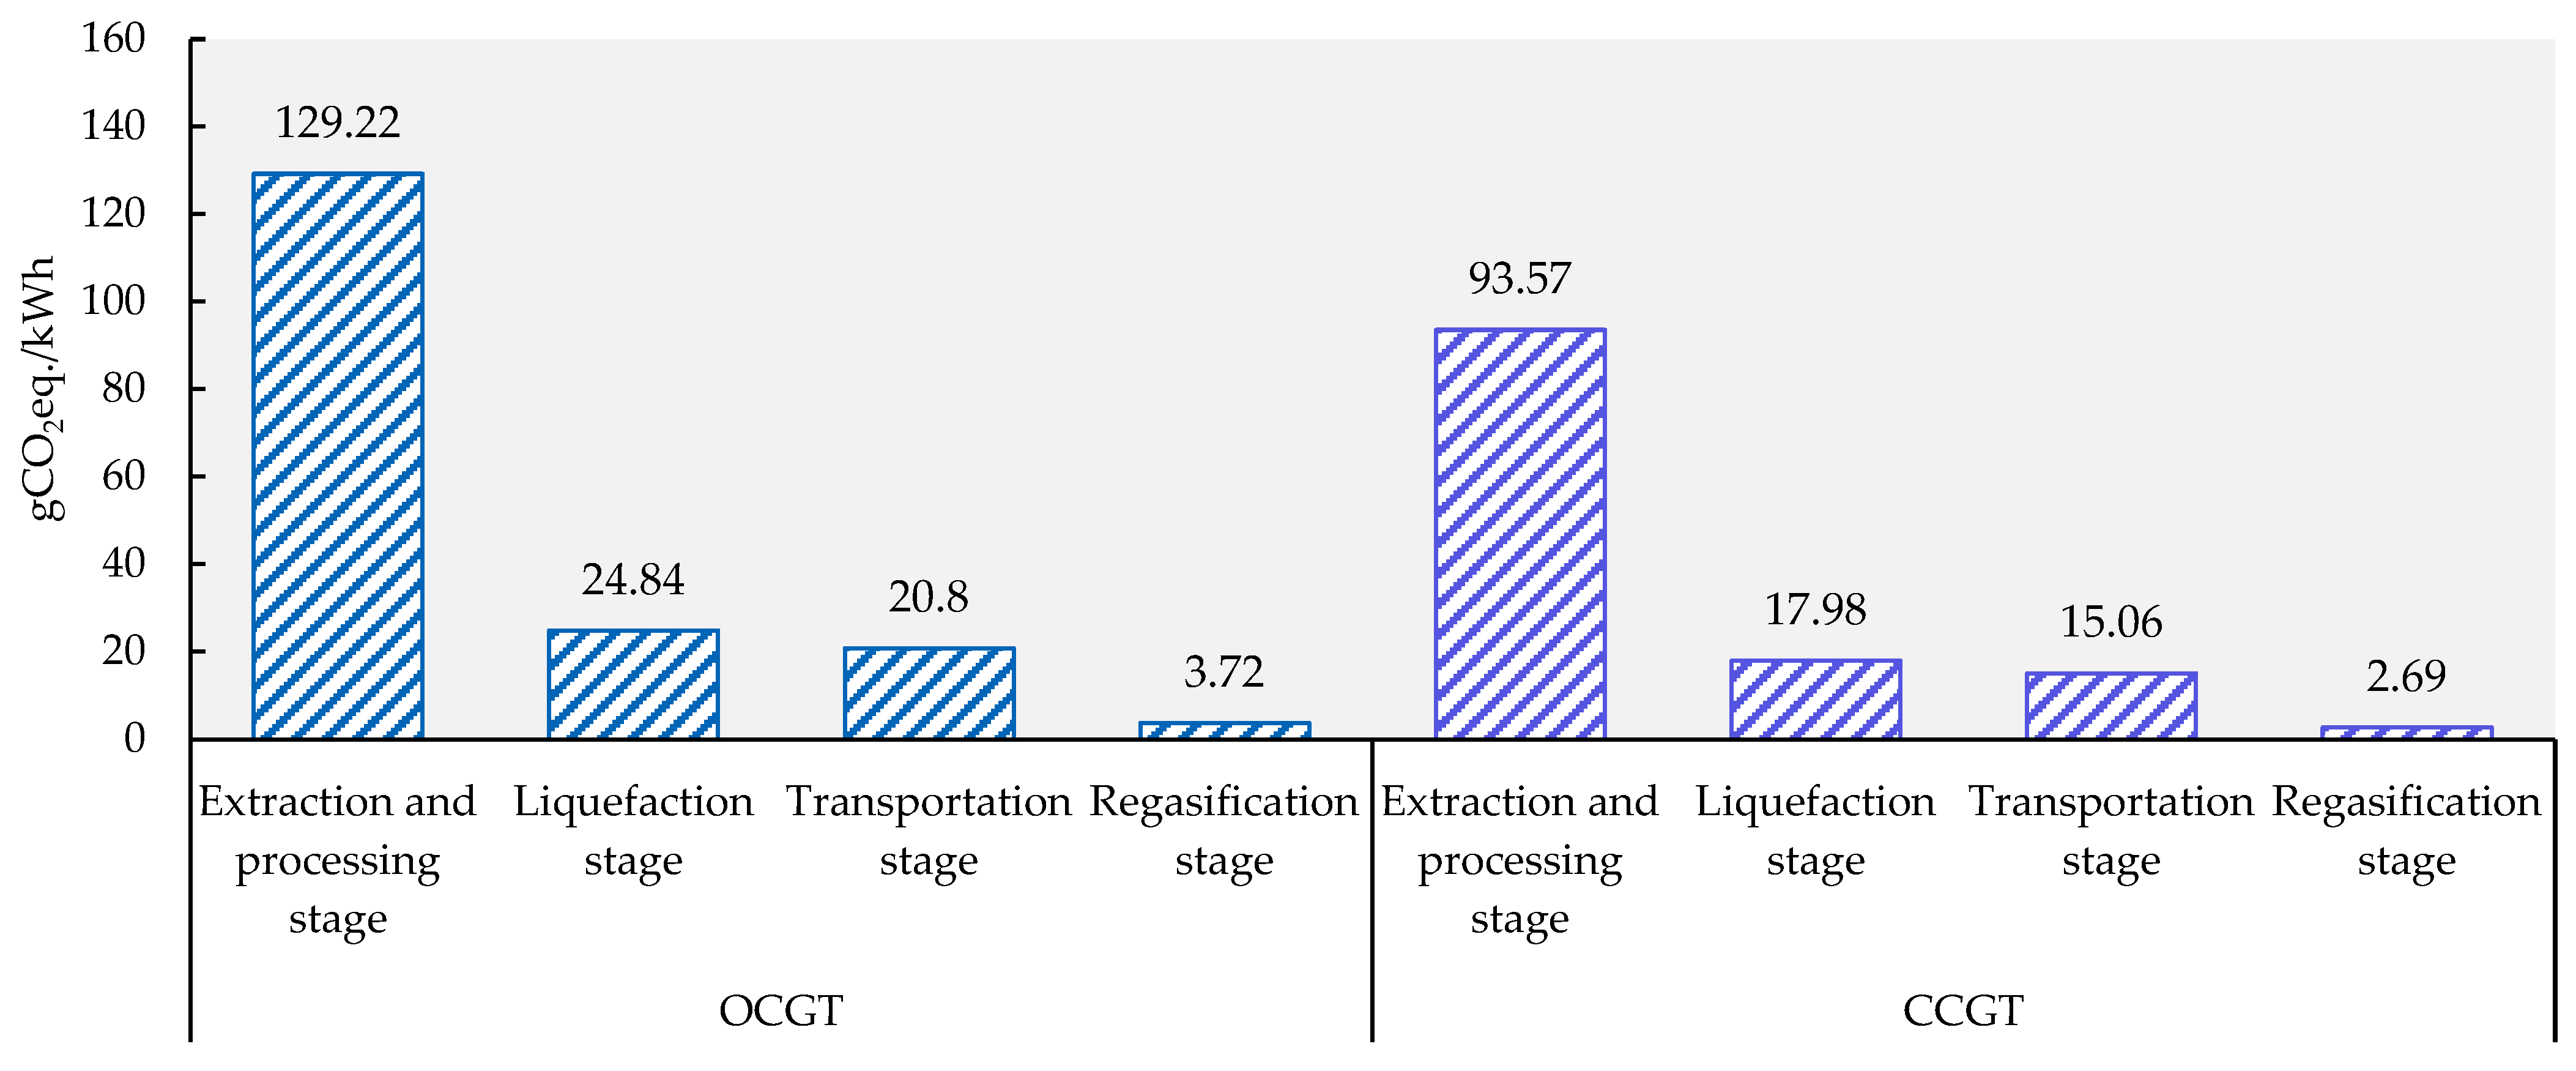
| Extraction and processing stage | 129.22 | 93.57 |
| Products | ||
| Natural gas | – | – |
| Energy inputs | ||
| Natural gas (sweet gas) | 25.49 | 18.46 |
| Emissions to air | ||
| Fugitive CH4 emissions | 103.73 | 75.11 |
| Liquefaction stage | 24.84 | 17.98 |
| Products | ||
| LNG | – | – |
| Material inputs | ||
| Natural gas | – | – |
| Energy inputs | ||
| Natural gas | – | – |
| Outputs | ||
| CO2 fossil | 17.41 | 12.60 |
| CH4 fossil | 0.65 | 0.47 |
| N2O | 6.78 | 4.91 |
| Transportation stage | 20.80 | 15.06 |
| Products | ||
| Transported LNG | – | – |
| Energy inputs | ||
| Heavy fuel oil | 7.73 | 5.60 |
| Natural gas | – | – |
| Emission to air | ||
| CO2 fossil | 13.06 | 9.45 |
| CH4 fossil | 3.16 × 10⁻³ | 2.29 × 10⁻³ |
| N2O | 0.01 | 4.50 × 10⁻³ |
| Regasification stage | 3.72 | 2.69 |
| Products | ||
| Natural gas | – | – |
| Material inputs | ||
| LNG | – | – |
| Energy inputs | ||
| Electricity | 0.27 | 0.19 |
| Emissions to air | ||
| CO2 fossil | 2.80 | 2.03 |
| CH4 fossil | 0.65 | 0.47 |
Disclaimer/Publisher’s Note: The statements, opinions and data contained in all publications are solely those of the individual author(s) and contributor(s) and not of MDPI and/or the editor(s). MDPI and/or the editor(s) disclaim responsibility for any injury to people or property resulting from any ideas, methods, instructions or products referred to in the content. |
© 2024 by the authors. Licensee MDPI, Basel, Switzerland. This article is an open access article distributed under the terms and conditions of the Creative Commons Attribution (CC BY) license (https://creativecommons.org/licenses/by/4.0/).
Share and Cite
Matos, D.; Lassio, J.G.; Garcia, K.C.; Raupp, I.; Medeiros, A.M.; Abreu, J.L.S. The Impact of Retrofitting Natural Gas-Fired Power Plants on Carbon Footprint: Converting from Open-Cycle Gas Turbine to Combined-Cycle Gas Turbine. Gases 2024, 4, 310-326. https://doi.org/10.3390/gases4030018
Matos D, Lassio JG, Garcia KC, Raupp I, Medeiros AM, Abreu JLS. The Impact of Retrofitting Natural Gas-Fired Power Plants on Carbon Footprint: Converting from Open-Cycle Gas Turbine to Combined-Cycle Gas Turbine. Gases. 2024; 4(3):310-326. https://doi.org/10.3390/gases4030018
Chicago/Turabian StyleMatos, Denise, João Gabriel Lassio, Katia Cristina Garcia, Igor Raupp, Alexandre Mollica Medeiros, and Juliano Lucas Souza Abreu. 2024. "The Impact of Retrofitting Natural Gas-Fired Power Plants on Carbon Footprint: Converting from Open-Cycle Gas Turbine to Combined-Cycle Gas Turbine" Gases 4, no. 3: 310-326. https://doi.org/10.3390/gases4030018
APA StyleMatos, D., Lassio, J. G., Garcia, K. C., Raupp, I., Medeiros, A. M., & Abreu, J. L. S. (2024). The Impact of Retrofitting Natural Gas-Fired Power Plants on Carbon Footprint: Converting from Open-Cycle Gas Turbine to Combined-Cycle Gas Turbine. Gases, 4(3), 310-326. https://doi.org/10.3390/gases4030018