Article

What Types of Animals Should Be in the Future Zoo? Thoughts from United States Residents and Zoo and Aquarium Staff

1
Department of Reproductive and Behavioral Sciences, Saint Louis Zoo, Saint Louis, MO 63110, USA
2
Volunteer, Saint Louis Zoo, Saint Louis, MO 63110, USA
3
Department of Conservation, Management, and Welfare Sciences, Association of Zoos and Aquariums, Silver Spring, MD 20910, USA
4
Department of External Affairs, Association of Zoos and Aquariums, Silver Spring, MD 20910, USA
*
Author to whom correspondence should be addressed.
J. Zool. Bot. Gard. 2024, 5(2), 157-178; https://doi.org/10.3390/jzbg5020011
Submission received: 8 February 2024 / Revised: 25 March 2024 / Accepted: 9 April 2024 / Published: 12 April 2024

Abstract

:
Humans are biased in their preferences for animals, and this may impact the composition of zoological collections. We assessed which kinds of animals the public and zoo professionals want to preserve in zoos for the future and analyzed these lists for previously identified biases and agreement across surveyed groups. We also characterized agreement among the surveyed groups on the roles of zoos and the composition of animal collections. We surveyed people who live in the United States, members of the Association of Zoos and Aquariums (AZA), and AZA zoo and aquarium directors. There was agreement among surveyed groups on the roles of zoos, though some differences existed. Zoo professionals and the public generally agreed on the emphasis on various categories of animals for zoo collections, though some differences were noted. We found evidence of bias towards mammals, charismatic megafauna, and felids across all surveyed groups. Agreement was high between AZA members and directors and moderate between zoo professionals and the public. These results indicate that these groups are generally in agreement about the roles of zoos, how they should compose their animal collections, and what animal species, in particular, should be kept in zoos for the future, allowing zoos to compose their collections to maximize delivery on their mission goals as well as address the preferences of the public.

1. Introduction

‘Popular’ is defined as “liked, enjoyed, or supported by many people” (Cambridge Online Dictionary, 2023). It is well established that attitudes towards particular species or types of animals range from enthusiastic adoration (e.g., for the giant panda, Ailuropoda melanoleuca; [1]) to fear, hatred, or disgust (e.g., for many kinds of reptiles, amphibians, and invertebrates; [2,3,4]). Thus, some animals are more popular than others. A large amount of literature is devoted to identifying these preferences, understanding what characteristics of animals and humans drive such preferences, and exploring methods to shift these preferences. Across many studies, vertebrates are generally more popular than invertebrates, and, within the vertebrates, mammals and birds (but see [5]) are generally more popular than reptiles, amphibians, or fish [2,6,7], though there appear to be exceptions to this rule among many animal groups [7]. For example, butterflies and ladybugs tend to be rather popular [4,6]. Among the mammals, felids are pretty consistently found to be the most popular wildlife species [8,9,10,11], though sometimes they are both admired and feared [12,13]. Primates [10,12,13] and elephants [8,10,14,15] are usually popular as well.
Animal characteristics that drive popularity include ‘charisma’ ([16]; see [17] for a discussion of charisma), aesthetic considerations [2,6,15,18,19,20,21], physical, behavioral, or phylogenetic similarity to humans [15,22,23], conservation status or perceived rarity [2,24,25,26] and endemism [20], roughly in that order by our assessment of the literature. The species’ taxonomic uniqueness, intelligence, and ecological role sometimes drive popularity [2,4,5,15,20,27,28]. Domesticated species tend to be popular [14,23]. Domestic dogs (Canis familiaris) and horses (Equus caballus) are the species most endearing to humans or very near the top of the list [12,13,14,15,23,29].
Human characteristics that correlate with or drive preferences for animals include knowledge of the species, relatability and familiarity with the species [6,10,16,25,30,31], incorporation of the animal or its likeness into cultural beliefs, practices, or traditions, or entities, including the media [2,3,15], and whether humans find the species beneficial, useful, or harmful to themselves [2,4,6,15,20].
Studies of zoo visitors or public opinions about zoo animals corroborate these results. Carr et al. [5] found Jersey residents’ preferences centered around charismatic African animals (e.g., elephants, giraffe), big cats, and mammals in general but also included birds, reptiles, and fish, though these were rarely listed. Amphibians and invertebrates were not mentioned. Using behavioral observations of zoo visitors, Moss and Esson [32] found that mammals were more attractive to visitors than other taxonomic groups. Other studies find that activity levels, body size, the presence of young, aesthetic appeal, intelligence, sociality, rarity, and proximity to or interaction with visitors can drive animal popularity [5,28,32,33,34,35].
Some studies suggest that zoo animal collections themselves mirror some of these trends. A series of studies [18,36,37] found that physical attractiveness, as rated by the general public, and body size of a species were positively correlated with the proportion of zoos keeping the species or the size of the species’ global zoo populations, though the authors suggest there are other reasons for this skew. For example, legal barriers to obtaining animals could inadvertently skew collections. Husbandry expertise or adaptation to conditions in human care could also inadvertently skew collections. Whitworth [28] also found that attendance was positively correlated with the popularity of a zoo’s collection. As seen in other studies, the most attractive animal characteristics were active, easy to see, brightly colored, or otherwise aesthetically pleasing, intelligent, social, or rare.
For many people, visiting a zoo is their only opportunity to experience exotic wildlife directly [4,38], and there is high public interest in visiting zoos [39]. Zoos depend on visitors for financial support for basic operations and to support conservation and education objectives [38,40,41,42]. Zoos and aquariums that are members of the World Association of Zoos and Aquariums (WAZA) receive more than 700 million visitors per year and spend USD 350 million per year on wildlife conservation activities [43] with substantial conservation impact [44]. Thus, it is critical that zoos understand what experiences interest visitors and that they design their collections so that they can better achieve their conservation mission through increased revenue and attendance [5,28,41,45,46,47].
To assess animal popularity in the context of how zoos and aquariums (hereafter ‘zoos’) might compose their animal collections, we conducted an open-ended survey of people who live in the United States and staff at facilities accredited by the Association of Zoos and Aquariums, asking them what kinds of animals they would like to see in zoos and aquariums in the future. We limited responses to currently extant species. We expected that large, charismatic mammals, and felids in particular, would be more popular than other animals. However, we also predicted popular animals would exist in all major taxonomic groups. Since our survey was largely open-ended, we expected zoo staff to provide more answers than the general public. Still, we expected good general agreement between the surveyed groups in terms of which animals ranked highly.

2. Materials and Methods

2.1. Survey Description and Procedure

This study summarizes results from surveys conducted by the Saint Louis Zoo (STL) and the Association of Zoos and Aquariums (AZA) during 2019. STL purchased a survey audience of a minimum of 1000 U.S. residents (balanced by census and sex, ages 18–99, no income restrictions) using the SurveyMonkey platform. AZA contracted Prime Group LLC, a survey research company, to conduct a survey of a minimum of 1000 U.S. residents (same characteristics as the STL survey). Members of the public who were surveyed received compensation according to terms established by SurveyMonkey and the Prime Group. AZA used SurveyMonkey to survey the 250 directors of AZA-accredited zoos and aquariums and Certified Related Facilities (CRFs), and 7065 individual AZA members. A total of 4137 individuals participated in the surveys. AZA facility directors and individual members received no compensation. The criterion number of responders to the STL public survey was reached over two days (26–27 September 2019), and the AZA public survey reached its criterion number of responders over 11 days (12–23 December 2019). The AZA member survey ran for 22 days (9–31 December 2019), and the AZA director survey ran for 22 days (25 November–17 December 2019). Neither AZA survey had a criterion number of responders required. These surveys were approved by the Saint Louis Zoo Human Subjects Research Committee, which deemed these activities as ‘exempt’ from regulations concerning human research. No identifying information was obtained in the surveys.
All surveys included one central question about what kinds of animals to maintain in zoos for the future, as well as additional questions. The additional questions we created were not the same across all surveys (see Supplementary Table S1 for survey texts) because we were interested in different concepts for different groups and because we were advised to keep the number of questions relatively small. Survey platform experts disagreed on whether the additional questions should come before or after our central question on which animals to maintain in zoos for the future. Thus, some responders saw this question prior to the supplemental questions, while others saw this question after the supplemental questions.
All surveys included a question on the primary roles of zoos where responders could select up to three primary roles for zoos from a list of nine possibilities (biological education, reintroduction, scientific research, creating emotional connections, maintaining sustainable populations, conservation education, supporting field conservation, recreation, none of the above). Percentages of responses for each role were calculated and compared among surveyed groups.
We asked zoo directors, AZA members, and the public to consider how they would compose an animal collection in a zoo by allocating percentages of the collection to various categories of animals, (e.g., endangered animals the public knows and loves, non-endangered animals that are popular with the public, endangered animals that are shy/reclusive/inactive/hard to see; see Supplementary Table S1). Two additional answer choices were available only on the AZA member and director surveys: ‘non-endangered animals the public probably knows little about’ and ‘animals confiscated from the illegal wildlife trade or from private individuals.’ The categories offered were not necessarily mutually exclusive; however, we specifically worded them to highlight features of the animals the responders might consider. On the AZA public survey, the question was intentionally worded differently. Instead of allocating percentages of the collection to the various categories, responders were asked, if they were designing a zoo, what three kinds of animals they would want the facility to place the most attention on having. Thus, this question focused on what the top three categories would be. Responders could choose up to three categories, which were the same categories as in the other surveys. The percentage of the total responses cast in these questions allocated to each answer category was calculated. Though the AZA public data were not directly comparable to the other surveyed groups, the results are presented alongside one another for comparison.
The AZA director’s survey asked, “what are the 5 most important species for your guest experience?”, while the AZA public survey asked, “when you visit a zoo/aquarium you have never been to before what are the top three animals you hope to see?”. We compared the answers to these two questions to assess how well directors’ predictions matched guest preferences. In both surveys, a number of answers tied for last place, garnering one vote each. Instead of selecting one of these answers randomly to assign to the 100th rank, we included all answers in our analyses, leaving 162 entries in the director’s list and 149 entries in the public’s list. In order to gain insight into whether the public allocated their responses to fewer categories of animals compared to directors, we calculated the percentage of the responses captured by the 50 categories that were allocated to the top 10 and top 20 species in each list. We also tabulated how often more semi-generic categories (e.g., ‘primates’, ‘reptile’, ‘bird’, ‘butterfly’) were used by the responders and how many responses these categories got to explore whether public knowledge of specific species is more limited compared to zoo directors. We only considered semi-generic categories, which referred to generally large numbers of species.
In our question about which animals to maintain in zoos for the future, we wanted to capture unguided responses. We did not want to suggest intent for why a species would be chosen, though conservation is somewhat implied if the species is still in zoos in 100 years. Members of the public and zoo directors were allowed to list up to 50 animals or animal types to be maintained, whereas AZA members were allowed to list up to 100 animals. AZA members were allotted more answers because we reasoned that many of the responders would represent animal departments and have greater individual species knowledge than the public or zoo directors.
The instructions for and wording of the main question varied slightly across the three survey groups. Members of the public received the following text; only the italicized text differed across surveys:
“In the following survey you’ll be asked your opinion about the species of animals zoos and aquariums should strive to maintain populations of for the future. You can base your choices on whatever criteria you like (e.g., their conservation status, how attractive they are, how important they are ecologically). You do not have to defend or explain your choices. You can list up to 50 species. You can use common names or scientific names. Please only consider currently living species (no dinosaurs, sorry!). If you do not know the name of a particular species, but you think a member of a similar group of animals should be maintained, you can provide a “group answer.” For example, you could say “a South American monkey,” “a rainforest bird,” “a coral reef fish,” or “2 species of butterflies.” Think of zoo and aquarium visitors one hundred years from now, what species of animals that exist today would you hope zoos and aquariums could maintain so that visitors in the future will be able to see them when they visit a zoo or aquarium?”.
In the AZA member’s survey, the following sentence was included at the beginning of the instructions: “Zoos and aquariums have historically based their individual missions around four goals: recreation, conservation, education and research.” In addition, the wording of the question itself changed to (see italics): “Think of zoos and aquariums one hundred years from now, what species of animals that exist today would you say zoos and aquariums should maintain healthy, robust populations of for the future?”.
AZA facility directors also had the same opening sentence as AZA members, but the question itself was re-worded (see italics) to reflect delivery on zoo missions: “Think of zoos and aquariums one hundred years from now, what species of animals that exist today do you feel should be maintained so that zoos and aquariums in the future will be able to best deliver on their facilities’ missions?”.

2.2. Data Clean-Up and Analysis

We created a master list of all unique answers provided using sorting, edit/find, or macro functions in MS Excel. For a given animal, we converted all answers from plural to singular (e.g., bears to bear), corrected any misspelling, removed any nonsensical or invalid entries (e.g., dinosaurs), and expanded any shortened versions of animal names to the full name (e.g., rhino to rhinoceros). In cases where alternative names exist for animals (e.g., African hunting dog, painted dog), we selected one name and converted all alternative names to the selected name. This resulted in a final list of ‘categories’ of animals provided across all of the surveys, and the survey responses were standardized according to this list. Responses from the STL and AZA public survey were pooled into one public dataset.
Responders could provide varying levels of specificity to their answers. We did not pool any responses into the same category when there was a chance that the response did not refer to exactly the same kind of animal. For example, “lion” was not pooled with “African lion” because there is an Asiatic lion, and a responder could have provided that answer. “Coral reef fish” responses were not pooled with “coral reef species” because the animals in those categories only partially overlap. We only pooled responses at this stage when it was clear through spelling errors or valid multiple names for species (e.g., African wild dog and painted dog) that the answers could be counted together with reasonable certainty. Across the surveys, we identified 3117 unique answers. There was a small percentage (2.85% of public responses, 2.70% of zoo professional responses) of responses that were eliminated because they could not be assigned to any taxonomic group (e.g., “local animals,” “keystone species”). These responses were removed from the analyses.
We generated lists of the top one hundred animals based on the number of responses for each animal. In some cases, multiple answers tied for last place. Instead of randomly selecting which animal would be rank 100, we kept all animals that tied for last place in the list and analyzed these longer lists. Final list length is specified for each question, and the corresponding surveyed group is shown in the results where appropriate, though the lists are referred to as “top 100” lists for ease of reference.
In order to calculate and compare % agreement between lists of animals provided by different survey populations in survey questions, we first reviewed the lists to look for cases in which the two surveyed groups were arguably voting for the same kind of animal (e.g., “elephant, “African elephant” or “Asian elephant”) without being able to easily distinguish the individuals in the categories, and we then subjectively collapsed these into a single category. We then calculated agreement by calculating the percentage of identical categories found on both groups’ top 100 list. The collapsed groupings varied across agreement comparisons because the same answers did not appear in all lists. See Table 1 for the collapsed groupings used in each agreement comparison. In the comparison of director-reported guest priority species vs. the public’s priority species to see, there was one vote for ‘seal/sealion’, which was added to the vote totals for sea lion and seal, but only counted as one case of agreement.
Additional collapsing and linking of some categories could be possible (e.g., “bird”, “native bird”, and “tropical bird”); however, the authors feared this could introduce bias. Thus, the agreement statistics could be considered conservative. We calculated the Spearman correlation between the rankings of identical animal entries in the public’s top 100 list with the rankings obtained from zoo personnel. Statistical analyses were run in SigmaStat 4.0 (Inpixon, Palo Alto, CA, USA).

3. Results

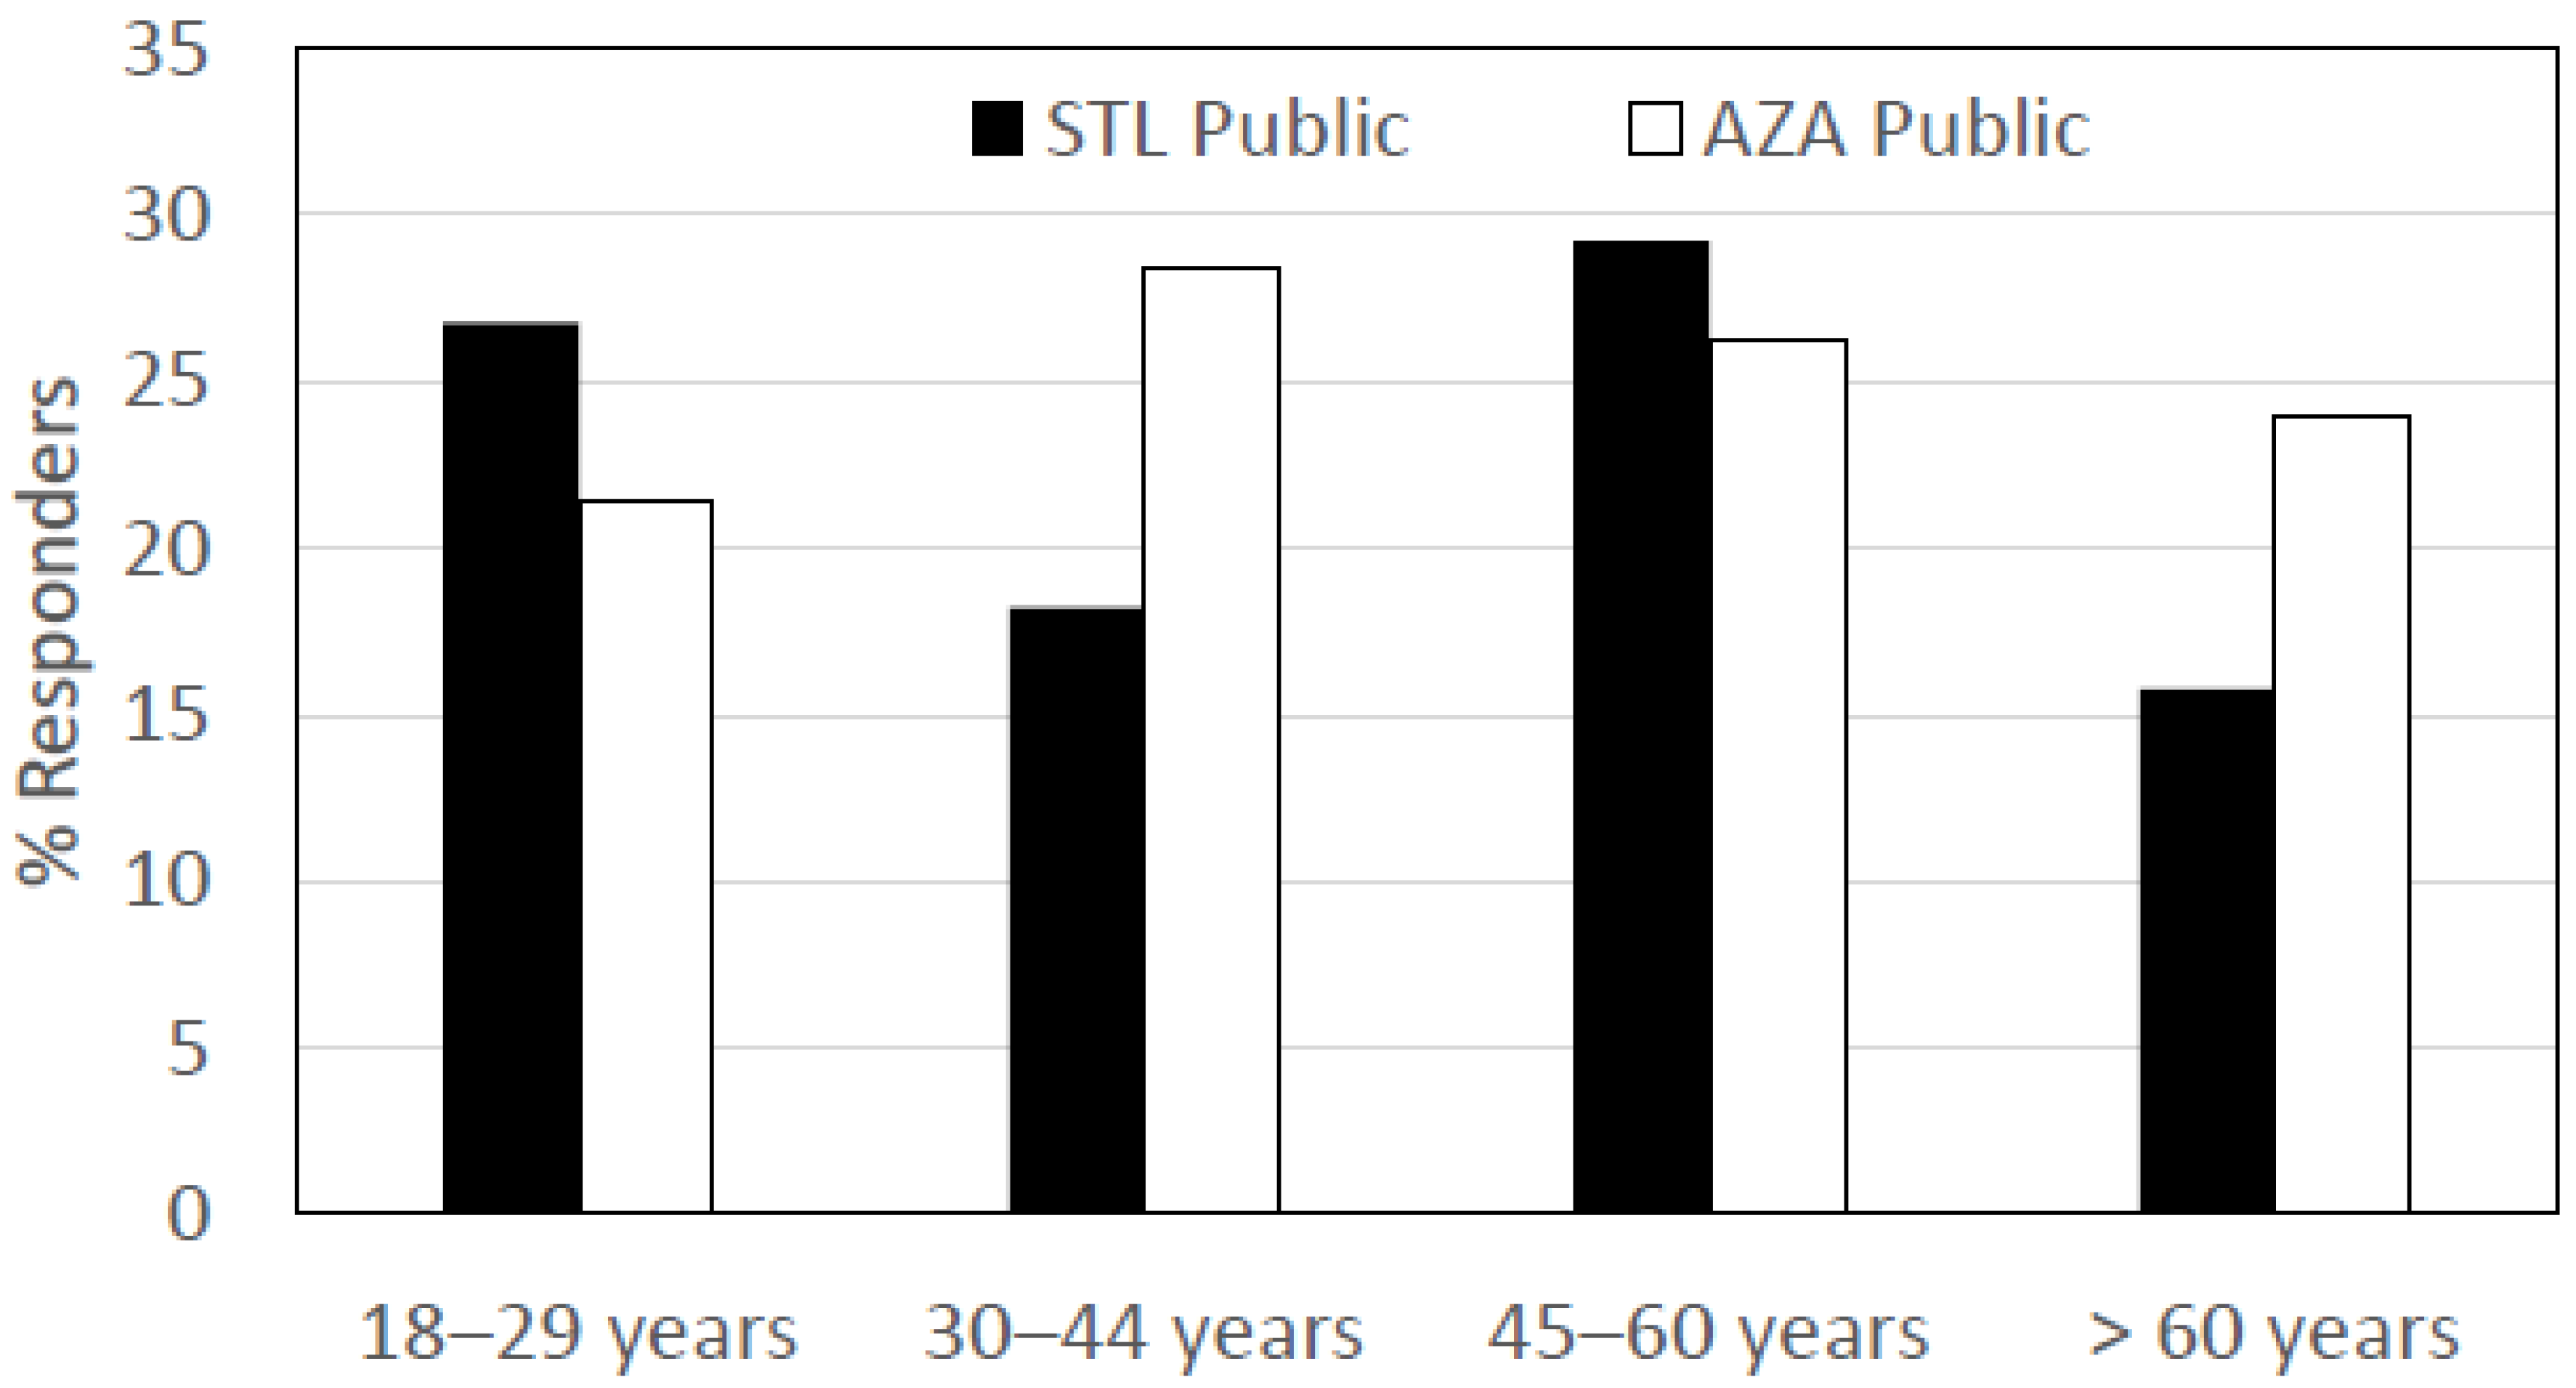
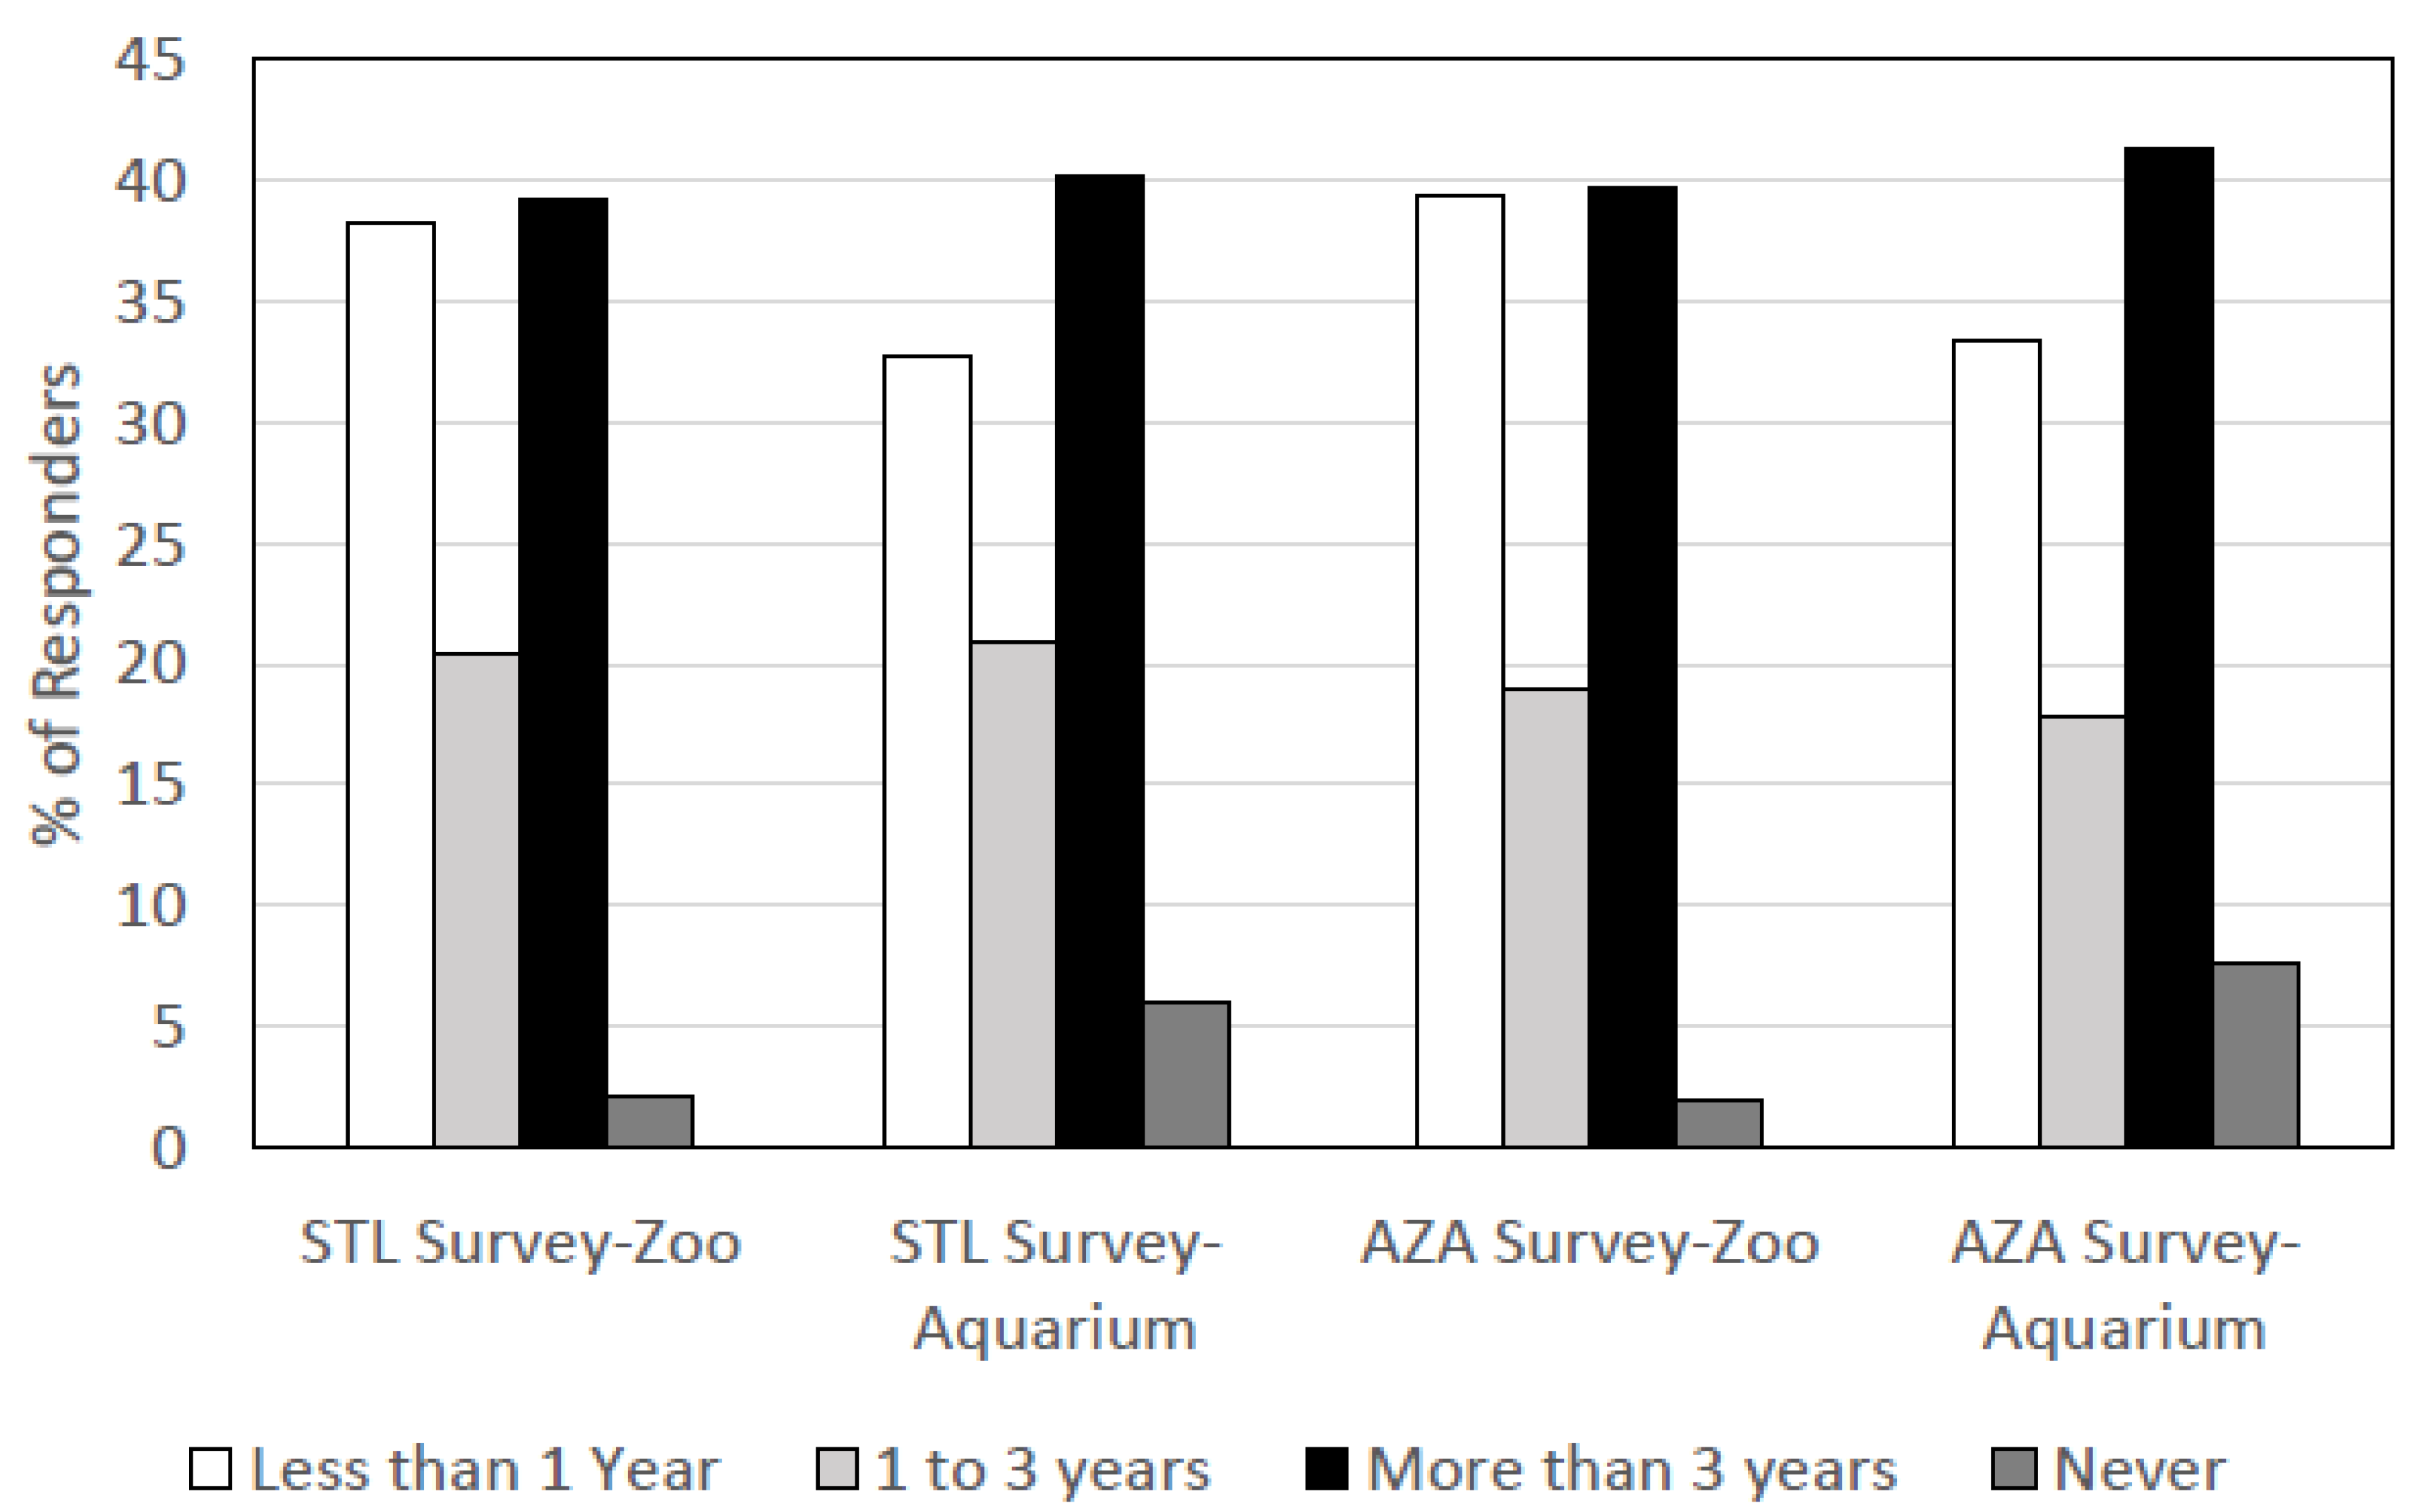
3.1. Characteristics of the Surveyed Groups

Responders to the STL Public and AZA Public surveys were approximately evenly split with regard to sex (STL: 43% male, 47% female, 10% not provided; AZA: 46% male, 54% female). The age distributions of the surveyed groups varied (Figure 1). The STL public responders were more likely to be 18 to 29 or 45 to 60 years old than the AZA public survey responders, while the AZA responders were more likely to be 30 to 44 or more than 60 years old. Age and sex data were not gathered for the AZA member or director surveys.
The AZA director survey was completed by 128 (51%) of the individuals surveyed. The majority of AZA facility directors that completed the survey (74.2%) worked at zoos, 14.1% at aquariums, 8.6% at facilities that were both a zoo and aquarium, 1.6% at other kinds of facilities or were retired, and 0.8% at nature centers with a regional/local focus and primarily terrestrial animals.
The majority (72.9%) of responders to the AZA member survey (n = 1372, 19% response rate) reported working at a zoo, 13.1% at an aquarium, 9.4% at a facility that is both a zoo and aquarium, 0.7% at a science center, 0.6% at privately owned facilities not open to the public, 0.4% at a company that provides services to zoos/aquariums, 0.1% at a university, 0.1% at nature centers with a local/regional scope and primarily terrestrial species, and 1.4% at other types of facilities (e.g., theme parks). Most responders (64.4%) worked in animal care and management, 12.7% in education, 6.6% in conservation and research, and 5.0% in senior management (e.g., deputy director but not CEO level). All others (11.4% of the sample) comprised less than 3% each of the sample and included architecture/exhibit design, facilities maintenance, finance, fundraising/membership, human resources, information technology, public relations/marketing, visitor services, and volunteer services.
In the public surveys, sizable percentages (~30–40%) of responders had been to a zoo, aquarium, or both in the last year (Figure 2). Responders were nearly equally likely to have been to a zoo and aquarium either in the last year or more than three years ago. Across surveys, ~20% of responders reported visiting zoos and/or aquariums in the last one to three years. Relatively few responders had never been to a zoo or aquarium.

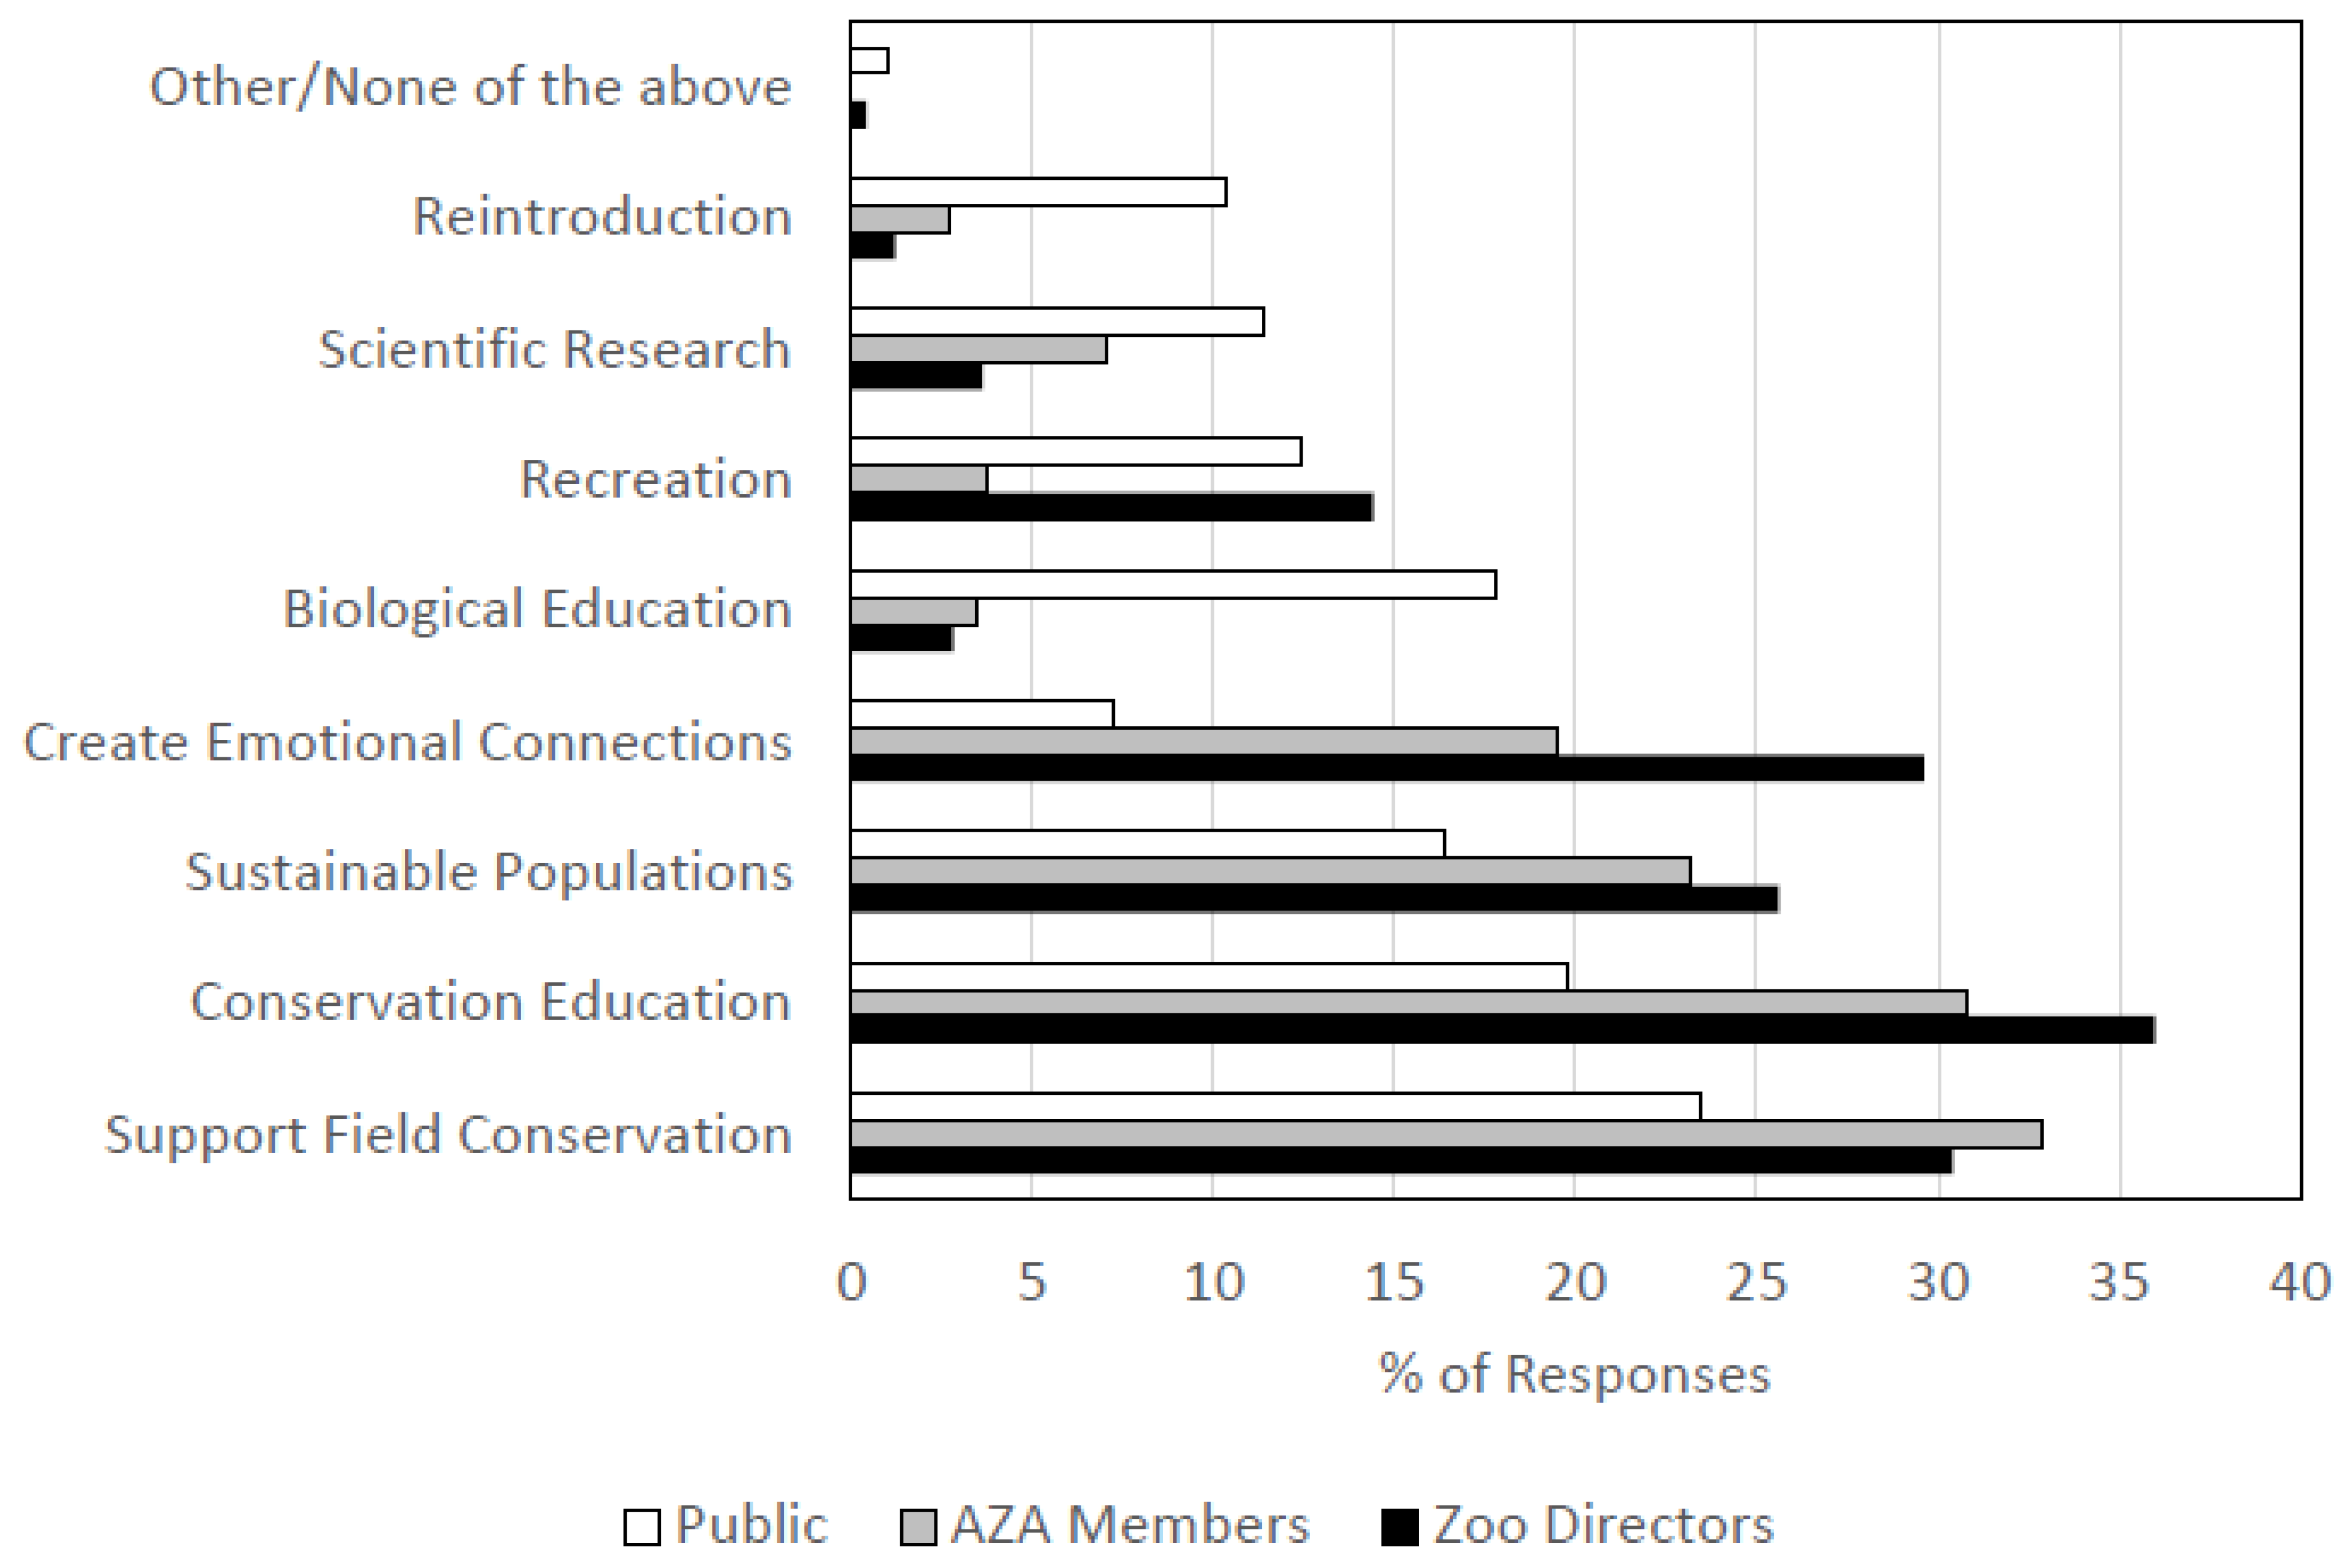
3.2. The Roles of Zoos and Aquariums

When asked to select up to three primary roles for zoos, all surveyed groups displayed a spread of emphasis on different roles, with every role capturing at least some percentage of the responses (Figure 3). The public showed the widest and generally most evenly spread emphasis on the various available roles, whereas zoo staff generally emphasized field conservation, conservation education, maintaining sustainable populations and creating emotional connections with animals more than other roles. Supporting field conservation and conservation education were the roles most highly emphasized by the public, followed by maintaining sustainable animal populations. AZA members and directors placed much more emphasis on the role of creating emotional connections between visitors and animals than the public did. Conversely, the public considered biological education an important role far more than AZA members or directors. However, biological education, recreation, scientific research, and reintroduction were all generally de-emphasized by all surveyed groups. Of these four roles, recreation received more responses than the others overall. AZA directors and the public considered recreation a priority role for zoos and aquariums nearly three times more than AZA members did. Though it was generally de-emphasized, the public voted for the reintroduction of species to the wild noticeably more often than AZA members or directors.

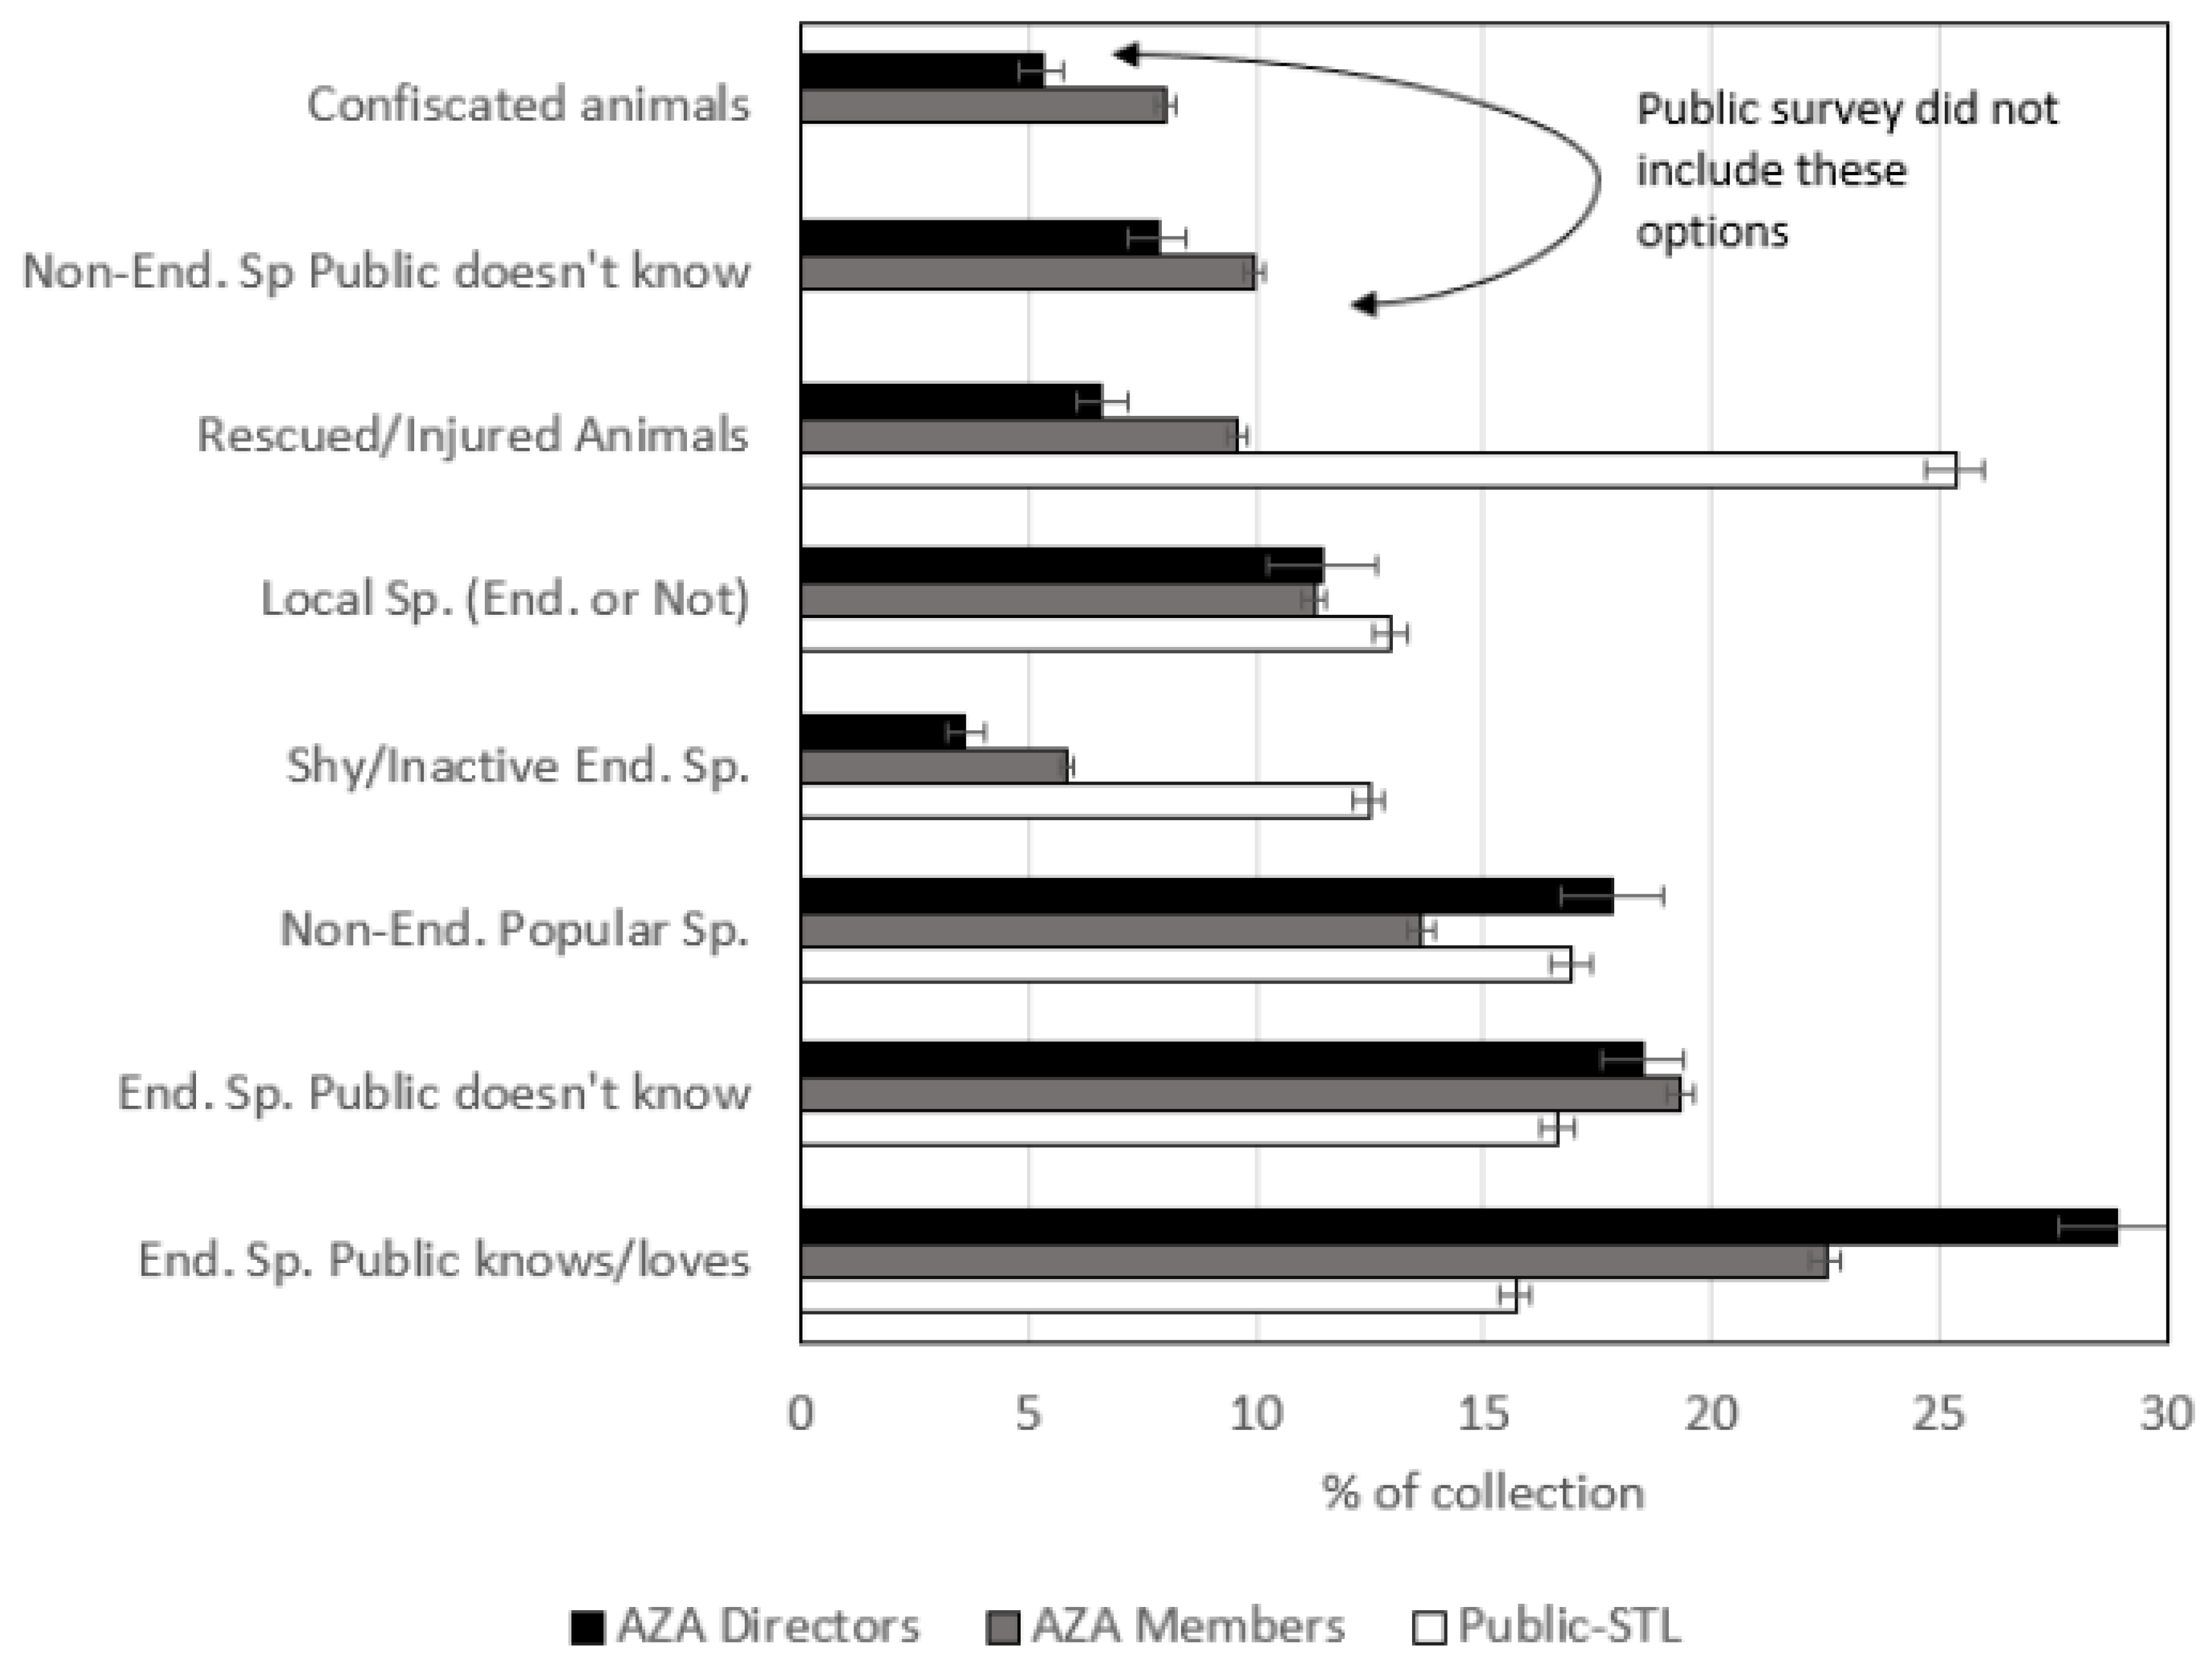
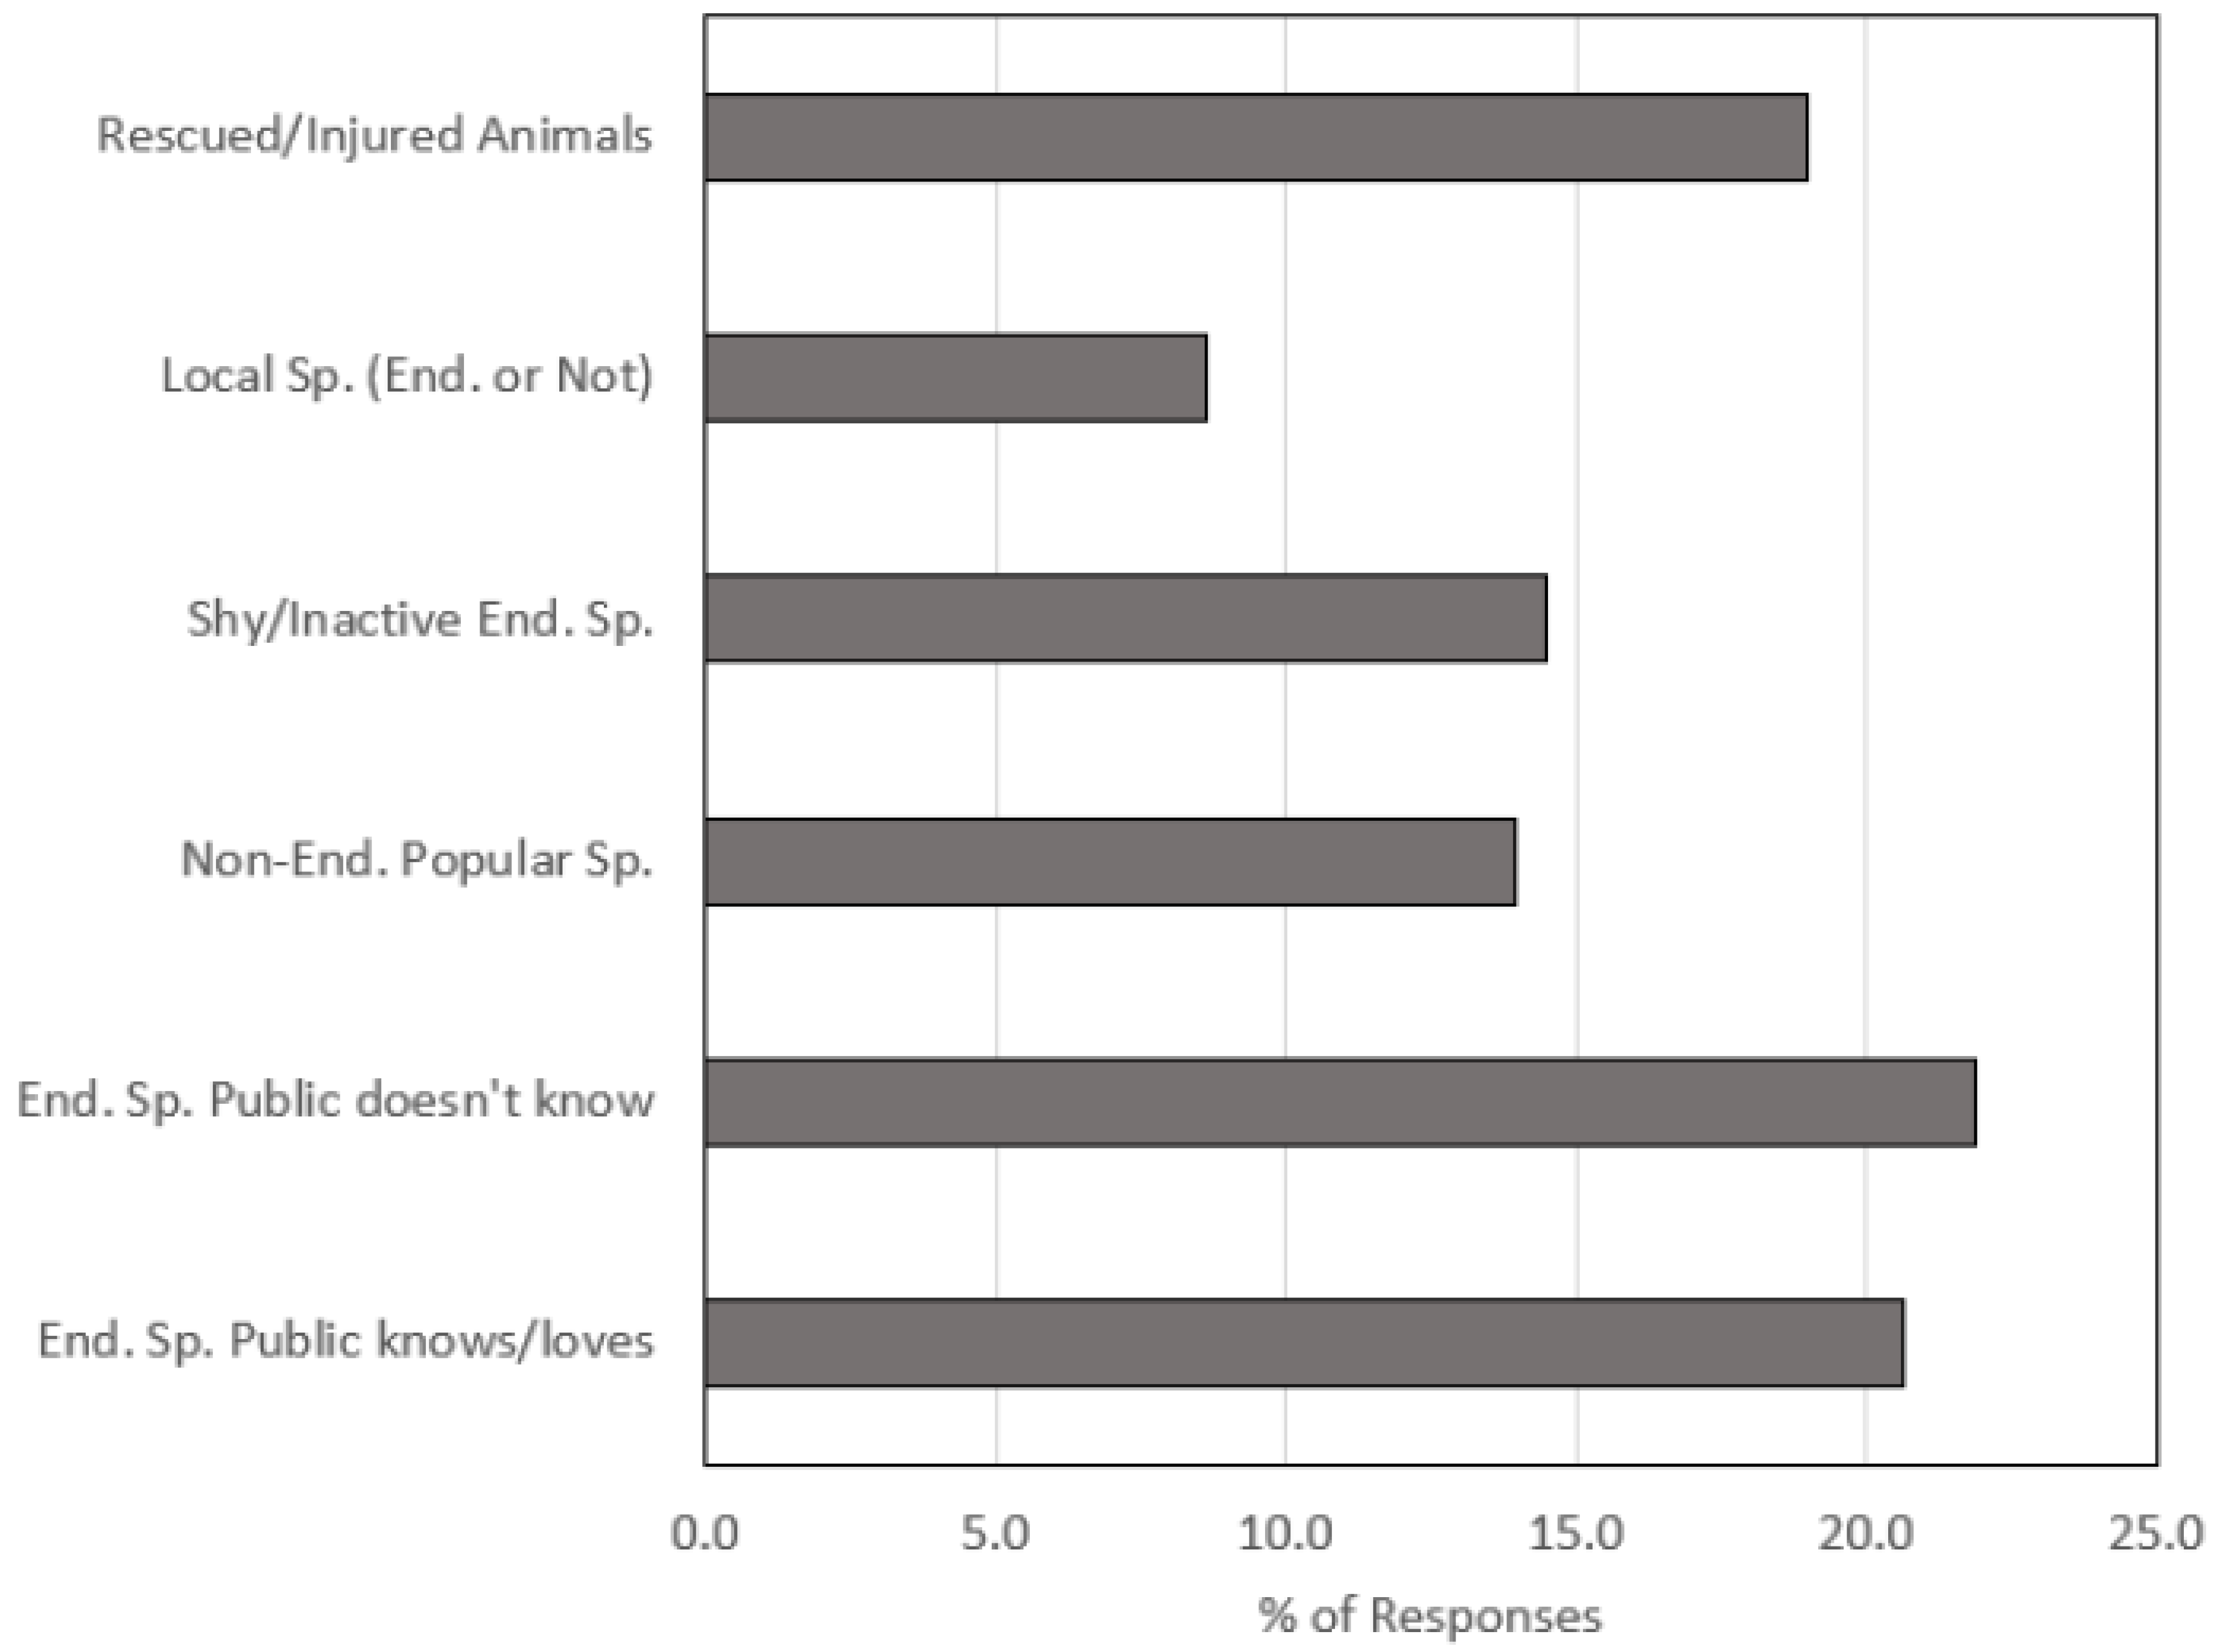
3.3. Design of Zoo Collections

When AZA directors, members, and the public surveyed by STL were asked how they would compose animal collections by percentage across different non-taxonomic categories of animals, responders spread the composition of the zoo or aquarium animal collection across the offered categories of animals (Figure 4). Generally, endangered species the public knows and loves or endangered species the public does not know were the categories that received the most emphasis. Interestingly, zoo and aquarium staff emphasized endangered species the public knows and loves more than the public did. In contrast, the surveyed populations were more similar in emphasizing endangered species the public does not know. The public emphasized shy/inactive endangered species more than zoo staff. The surveyed populations were generally similar in their emphasis on non-endangered, popular species and local species, whether they were endangered or not. The largest departure in emphasis between zoo and aquarium staff and the public occurred in consideration of rescued or injured animals, which the public placed more emphasis on than zoo staff. Zoo directors and AZA members also allocated anywhere from approximately 5–10% of their hypothetical collections to confiscated animals and non-endangered species the public does not know about.
When the public was asked in the AZA survey to select three priority types of animals to include in collections from categories identical to the ones presented in the STL public survey, they were most likely to prioritize endangered species they either they knew and loved or did not know about (Figure 5). They also prioritized rescued or injured animals highly. There was also support for local species (endangered or not), shy or inactive endangered species, and non-endangered popular species, but these were not selected as often.

3.4. What Do Visitors Want to See When They Visit a Zoo vs. What Zoo Directors Think Are Priority Species for Guests Currently?

When we asked what directors thought were the five most important species for their guests’ experience currently, and what three species the public most hoped to see when they visited a new zoo, we found that their top 100 lists included 67 identical entries (e.g., “bison”), which equated to 41.4% of the directors’ entries and 45.0% of the public’s entries matching. When we collapsed certain categories where, conceptually, the two surveyed groups were likely referring to the same kind of animals (e.g., directors listed “Asian elephants,” “African elephants,” and “elephants” and the public only listed “African elephants” and “elephant”), 48.8% of the directors’ list agreed with the public and 51% of the public’s list agreed with directors (see Table S2 for full lists and rankings).
The two lists were generally similar in terms of taxonomic representation (Figure 6). Both survey populations included mostly mammalian taxa, but species from every major animal taxonomic group were included.
Of the top 10 animals selected by directors, 60% were larger mammals (giraffe, elephant, tiger, lion, rhinoceros, gorilla), 20% were generally medium-sized mammals (red panda, river otter), 10% birds (penguin), and 10% fish (shark). Of the top 10 animals selected by the public, 90% were large mammals (lion, elephant, tiger, giraffe, monkey, bear, gorilla, giant panda, and zebra), and 10% were birds (penguins). Two felids (lions and tigers) were in the top 5 animals on both lists.
The public’s full list included 11 kinds of domestic animals (falling between ranks 50 and 127 out of 149), plus a ‘domestic animal’ category, and together these 12 categories captured 1.2% of the responses provided in this question. The director’s list included only two domestic categories (goat [rank 26 out of 162] and domestic animals [rank 30]) capturing 1.9% of the responses received. The average rank of the domestic animals in the public’s list (74.3 ± 6.66) was significantly different (F1,12 = 7.52, p = 0.019) from the director’s list (28 ± 2.0).
The top 10 animals in the director’s list captured 53.4% of the responses for the top 50, while the top 20 captured 74.2% of the responses. In the public’s list, the top 10 animals captured 74.8% of the responses, while the top 20 captured 88.3% of the responses.

3.5. What Animals Should Be Maintained in Zoos and Aquariums for Future Visitors?

Table 2 below summarizes the number of responders, number of answers provided in the main question “what animals should be maintained in zoos for the future,” and valid answers in each survey and overall. The public provided the maximum allowed number of answers 0.07% (STL survey) and 1.73% (AZA survey) of the time; AZA facility directors provided the maximum number of answers allowed 7.81% of the time, while AZA members provided the maximum 5.76% of the time. Thus, it seems unlikely that a limit on the number of allowed answers significantly impacted outcomes.

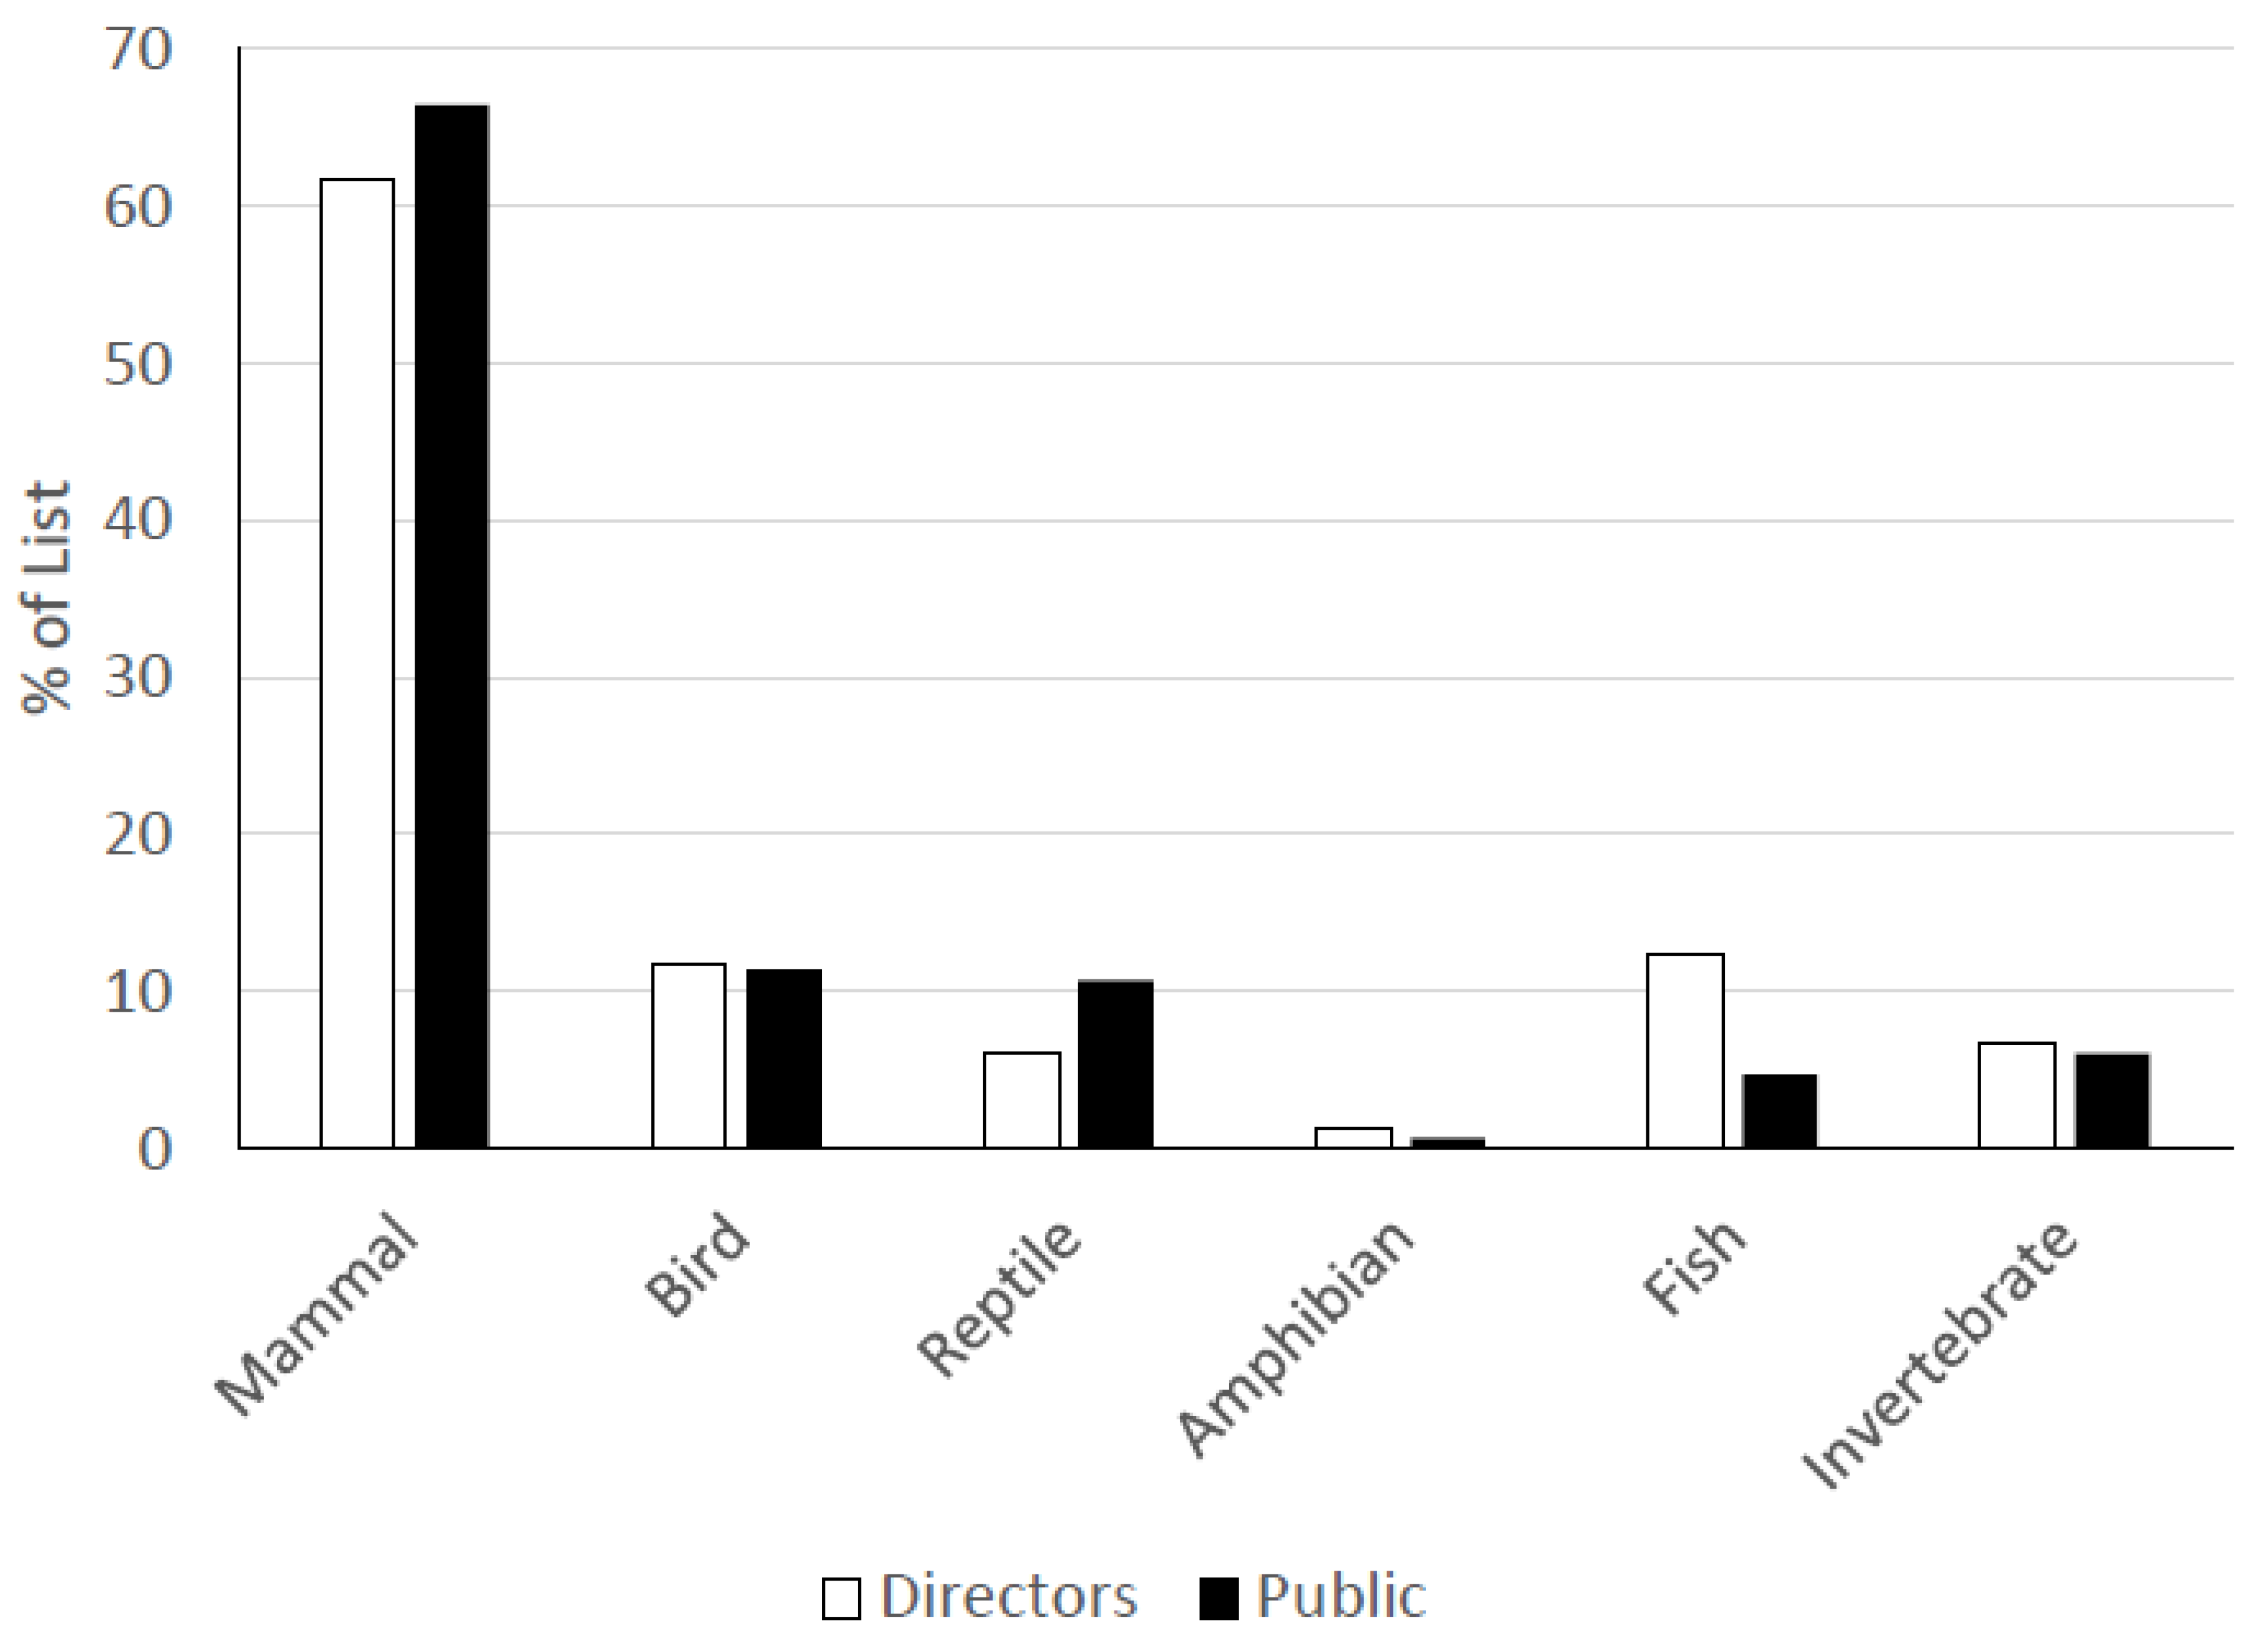
3.5.1. Taxonomic Composition of Top 100 Lists

The public’s top 100 list accounted for 86.14% of all responses provided (Table 2); the top 20 animals in the list accounted for 53.39% of all responses provided by the public. Both the public’s top 100 and top 20 animals were strongly biased towards mammals, followed by birds or reptiles. No amphibians made it on either list (see Supplementary Table S3 for all top 100 lists and rankings). Invertebrates were represented in the public’s top 100 but not in their top 20 (Table 3). Most of the mammals that made the top 100 for the public in terms of entries in the list and responses for those entries were carnivores (Table 4), followed by artiodactyls. Primates were the third most common, followed by cetaceans and perissodactyls in terms of entries. Primates were the third most common in terms of responses, but proboscideans (elephants) received more responses than cetaceans and perissodactyls. Of the carnivores, 51.3% were felids, followed by 28% ursids, 6.3% other mammals (e.g., mustelids, herpestids, ailurids), 6% pinnipeds, 4.8% canids, 0.9% hyaenids, and 2.6% for the domestic dog, which was counted separately from the canids.
The AZA members top 100 list included 5 entries that tied for last place with 60 responses each, plus an additional entry (siamang) that also had 60 responses. Thus, the AZA members list is based on the top 101 most voted for categories of animals. The top 100 list accounted for 51.44% of the total responses provided by members; the top 20 list accounted for 20.87% of their total responses provided. As was true for the public, the AZA members’ top 100 and top 20 lists were strongly biased towards mammals. In fact, the AZA members’ top 100 list was more strongly biased towards mammals than the public’s list (Table 3). However, the AZA members’ top 100 list included all major animal taxonomic groups, whereas the public’s list did not. As was true for the public, birds and reptiles were the second and third most voted for types of animals, respectively. In the AZA members’ top 20 list, mammals also dominated, with birds, reptiles, and fish getting equal percentages of responses. Amphibians and invertebrates were not included in their top 20 list. Of the mammals that made the top 100 for AZA members, the majority were carnivores (Table 4), followed by artiodactyls and primates in terms of entries and responses. Perissodactyls and marsupials each represented 7% of the mammalian entries. All other mammalian taxonomic groupings were less than 6% each of the entries (Table 4). Of the carnivores voted for, 40.1% were felids, followed by 21.2% ursids, 17.8% other mammals (e.g., mustelids, herpestids, ailurids), 10.8% canids, 7.5% pinnipeds, and 2.5% hyaenids.
The AZA directors’ top 100 list included 15 entries that tied for last place with 8 responses each; thus, the AZA directors’ list is based on the top 113 most voted for categories of animals. The top 100 list accounted for 59.79% of the total responses provided by directors; the top 20 list accounted for 22.17% of their total responses provided. As with other groups, the directors’ top 100 and top 20 lists were dominated by mammals, followed by birds (Table 3). The directors’ top 100 list also included all major taxonomic groups, while reptiles and amphibians were not included in their top 20 list.
The directors’ top 100 and top 20 lists generally included similar percentages (±5%) of the major taxonomic groups as other surveyed populations. As was true for other groups, the directors’ list included mostly carnivores, followed by primates and artiodactyls in terms of entries and responses. The majority of the remaining entries were perissodactyls, proboscideans and xenarthrans; of these, perissodactyls and proboscideans received the most responses. Of the carnivores voted for, 45.8% were felids, followed by 19.7% other mammals (e.g., mustelids, herpestids, ailurids), 17.5% ursids, 7.4% canids, 6.8% pinnipeds, and 2.8% hyaenids.
When we combine all of the survey data and generate a single list of the top 100 kinds of animals to maintain in zoos for the future, the entries range from capturing 87 (for cassowary) to 1282 (for tiger) responses, equating to 0.21 to 2.99% of the responses provided. The top 100 list captured 59.73% of the total responses provided; the top 20 accounted for 29.03% of total responses provided. When considering the full list as well as the top 20, the list is dominated by mammals (Table 3). The top 100 list contains animals from all major taxonomic groups, whereas reptiles and amphibians are absent in the top 20 list. The taxonomic composition of the mammals that appear on this list is mostly carnivores, artiodactyls, and primates in terms of entries and responses. Perissodactyls were the next most common in terms of responses but captured fewer responses than proboscideans (Table 4). Of the carnivora represented in the top 100 list, the felids captured the majority of responses (46.7%), followed by bears (22.9%), mustelids/herpestids/ailurids (11.8%), canids (8.2%), pinnipeds (7.1%), hyaenids (1.9%), and the domestic dog (1.4%), which was counted separately from canids. The domestic dog (rank 74) and domestic horse (rank 78) made the top 100 list.
Across all surveyed groups, only the public’s top 100 list for the main survey question included any domestic animals. Eight types (dog, horse, goat, sheep, pig, chicken, llama, donkey in rank order) were listed, accounting for a total of 4.01% or 477 of the responses captured by the top 100 (11,897) and 3.46% of the total valid, non-generic responses provided in the public surveys (13,812). By comparison, the top-ranked animal in the public’s list (lion), captured 6.94% of the responses captured by the top 100 and 5.98% of the total valid, non-generic responses provided in the public surveys. The domestic dog ranked highly (25th place) in this list and accounted for 23.27% of the responses provided for domestic animals, while the horse also ranked highly (29th place) and accounted for 21.39% of the responses provided for domestic animals. Other domestic species mainly fell in the middle of the list (ranks 47–65), with donkey being lowest at rank 87.

3.5.2. Agreement across Top 100 Lists

When comparing the public to AZA members, there was approximately 56–57% agreement depending on whether the AZA members’ or public’s list was considered the denominator. As mentioned above, the AZA members’ list had 101 entries. When comparing the public to directors, agreement ranged from 52 to 59% between the lists, depending on whose list was considered the denominator. As mentioned above, the directors list had 113 entries. When comparing AZA members and directors, there was anywhere from 70 to 79% agreement between lists, depending on which list was used as the denominator. When all three surveyed populations are compared, agreement across the three survey datasets ranged from 46 to 52%, depending on the denominator. When we pooled the AZA member and director data and compared it to the public, there was 57% agreement between those lists. There was a highly significant correlation between the rankings of identical animal entries in the public’s top 100 list and those in the top 100 list of zoo personnel (r = 1.0, 55 df, p < 0.00001).

4. Discussion

4.1. Characteristics of Surveyed Groups

Our public survey responders were approximately equally divided across sexes and represented a wide range of ages. Most of these individuals had visited a zoo, aquarium, or both within the last three years; few had never visited either one. Demographic data were not gathered for AZA members or facility directors. Most zoo professionals participating in the surveys were employed by zoos rather than aquariums. The AZA members that completed the survey were predominately working in animal care or management, followed by education, though many different careers were represented in the sample.

4.2. The Primary Roles of Zoos and Aquariums

The public, AZA members, and AZA facility directors generally agreed that the top roles for zoos are related to conservation (supporting field conservation and conducting conservation education) and maintaining sustainable populations of animals. AZA facility directors and members prioritized the conservation roles more than the public, who demonstrated more even support for various roles. Previous studies have also demonstrated that the public sees field conservation and conservation education as priorities for zoos (e.g., [42,48]). For example, Roe et al. [42] quantified views on what zoos’ priorities should be from both the public and zoo staff perspectives. They found that educating visitors was the highest priority reported by both groups. Visitors also placed high value on learning about actions they can take to help conservation efforts. The contrast between zoo and aquarium staff and the public in focus on biological education in our study could reflect a feeling among staff that basic biological information about animals is readily available elsewhere and that education about conservation is more urgent. It is also possible that various responders had different conceptions of what biological versus conservation education means.
Previous work has demonstrated that visitors come to zoos primarily for recreation and social time with family and friends [46,49,50]. A collection of animals for the public to see is the platform that provides both the means for visitors to achieve their recreational goals and, at the same time, the means for zoos and aquariums to achieve conservation and education outcomes, among others. Thus, it is not surprising that simply maintaining sustainable populations of animals with no specific purpose stated was generally highly rated as a primary role. Perhaps recreation was not as highly rated as a priority because it was assumed that sustainable populations of animals would be available to achieve the public’s recreational goals. Interestingly, zoo directors and the public voted for recreation as a role much more often than AZA members. As stated above, the public likely chooses recreation because this is their primary interest in visiting a zoo, while zoo directors emphasized it because providing a valued recreational experience is the platform to achieving other, higher goals like conservation. Zoo directors also possibly emphasized recreational goals more than AZA members because directors are tasked with running facilities that depend on public support to maintain their operations [38,40,41,42]. Thus, providing a high-quality recreational experience that the public values is critical. It could also be the case that the public may consider why they go to a zoo as something different from what the zoo’s role should be. Further, in responding to a survey about the roles of zoos, responders may be more likely to choose options that they perceive to be more socially desirable or acceptable than simply recreation.
Zoo personnel and the public differed regarding the role of zoos in creating emotional connections between visitors and animals. The fact that AZA members considered this more of a priority than the public likely reflects a recent movement in the AZA community to emphasize emotional connections and empathy as tactics in motivating the public to engage in conservation [51,52]. Consciously making an emotional connection with animals might not be a goal a visitor has in mind for themselves.
Interestingly, the public chose reintroduction as a primary role much more frequently than zoo staff did. In our experience, the public enjoys stories of returning animals to the wild but often is not aware of the many challenges associated with reintroduction (e.g., costs, regulatory compliance, success rates), so it may not be surprising that they rated it more highly as a role than zoo and aquarium staff did. Public opinion about reintroduction can be favorable, even when individuals have very little knowledge of the species’ biology [53]. Zoo staff also find reintroduction work very rewarding, but this may be offset by better knowledge of the challenges involved, leading to lower emphasis on this role.

4.3. Composing Zoo and Aquarium Collections

When we asked our responders to design collections of animals and allocate percentages of the collection to different generic types of animals (e.g., endangered species the public knows and loves) or asked them to select up to three non-taxonomic priority groups of animals to include in the collection, all surveyed groups generally spread their animal collections amongst the categories offered, and for most categories, zoo staff generally agreed with the public on how much of the collection to devote to those animals, even though the questions were worded differently between the AZA and STL public survey. Endangered species, whether familiar to the public or not, received the most emphasis. We believe this supports other studies showing that endangered status, whether the species is familiar or not, is an important predictor of animal popularity [2,24,25,26], though it is also the case that the public may not know how endangered a species is even if it is popular [54]. However, in this question, the focus was not on particular species, but rather kinds of animals that share certain non-taxonomic characteristics. Thus, we assert that prioritization of endangered species by the public in this question reflects a true concern for species that are threatened with extinction even aside from popularity because the public prioritized endangered species they were and were not familiar with. This argument is further strengthened by the fact that the public put more emphasis on endangered species that were shy, inactive, or hard to see than zoo staff did, suggesting again that endangered status has value to the public even if they cannot easily have an experience with the species in a zoo. An alternative possibility is that the public might connote shyness with some form of helplessness or anxiety. The public also emphasized injured or rescued animals in their choices (see below) more than zoo staff. Thus, there may be a linkage in the public’s mind between shy animals and injured animals that leads them to emphasize animals with these characteristics. Zoo staff likely rated endangered species that were shy or hard to see lower due to a belief that they do not make good exhibit animals or offer less opportunity for the visitor to connect with the animals. Indeed, animal activity or visibility is a predictor of visitor interest and stay time at exhibits [32,34,55].
Non-endangered but popular species closely followed endangered species for inclusion in animal collections and were valued nearly equally between the public and zoo staff. This likely indicates there are non-endangered species the public always seems interested in (e.g., California sea lions), and even zoo staff view these as valuable in achieving their missions.
All surveyed groups included local species (endangered or not) in their collections. This could suggest that familiarity with a species can drive popularity [6,10,16,25,29,30,31], but it could also represent a belief by all groups of responders that it is important to educate about and provide access to species in the local area. Roe et al. [42] found that the opportunity to see local wildlife is a high priority for zoo visitors, whereas zoo staff viewed this as a lower priority. They argued that exhibits of local species may help children better connect with their own natural environment rather than one far away and that this could foster interest in local conservation. They also suggested that exhibits of local species are of interest to visitors from other regions. Rabb and Saunders [56] argued that creating connections between zoo visitors and local wildlife is an important stepping stone in getting them to care about more distant places, even while acknowledging that more distant, exotic wildlife may be what initially attracts visitors to zoos.
The public placed twice the emphasis on rescued or injured animals in the collection that zoo staff did. This could reflect a public opinion that zoos have a significant role in protecting and caring for animals that are directly harmed as a result of people, suggesting an acknowledgment that zoos are the places to care for these kinds of non-domesticated species when harm is done to them. Zoo and nature center staff tend to view rescued or rehabilitated animals as playing a role in storytelling about human–wildlife conflict and conservation (e.g., [57,58]). At the same time, these species do not tend to be endangered and/or they are not part of managed breeding programs in zoos; thus, they compete for space with other species. In North America, individuals that come into zoos as rescued or injured animals also tend to be long-lived (e.g., raptors, bears, cougar, turtles/tortoises); thus, zoos do not need to add new individuals of these species to their collections very often, which could contribute to less emphasis placed on them by zoo staff.

4.4. What Do Visitors Want to See When They Visit a Zoo vs. What Zoo Directors Think Are Priority Species for Guests Currently?

The priority species data from the public AZA survey are not directly comparable to the AZA directors’ data because of how the question was asked, but the results are broadly similar. Departures between the surveys may result from the forced-choice scenario in the AZA public survey. Regardless, when AZA directors and the public surveyed by AZA had to identify which species are most important for the guest experience and which species they most want to see, respectively, they generally agreed 41–51% of the time on the top 100 priority species. Cases where a species received many more responses from the public than directors include giant pandas, koalas, and Bengal tiger for the public, though ‘tigers’ was number three in the public’s list. Directors did not highly vote for a species that the public did not also highly vote for except for ‘river otter’, which was number 5 on their list, versus ‘otter’, number 26 on the public’s list.
Consistent with previous work [2,6,7], mammals were more strongly represented than other taxa, but all major animal groups were represented and generally to the same extent between directors and the public. The most significant discrepancy was that directors emphasized fish notably more so than the public. This may be because aquarium directors who took the survey consider fish as important for their guest experience. When only the top 10 of each list were considered, again, mammals were heavily favored. There was also evidence that felids were highly prioritized as two species (lions and tigers) made it into the top five on both lists, providing further support for their popularity [8,9,10,11]. Focusing only on the top 10 species, directors felt that a slightly wider range of animals is important for guest experience (i.e., their list included a wider array of animals and responses were spread more evenly among them), while visitors seemed mostly interested in seeing large mammals when they visit a zoo they have not previously visited. However, both groups generally agree on what those animals should be.
While the public listed more specific kinds of domestic animals in its list than directors did, a domestic animal category accounted for a similar, but small, percentage of the responses in both groups. However, it was interesting that domestic animals ranked significantly higher in the directors’ list compared to the public’s list, especially when no domesticated species made it into AZA members or AZA directors’ top 100 lists of animals to preserve in zoos for the future (see below). Domestic animal areas or ‘petting zoos’ tend to be common in zoos, are very popular with the public, and offer a way for visitors to have hands-on contact with animals [59], possibly creating stronger bonds or empathy. As creating empathy and connections between visitors and animals was considered a priority amongst zoo directors in this study, it is perhaps not surprising that domesticated animals rank more highly as important for guest experience according to zoo directors, while at the same time not being as likely to be one of the top three kinds of animals a visitor hopes to see at a zoo or aquarium. Roe et al. [42] found that approximately 10% of visitors sought more contact with animals when visiting the zoo, suggesting species amenable to these opportunities could be priorities.
Among the top 50 animals in the director and public lists, the public’s top 10 and top 20 animals captured much larger percentages of the responses than directors’ top 10 and 20 animals. This finding could reflect directors’ voting for species in their respective facilities or possibly wider knowledge of biodiversity than the public. This could result in directors spreading their responses more widely, while the public uses more generic categories or is simply not aware of species. Kellert [4] stated in his large-scale studies that the typical zoo visitor possesses limited knowledge of wildlife. Examining the raw numbers of responses cast in the top 10 suggests that the public simply coalesces around a smaller group of high-priority animals than directors. It may be that the directors’ possibly greater knowledge of species diversity, coupled with more agreement on priority species among members of the public, generates the discrepancy between the public’s priorities and what directors believe are priority species for guest experience. We cannot rule out the possibility that the concentration of responses on a smaller number of species amongst the public could be impacted by the fact that the director’s question allowed them to provide five answers, whereas the public question was worded differently and only allowed three answers, but given the large number of answers given by both groups (over 100 unique answer types in both populations), this seems unlikely.

4.5. What Animals to Maintain in Zoos and Aquariums for Future Visitors

Our primary survey question asked which animals should be maintained for the future in zoos, and we again focused on the top 100 answers, plus any answers that tied for last place. Mammals dominated the public list, but all other major taxa (except amphibians) were identified. Invertebrates dropped out of the top 20 list for the public. Among mammals, carnivores were again the most popular. Most were felids, confirming that the public has preferences for mammals overall and felids in particular, as discussed above. Artiodactyls and proboscideans were also very popular, likely because these taxa include many of the charismatic fauna that are known to be popular with the public (e.g., giraffe, elephants; [16]).
Our results also confirm the public’s affinity for domesticated animals [12,13,14,15,23,29], whereas no domesticated species made it into the top 100 lists for AZA members or directors. Directors did emphasize domestic animals as important for the guest experience in a different question, but we assert that this represents their sentiment that experiences with domestic animals are enjoyable to zoo visitors, but zoos are not necessarily the place to preserve domestic animals for the future.
The AZA members’ top 100 list was even more biased towards mammals than the public’s list but did include all major taxonomic groups. Again, carnivores dominated the mammalian categories and felids dominated the carnivores. Like other groups, directors voted mostly for mammals, carnivores, and felids. In all, these data support other findings that there is generally a bias in popularity towards mammals [2,6,7], and there is a particular affinity for felids [8,9,10,11]. Our study revealed these biases exist even amongst potentially more knowledgeable zoo staff.
What differed across the surveyed groups was how much their responses were concentrated in the top 100 or top 20 animal types. The top 100 for the public accounted for the majority of the responses they provided (86%), and the top 20 within this list also accounted for over half of the responses (53%). For AZA members and zoo directors, the top 100 (51–59%) and top 20 (20–22%) lists accounted for much lower percentages of the responses provided compared to the public. These findings again suggest that zoo professionals have greater individual species awareness and thus spread their responses more widely across more species even when pervasive biases exist, as discussed above. Coupled with this is the possibility that when the public is asked to identify priority species for preservation, in the face of many different aspects of species to consider (e.g., rarity, beauty), they might simplify their decision-making by choosing species they are familiar with [60]. For example, the top-ranking birds listed by the public were pelicans (rank 15) and bald eagles (rank 16), which are familiar to many people who live in North America.
Despite these differences, there was moderate-to-strong agreement among the surveyed populations on which animals to preserve in zoos for the future. Not surprisingly, AZA members and zoo directors demonstrated the highest agreement with one another. This likely reflects more familiarity with existing zoo collections and increased species knowledge and similarity in collection planning philosophy than the public. When zoo staff are compared to the public, there was about 50% agreement on which species to maintain for the future, and, further, the animal rankings between the two lists was highly correlated, suggesting that not only do zoo staff and the public generally agree on priority animals to maintain but also rank them relative to one another in a similar way. As stated in the methods, it could have been possible to generate more agreement by collapsing categories with similar animals into a single category and calling it a point of agreement (e.g., river otter with otter, or sea turtle with turtle). However, given that we did not know each survey participant’s actual level of detailed species awareness, we did not want to infer whether their mention of a specific species (e.g., river otter) could be subsumed in a more general grouping (e.g., otters). Still, it seems likely that agreement could be higher with further questioning of participants. Agreement is likely driven by the prevailing preferences or biases towards animals that were demonstrated in our study and in previous work. Conversely, disagreements could possibly relate to slight differences in the wording of this question across surveyed populations. The public was asked to select animals they felt future visitors should see, while AZA members were asked which species zoos should preserve sustainable populations of, and directors were asked which species to maintain to best deliver on facility missions. The public could have been thinking more about general popularity or entertainment considerations. AZA members might have responded differently than other populations as the wording of their question referred to which species to maintain robust populations of for the future. It is possible that AZA members omitted some species that other surveyed groups included due to a belief that some species simply cannot be obtained or managed in robust populations. Zoo personnel were perhaps thinking about additional zoo mission elements that could influence them to select less popular species that might draw attention to particular conservation or education objectives. Directors’ views likely represent a mix of all of these motivations as they are aware that zoos have conservation and education missions but also rely on sustainable animal populations, which are ultimately reliant on financial support from the public. Still, the fact that there was a good deal of agreement across populations on species and how they are ranked suggests that multiple motivations for wanting to have particular animals in zoos are being satisfied.
There is sometimes debate about whether zoos and aquariums should house certain kinds of animals (e.g., elephants, great apes, cetaceans), but in the public’s master list of animals (n = 631 types of animals) they would like to see maintained in zoos for the future, elephants (rank: 3, African elephant: 94, Asian elephant: 111), great apes (gorilla: 11, chimpanzee: 33, orangutan: 39), and cetaceans (dolphin: 10, whale: 13, orca: 57, beluga: 114) appeared high on the list. These taxa also appeared high on lists of AZA members and zoo directors (see Supplementary Material). Thus, there seems to be support from the public and zoo professionals for maintaining populations of these species in modern zoological facilities.
Our study was focused simply on what animals or kinds of animals the U.S. public and zoo professionals would like to have in zoos of the future. We did not attempt to dissect the rationale for choosing particular species or animal groups, but rather suggest that our results represent integrated thinking by the responders that take some unknown number of variables into consideration. Further work to explore why certain animals are chosen would require careful survey design to avoid introducing bias but should also include consideration of many other independent variables that could affect responses. Though the AZA includes members in several foreign countries, our scope of inference is most likely limited to people living in the United States with access to the internet to complete surveys and who can understand written English. Our public survey results also reflect the views of individuals who have agreed to take surveys for compensation.
Future work in other regions would be interesting. We suspect that the role that familiarity plays in the public’s attitudes towards animals would shift the support toward or away from certain types of animals in different ways from U.S. residents. For example, McDonald et al. [9] found that the strength of both preference for and dislike of a canid or felid species increased with familiarity. The authors suggested that this may reflect negative experiences or cultural histories, which likely would differ across regions.

5. Conclusions

We have found that there is good agreement between the public and zoo personnel on the roles of zoos, and all surveyed populations emphasized roles related to conservation (supporting field conservation and conservation education) and maintaining sustainable populations of animals. Conservation and education have long been identified with recreation and research as the focal mission elements of zoos [61]. While we did not categorize the animals that responders chose in terms of body size, intelligence, rarity or other factors known to drive popularity, the ranked animal lists we derived from this study reflect many of those same known biases. Larger charismatic megafauna, which are typically mammalian, dominated the preferences of the surveyed populations, but other taxa were represented as well. The responses of zoo professionals generally reflected wider taxonomic knowledge, but there was generally high agreement between the public and zoo professionals on the kinds of animals to preserve in zoos and aquariums in the future. This is important, as resources for managing populations in zoos are limited by spatial and financial considerations, and there have been calls (e.g., [61,62]) for zoos to focus their resources on a more limited number of species, for which they can maintain more viable populations. The relatively high level of agreement over priority animals we demonstrated suggests that zoos can likely meet the recreational demands of the public and still pursue other goals related to conservation, education, or research for a wide range of biodiversity. Despite biases, all populations showed support for a wide range of species. Mooney et al. [41] found that zoos whose animal collections were large, species-rich and particularly rich in mammal species, and contained many large animals attracted higher numbers of visitors and contributed more to in situ conservation projects. Thus, it appears that zoo animal collections that reflect some human biases in animal popularity among zoo staff, visitors, or both still allow for zoos to contribute effectively to conservation.
It should be recognized that the collections of animals in zoos today are influenced and constrained by a variety of historical and external factors [62]. Certain species may not be available for zoos to obtain. There may be significant regulatory or financial barriers to obtaining or even maintaining certain species. Finally, some species may thrive in zoos better than others and this likely has and will continue to shape zoological collections. Still, there may be room for improvement in aligning collections to meet the interests of the public and zoo professionals simultaneously. The public showed somewhat stronger interest in local species as part of zoo collections than zoo professionals did. Zoos could continue to address conservation challenges on a local scale by incorporating more local species into their exhibits. These species may be more easily obtained and adaptable to the location of the zoo. Additionally, species do not have to be endangered to be effective tools for conservation [61]. At the same time, there is a clear signal in our results that the public considers endangered species to be one of several important areas of focus of zoo collections, as they emphasized familiar and unfamiliar as well as shy or reclusive endangered species in the hypothetical zoo collections they would design. Thus, including local, endangered species in zoo collections would be in alignment with how zoo staff and the public see the role of zoos and the composition of the animal collection. The public showed much stronger interest in incorporating rescued or injured individuals into a zoo collection than zoo professionals did. Some zoos have devoted resources to temporarily or permanently house and care for individual animals that are rescued or injured. A balance must be found between these activities and maintaining viable populations of species, but the United States public appears interested in zoos caring for rescued wildlife. Similarly, the public places more value on domesticated species than zoo professionals do, likely because these species have been amenable to opportunities for allowing the public to directly interact with non-human animals. Similar to rescued species, domestic animals compete for space with other kinds of animals at a zoo, but a variety of non-domestic species are also used as animal ambassadors and can offer similar opportunities for the public to connect with animals.

Supplementary Materials

The following supporting information can be downloaded at: https://www.mdpi.com/article/10.3390/jzbg5020011/s1, Table S1: Survey questions and audience surveyed; Table S2: The public’s and directors’ priority species; Table S3: Top 100 lists for all surveyed populations; Table S4: Full lists of animals voted for by all surveyed populations.

Author Contributions

Conceptualization, D.M.P., C.D. and R.V.; methodology, D.M.P., C.D. and R.V.; formal analysis, D.M.P. and T.G.M.; data curation, D.M.P. and T.G.M.; writing—original draft preparation, D.M.P. and T.G.M.; writing—review and editing, D.M.P., T.G.M., C.D. and R.V.; project administration, D.M.P.; funding acquisition, D.M.P. and R.V. All authors have read and agreed to the published version of the manuscript.

Funding

This research received no external funding.

Institutional Review Board Statement

The study was conducted in accordance with the Declaration of Helsinki and approved by the Saint Louis Zoo Human Subjects Research Committee, which deemed these activities exempt from regulations concerning human subjects research in 2019.

Data Availability Statement

Summarized survey data may be requested from the first author on reasonable request.

Acknowledgments

The authors would like the thank the thousands of responders who completed our survey.

Conflicts of Interest

The authors declare no conflicts of interest.

References

  1. Morris, D.; Morris, R. Men and Pandas; McGraw-Hill: New York, NY, USA, 1966. [Google Scholar]
  2. Czech, B.; Krausman, P.R.; Borkhataria, R. Social construction, political power, and the allocation of benefits to endangered species. Conserv. Biol. 1998, 12, 1103–1112. [Google Scholar] [CrossRef]
  3. Kellert, S.R. Values and perceptions of invertebrates. Conserv. Biol. 1993, 7, 845–855. [Google Scholar] [CrossRef]
  4. Kellert, S.R. The Value of Life: Biological Diversity and Human Society; Island Press: Washington, DC, USA, 1996; Available online: https://books.google.com/books?id=Caq8BwAAQBAJ (accessed on 27 January 2023).
  5. Carr, N. Ideal animals and animal traits for zoos: General public perspectives. Tour. Manag. 2016, 57, 37–44. [Google Scholar] [CrossRef]
  6. Schlegel, J.; Rupf, R. Attitudes towards potential animal flagship species in nature conservation: A survey among students of different educational institutions. J. Nat. Conserv. 2010, 18, 278–290. [Google Scholar] [CrossRef]
  7. Tisdell, C.; Wilson, C.; Nantha, H.S. Public choice of species for the ‘Ark’: Phylogenetic similarity and preferred wildlife species for survival. J. Nat. Conserv. 2005, 14, 97–105. [Google Scholar] [CrossRef]
  8. Di Minin, E.; Fraser, I.; Slotow, R.; MacMillan, D.C. Understanding heterogeneous preference of tourists for big game species: Implications for conservation and management. Anim. Conserv. 2013, 16, 249–258. [Google Scholar] [CrossRef]
  9. Macdonald, D.W.; Johnson, P.J.; Burnham, D.; Dickman, A.; Hinks, A.; Sillero-Zubiri, C.; Macdonald, E.A. Understanding nuanced preferences for carnivore conservation: To know them is not always to love them. Glob. Ecol. Conserv. 2022, 37, e02150. [Google Scholar] [CrossRef]
  10. Macdonald, E.A.; Burnham, D.; Hinks, A.E.; Dickman, A.J.; Malhi, Y.; Macdonald, D.W. Conservation inequality and the charismatic cat: Felis felicis. Glob. Ecol. Conserv. 2015, 3, 851–866. [Google Scholar] [CrossRef]
  11. Veríssimo, D.; Vaughan, G.; Ridout, M.; Waterman, C.; MacMillan, D.; Smith, R.J. Increased conservation marketing effort has major fundraising benefits for even the least popular species. Biol. Conserv. 2017, 211, 95–101. [Google Scholar] [CrossRef]
  12. Morris, D.J. An analysis of animal popularity. Int. Zoo Yearb. 1961, 2, 60–61. [Google Scholar] [CrossRef]
  13. Surinova, M. An analysis of the popularity of animals. Int. Zoo Yearb. 1971, 11, 165–167. [Google Scholar] [CrossRef]
  14. Kaltenborn, B.P.; Bjerke, T.; Nyahongo, J.W.; Williams, D.R. Animal preferences and acceptability of wildlife management actions around Serengeti National Park, Tanzania. Biodivers. Conserv. 2006, 15, 4633–4649. [Google Scholar] [CrossRef]
  15. Kellert, S.R. American attitudes toward and knowledge of animals: An update. In Advances in Animal Welfare Science 1984; Springer: Dordrecht, The Netherlands, 1984; pp. 177–213. [Google Scholar]
  16. Colléony, A.; Clayton, S.; Couvet, D.; Saint Jalme, M.; Prévot, A.C. Human preferences for species conservation: Animal charisma trumps endangered status. Biol. Conserv. 2017, 206, 263–269. [Google Scholar] [CrossRef]
  17. Lorimer, J. Nonhuman charisma. Environ. Plan. D Soc. Space 2007, 25, 911–932. [Google Scholar] [CrossRef]
  18. Frynta, D.; Šimková, O.; Lišková, S.; Landová, E. Mammalian collection on Noah’s ark: The effects of beauty, brain and body size. PLoS ONE 2013, 8, e63110. [Google Scholar] [CrossRef] [PubMed]
  19. Manesi, Z.; Van Lange, P.A.; Pollet, T.V. Butterfly eyespots: Their potential influence on aesthetic preferences and conservation attitudes. PLoS ONE 2015, 10, e0141433. [Google Scholar] [CrossRef] [PubMed]
  20. Morse-Jones, S.; Bateman, I.J.; Kontoleon, A.; Ferrini, S.; Burgess, N.D.; Turner, R.K. Stated preferences for tropical wildlife conservation amongst distant beneficiaries: Charisma, endemism, scope and substitution effects. Ecol. Econ. 2012, 78, 9–18. [Google Scholar] [CrossRef]
  21. Stokes, D.L. Things we like: Human preferences among similar organisms and implications for conservation. Hum. Ecol. 2007, 35, 361–369. [Google Scholar] [CrossRef]
  22. Cushing, N.; Markwell, K. I can’t look: Disgust as a factor in the zoo experience. In Zoos and Tourism: Conservation, Education, Entertainment? Frost, W., Ed.; Channel View Publications: Bristol, UK, 2011; pp. 167–178. [Google Scholar]
  23. Plous, S. Psychological mechanisms in the human use of animals. J. Soc. Issues 1993, 49, 11–52. [Google Scholar] [CrossRef]
  24. Fischer, A.; Bednar-Friedl, B.; Langers, F.; Dobrovodská, M.; Geamana, N.; Skogen, K.; Dumortier, M. Universal criteria for species conservation priorities? Findings from a survey of public views across Europe. Biol. Conserv. 2011, 144, 998–1007. [Google Scholar] [CrossRef]
  25. Skibins, J.C.; Dunstan, E.; Pahlow, K. Exploring the influence of charismatic characteristics on flagship outcomes in zoo visitors. Hum. Dimens. Wildl. 2017, 22, 157–171. [Google Scholar] [CrossRef]
  26. Tisdell, C.; Nantha, H.S.; Wilson, C. Endangerment and likeability of wildlife species: How important are they for payments proposed for conservation? Ecol. Econ. 2007, 60, 627–633. [Google Scholar] [CrossRef]
  27. DeKay, M.L.; McClelland, G.H. Probability and utility of endangered species preservation programs. J. Exp. Psychol. Appl. 1996, 2, 60–83. [Google Scholar] [CrossRef]
  28. Whitworth, A.W. An investigation into the determining factors of zoo visitor attendances in UK zoos. PLoS ONE 2012, 7, e29839. [Google Scholar] [CrossRef]
  29. Shapiro, H.G.; Peterson, M.N.; Stevenson, K.T.; Frew, K.N.; Langerhans, R.B. Wildlife species preferences differ among children in continental and island locations. Environ. Conserv. 2017, 44, 389–396. [Google Scholar] [CrossRef]
  30. Lindemann-Matthies, P. ‘Lovable’ mammals and ‘lifeless’ plants: How children’s interest in common local organisms can be enhanced through observation of nature. Int. J. Sci. Educ. 2005, 27, 655–677. [Google Scholar] [CrossRef]
  31. Skibins, J.C.; Powell, R.B.; Hallo, J.C. Charisma and conservation: Charismatic megafauna’s influence on safari and zoo tourists’ pro-conservation behaviors. Biodivers. Conserv. 2013, 22, 959–982. [Google Scholar] [CrossRef]
  32. Moss, A.; Esson, M. Visitor interest in zoo animals and the implications for collection planning and zoo education programmes. Zoo Biol. 2010, 29, 715–731. [Google Scholar] [CrossRef] [PubMed]
  33. Bitgood, S.; Patterson, D.; Benefield, A. Exhibit design and visitor behavior: Empirical relationships. Environ. Behav. 1988, 20, 474–491. [Google Scholar] [CrossRef]
  34. Margulis, S.; Hoyos, C.; Anderson, M. Effect of felid activity on zoo visitor interest. Zoo Biol. 2003, 22, 587–599. [Google Scholar] [CrossRef]
  35. Ward, P.; Mosberger, N.; Kistler, C.; Fischer, O. The relationship between popularity and body size in zoo animals. Conserv. Biol. 1998, 12, 1408–1411. [Google Scholar] [CrossRef]
  36. Frynta, D.; Lišková, S.; Bültmann, S.; Burda, H. Being attractive brings advantages: The case of parrot species in captivity. PLoS ONE 2010, 5, e12568. [Google Scholar] [CrossRef] [PubMed]
  37. Marešová, J.; Frynta, D. Noah’s Ark is full of common species attractive to humans: The case of boid snakes in zoos. Ecol. Econ. 2008, 64, 554–558. [Google Scholar] [CrossRef]
  38. Turley, S.K. Exploring the future of the traditional UK zoo. J. Vacat. Mark. 1999, 5, 340–355. [Google Scholar] [CrossRef]
  39. Kellert, S.R.; Case, D.J.; Escher, D.; Witter, D.J.; Mikels-Carrasco, J.; Seng, P.T. The Nature of Americans: Disconnection and Recommendations for Reconnection. The Nature of Americans. National Report. 2017. Available online: https://natureofamericans.org/sites/default/files/reports/Nature-of-Americans_National_Report_1.3_4-26-17.pdf (accessed on 27 January 2023).
  40. Dibb, S. Understanding the level of marketing activity in the leisure sector. Serv. Ind. J. 1995, 15, 257–275. [Google Scholar] [CrossRef]
  41. Mooney, A.; Conde, D.A.; Healy, K.; Buckley, Y.M. A system wide approach to managing zoo collections for visitor attendance and in situ conservation. Nat. Commun. 2020, 11, 584. [Google Scholar] [CrossRef] [PubMed]
  42. Roe, K.; McConney, A.; Mansfield, C.F. The role of zoos in modern society—A comparison of zoos’ reported priorities and what visitors believe they should be. Anthrozoös 2014, 27, 529–541. [Google Scholar] [CrossRef]
  43. Gusset, M.; Dick, G. The global reach of zoos and aquariums in visitor numbers and conservation expenditures. Zoo Biol. 2011, 30, 566–569. [Google Scholar] [CrossRef] [PubMed]
  44. Gusset, M.; Dick, G. ‘Building a Future for Wildlife’? Evaluating the contribution of the world zoo and aquarium community to in situ conservation. Int. Zoo Yearb. 2010, 44, 183–191. [Google Scholar] [CrossRef]
  45. Kohl, J. Zoos behind the wild façade. Int. J. Wilderness 2004, 10, 23–27. [Google Scholar]
  46. Morgan, J.; Hodgkinson, M. The motivation and social orientation of visitors attending a contemporary zoological park. Environ. Behav. 1999, 31, 227–239. [Google Scholar] [CrossRef]
  47. Palmer, C.; Kasperbauer, T.J.; Sandøe, P. Bears or butterflies? How should zoos make value-driven decisions about their collections. In The Ark and Beyond: The Evolution of Zoo and Aquarium Conservation; The University of Chicago Press: Chicago, IL, USA, 2018; pp. 179–191. [Google Scholar]
  48. Reade, L.S.; Waran, N.K. The modern zoo: How do people perceive zoo animals? Appl. Anim. Behav. Sci. 1996, 47, 109–118. [Google Scholar] [CrossRef]
  49. Clayton, S.; Fraser, J.; Saunders, C.D. Zoo experiences: Conversations, connections, and concern for animals. Zoo Biol. 2009, 28, 377–397. [Google Scholar] [CrossRef] [PubMed]
  50. Turley, S.K. Children and the demand for recreational experiences: The case of zoos. Leis. Stud. 2001, 20, 1–18. [Google Scholar] [CrossRef]
  51. Akerman, S. Best practices for building empathy through live animal encounters. J. Mus. Educ. 2019, 44, 89–95. [Google Scholar] [CrossRef]
  52. Young, A.; Khalil, K.A.; Wharton, J. Empathy for animals: A review of the existing literature. Curator Mus. J. 2018, 61, 327–343. [Google Scholar] [CrossRef]
  53. Hiroyasu, E.H.; Miljanich, C.P.; Anderson, S.E. Drivers of support: The case of species reintroductions with an ill-informed public. Hum. Dimens. Wildl. 2019, 24, 401–417. [Google Scholar] [CrossRef]
  54. Courchamp, F.; Jaric, I.; Albert, C.; Meinard, Y.; Ripple, W.J.; Chapron, G. The paradoxical extinction of the most charismatic animals. PLoS Biol. 2018, 16, e2003997. [Google Scholar] [CrossRef] [PubMed]
  55. Kirchgessner, M.L.; Sewall, B.J. The impact of environmental, social, and animal factors on visitor stay times at big cat exhibits. Visit. Stud. 2015, 18, 150–167. [Google Scholar] [CrossRef]
  56. Rabb, G.B.; Saunders, C.D. The future of zoos and aquariums: Conservation and caring. Int. Zoo Yearb. 2005, 39, 1–26. [Google Scholar] [CrossRef]
  57. Fuhrman, N.E. Predicting Commitment to Engage in Environmentally Responsible Behaviors Using Injured and Non-Injured Animals as Teaching Tools. Ph.D. Thesis, University of Florida, Gainesville, FL, USA, 2007; 178p. [Google Scholar]
  58. Schwartz, J.B. Raptors in Education: How Educators Use Live Raptors for Environmental Education. Master’s Thesis, University of Minnesota, Minneapolis, MN, USA, 2013; 84p. Available online: https://hdl.handle.net/11299/187548 (accessed on 27 January 2023).
  59. Kreger, M.D.; Mench, J.A. Visitor—Animal interactions at the zoo. Anthrozoös 1995, 8, 143–158. [Google Scholar] [CrossRef]
  60. Danley, B.; Sandorf, E.D.; Campbell, D. Putting your best fish forward: Investigating distance decay and relative preferences for fish conservation. J. Environ. Econ. Manag. 2021, 108, 102475. [Google Scholar] [CrossRef]
  61. McCann, C.; Powell, D.M. Is there any more room on the Ark? An analysis of space allocation in four mammalian taxa. Zoo Biol. 2019, 38, 36–44. [Google Scholar] [CrossRef] [PubMed]
  62. Powell, D.M. Collection planning for the next 100 years: What will we commit to save in zoos and aquariums? Zoo Biol. 2019, 38, 139–148. [Google Scholar] [CrossRef] [PubMed]
Figure 1. Age distribution of the responders to the STL and AZA public surveys.
Jzbg 05 00011 g001
Figure 2. Zoo and aquarium visitation history of the responders to the STL and AZA public surveys.
Jzbg 05 00011 g002
Figure 3. Relative importance of roles for zoos and aquariums when responders were asked to select up to three primary roles. Percentages represent the percentage of total responses received for that role.
Jzbg 05 00011 g003
Figure 4. Percentage of a hypothetical zoo animal collection the surveyed populations would devote to various types of animals. Note: The options of confiscated animals and non-endangered species the public does not know about were only options on the surveys of zoo professionals. Abbreviations: End., Endangered; Sp., Species.
Jzbg 05 00011 g004
Figure 5. Percentage of responses received by various categories of animals when the public was asked which kinds of animals would be the top three priorities for having in a zoo or aquarium they were designing. Abbreviations: End., Endangered; Sp., Species.
Jzbg 05 00011 g005
Figure 6. Taxonomic representation in the top 100 lists of priority animals generated when directors were asked what the top five species are for guest experience and when the public was asked what the top three species are they are hoping to see when they visit a new zoo or aquarium. Note: The directors’ list included 162 entries and the public’s list included 149 entries due to ties for last place.
Jzbg 05 00011 g006
Table 1. Entries for similar animals in lists that were collapsed into categories when calculating agreement between lists.
ComparisonCategories Collapsed for Agreement Calculation
Director-reported guest priorities vs. public’s priorities to see when visiting a new zoo/aquariumCalifornia sea lion + sea lion, elephant + African elephant + Asian elephant, camel + Bactrian camel, African lion + lion, domestic goat + goat, wildcat + felids, ray + stingray, raptor + bird of prey, large cat + big cat, cuttlefish + cephalopod, butterfly + tropical butterfly, gorilla + w. lowland gorilla, python + large constrictor snake, seal + sealion + seal/sea lion
Public’s Top 100 List vs. AZA Member Top 100 ListElephant + Asian elephant + African elephant
Public’s Top 100 List vs. AZA Director Top 100 ListElephant + Asian elephant + African elephant, orangutan + Sumatran orangutan, ray + stingray
Public’s Top 100 List vs. Zoo Personnel Top 100 ListElephant + Asian elephant + African elephant, ray + stingray
AZA Member Top 100 List vs. AZA Director Top 100 ListElephant + Asian elephant + African elephant, orangutan + Sumatran orangutan,
Public vs. AZA Member vs. AZA Director Top 100 Listsray + stingray
Table 2. Number of responders and numbers of responses provided for animals to be maintained in zoos and aquariums for the future. See methods for explanations of valid and non-generic answers.
Survey# Responders# Answers# Valid Answers# Valid, Taxonomically Assignable Answers
STL Public1420687954124490
AZA Public121711,17310,7389322
Total Public263718,05216,15013,812
AZA Members137229,17428,96525,851
AZA Directors128371437003203
Total Zoo Staff150032,88832,66529,054
Total413750,94048,81542,866
Table 3. Taxonomic composition by percentage of the top 100 and top 20 most voted for animals in the surveys.
Public
Top 100
(%)
Public
Top 20
(%)
AZA
Member
Top 100
(%)
AZA
Member
Top 20
(%)
AZA
Director
Top 100
(%)
AZA
Director
Top 20
(%)
All
Surveys
Top 100
(%)
All
Surveys
Top 20
(%)
Mammal66.075.07085.069.080.070.017.0
Bird13.010.011.95.012.410.012.01.0
Reptile6.010.07.95.011.50.09.00.0
Amphibian0.00.03.00.00.90.01.00.0
Fish8.05.03.05.03.55.04.01.0
Invertebrate7.00.04.00.02.75.04.01.0
Table 4. Mammalian taxonomic breakdown in the top 100 most voted for animals across surveys by percentage of the types of mammalian entries and percentage of mammalian responses (in parentheses).
Public Top
100 List
% of Mammal
Entries (Responses)
AZA Member
Top 100 List
% of Mammal
Entries (Responses)
AZA Director
Top 100 List
% of Mammal
Entries (Responses)
All Surveys
Top 100 List
% of Mammal
Entries (Responses)
Artiodactyla19.7 (15.1)12.7 (14.3)15.4 (17.6)14.3 (14.1)
Carnivora42.4 (45.2)45.1 (44.2)39.7 (39.2)42.9 (44.3)
Cetacea6.1 (6.8)2.8 (1.6)2.6 (1.4)4.3 (4.2)
Chiroptera1.5 (0.4)0.0 (0.0)1.3 (1.2)1.4 (0.6)
Marsupialia3.0 (2.7)7.0 (4.9)2.6 (3.0)2.9 (2.9)
Monotremata1.5 (0.3)1.4 (0.7)0.0 (0.0)1.4 (0.5)
Perissodactyla6.1 (5.3)7.0 (6.8)6.4 (6.4)7.1 (6.2)
Primates9.1 (12.8)12.7 (15.6)17.9 (17.5)14.3 (15.1)
Proboscidea3.0 (8.6)4.2 (5.2)3.8 (5.9)4.3 (7.2)
Rodentia3.0 (0.6)1.4 (0.8)2.6 (2.2)1.4 (0.5)
Sirenia1.5 (0.9)1.4 (0.9)1.3 (0.9)1.4 (1.0)
Xenarthra3.0 (1.3)4.2 (5.0)6.4 (4.8)4.3 (3.4)
Disclaimer/Publisher’s Note: The statements, opinions and data contained in all publications are solely those of the individual author(s) and contributor(s) and not of MDPI and/or the editor(s). MDPI and/or the editor(s) disclaim responsibility for any injury to people or property resulting from any ideas, methods, instructions or products referred to in the content.

