


Be Direct! Restaurant Social Media Posts to Drive Customer Engagement in Times of Crisis and Beyond

1
Unité D’enseignement et de Recherche en Sciences de la Gestion, Université du Québec en Abitibi-Témiscamingue, Rouyn-Noranda, QC J9X 5E4, Canada
2
Chaire Desjardins en Développement des Petites Collectivités, Université du Québec en Abitibi-Témiscamingue, Rouyn-Noranda, QC J9X 5E4, Canada
3
École des Sciences de la Gestion, Université du Québec à Montréal, Montreal, QC H2X 3X2, Canada
*
Author to whom correspondence should be addressed.
Tour. Hosp. 2024, 5(2), 304-313; https://doi.org/10.3390/tourhosp5020020
Submission received: 4 March 2024
/
Revised: 3 April 2024
/
Accepted: 6 April 2024
/
Published: 9 April 2024
(This article belongs to the Special Issue Strategies for Tourism and Hospitality after COVID-19)
Abstract
:Restaurants were significantly shaken by the COVID-19 pandemic, which forced them to intensify their use of social media to communicate with customers. Our objective was to identify which digital marketing strategies generated higher customer engagement during the pandemic, according to variations in the intensity of sanitary restrictions. We manually extracted 639 Facebook posts by 16 restaurants in two Canadian cities (one in a metropolitan area, one in a peripheral region), and coded them according to type of verbal move, format (image, text), and emoji use. The engagement rate was two times higher for restaurants in the metropolitan area, which also used three times more emojis per post on average. The engagement rate was also five times higher for nationally branded restaurants than for independent restaurants. When the pandemic hit, restaurants started to use more text and more directive verbal moves to convey crucial and precise information to customers, notably about sanitary restrictions. Emojis and expressive verbal moves also helped increase customer engagement. While being direct was more efficient in times of crisis, directive verbal moves continued to be used after most sanitary restrictions were lifted. Being direct, thus, appears to be a good digital marketing strategy in the “new normal”.
1. Introduction
The COVID-19 pandemic severely affected restaurant operators around the world, who had to adopt drastic solutions to comply with sanitary restrictions. They simplified their menus, reorganized their dining rooms when they were allowed to keep them open [1], or closed them completely to curb community contagion. To survive the crisis, and to keep in touch with customers, restaurant operators published on social media to explain the new and fluctuating rules of access to their establishments (modified opening hours, delivery options, compliance with sanitary restrictions) and to introduce special offers such as discounts or contests.
Social media have become an essential marketing tool in the restauration industry because they influence restaurant choice and restaurant competitiveness [2,3]. A survey of 5000 British consumers conducted in 2022 revealed that 48% used social media to decide where to have food and drinks [4]. The organizations that post on social media aim to strengthen the relationship between customers and business, increase the number of visitors to their website, identify new business opportunities, collect after-sales information, increase purchase intentions, and consolidate their brand image and brand equity [5,6]. Yet, despite the importance of social media in maintaining customer contact, and even if managers recognize that social media are important for their business [7], most restaurant operators lack knowledge of digital marketing and rely on trial and error [8].
Most studies on social media use in the restaurant industry focus on customers, and not on how managers can improve their performance by making better use of these platforms [9]. The COVID-19 pandemic offers an unprecedented case study from which to draw lessons for crisis management [10], and for more effective use of social media afterwards [11], as some of the strategies developed during the pandemic could be useful in other situations. Our objective was, thus, to look at social media use by restaurants before, during, and after the COVID-19 pandemic to assess if and how they adapted their marketing strategies according to sanitary restrictions, and to identify those that achieved highest customer engagement. We found the customer engagement rate to differ between restaurants depending on location (in a metropolitan area or a peripheral region) and belonging or not to a national brand. We also found that restaurants’ Facebook posts during the pandemic were expressive to generate emotions, and directive to convey specific directives, characteristics which remained after most sanitary restrictions were lifted. Our results provide new insights which will help restaurant operators select posting strategies to increase customer engagement, both during a crisis and beyond.
2. Literature Review
2.1. Customer Engagement in Social Media
Engagement is a process where a transactional customer, at the beginning of a relational exchange with a business, becomes more committed as they obtain satisfaction from the relationship [12]. Engagement is a concept consisting of three dimensions: cognitive, emotional, and behavioral [13]. Social media offer an opportunity for restaurants to increase the engagement level of their patrons [14] by acting on all three dimensions. They can generate emotions (e.g., “you will love our new chocolate cake”), stimulate cognitive processing (e.g., “don’t forget to bring your vaccination proof”), or encourage/discourage certain behaviors (e.g., “please honor your reservation”).
Most studies on social media engagement focus on behavioral engagement because it is “more actionable, better observable, and easier to approach from a managerial perspective” [15], and measure engagement by the summation of one of three possible reactions—likes, comments, and shares, or a combination of those reactions. We adopted the same approach as Bonsón and Ratkai [16] who measured customer engagement with the three metrics. A better understanding of social media engagement is important because it influences firm performance through its behavioral effect on purchase intentions [17] and perceived image [6]. There is a positive relation between sales on one side, and likes, share, and positive comments on the other [18]. Therefore, restaurants must invest financial and human resources in managing social media accounts to increase word-of-mouth [19], which in turn helps to increase the number of patrons [20].
2.2. Social Media Publication Content
Different aspects of a social media publication can influence customer engagement. For example, in a study of publications by Michelin-starred restaurants, posts including one to five hashtags generated fewer reactions than those with more than five hashtags [21]. However, a study of quick-service restaurants found no effect of the number of hashtags on the engagement rate [12]. In terms of language style, publications that adopt a language or story oriented toward the community the restaurant serves generate higher engagement [2]. Restaurant publications highlighting menu items or showing the establishment’s involvement within the community and adopting a conversational tone receive more reactions than publications using a language associated with selling [22,23]. Publication content and tone must also be coherent with the type of restaurant: for example, an upscale establishment will adopt a more formal communication style [24]. In this study, we opted to examine three characteristics of social media publications which could influence engagement: verbal moves (tone), media richness (use of pictures or videos), and presence of emojis.
Regarding publication tone, social media publications can be analyzed through the lens of the speech act theory (SAT) [25]. The SAT, which is “the most influential linguistic theory to study language-in-use” [26], posits that language is a reflection of one’s intentions. It is, therefore, a suitable theory to examine how language is used in social media [26]. Searle [25] created a typology of speech acts which researchers can use to categorize social media messages. More recently, Ge and Gretzel [27] adapted Searle’s typology to suggest four verbal moves and their combination: directive, assertive, commissive, and expressive. In their study of influencers on Sina Weibo, a microblogging Chinese social media like Twitter or Instagram, they found that influencers preferred using expressive verbal moves (i.e., speech acts) such as expressing emotions, over assertive verbal moves (presenting facts) or directive verbal moves (asking questions) [27]. A study of social media publications by consumer brands such as Coca-Cola and Wal-Mart found that sharing on Facebook increased when a firm alternated between various types of verbal moves, for example, using an expressive type in a first publication, then an assertive one, and finally a directive one [28].
The media richness theory [29] predicts that using a video is more engaging than using an image, which is more engaging than using a text-only publication. Nevertheless, pictures were shown to have a stronger effect on likes than videos, while the opposite was true for shares [2]. The effect on comments were similar. Posts using a combination of simple text and images (medium-level richness) garner more reactions than posts with videos (higher richness) [23,30]. One possible explanation is that images take less time to interpret than videos [23,30]. This could also explain why pictures were found to increase engagement, while links directing outside a message had the opposite effect [12].
Emojis, as simplistic drawings expressing emotions or representing various activities or objects like foods or drinks, have become ubiquitous in social media [31]. While emojis can amplify the text content in a publication [27], their use has generated mixed results. While one study [32] concluded that engagement on Facebook, in terms of number of likes, shares, and comments, is not influenced by the ratio of the number of emojis to post length, another study [33] did find that emojis have an influence on engagement. Those conflicting results could be explained by the fact that, aside from the benefit of displaying emotions, emojis can also induce a perception of clutter in a post [34].
3. Materials and Methods
This study combines qualitative and quantitative methods. Specifically, we used descriptive coding of posts made by 16 restaurants on their Facebook pages to identify the types of marketing strategies they employed. We then used statistical analyses to identify which strategies generated most engagement.
3.1. Study Setting
Restaurants in Rouyn-Noranda and Boucherville (Quebec, QC, Canada) were selected for analysis. While these cities have a similar population size and urban perimeter, they were affected differently by sanitary restrictions during the pandemic [35]. Boucherville is part of the Greater Montreal Area (hereafter GM), where 62% of the COVID cases in Quebec were declared, and which was consequently under the strictest sanitary restrictions. Rouyn-Noranda is located in a peripheral region (hereafter PR; ca. 600 km northwest of GM) much less affected by the virus, all things considered.
Facebook posts from the restaurants under study were retrieved for five one-month periods differing in terms of sanitary restrictions (Supplementary Table S1). The first period is the prepandemic reference period, when the virus was not yet present in Quebec. The second period is when sanitary restrictions were first imposed [35]. The third period coincides with a decrease in COVID-19 cases, which prompted the government to ease sanitary restrictions for the summer period. The fourth period corresponds to a new increase in COVID-19 cases that occurred in the wake of the new school year. In order to control the spread of the virus while minimizing the impact on economy, the government introduced a system of alert levels to categorize regions according to their situation related to the pandemic. The fifth period is the “new normal”, with very few sanitary restrictions.
3.2. Sampling
In order to collect enough data for analysis, eight restaurants were randomly selected in GM and PR among those which responded to the following criteria: (1) offered dining room, takeout, and/or delivery service; (2) operated independently or under a national brand (part of a restaurant chain); and (3) had an active Facebook page. Facebook was selected because, along with YouTube, it was found to be the most effective channel for restaurants in terms of generating customer engagement [36].
All 674 posts published by the 16 restaurants during the five time periods were copied manually. Initial review of the dataset resulted in the removal of 35 posts that could not be coded because they did not contain text or were “updates” automatically generated by Facebook. This procedure reduced the total number of posts analyzed to 639.
For each post, we noted the following information: restaurant name, city (GM or PR), date of publication, language, origin (original or shared content), text, and a brief description of the image/video accompanying the post, if applicable. The number of reactions was also noted (e.g., like, love, support, sad, wow, ha ha, angry), including the number of times the post was shared and the number of comments it received (i.e., each share/comment was counted as a reaction).
3.3. Data Coding
We used deductive coding to classify the information within the posts [37]. Coding followed the typology of verbal moves [27], which is an adaptation to social media posts (with written text and emojis) of the speech acts typology [25] (Table 1). Posts were coded according to type of verbal move, format (image, text, video, survey), and emoji types.
3.4. Data Compilation and Analysis
While there is no consensus on how to measure engagement on social media [38], oft-used variables are the number of likes, comments, and shares [30,39]. These, however, do not consider the fact that the number of subscribers may have an influence on the number of reactions that can be sparked by a post [40], with restaurants with a larger subscriber base being likely to obtain more feedback [41]. Hence, we selected the engagement rate as the dependent variable:
Engagement rate = ((average number of reactions/number of subscribers) × 100).
Descriptive statistics were computed for the variables considered in the analyses (Supplementary Table S2). Because the data were not normally distributed, we used Mann–Whitney U-tests to determine if the mean engagement rate was significantly different for restaurants in GM and PR, and for independent restaurants and those under a national brand. We also used a Mann–Whitney U-test to compare the mean number of emojis per post between GM and PR restaurants.
4. Results
4.1. Publication Formats
Most posts included a combination of image(s) and text (84%) or text only (12%). Other formats (image(s) only, video with or without text, survey) together accounted for only 4% of all posts and are therefore not considered here. Text-only posts were published eleven times more often in PR (22%) than in GM (2%). In addition, text-only posts increased markedly at the start of the pandemic (April 2020), before gradually decreasing towards values that remained higher in the “new normal” than in the reference period.
4.2. Engagement Rate
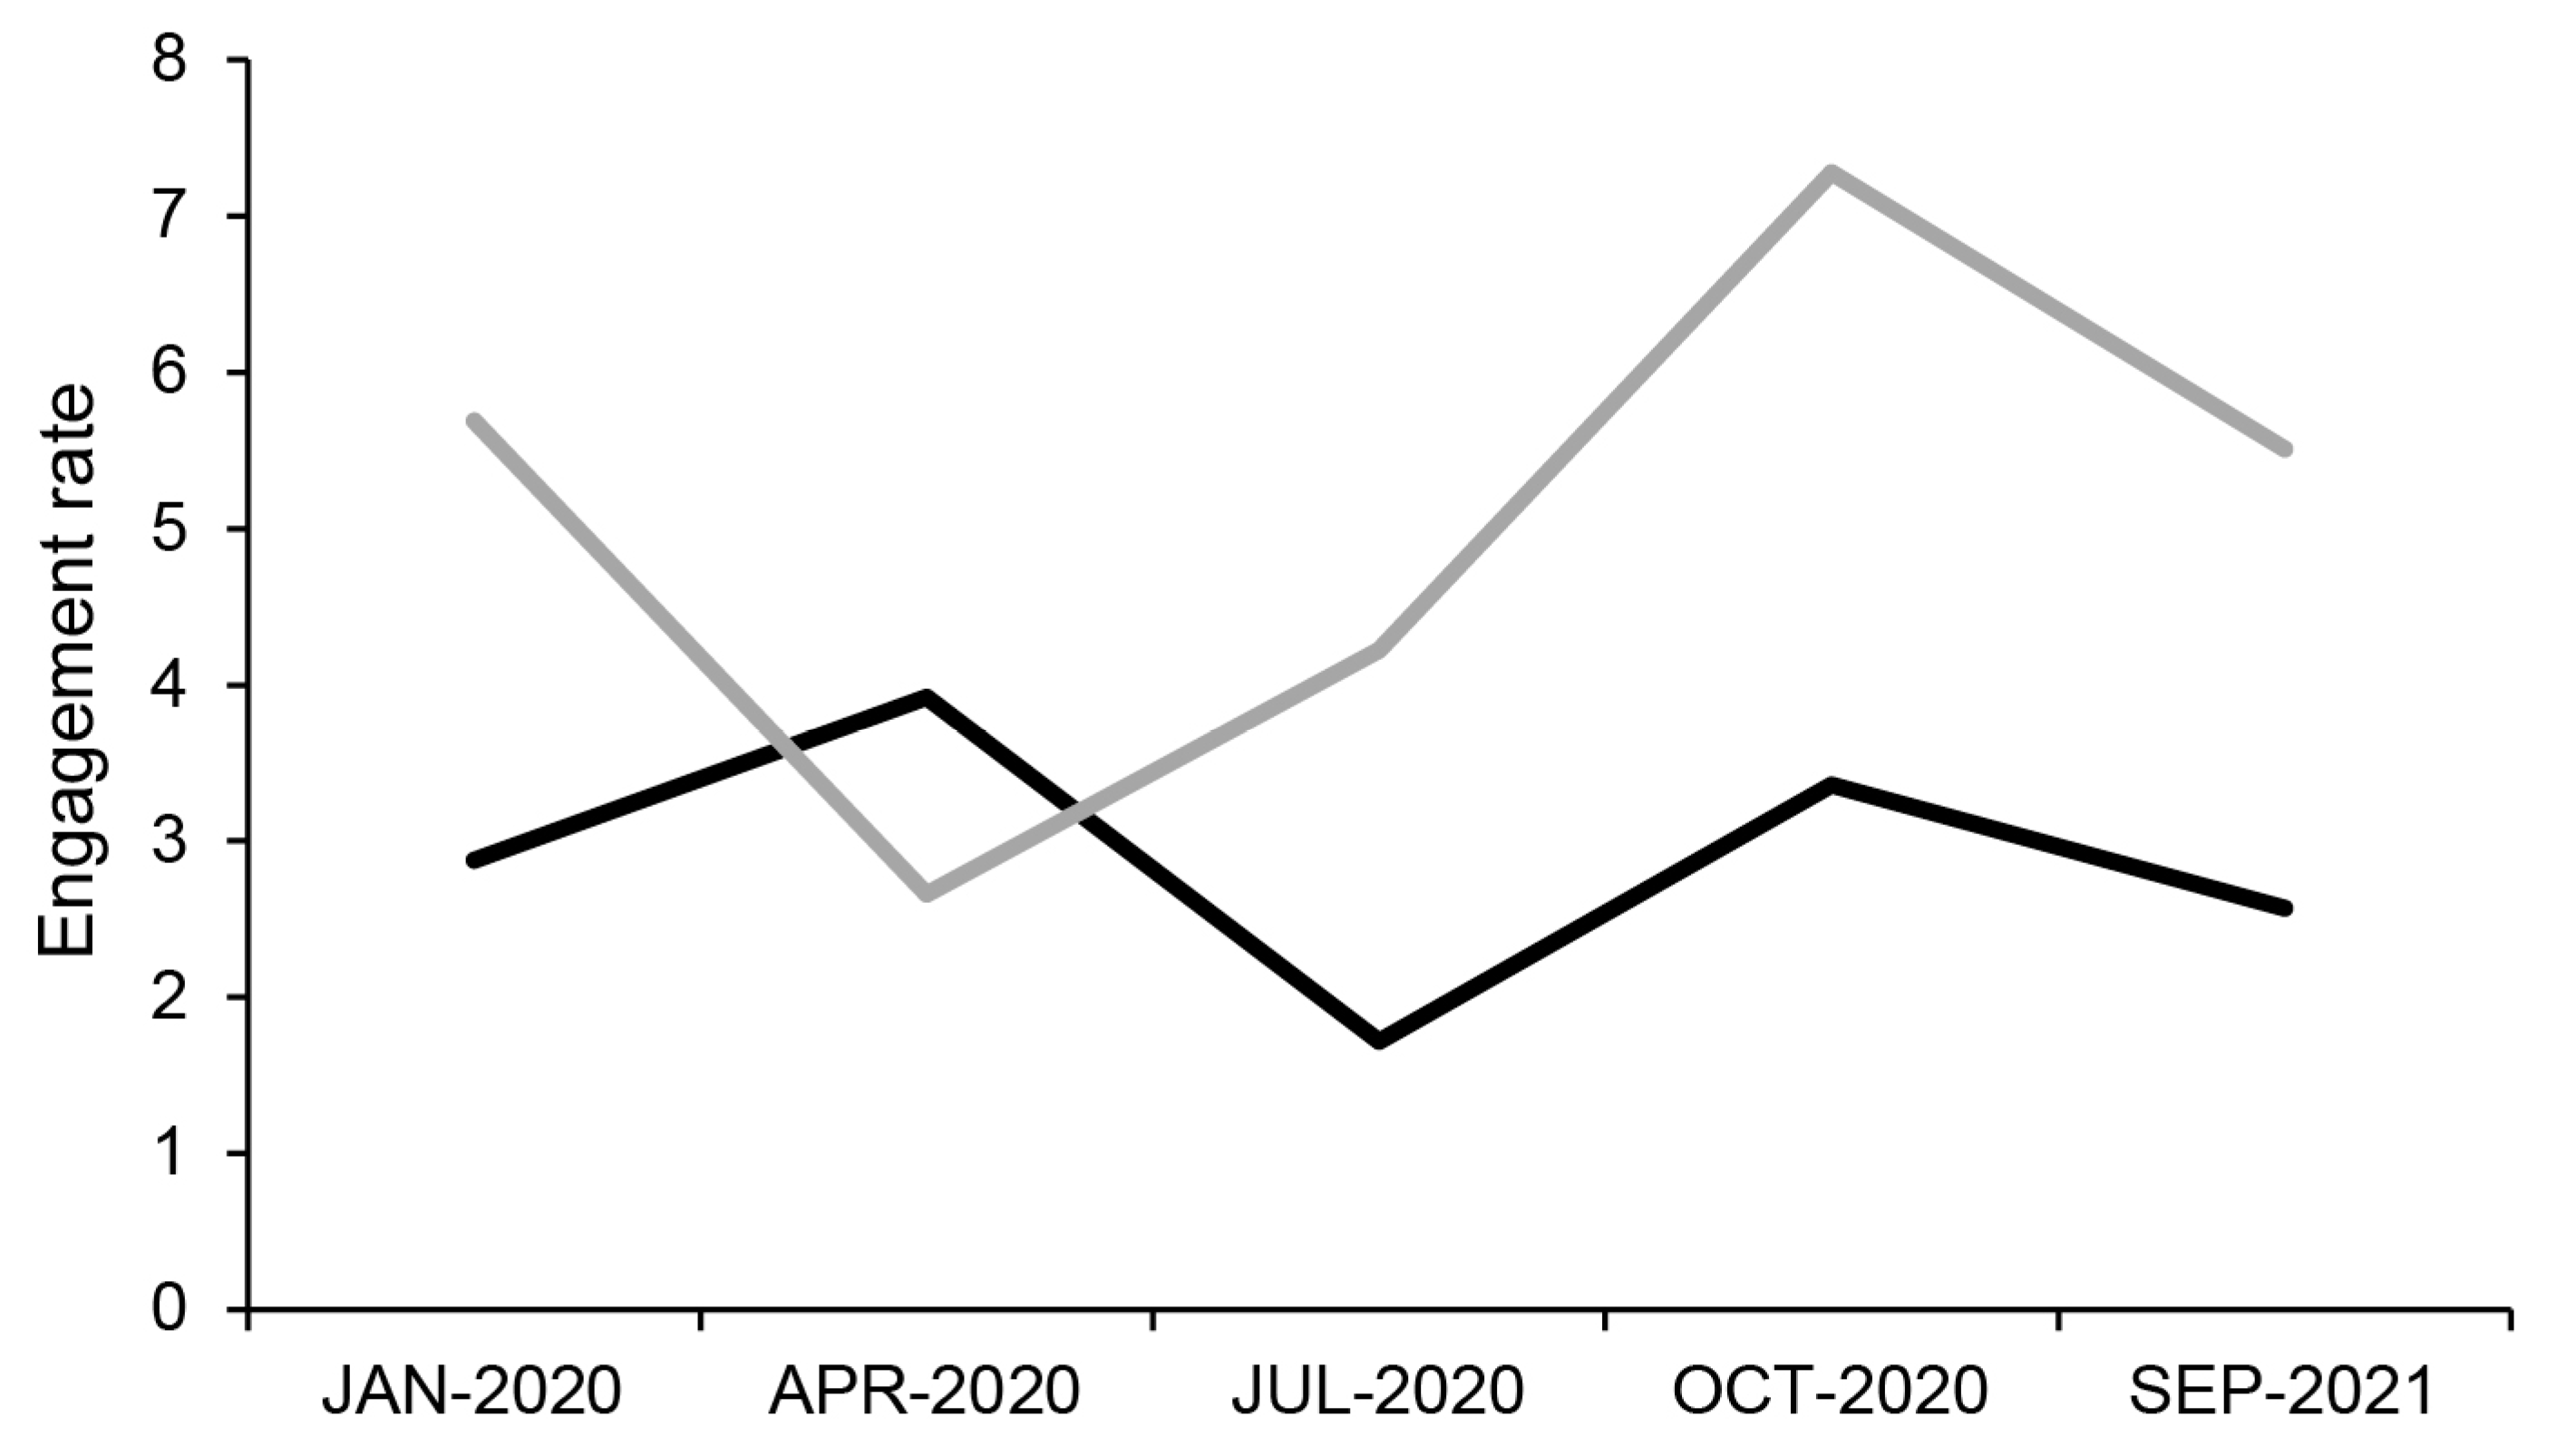
The engagement rate ((average number of reactions/number of subscribers) × 100) was more than two times higher in GM than in PR restaurants (6.00% vs. 2.89%; U = 52.000; p = 0.038). April 2020 was the only month in which the average engagement rate was similar in both cities (Figure 1). The average engagement rate of nationally branded restaurants was more than five times higher than that of independent restaurants (6.39% vs. 1.20%; U = 51.000; p = 0.022).
4.3. Types of Verbal Moves
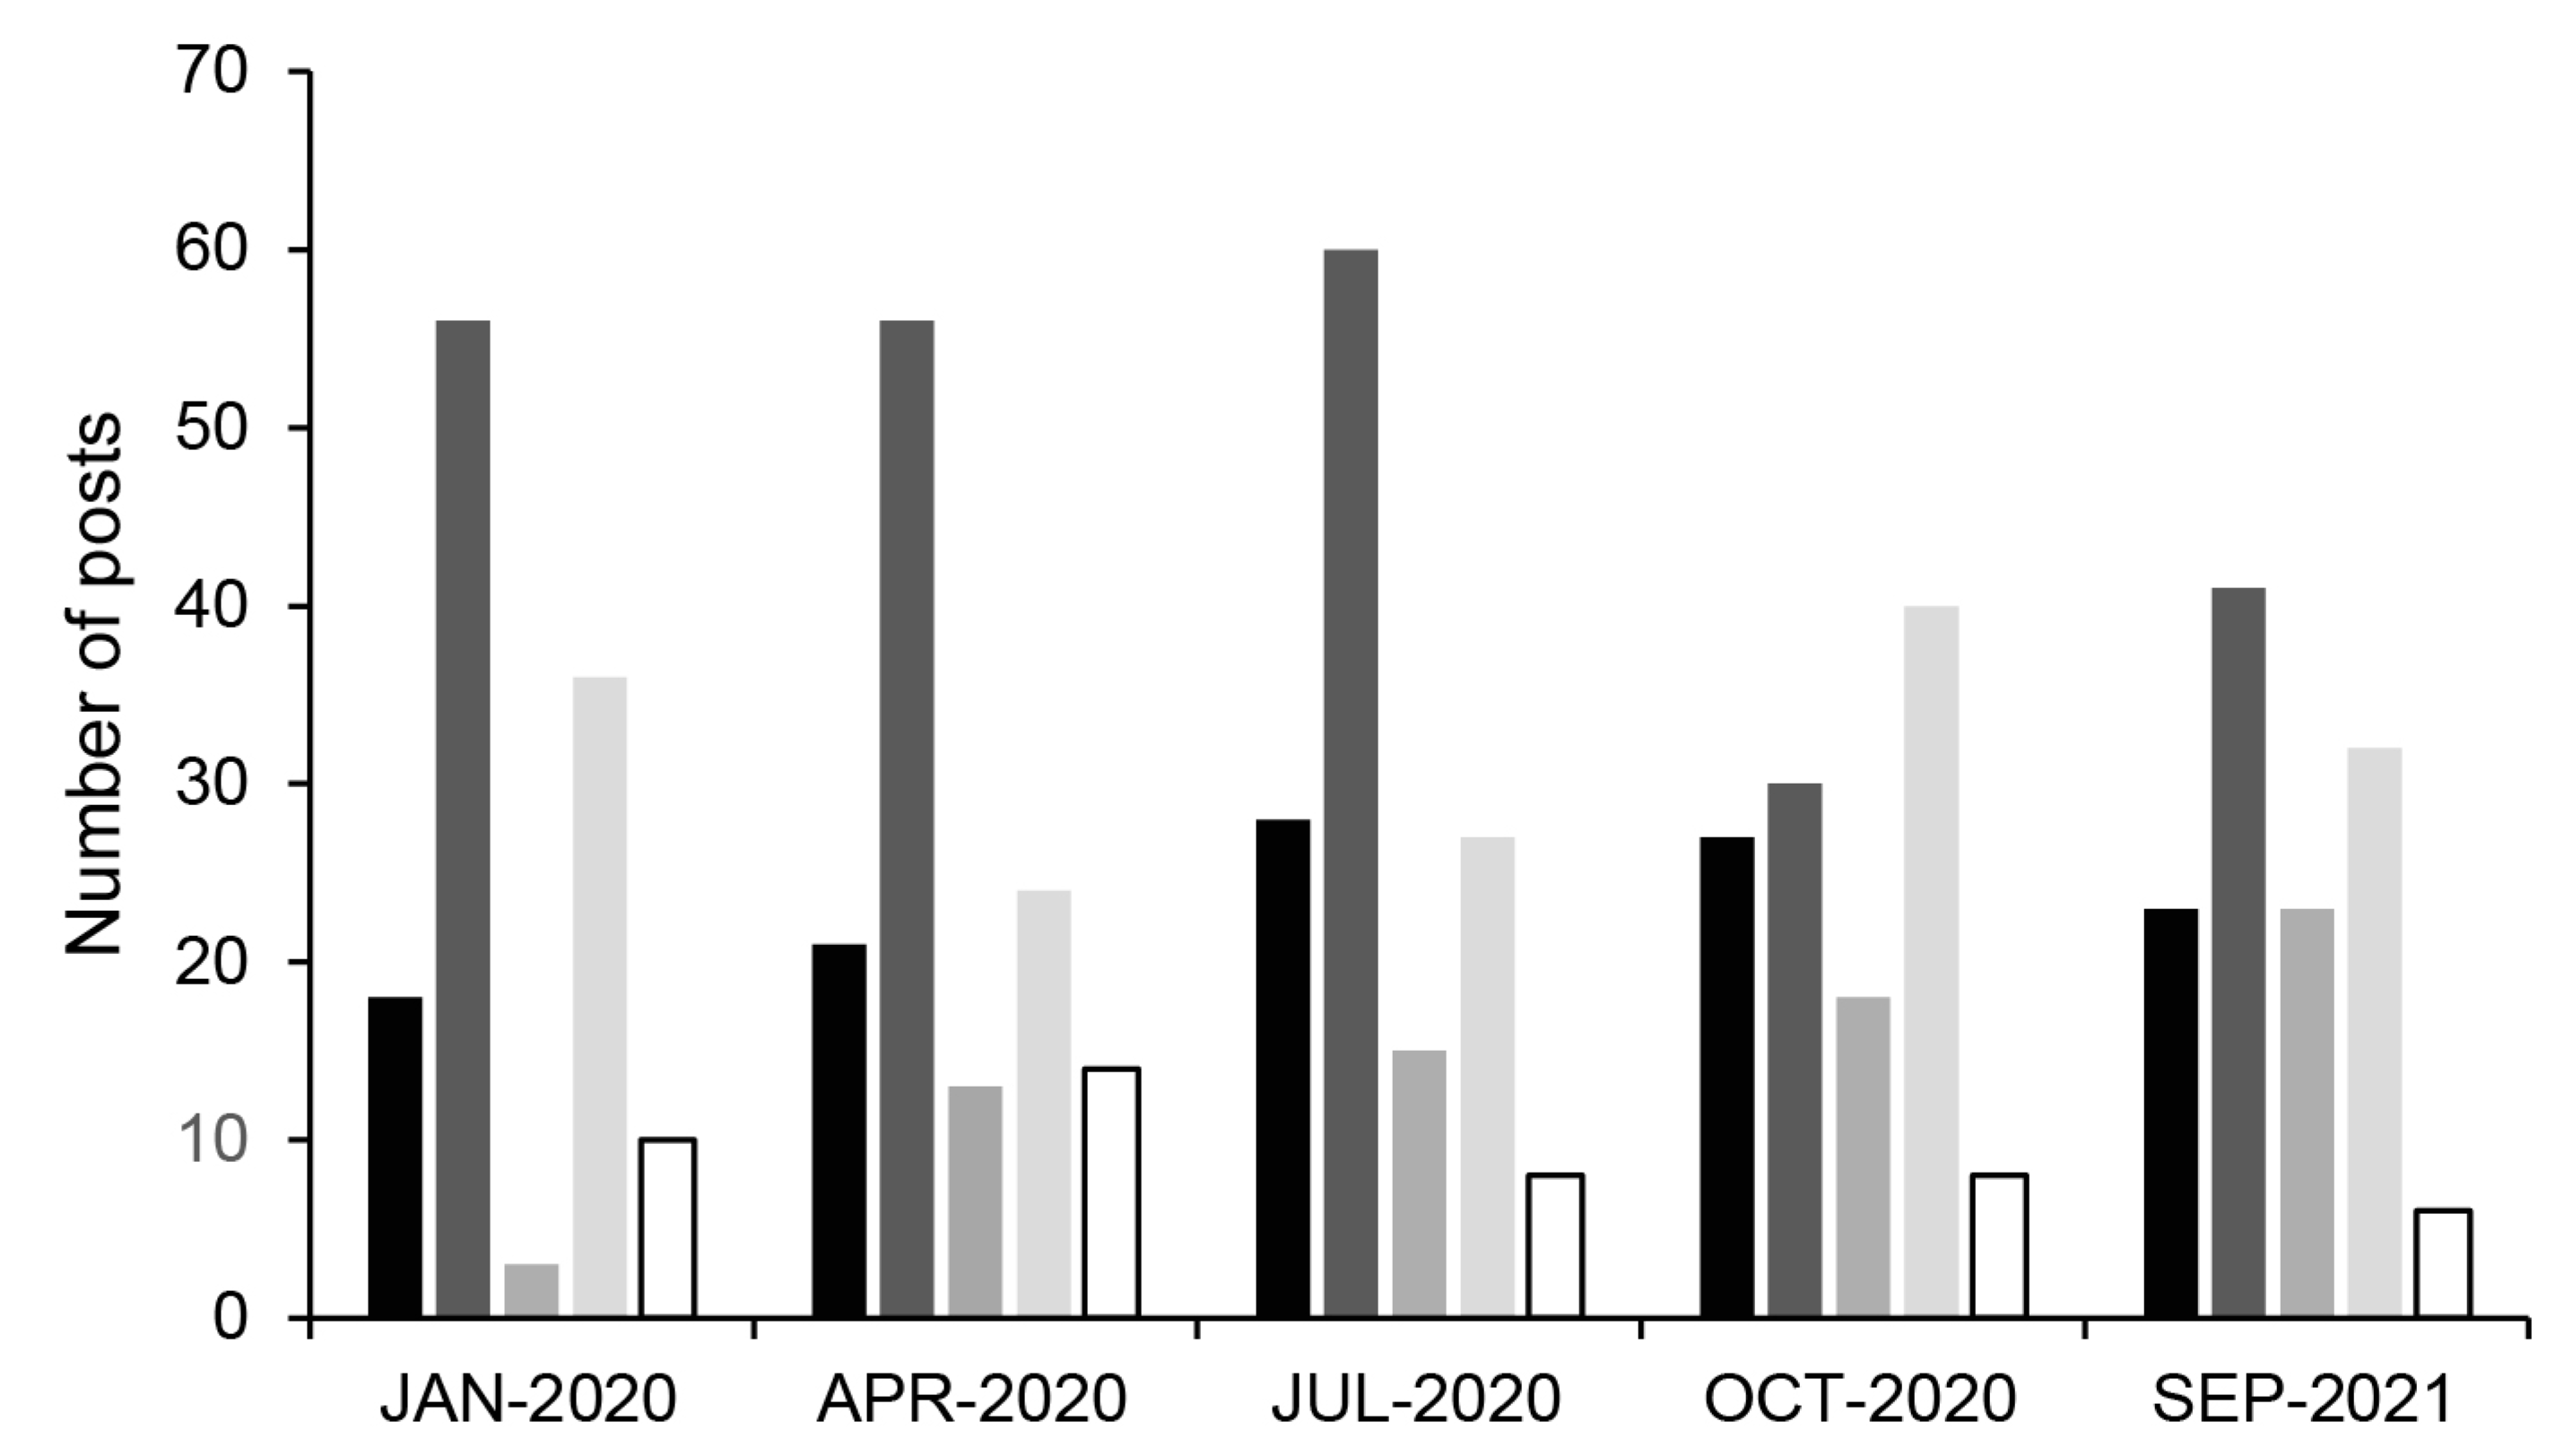
Restaurants made few posts with commissive verbal moves (engage and promise), which accounted for only 0.3% of the sample and were, thus, not analyzed. Across all time periods, restaurants favored the assertive and expressive type (inform and express/praise), which made up 38.03% of the sample. The directive and expressive type (ask and express/praise) came in second place, with 24.88% of the posts. Thus, the majority (62.91%) of published content used a combination of verbal move types.
In January, April, and July 2020, restaurants were publishing more with the assertive and expressive type, while its use dropped by half in October 2020 (Figure 2). Infrequent before the pandemic (January 2020), the directive type (ask) was used much more during and after the imposition of sanitary restrictions. The restaurants published with other types of verbal moves (directive and expressive, assertive, and expressive) in a fairly stable manner over time.
4.4. Emojis
Emojis were ubiquitous in the sample of posts, with nearly 75% containing at least one. Restaurants in GM stood out, with over three times as many emojis per post as those in PR (3.4 vs. 1.1; U = 57.000; p = 0.007). The categories “faces” and “food and beverages” were the most used by restaurants in both cities. The two periods with the highest average number of emojis per post were April and October 2020.
5. Discussion
5.1. Publication Formats
5.2. Engagement Rate
The engagement rate of a Facebook post is, on average, 3.4% [43]. Posts from the restaurants in GM were above this benchmark, while those in PR only managed to exceed it in April 2020. This period coincides with the start of the pandemic. At that time, it is interesting to note that the engagement rate reacted in opposite ways in PR, where it increased, and in GM, where it decreased. This might be explained by the different demographic characteristics of the two studied regions. In smaller communities (such as PR), people might feel more responsible for the survival of their restaurants and, therefore, increase their support.
The engagement rate of a Facebook page decreases when its number of followers increases [44]. Indeed, in 2020, the average engagement rate for a publication was 8.21% for pages with fewer than 10,000 subscribers, compared to 2.19% for pages with more than 10,000 subscribers [44]. Among the restaurants we studied, the four that had more than 5000 subscribers had some of the lowest engagement rates (<2%), whereas the five with the highest engagement rates (>4%, including three with >14%) had fewer than 2500 subscribers (three of the five had fewer than 1000 subscribers). This result bolsters the assertion that after a certain threshold of subscribers is reached (a critical mass), additional subscribers are less committed to the company [44,45].
Restaurants that belong to a national brand had a much higher engagement rate, likely because they had more financial resources to invest in marketing activities than independent restaurants [46,47]. For example, they may have benefited from the expertise of graphic design and community management professionals paid by the head office.
5.3. Types of Verbal Moves
The restaurants we analyzed made little use of commissive verbal moves (engage and promise) in their Facebook posts, which confirms that these are rarely used by firms to promote their brand [28]. This is probably related to the fact that they feared being publicly criticized if they did not follow on their promises [27]. Nearly two-thirds of the publications analyzed used a combination of verbal moves, either assertive and expressive (38%) or directive and expressive (25%). The fact that both combinations include the expressive type suggests that restaurants were somewhat aware that users are more engaged with posts with exclamative sentences than affirmative ones [39,48].
The proportion of directive verbal moves increased at the beginning of the pandemic, in April 2020. This situation then continued until September 2021. Two factors may explain this increase in the use of directive moves. First, restaurants might have asked their customers more directly to acquire their products/services to help them get through the crisis [23]. Maybe customers were more prompted to engage because several restaurants offered promotions or discounts in exchange for an action (comment and/or share a post) [40]. Although such strategies can increase engagement, the effect may be temporary [49,50]. Second, restaurants had to give specific instructions to customers during the pandemic (e.g., mandatory mask wearing, need to have a vaccinal proof and respect social distancing), which required publications with direct verbal moves.
5.4. Emojis
In April and October 2020, posts displayed a higher average number of emojis. These periods were characterized by more severe sanitary restrictions than the other periods. Restaurants may have published more emojis to elicit positive emotions, as Facebook users tend to comment more on emotionally charged posts [48].
6. Conclusions and Practical Implications
Our analysis of marketing strategies in social media during the pandemic highlighted the need for restaurant operators to be direct in their posts and to express their emotions, in times of crisis and beyond.
As this is one of the first studies to look at restaurants’ social media strategies during the pandemic, our research was exploratory and, therefore, has its limitations. First, the sample size of 639 Facebook posts from 16 restaurants in two Canadian cities could be expanded to a larger dataset and to other social media in future studies. Second, as we focused on the effect of social media posts on customer engagement, future studies could investigate the outcomes of various engagement rates, particularly on restaurant sales.
Restaurant operators should pay close attention to their social media and publish in a consistent manner since it is a place of exchange with their clients, current and potential [22]. Surprisingly, the restaurants who succeeded the most in terms of engagement were not those with the highest number of subscribers, but those who effectively used their social media. Hence, restaurants should learn from the best and observe what strategies are used by successful restaurants to generate engagement [23,24].
Restaurant posts should include a combination of image(s) and short text, as images capture customers’ attention and short text takes less time to read. The use of expressive verbal moves (alone or in combination) should also be preferred to maintain engagement [39,48]. As emotions elicit more reactions, restaurants should include emojis in their posts, as they increase consumers’ purchase intentions [51].
Finally, restaurants can increase the attractiveness of their posts by stimulating exchanges with customers and generating positive comments [52]. Our results show that this can be achieved by being (more) direct. For example, restaurants can run contests or promotions where they ask customers to take actions (click on “like”, share, comment). Being direct is more efficient in times of crisis, when crucial and precise information needs to be conveyed to customers. Still, the restaurants we studied continued to use directive verbal moves when most sanitary restrictions were relieved in September 2021. Hence, a key take-home message from our work is that being direct appears to be a good marketing strategy in the “new normal” period.
Supplementary Materials
The following supporting information can be downloaded at https://www.mdpi.com/article/10.3390/tourhosp5020020/s1. Table S1: The five periods under study, differentiated by the intensity of the COVID-19 pandemic and sanitary restrictions; Table S2: Data summary for the sampled restaurants.
Author Contributions
Conceptualization, B.B. and D.M.; methodology, B.B. and D.M.; formal analysis, D.M., H.A. and B.B.; investigation, D.M.; data curation, D.M.; writing—original draft preparation, D.M.; writing—review and editing, B.B. and H.A.; supervision, B.B. and H.A.; project administration, B.B. All authors have read and agreed to the published version of the manuscript.
Funding
This research received no external funding.
Institutional Review Board Statement
Not applicable.
Informed Consent Statement
Not applicable.
Data Availability Statement
The raw data supporting the conclusions of this article will be made available by the authors on request.
Conflicts of Interest
The authors declare no conflicts of interest.
References
- Yost, E.; Kizildag, M.; Ridderstaat, J. Financial recovery strategies for restaurants during COVID-19: Evidence from the US restaurant industry. J. Hosp. Tour. Manag. 2021, 47, 408–412. [Google Scholar] [CrossRef]
- Gruss, R.; Kim, E.; Abrahams, A. Engaging restaurant customers on Facebook: The power of belongingness appeals on social media. J. Hosp. Tour. Res. 2020, 44, 201–228. [Google Scholar] [CrossRef]
- Singh, S.; Singh, G.; Dhir, S. Impact of digital marketing on the competitiveness of the restaurant industry. J. Foodserv. Bus. Res. 2022, 27, 109–137. [Google Scholar] [CrossRef]
- Seo, J. Nearly Half of Consumers Use Social Media for Food and Drink Recommendations. Available online: https://www.thecaterer.com/news/nearly-half-consumers-social-media-food-and-drink-recommendations (accessed on 2 March 2024).
- Kamboj, S.; Sarmah, B.; Gupta, S.; Dwivedi, Y. Examining branding co-creation in brand communities on social media: Applying the paradigm of stimulus-organism-response. Int. J. Inform. Manag. 2018, 39, 169–185. [Google Scholar] [CrossRef]
- Lima, M.M.; Mainardes, E.; Cavalcanti, A.L. Influence of social media on restaurant consumers: A case study of Crab island restaurant. J. Foodserv. Bus. Res. 2019, 22, 413–432. [Google Scholar] [CrossRef]
- DiPietro, R.B.; Crews, T.B.; Gustafson, C.; Strick, S. The use of social networking sites in the restaurant industry: Best practices. J. Foodserv. Bus. Res. 2012, 15, 265–284. [Google Scholar] [CrossRef]
- Roy, A.; Dionne, C. Social media and SMEs: How to remove the barriers and improve organisational performance? In Proceedings of the 3rd European Conference on Social Media Research, Caen, France, 12–13 July 2016. [Google Scholar]
- Lepkowska-White, E.; Parsons, A. Strategies for monitoring social media for small restaurants. J. Foodserv. Bus. Res. 2019, 22, 351–374. [Google Scholar] [CrossRef]
- Li, B.; Zhang, T.; Chen, Y.; Hua, N. The learning model of crisis management: The COVID-19 case in the hospitality industry. Consum. Behav. Tour. Hosp. 2022, 17, 468–490. [Google Scholar] [CrossRef]
- Gursoy, D.; Chi, C.G. Effects of COVID-19 pandemic on hospitality industry: Review of the current situations and a research agenda. J. Hosp. Mark. Manag. 2020, 29, 527–529. [Google Scholar] [CrossRef]
- Sashi, C.M.; Brynildsen, G.; Bilgihan, A. Social media, customer engagement and advocacy. Int. J. Contemp. Hosp. Manag. 2019, 31, 1247–1272. [Google Scholar] [CrossRef]
- Hollebeek, L.D.; Glynn, M.S.; Brodie, R.J. Consumer brand engagement in social media: Conceptualization, scale development and validation. J. Interact. Mark. 2014, 28, 149–165. [Google Scholar] [CrossRef]
- Dolan, R.; Conduit, J.; Fahy, J.; Goodman, S. Social media engagement behaviour: A uses and gratifications perspective. J. Strat. Mark. 2016, 24, 261–277. [Google Scholar] [CrossRef]
- Schaefers, T.; Falk, T.; Kumar, A.; Schamari, J. More of the same? Effects of volume and variety of social media brand engagement behavior. J. Bus. Res. 2021, 135, 282–294. [Google Scholar] [CrossRef]
- Bonsón, E.; Ratkai, M. A set of metrics to assess stakeholder engagement and social legitimacy on a corporate Facebook page. Online Inform. Rev. 2013, 37, 787–803. [Google Scholar] [CrossRef]
- de Oliveira Santini, F.; Ladeira, W.J.; Pinto, D.C.; Herter, M.M.; Sampaio, C.H.; Babin, B.J. Customer engagement in social media: A framework and meta-analysis. J. Acad. Mark. Sci. 2020, 48, 1211–1228. [Google Scholar] [CrossRef]
- Han, W.; Ozdemir, O.; Agarwal, S. Linking social media marketing to restaurant performance—The moderating role of advertising expenditure. J. Hosp. Tour. Insights, 2023; ahead-of-print. [Google Scholar] [CrossRef]
- Kim, W.G.; Li, J.; Brymer, R.A. The impact of social media reviews on restaurant performance: The moderating role of excellence certificate. Int. J. Hosp. Manag. 2016, 55, 41–51. [Google Scholar] [CrossRef]
- Burkov, I.; Gorgadze, A.; Trabskaia, I. Satisfaction dimensions influencing consumers’ behavioral intentions through structural topic modeling analysis of restaurant reviews. Consum. Behav. Tour. Hosp. 2023, 18, 200–214. [Google Scholar] [CrossRef]
- Fissi, S.; Gori, E.; Marchi, V.; Romolini, A. Social media, brand communication and customer engagement in Michelin-starred restaurants during a time of crisis. Br. Food J. 2022, 125, 16–33. [Google Scholar] [CrossRef]
- Fox, G.; Longart, P. Electronic word-of-mouth: Successful communication strategies for restaurants. Tour. Hosp. Manag. 2016, 22, 211–223. [Google Scholar] [CrossRef]
- Kwok, L.; Yu, B. Spreading social media messages on Facebook: An analysis of restaurant business-to-consumer communications. Cornell Hosp. Quart. 2013, 54, 84–94. [Google Scholar] [CrossRef]
- Dossena, C.; Mochi, F.; Bissola, R.; Imperatori, B. Restaurants and social media: Rethinking organizational capabilities and individual competencies. J. Tour. Futures 2021, 7, 20–39. [Google Scholar] [CrossRef]
- Searle, J.R. A taxonomy of illocutionary acts. In Expression and Meaning: Studies in the Theory of Speech Acts; Searle, J.R., Ed.; Cambridge University Press: Cambridge, UK, 1979; pp. 1–29. [Google Scholar]
- Ludwig, S.; de Ruyter, K. Decoding social media speak: Developing a speech act theory research agenda. J. Consum. Mark. 2016, 33, 124–134. [Google Scholar] [CrossRef]
- Ge, J.; Gretzel, U. Emoji rhetoric: A social media influencer perspective. J. Mark. Manag. 2018, 34, 1272–1295. [Google Scholar] [CrossRef]
- Villarroel Ordenes, F.; Grewal, D.; Ludwig, S.; Ruyter, K.D.; Mahr, D.; Wetzels, M.; Morwitz, V.; Kopalle, P. Cutting through content clutter: How speech and image acts drive consumer sharing of social media brand messages. J. Consum. Res. 2019, 45, 988–1012. [Google Scholar] [CrossRef]
- Daft, R.L.; Lengel, R.H. Organizational information requirements, media richness and structural design. Manag. Sci. 1986, 32, 554–571. [Google Scholar] [CrossRef]
- Luarn, P.; Lin, Y.F.; Chiu, Y.P. Influence of Facebook brand-page posts on online engagement. Online Inform. Rev. 2015, 39, 505–519. [Google Scholar] [CrossRef]
- Zhang, J.; Xie, C.; Chen, Y.; Lin, Z. How risk messages influence tourist processing and sharing: The role of emojis. J. Hosp. Tour. Manag. 2023, 56, 454–468. [Google Scholar] [CrossRef]
- Deng, Q.; Hine, M.J.; Ji, S.; Wang, Y. Understanding consumer engagement with brand posts on social media: The effects of post linguistic styles. Electr. Comm. Res. Appl. 2021, 48, 101068. [Google Scholar] [CrossRef]
- Yuen, K.F.; Ong, K.W.; Zhou, Y.; Wang, X. Social media engagement of stakeholders in the oil and gas sector: Social presence, triple bottom line and source credibility theory. J. Clean. Prod. 2023, 382, 135375. [Google Scholar] [CrossRef]
- Bashirzadeh, Y.; Mai, R.; Faure, C. How rich is too rich? Visual design elements in digital marketing communications. Int. J. Res. Mark. 2022, 39, 58–76. [Google Scholar] [CrossRef]
- INSPQ—Institut National de Santé Publique du Québec. Ligne du Temps COVID-19 au Québec. Available online: https://www.inspq.qc.ca/covid-19/donnees/ligne-du-temps (accessed on 2 March 2024).
- Li, J.; Kim, W.G.; Choi, H.M. Effectiveness of social media marketing on enhancing performance: Evidence from a casual-dining restaurant setting. Tour. Econ. 2019, 27, 3–22. [Google Scholar] [CrossRef]
- Azungah, T. Qualitative research: Deductive and inductive approaches to data analysis. Qual. Res. J. 2018, 18, 383–400. [Google Scholar] [CrossRef]
- Schultz, D.E.; Peltier, J.J. Social media’s slippery slope: Challenges, opportunities and future research directions. J. Res. Interact. Mark. 2013, 7, 86–99. [Google Scholar] [CrossRef]
- Pino, G.; Peluso, A.M.; Del Vecchio, P.; Ndou, V.; Passiante, G.; Guido, G. A methodological framework to assess social media strategies of event and destination management organizations. J. Hosp. Mark. Manag. 2019, 28, 189–216. [Google Scholar] [CrossRef]
- Schultz, C.D. Proposing to your fans: Which brand post characteristics drive consumer engagement activities on social media brand pages? Electr. Comm. Res. Appl. 2017, 26, 23–34. [Google Scholar] [CrossRef]
- Aydin, G. Social media engagement and organic post effectiveness: A roadmap for increasing the effectiveness of social media use in hospitality industry. J. Hosp. Mark. Manag. 2020, 29, 1–21. [Google Scholar] [CrossRef]
- Li, Y.; Xie, Y. Is a picture worth a thousand words? An empirical study of image content and social media engagement. J. Mark. Res. 2020, 57, 1–19. [Google Scholar] [CrossRef]
- Hubspot. 60 Chiffres et Statistiques sur les Réseaux Sociaux. Available online: https://blog.hubspot.fr/marketing/chiffres-reseaux-sociaux (accessed on 13 June 2023).
- Kemp, S. Digital 2020: Global Digital Overview. Available online: https://datareportal.com/reports/digital-2020-global-digital-overview (accessed on 2 March 2024).
- Hubspot. How often Should You Post on Facebook? [New Benchmark Data]. Available online: https://blog.hubspot.com/marketing/facebook-post-frequency-benchmarks#sm.00005x98lq12afhsyx41k4r79b6f9 (accessed on 2 March 2024).
- Li, H.; Yu, B.X.B.; Li, G.; Gao, H. Restaurant survival prediction using customer-generated content: An aspect-based sentiment analysis of online reviews. Tour. Manag. 2023, 96, 104707. [Google Scholar] [CrossRef]
- Norris, C.L.; Russen, M.; Taylor, S. Expanding the experiential value scale to predict independent restaurant dining intent. J. Hosp. Tour. Insights 2022, 6, 613–631. [Google Scholar] [CrossRef]
- Swani, K.; Milne, G.R.; Brown, B.P.; Assaf, A.G.; Donthu, N. What messages to post? Evaluating the popularity of social media communications in business versus consumer markets. Industr. Mark. Manag. 2017, 62, 77–87. [Google Scholar] [CrossRef]
- Harmeling, C.M.; Moffett, J.W.; Arnold, M.J.; Carlson, B.D. Toward a theory of customer engagement marketing. J. Acad. Mark. Sci. 2017, 45, 312–335. [Google Scholar] [CrossRef]
- Kaur, H.; Paruthi, M.; Islam, J.; Hollebeek, L.D. The role of brand community identification and reward on consumer brand engagement and brand loyalty in virtual brand communities. Telem. Inform. 2020, 46, 101321. [Google Scholar] [CrossRef]
- Das, G.; Wiener, H.J.; Kareklas, I. To emoji or not to emoji? Examining the influence of emoji on consumer reactions to advertising. J. Bus. Res. 2019, 96, 147–156. [Google Scholar] [CrossRef]
- Bronner, F.; De Hoog, R. Consumer-generated versus marketer-generated websites in consumer decision making. Int. J. Mark. Res. 2010, 52, 231–248. [Google Scholar] [CrossRef]
Figure 1.
Engagement rate according to study period in GM (grey) and PR (black) restaurants.

Figure 2.
Types of verbal moves used by restaurants according to period. Black = assertive; dark grey = assertive and expressive; medium grey = directive; light grey = directive and expressive; white = expressive.
Figure 2.
Types of verbal moves used by restaurants according to period. Black = assertive; dark grey = assertive and expressive; medium grey = directive; light grey = directive and expressive; white = expressive.


Table 1.
Types of verbal moves (adapted from [27]).
Table 1.
Types of verbal moves (adapted from [27]).
| Verbal Move | Description | Examples |
|---|---|---|
| Assertive | Provide information; present facts relating to the restaurant’s products and services (including the process to acquire products/services). | Don’t forget that as of tomorrow, the mask is mandatory when moving around in the restaurant! 😉 |
| Directive | Ask customers questions, ask them to react, comment or share the post. | Duel of smoothies 👉 Do you prefer the “Aloha” with mango, peaches and pineapple juice, or the “Avocado” with apples, mint and pineapple juice? 📷 |
| Commissive | Commit to a plan; promise customers to do something. | Return of delivery to [name of restaurant]! We promise to go as fast as possible, we promise! 😛 |
| Expressive | Praise the products/services offered by the restaurant. Express attitudes towards something or someone. Express emotions. | A huge thank you for your sharing and your help in connection with the vandalism done on [our premises]![…] Vandalism is probably one of the most cowardly things, let’s continue to help each other to counter it. […] The author of all this does not know it yet, but the vice is tightening on him… 😉 Good day everyone and thank you again! 😉 |
| Directive and expressive | Decadent dessert* With such intense heat, nothing better than finishing the meal with our delicious Chao bao with ice cream topped with our homemade strawberry coulis! It’s decadent, but it’s good! Who will you share it with? | |
| Assertive and expressive | We are waiting for you for lunch until 4 p.m.! For delivery call XXX-XXXX! Have a great start to the weekend! |
Disclaimer/Publisher’s Note: The statements, opinions and data contained in all publications are solely those of the individual author(s) and contributor(s) and not of MDPI and/or the editor(s). MDPI and/or the editor(s) disclaim responsibility for any injury to people or property resulting from any ideas, methods, instructions or products referred to in the content. |
© 2024 by the authors. Licensee MDPI, Basel, Switzerland. This article is an open access article distributed under the terms and conditions of the Creative Commons Attribution (CC BY) license (https://creativecommons.org/licenses/by/4.0/).
Share and Cite
MDPI and ACS Style
Manningham, D.; Asselin, H.; Bourguignon, B. Be Direct! Restaurant Social Media Posts to Drive Customer Engagement in Times of Crisis and Beyond. Tour. Hosp. 2024, 5, 304-313. https://doi.org/10.3390/tourhosp5020020
AMA Style
Manningham D, Asselin H, Bourguignon B. Be Direct! Restaurant Social Media Posts to Drive Customer Engagement in Times of Crisis and Beyond. Tourism and Hospitality. 2024; 5(2):304-313. https://doi.org/10.3390/tourhosp5020020
Chicago/Turabian StyleManningham, Daphnée, Hugo Asselin, and Benoit Bourguignon. 2024. "Be Direct! Restaurant Social Media Posts to Drive Customer Engagement in Times of Crisis and Beyond" Tourism and Hospitality 5, no. 2: 304-313. https://doi.org/10.3390/tourhosp5020020