1. Introduction
Climate change is considered by the United Nations World Tourism Organization (UNWTO) and other leading international tourism organizations to be the greatest threat to sustainable tourism in the 21st century [
1,
2,
3,
4]. The tourism sector accounts for 8–10% of total global carbon (CO
2e) emissions [
5] To avoid the worst consequences of climate change and achieve the Paris Climate Agreement goal of limiting global warming to ‘well below 2 °C above pre-industrial levels’, in 2021, the Government of Canada joined more than 70 countries in establishing net zero emission reduction targets under the Canadian Net Zero Emissions Accountability Act. With drive tourism being on the rise in response to post COVID-19 pandemic tourism recovery, record-breaking temperatures in many regions of Canada in 2023, continued rising national greenhouse gas emissions, and persistently high gas prices in the news, 100% electric vehicles (EVs) are an important policy strategy for Canada’s transition to low-carbon and more sustainable transportation and tourism [
6]. However, little attention has been given to the EV transition as a strategy to decarbonize tourism [
7,
8,
9,
10] or its implications for access to destinations and travel patterns. Despite the forecasted EV market growth globally and nationally expected to represent half of new car sales by 2030 [
11,
12,
13], the EV transition’s role in decarbonizing tourism remains poorly understood globally and in Canada.
Canada’s transportation sector is the second-largest contributor to national GHG emissions (approximately 25% annually), and the single largest source of Canadians’ personal emissions [
14]. To address this key source of emissions, the Government of Canada’s 2030 Emissions Reduction Plan and Electric Vehicle Availability Standard includes a mandate to transition away from internal combustion engine (ICE) vehicles, reaching 20% zero-emission new light-duty vehicle sales by 2026, rising to 60% by 2030 and 100% by 2035 [
15,
16]. With the provinces of British Columbia, Ontario, Quebec, Newfoundland, PEI, New Brunswick, and Nova Scotia providing EV purchase incentives, EVs are becoming more prominent in Canada with a potential increase of 63% in the market share of all vehicle sales between 2017 and 2040 for fully electric (EV) and plug-in hybrid electric vehicles (PHEV) [
6,
17,
18]. This accelerating EV transition is constrained by the network of charging stations, pushing governments to prepare both the infrastructure and electricity grids for the uptake of electric vehicles [
18].
The Canadian government has therefore pledged
$1.2 billion to support zero-emission vehicle adoption through a combination of investments and regulations to help Canadians and industry in the transition [
16,
18]. This includes the Zero Emission Vehicle Infrastructure Program, a 5-year,
$280 million program, increasing the availability of charging stations across Canada where “Canadians live, work and play” and the Electric Vehicle Availability Standard investment to build 84,500 additional chargers. Throughout Canada, cities have amended zoning and construction legislation to include the ability to have Level 2 EV charging in residential apartments, and/or all residential spaces, as well as many non-residential spaces [
19,
20,
21]. Level 2 equipment is common for homes, workplaces, and public charging, and can charge the battery of an EV to 80% from empty in 4–10 h. By comparison, a Level 1 charger takes 11–20 h to fully charge an EV and a Level 3 charger can deliver a similar charge in 15 to 45 min. The province of Quebec has also mandated that all new single-dwelling homes built after 2018 have the electrical capacity to support Level 2 charging [
20]. While Canada’s cities are increasingly equipped to support EV drivers and commuters with charging options in a growing range of locations, like shopping malls, restaurants, libraries, and offices, options where Canadians engage in recreation and tourism travel remain far more limited.
While PHEVs are able to fill up at gas stations when necessary, a common concern raised by the growing EV community is the inability for EVs to access outdoor recreation areas or more distant destinations such as national parks due to the underdeveloped charging infrastructure in many areas [
17,
22]. Having Level 3 charging corridors is a key solution to aid in the transition towards EV-based tourism, with examples in some leading destinations in Europe [
23]. Across Canada, public and private initiatives are beginning to improve charging and overcome connectivity challenges. For example:
The Ontario Government is spending
$91 million to increase electric vehicle charging infrastructures in rural municipalities [
22];
BC’s Clean Energy Vehicle Program is adding 50 new Level 3 charging stations to allow inter-city travel with an “EV Tourism” approach [
24];
The Peaks to Prairies [
25] network initiative across Southern Alberta is installing 19 Level 3 chargers;
Accelerate Kootenays in BC is spending
$2 million by adding 57 chargers including 13 Level 3 chargers to the region [
26];
A public–private partnership with Tesla is donating 350 free Level 2 chargers across 50 Parks Canada locations (currently 172 stations are active in 28 parks) [
27];
The EPCOR Utilities GO EV Program is sharing the costs of installing public charging stations [
28].
Private initiatives such as PetroCan’s Electric Highway along the trans-Canada highway will further increase inter-city connectivity across Canada [
29].
While the public and private investment into EV charging infrastructure is promising in addressing Canadians’ concerns about the lack of fast charging infrastructures for longer trips, EV prices and finding an EV model that meets their vehicle needs are also significant concerns [
17]. These concerns are shared by drive tourists looking to use their EVs for lengthy road trips and reduce their travel-related emissions. While the barriers to EV uptake within tourism have not yet been sufficiently studied [
8,
10], scholars and the public alike highlight a series of concerns that continue to limit EV adoption for tourism, including range anxiety, the charging time, broken chargers, unsafe charging locations, travelling in rural regions and through rough terrain, the lack of information (charger locations and operation statuses), and the fragmentation of infrastructures [
11,
23,
30,
31,
32]. The lack of cooperation and coordination on the supply side, such as different systems to initiate and pay for charging, means many prospective users lack the understanding and incentives necessary to use EVs [
11], which will only slow the decarbonization of tourism. This is presumably exacerbated when tourists attempt to navigate EV systems in foreign countries.
Despite growing market penetration and the rapidly changing policy and infrastructure investment, the implications of the EV transition for tourism, specifically road trips and drive tourism, remain under-researched [
9,
10,
31,
33]. Case studies on EV drive tourism in Indonesia [
34], New Zealand [
35], Norway [
36], and the USA [
7,
35,
37] all call for increased research to better understand, prepare for, and accelerate the EV transition. A literature review by Fitt [
9] suggested that EVs could instigate fundamental changes to travel, including not just financial concerns over vehicle and infrastructural upgrades at destinations, but trip planning and rethinking symbolic associations between cars and leisure travel. These highlight the complex challenges of the low-carbon transition which tourism leaders increasingly recognize as a key climate change risk alongside physical climate-induced disruptions to destinations and travel patterns [
38] To assist destinations and tourists in this transition, Lingzhi and Slowik [
11] suggest increasing exposure to EVs via communications, research, and developing action plans for EV readiness.
This research contributes to the emerging EV and (drive) tourism literature with the first study in Canada and the first to focus on national park-based tourism. The objectives of the analysis are fourfold: (1) develop an EV readiness index, (2) apply the index to assess the capacity of the charging network to support EV-based tourism (at local to provincial scales), (3) identify key infrastructure gaps, and (4) raise awareness in the tourism community of EV tourist access inequity and new market potential. To investigate the state of EV readiness (fully electric, not PHEVs) in remote and rural regions of Canada, this study developed four criteria to evaluate how an average EV (based on Natural Resource Canada’s estimated 281 km average range of EVs on the road in 2020) would perform on Parks Canada’s 94 road trip itineraries to visit iconic national parks across Canada [
39]. These criteria, described in the methodology, assessed the charging network capacity, including the number of and distance between chargers enroute, and implications for a convenient and enjoyable tourism experience through the charging time and locations at the recommended itinerary destination stops. PHEVs do not face the same challenges and, thus, are not included in this analysis, yet the emissions and fuel/charging costs are also compared between EVs and internal combustion engine (ICE) vehicles. With results for individual routes and EV–ICE comparisons across provinces of Canada, this analysis provides an EV readiness assessment at the local, provincial, and national scales. The research highlights critical infrastructure gaps in rural and remote regions, provides recommendations for future EV infrastructure investment (based on network gaps and provincial electricity carbon intensity) and policy development, and enhances tourism sector awareness of access inequities and lost markets as the number of EV drivers continues to increase. The results can inform conversations on how EVs can best be part of a just transition to decarbonized tourism in Canada.
2. Materials and Methods
Each on the 94 Parks Canada travel itineraries was (1) analyzed for route information, the on-route charging network (Level 2 and 3), and destination charging opportunities (Level 2 and 3), and then were (2) assessed for the feasibility and ease of EV usage and (3) compared to ICE vehicle travel.
This methodology used the Government of Canada’s average affordable family-sized 100% electric vehicles to represent current average EV capabilities including a 281 km range, charging speeds, and an energy efficiency of 0.18 kW/km [
18]. Plug-in hybrid vehicles were not included in the analysis. The analysis was repeated to include a wider range of EV capabilities that reflect the anticipated improvement in EV performance. To represent the next five years, the future range was based on Canada’s top ten selling EVs in 2022 which averaged 400 km. An important EV performance factor in the Canadian context is battery performance in winter conditions, when range capabilities are reduced by cold temperatures. Studies report varied cold weather range declines that are between 5% and 35% [
18,
40,
41]. Based on an average of the available literature, this analysis used a winter range loss of 17%, a current reduced winter range of 233 km (vs. a 281 km summer range) and a future winter range of 332 km (vs. a 400 km summer range) to examine the feasibility of the same tourism itineraries in winter. An equivalent ICE station wagon with an average fuel efficiency of 8.9 L/100 km was used throughout the analysis for comparison.
2.1. Data Collection
Route Information: Each of the 94 itineraries were classified by their provinces, national park(s) visited during the trip, and source market(s) (where the trip started and finished). Then, the routes were plotted using Google Maps based on the itinerary descriptions (including all additional stops suggested) or the itinerary maps available on the Parks Canada website when available [
39]. The shortest and most fuel-efficient routes suggested by Google Maps were used, including routes requiring paid tolls. For each travel itinerary, the daily and total trip distances were recorded. The number of EV charging stops required to complete the itinerary was calculated with the assumption that tourists would begin the trip with a full charge and therefore the full range available.
On-Route Charging Network: This analysis focused on the Level 3 charging availability that is suited to tourism (including Level 2 where Level 3 is not available or for overnight stays on multi-day trips). Each itinerary map was put into the Plugshare EV charging crowdsource app to analyze the availability and functionality of the charging infrastructure along its routes. The total number of Level 3 charging sites, the average charge speed, cost and number of chargers, and the brands/charging networks were recorded for each route. The Plugshare App (version 6.21.1) was also used to identify the longest distance along the route without reaching either a recommended stop at an attraction with a charging station or a Level 3 charging station. This indicator assessed the feasibility of completing the route with an EV (i.e., if this distance is greater than that of the full summer or winter range of the average EV, the route may not be possible), but also identified which routes may cause more “range anxiety” for EV travelers (i.e., a route with a lower distance between Level 3 chargers provides redundancies and less need to plan where to stop and charge). Additional Level 2 stations along the route were also recorded, although these were considered emergency charges, as it is not reasonable to stop and charge mid-trip for 4–10 h at 7–12 kWh charging speeds.
Destination Charging Network: This analysis documented the opportunity to charge an EV while participating in a tourist activity, getting amenities such as a meal at a restaurant, or during an overnight stay at or near an accommodation. This metric includes Level 2 chargers because the tourist would be able to charge for longer periods of time while at a destination without an inconvenience of trip disruption. Each of the primary destinations and additional stops suggested by the itineraries were put into the Plugshare App. The nearest charging station(s) were recorded, including the location, level and charging speed, number of chargers available at the site, cost, brand/network, and any restrictions (e.g., some chargers are only available seasonally, during business hours, or are for hotel guests). Each charging station was measured in terms of its distance to the activity suggested in the itinerary (e.g., to a trailhead, to amenities such as restaurants, libraries, etc., and, for multi-day itineraries, to accommodations including campsites, and hotels).
2.2. EV Readiness Analysis
Using the charging network data collected, the routes were assessed for their feasibility and tourism convenience. The route feasibility and tourism convenience scores (both ranging from 0 to 10) were combined into an equally weighted EV readiness index with a maximum score of 20 representing an ‘EV Ready’ tourism itinerary (equal to the access and experience of an ICE vehicle) and a minimum score of 0 representing ‘Not Possible for EV Tourism’. The indicators that comprise the index and their respective scoring criteria are outlined below.
A
feasibility score was calculated using the route’s distance (km), number of Level 3 chargers, and gaps between Level 3 chargers to determine if EV drivers can reasonably complete the route. Each route was given a score out of 5 for (indicator 1) its charging needs/network capacity and (indicator 2) a charger linear density/gap analysis (see complete indicator rating scales in
Table 1).
Indicator 1—Charging needs and network capacity: Identifies if a tourist can complete the route within the average EV range (current = summer 281 km, winter 233 km) and using the capacity of the charging network when required. If there is a gap in the charging network during the route that is longer than the range of the vehicle, then this route is deemed not possible for EVs for this segment and evaluation stops. Similarly, if the route can be completed within a single charge, the route is deemed highly suitable for EVs, and evaluation stops as the extent, capacity, and location of charging networks do not influence the travel experience or planning.
Indicator 2—Charger gap analysis/linear density: This indicator is determined based on the largest gap between Level 3 charging stations or a destination with a charging station. This measure identified whether the chargers are spread out across the route, highlights any critical gaps, and is an indicator of ‘range anxiety’ for EV drivers’ ease of knowing there are multiple possible stops along the route to charge rather than just one location before a large gap. This was calculated as a percentage of the average EV range in summer and winter.
To measure the travel experience and the level of planning required by EV drivers, a
tourism convenience score was based on the number of charges and charging time required, Level 2 and 3 charging stations at recommended destination stops, and the redundancy at destination charging sites (i.e., to account for chargers being occupied or out of service upon arrival). Each route was given a score out of 5 for its charging stops/time (indicator 3) and tourism-advantaged charging locations (indicator 4). The scoring criteria for each of these indicators during one-day trips and multi-day itineraries are outlined in
Table 2.
Indicator 3—Charging stops: The time needed for charging stops, if required at inconvenient points in the itinerary, detracts from the tourist experience, making the route inconvenient for EV travelers. This indicator assumes a traveler would start the trip off with a full battery and records the number of additional charges needed to complete the itinerary.
Indicator 4—Tourism-advantaged charging: The convenience of charging facilities at recommended stops were assessed based on the availability of chargers at or near the primary destination and at the additional stops identified in the itineraries. Only charging stations directly at or near (within 1 km) the highlighted tourism attraction were considered for this analysis. Additional tourism-relevant characteristics of charging infrastructure, such as isolated chargers in potentially unsafe locations, could not be included because of the limited and inconsistent information available about each charger location.
The four indicators were then combined into the tourism EV readiness index score out of 20. The tourism EV readiness index is categorized as follows:
20 = Excellent: no special trip planning required, parity with an ICE-based travel experience;
16 to 19 = Good: some additional planning required, not likely to deter EV-based tourism;
11 to 15 = Acceptable: careful planning required, likely to deter some EV-based tourism;
6 to 10 = Poor: possible, yet highly inconvenient and significant planning required, likely to deter EV-based tourism;
<5 = Not Possible: cannot reasonably complete road trip itinerary.
If any of the routes scored a 0 and were unreasonable or impossible in any one of the four indicators, the route was considered not possible and evaluation stopped.
2.3. ICE Comparison
EV and ICE vehicles were compared based on the costs of fuel and the emissions resulting from the completion of each itinerary.
Cost: ICE trip cost was calculated based on the overall trip distance (km) for each itinerary times the cost of fuel per km (
$/km) at the average provincial level during June 2022 [
42]. EV trip cost was calculated based on the overall trip distance (km) for each itinerary times the number of kWh required to complete the route, based off the average EV efficiency of 0.18 kW/km, and priced at the provincial electricity cost per kWh [
43]. It should be noted that costs of charging vary from free to
$25/h at different public charging facilities, with vehicles themselves having varying charging speeds and capacities which also affect the price of charging.
Emissions: ICE trip emissions were calculated based on the average fuel efficiency of 8.9 L/100 km and per the km of emissions from an average vehicle at 206 g CO
2e [
6] times the overall itinerary distance. EV trip emissions were calculated based on the average battery efficiency of 20 kWh/100 and per km of emissions based on the energy source profiles of the electricity grid at the provincial level [
44] and the corresponding provincial emission intensity (Kg CO
2e/kWh) times the overall itinerary distance.
2.4. Limitations
The range and energy efficiency of light duty vehicles range substantially, and this analysis includes the results for a representative EV and ICE station wagon. Results and comparisons for other types of light duty vehicles like SUVS or pick-up trucks would differ (with much higher average emission reductions). Range and efficiency are also affected by the driving technique, vehicle weight, aerodynamics and other factors which might affect a road trip traveler, such as transporting bikes, a canoe or a roof box, which this analysis does not consider. This analysis compared only the emissions related to the operations of an EV and ICE vehicles on each travel route. It did not assess the embedded lifecycle emissions associated with the construction of each type of vehicle. Because the analysis used an average range of the EVs on the market instead of only the newest EVs with higher capabilities, it was assumed that the ‘well to wheel’ carbon emissions break-even point (which varies from province to province based on the carbon intensity of the electricity grid) had been reached.
This study also sought to include information on the security and operability of charging sites. Security is an important factor for tourists to feel comfortable and safe utilizing EV charging stations, including their personal safety, particularly when travelling alone or with children, and the security of their vehicle and personal property against theft or damage. EV charging stations often being located in parking lots with low lighting and visibility can make users uncomfortable, especially if there is no location to spend the charging time and they must remain at their vehicle. While this is an important concern, translating this to a metric was difficult because of the varied risk perceptions of tourists, subjective crowd-sourced user data (e.g., user comments on the security only available at some charging sites), and the inability to assess certain qualitative or nuanced factors of security (e.g., a site may be secure during business hours but insecure after dark) [
45,
46].
In terms of operability, the charging networks (e.g., Flo, Chargepoint) were noted and any broken or malfunctioning chargers were highlighted throughout the data collection process. Any trends including the network, geographical region, or other characteristics were noted, but this provides only a snapshot of operational problems and does not include where chargers were promptly fixed versus where charger issues are consistent and thus makes a location not a reliable station or a network for travelers. A temporal study on charging networks’ operability may provide more robust information on network operability, but, additionally, this relies on crowd-sourced user data which may not provide consistent data, as broken (or conversely fixed) chargers may not be reported or recorded.
3. Results
Overall, the 94 national park road trips score reasonably well for EV readiness (average score of 17). Across all routes (with an average length of 347 km), over 70% of the destinations, suggested activities, and itinerary stops already have at least one Level 2 or 3 charging station available on site or nearby, over eight Level 3 charging stations per route, and an average maximum 159 km gap between charging stations. These averages are heavily influenced by the 61 one-day trips that were much more suited to EV travel than the 33 multi-day trips. The results also varied substantially across the provinces. The results by trip type and region are discussed below. Results under a projected future EV increased average range are also presented to examine potential improvements in tourism readiness by the end of the decade.
3.1. Current EV Readiness on a National-Scale
For one-day road trips, averaging 168 km and often nearer to urban source markets and gateway communities, with a summer range, 50 (82%) of the 61 itineraries are possible without needing to recharge and thus received the highest score (20) that is equal to travel with an ICE vehicle. One-day routes had an average of six charging locations enroute and the average largest gap between chargers was 89 km. On average, day trips across Canada scored 19.2/20 with all day trips in the Prairies and Atlantic Canada being able to be completed within a single charge. The remaining 11 one-day trips could all be completed with additional charging, which caused varying degrees of inconvenience to the EV traveler based on the availability of Level 3 chargers. Under winter conditions, all single-day trips remain possible, but the overall average scores are reduced from 19.2 to 18.4, with 18 trips requiring charging enroute.
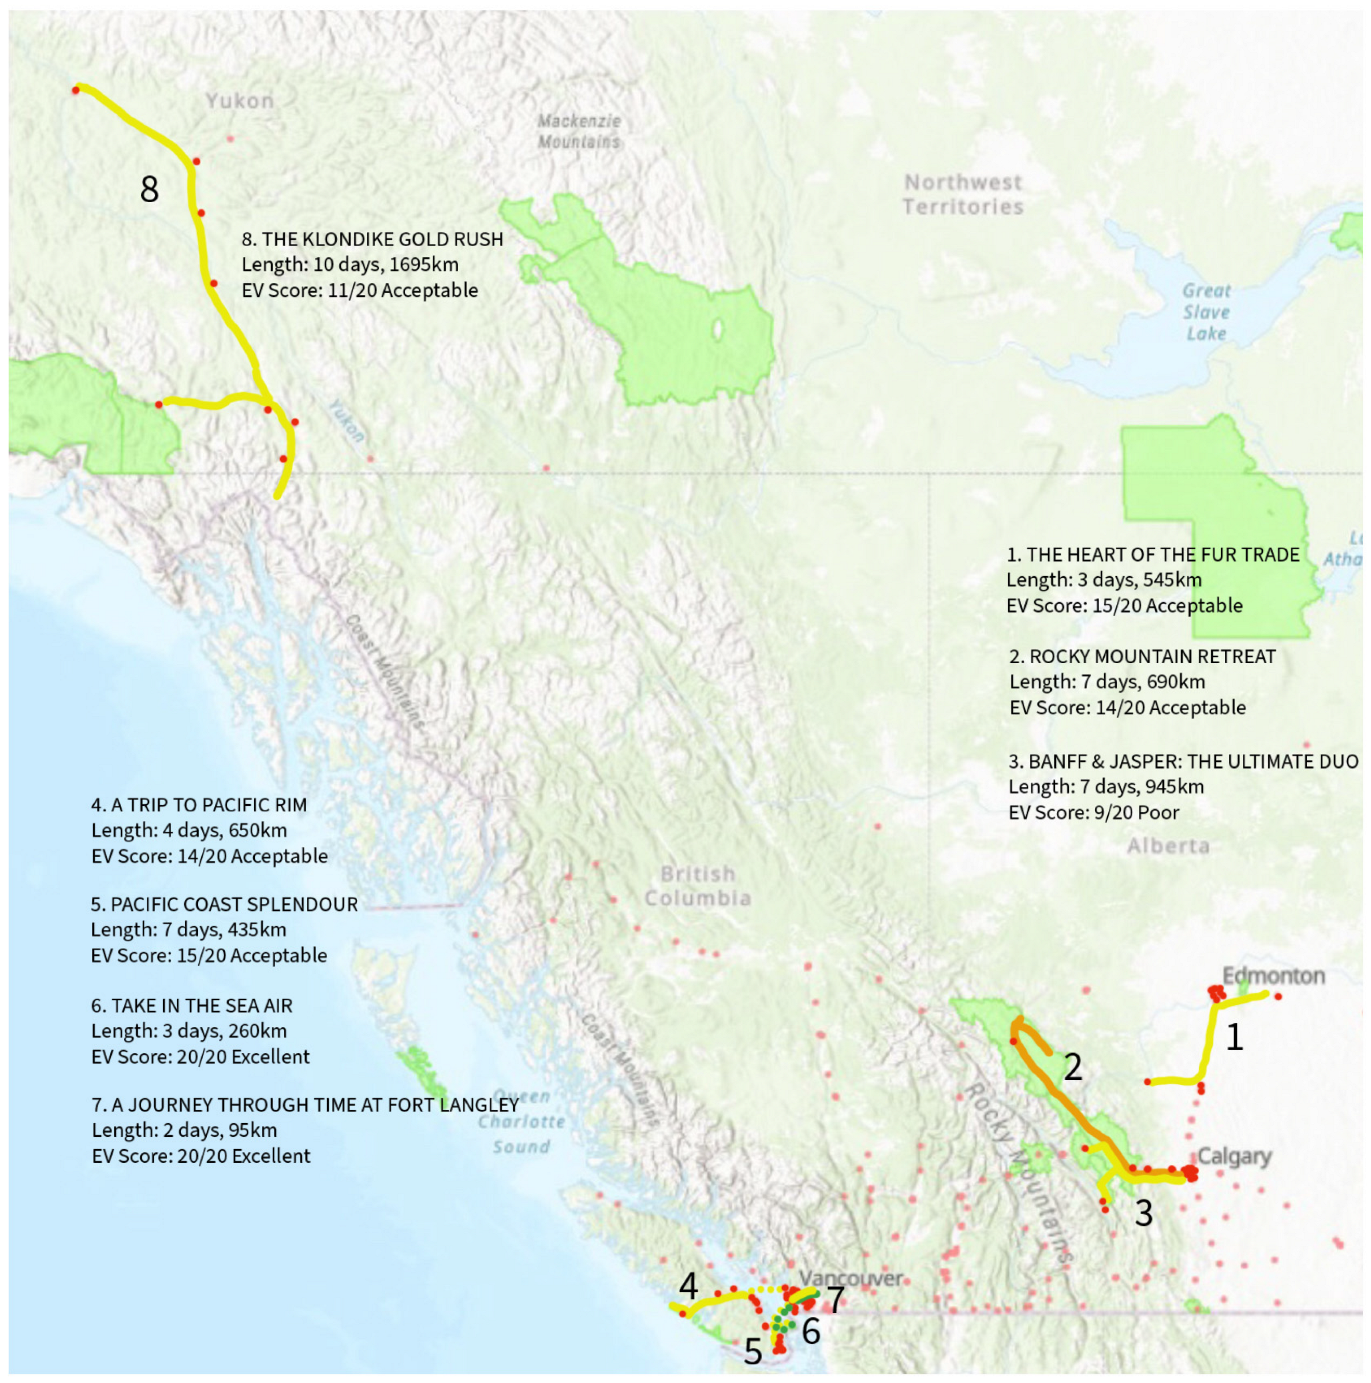
The 33 multi-day trips averaging 691 km range from a one charge, 7-day, 80 km tour through
Land’s End: Naturally Spectacular in Quebec’s Forillon National Park to the currently impossible 1610 km, 7-day trek along Newfoundland’s
West Coast Wonders and a visit to Labrador’s Gros Morne National Park (see
Figure 1 for multi-day route information). On average the multi-day routes required 1.5 additional full charges to complete, had nine Level 3 charging stations enroute, and an average largest gap of 191 km between stations. On average, multi-day itineraries scored 14 on the overall EV readiness index. One-third of the multi-day trips are considered to be good or excellent (scored above 16) and unlikely to deter EV tourism. Just over half (55%) of all multi-day routes were categorized as acceptable or poor (scoring between 5–15) and thus are likely to deter at least some EV tourism. Four routes were determined to be not possible by an average EV with the current charging infrastructure. Under winter conditions, average multi-day scores decrease from 14 to 13.2 and one additional route is not possible for EV tourism.
3.2. Current EV Readiness at a Regional-Scale
Tourism EV readiness index scores differed regionally, in part reflecting the provinces that have had the strongest policy incentives for EV adoption. When comparing the average score of travel routes (both one- and multi-day) across the provinces, Manitoba leads with a score of 18.7, followed by Quebec (18.4), Ontario (17.7), Nova Scotia and BC (both 17.6). Saskatchewan, Newfoundland and Labrador, and Prince Edward Island (PEI) scored the lowest at 5.7, 7 and 9, respectively. Regions with high amounts of charging required to complete the route combined with low numbers of chargers, or with a dense cluster of charging stations followed by gaps without stations along the route combine to create large or impossible travel gaps between charging stations. This is prevalent in Saskatchewan, where an average 773 km gap between Level 2 or 3 chargers means all itineraries to Prince Albert and Grassland’s National Parks are currently inaccessible to EV travelers. In Newfoundland and Labrador, the average gap of over 735 km between Level 2 or 3 chargers also made the West Coast Wonders trip to Gros Morne National Park and Labrador impossible for EVs. PEI has no Level 3 chargers at all, but the frequent Level 2 chargers make routes within this province inconvenient yet still possible in an EV. It should be noted, longer itinerary lengths in the Yukon (1695 km), Newfoundland and Labrador (averaging 1452 km), New Brunswick (averaging 1220 km) and Saskatchewan (averaging 910 km) require more charges to complete (5, 4.2, 3.3, and 2.2, respectively), thus decreasing their convenience and feasibility scores.
The provinces that had the most charging locations on their routes included New Brunswick (averaging 18 per route), Quebec (13), Yukon (10), and Ontario (9). Saskatchewan, Manitoba, and Newfoundland have, on average, only three Level 3 charging locations per route. Quebec, Ontario, and BC have, on average, less than 100 km as the largest gap between Level 3 charging stations (75 km, 80 km, and 86 km, respectively). Despite this, Ontario’s Southwold Earthworks National Historic Site 328 km itinerary scored the lowest (12) of the single-day itineraries. Alberta (191 km), Nova Scotia (187 km), Yukon (177 km), and Manitoba (113 km) all have average ranges that are possible by an average EV but require careful planning to ensure obtaining a sufficient charge at specific points to be able to cross the longer gaps. It should be noted that some sub-regions such as Ontario’s Lake Superior National Park region, Nova Scotia’s Kejimkujik National Park, or Alberta’s Banff-Jasper National Park corridor have longer gaps than the provincial average, over 200 km between Level 3 charges, which could cause range anxiety or require using a Level 2 charger mid-route (adding hours and inconvenience to the journey).
While no Parks Canada itineraries exist in Nunavut or the Northwest territories, and thus no analysis was done on this region, a broad search using the same methodology was done for these territories and it should be noted that there are no public charging stations in Nunavut and only two Level 2 public charging stations within the Northwest Territories.
Winter EV capability reductions impact Western Canada the most, where temperatures can be colder than −20 °C for extended periods, which is an important consideration because this region has the largest ski tourism market in Canada. Nearly half of the routes in this region (43%) drop by at least one category (e.g., good to fine), and the very high-profile Banff-Jasper National Parks itinerary becomes not possible due to a gap between chargers of over 233 km. Quebec experiences the largest average overall index decline, falling from 18 to 16, but maintains an overall EV Readiness ranking that is good. Atlantic Canada’s regional average drops from 13 to 11.5 in winter.
3.3. Future EV Capabilities
An analysis of future EV capabilities on one-day road trips demonstrated EVs would soon near parity with ICE vehicle-level convenience, with 96% of the itineraries being able to be completed within a single change (when average range exceeds 400 km). Completion with a single charge means not having to rely on charging infrastructure while on-route or at destinations. With the longer tested and projected average ranges of new EVs, the average EV readiness index score across all one-day itineraries reached 19.7. Only two single-day itineraries, both based in Western Canada, still require additional charges to complete, which add inconvenience and may continue to deter some EV travelers from these routes/destinations. Under winter range reductions (ranges reduced to 332 km), average single-day scores fall to 19.4, as eight routes require additional charging to complete (four in Western Canada, three in Ontario, and one in Quebec).
Index scores for multi-day itineraries improve noticeably under the future average range, with the average scores of four regions improving significantly in Atlantic Canada (from 13 to 15.5) and slightly in Western Canada and Ontario (from 15 to 16). Already high index ratings for routes in Quebec (18) remain unchanged. The North, Saskatchewan, and Newfoundland and Labrador remain hindered by gaps of 500 km or more between chargers making these four routes impossible even with longer-range EVs. Conversely, PEI, which currently has no Level 3 charging infrastructure and was previously ranked as poor becomes fully accessible to EVs as the entire 300 km itinerary can be completed within a single charge. Multi-day routes in Rouge National Urban Park, Ontario, and La Mauricie National Park, Quebec also can be completed within the single charge of a 400 km range vehicle. Thirteen routes in total move up a category, either from poor to acceptable (the Kouchibouguac National Park, Forillon National Park, Lake Superior National Park, and the Banff and Jasper National Park routes) or acceptable to good (the Yoho and Kootenay National Parks, Pacific Rim National Park Reserve, Thousand Islands National Park, Kejimkujik National Park, and the Cape Breton Highlands National Park routes).
Under winter conditions and a reduced winter range of 332 km, future EVs score a full point higher on average than in the current summer range and almost two points higher than current winter range EVs. Quebec and Ontario continue to be good regions on average for multi-day EV winter road trip tourism (maintaining scores of 18 and 16, respectively), despite the challenges in Lake Superior National Park due to long charger gaps. Atlantic Canada and Western Canada see larger declines, yet future winter averages (14.5 and 15, respectively) are the same or better than current summer range (281 km) scores. Manitoba remains consistently good across current and future summer and winter conditions, yet Prairies’ regional scores are hindered by Saskatchewan, which, due to large gaps between chargers, continues to be impossible.
3.4. EV versus ICE Comparison
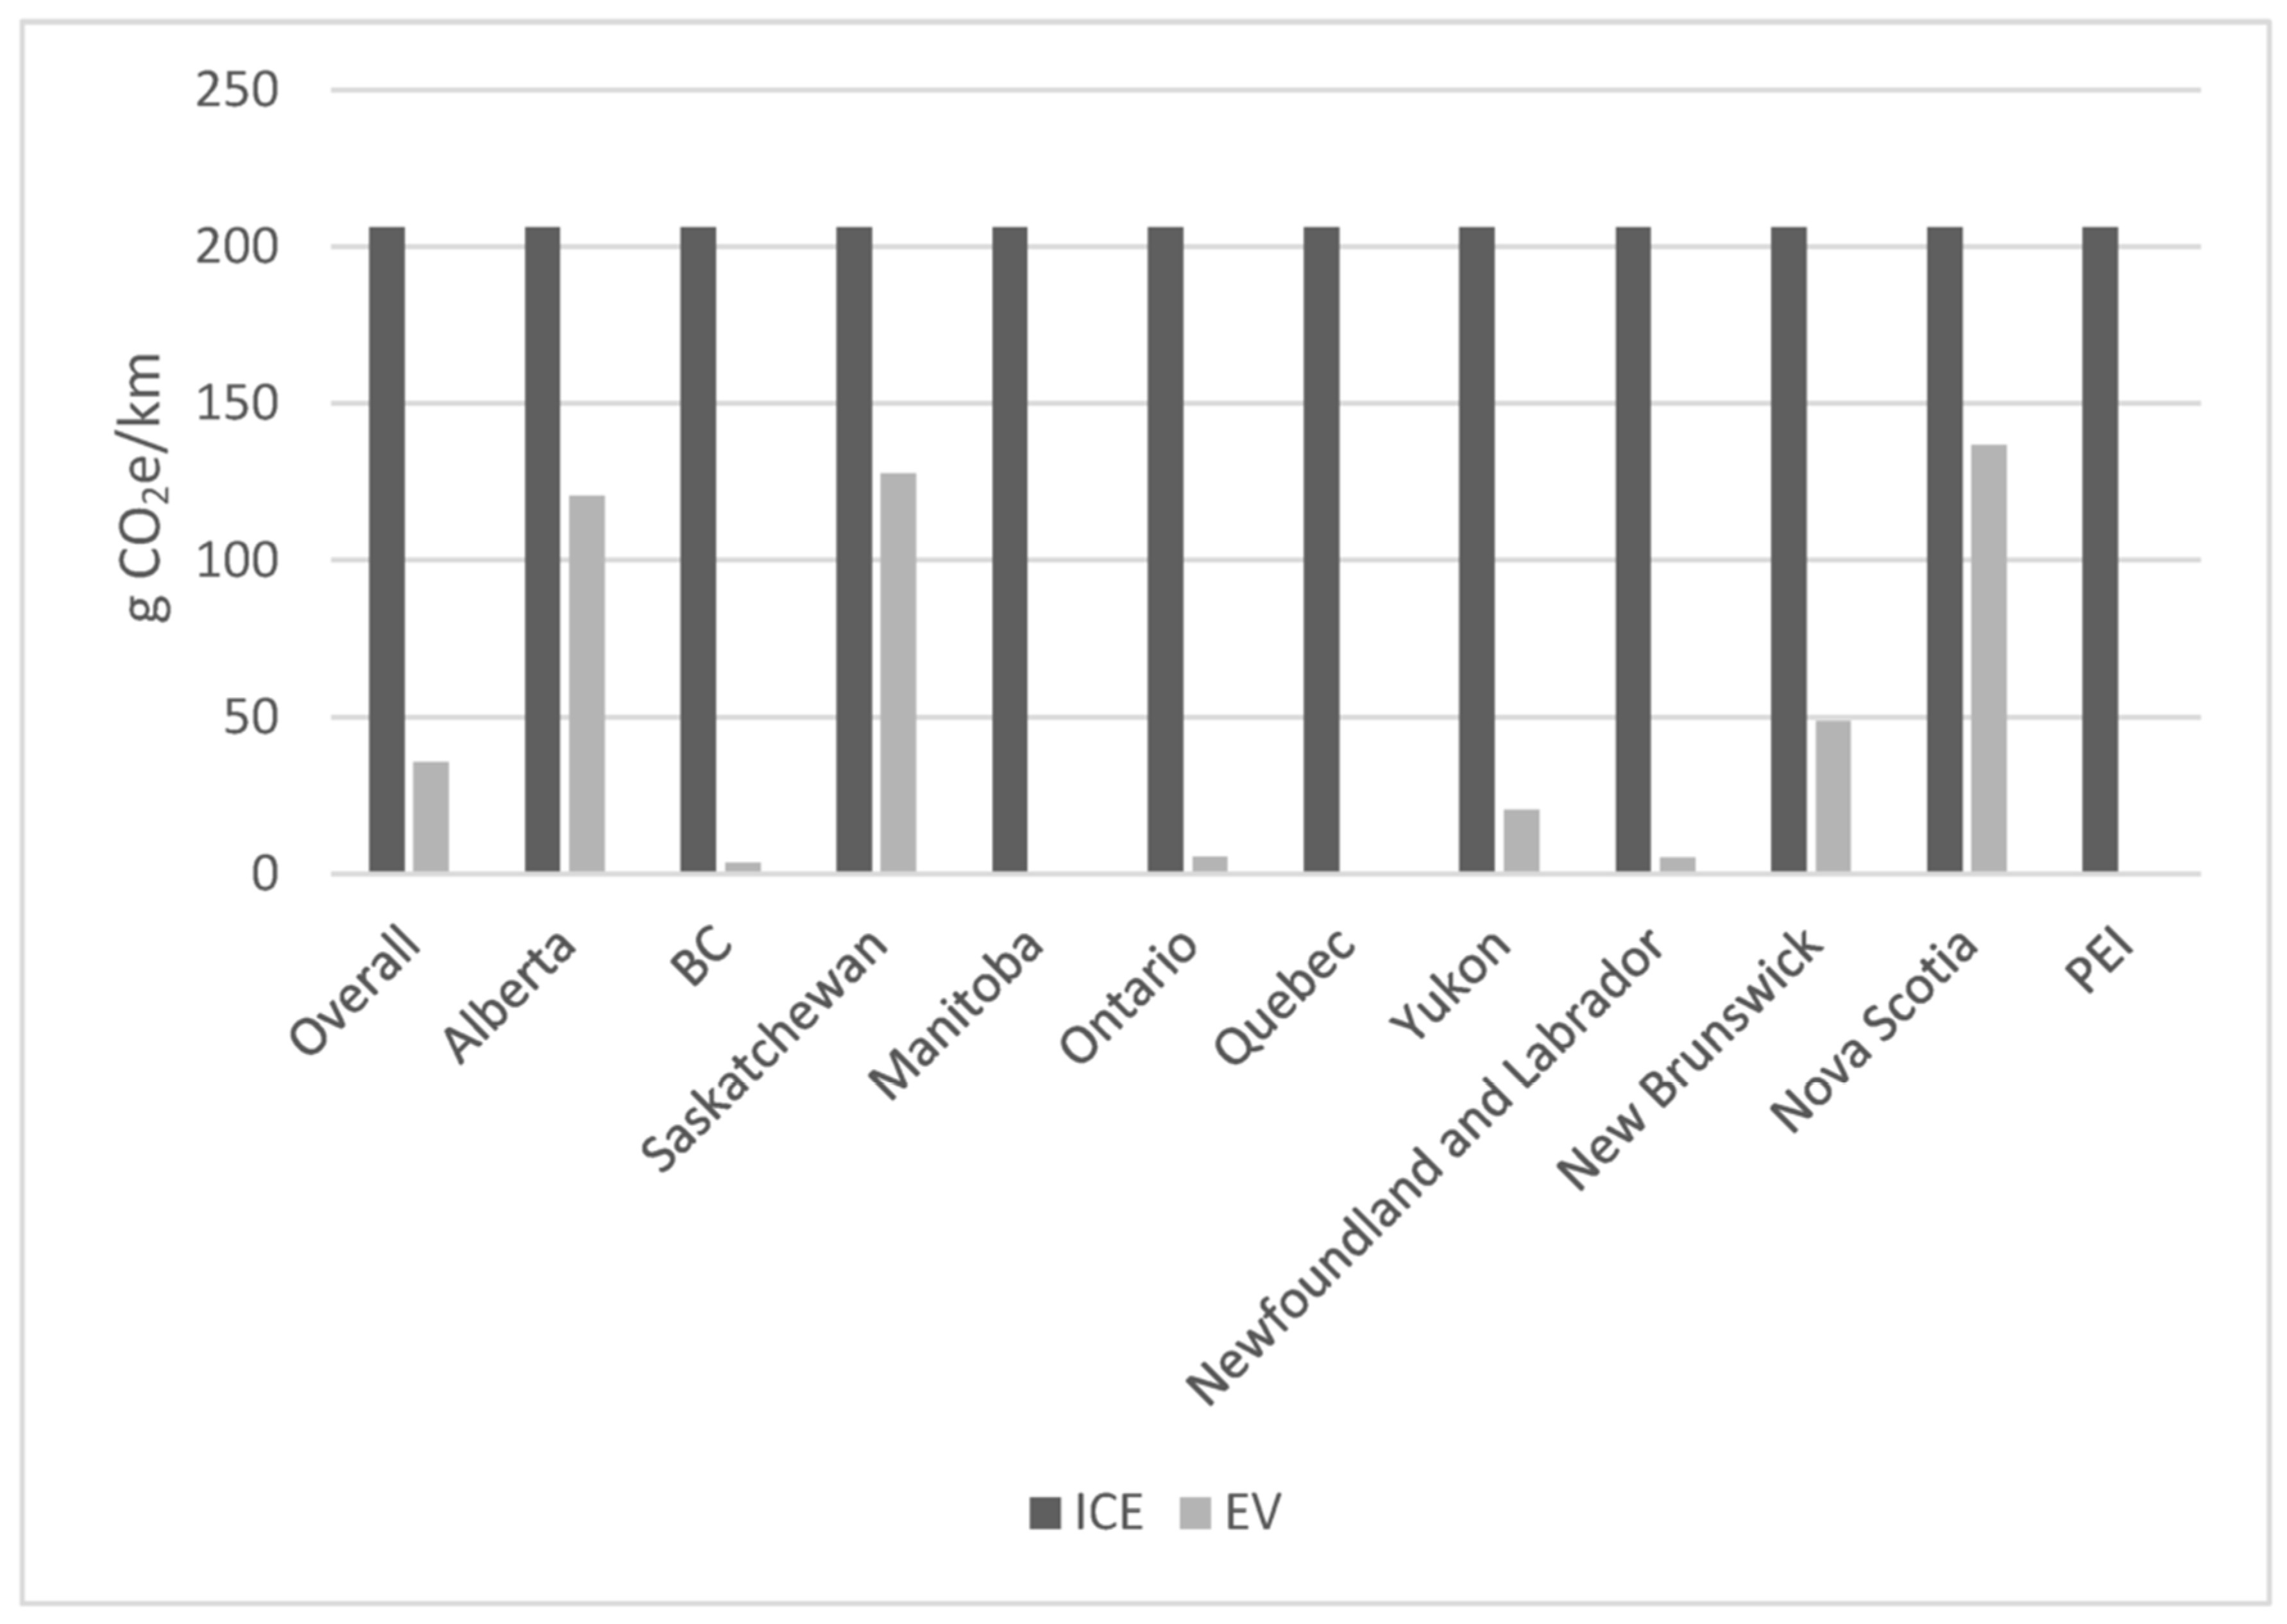
Per kilometre emissions for an ICE vehicle were assessed at 0.206 kgCO
2e, while EV emissions were assessed based on the electric grid energy of each province. Based on national averages, EVs emit 15.5% of the carbon that an ICE car would driving all the same Parks Canada routes (
Figure 2). In provinces with low carbon electricity grids, EVs emit, on average, less than 3% of the emissions ICE vehicles emit over the same distance, including Manitoba (0.1%), Quebec (0.1%), PEI (0.2%), BC (1.7%), Newfoundland and Labrador (2.4%), and Ontario (2.6%). In provinces with higher carbon intensity electricity grids powered primarily by coal and natural gas, such as Alberta, Saskatchewan, and Nova Scotia, EVs emit between 58.5% to 66.4% of what an average ICE engine emits over the same length of a trip.
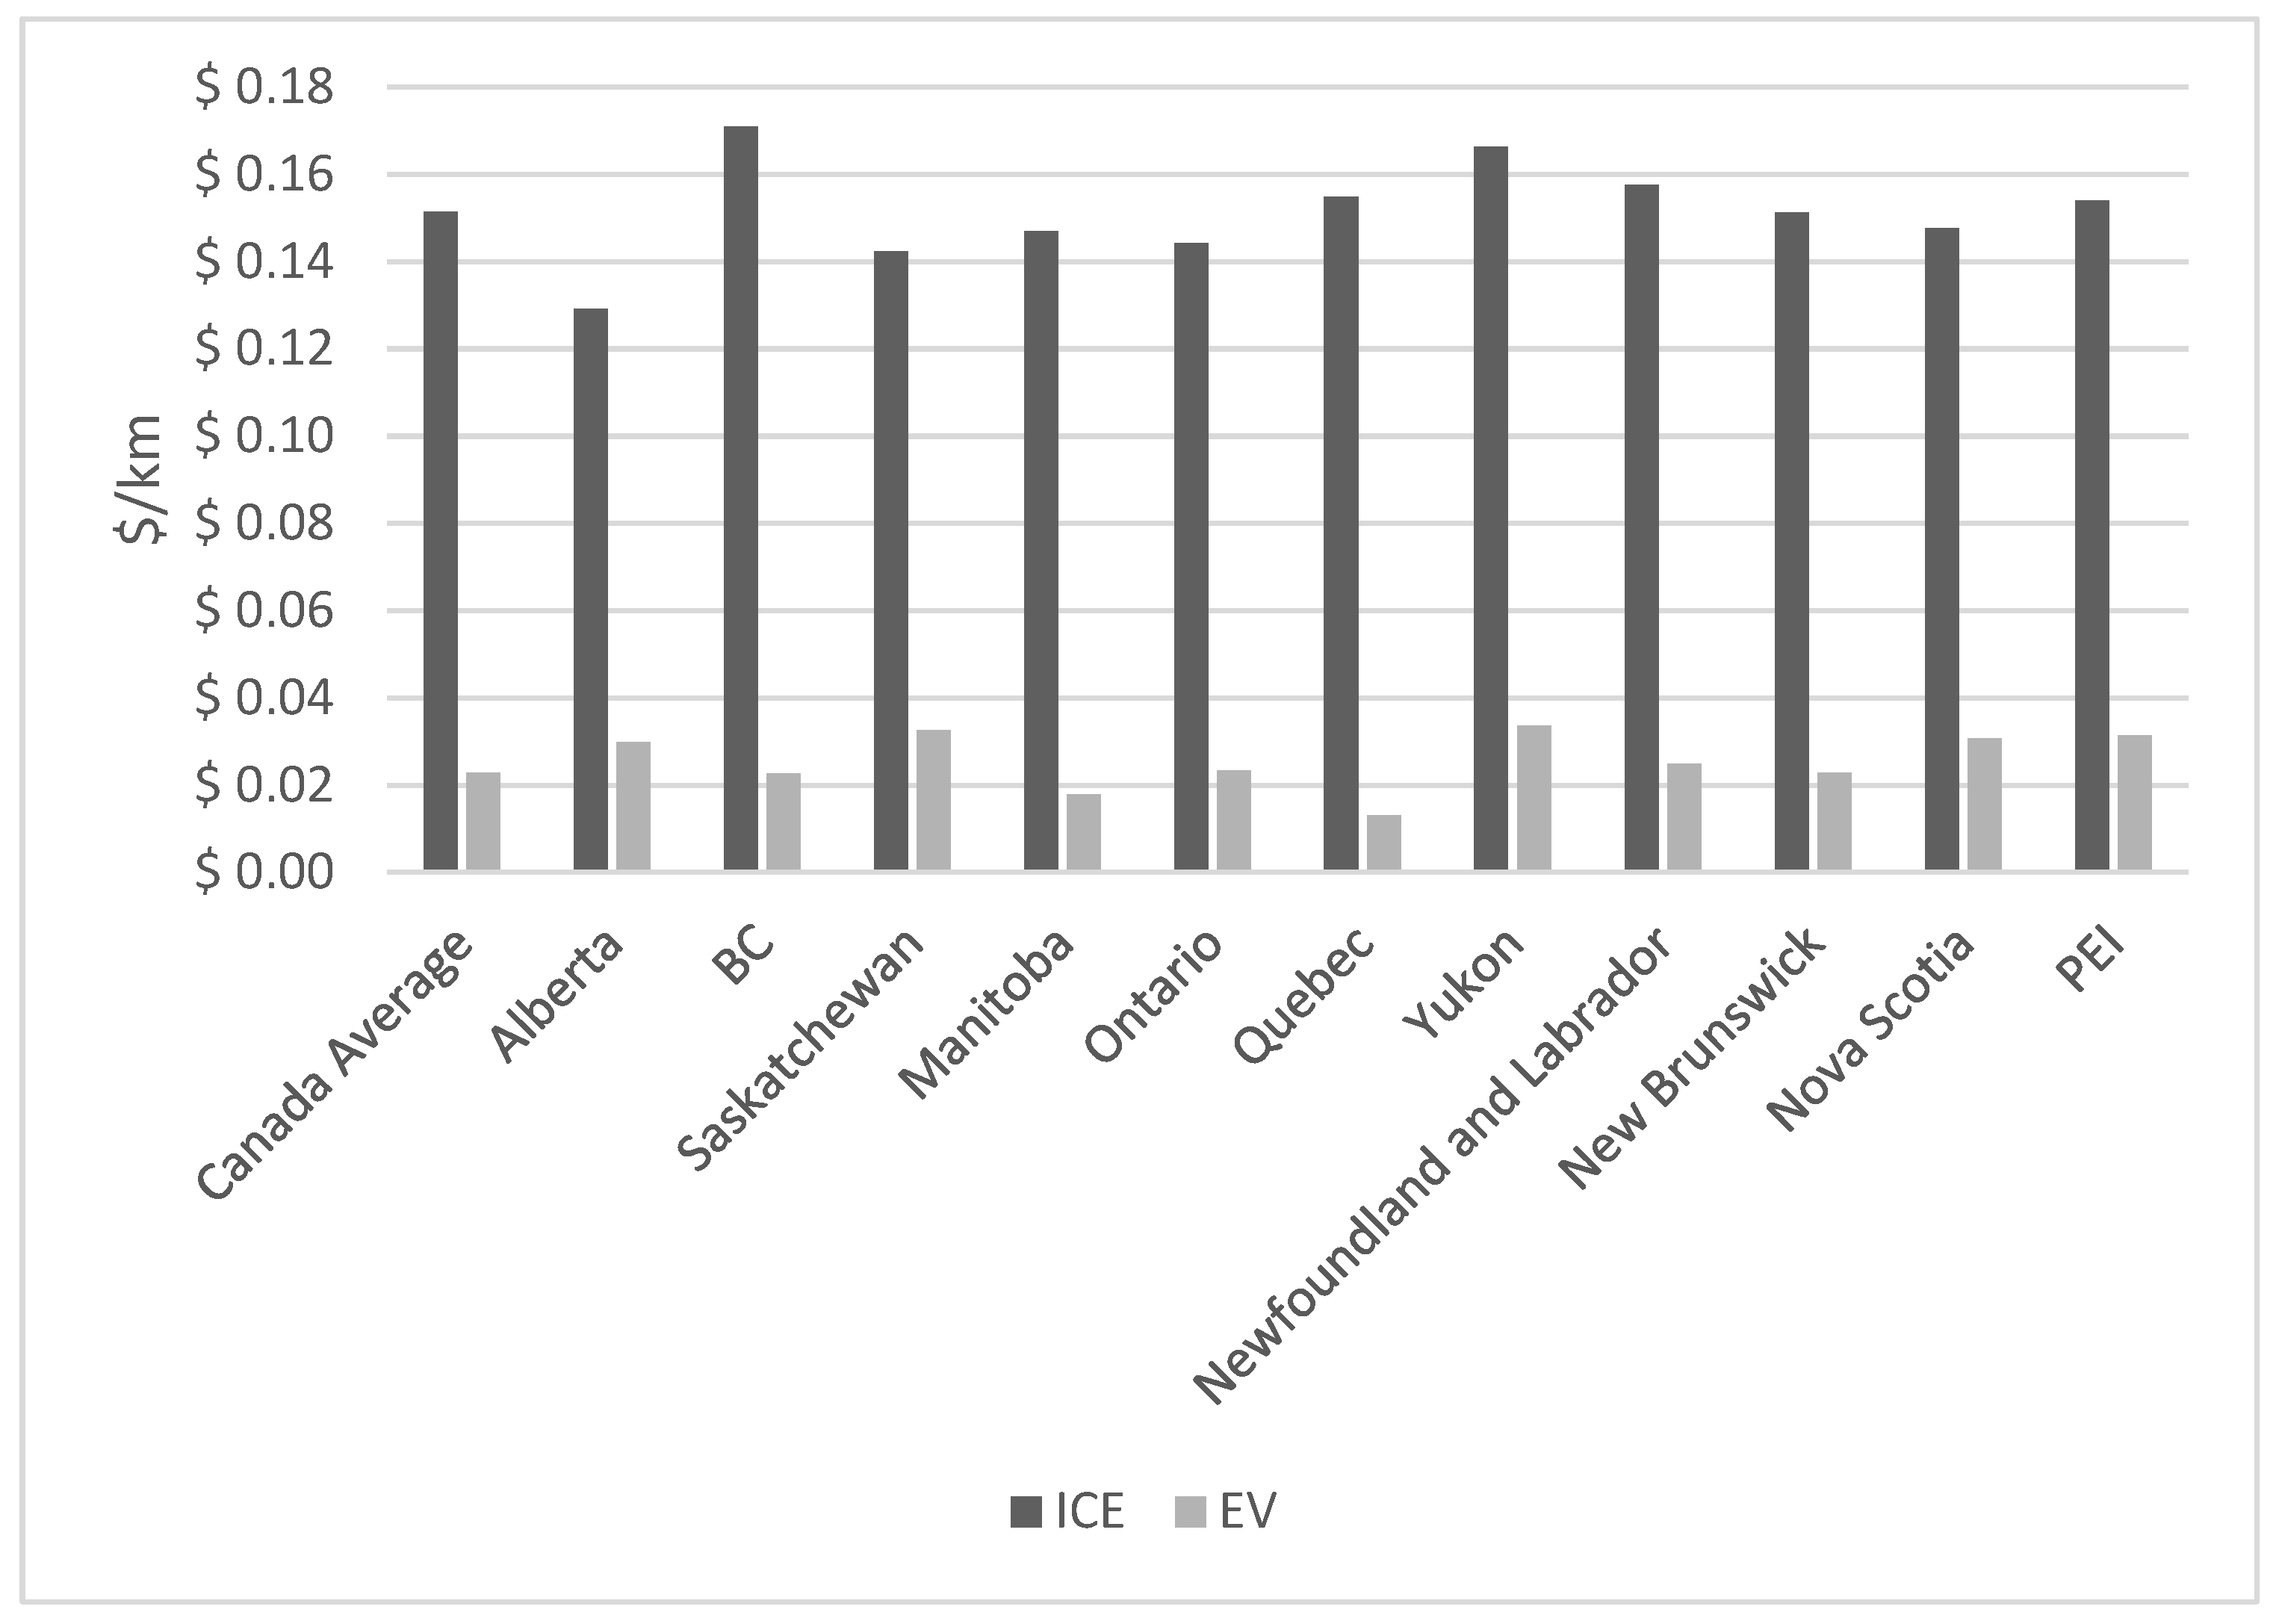
Comparing average provincial-scale energy and fuel prices from June 2022 to November 2023, EVs are significantly less expensive than ICE vehicles in travel costs (
Figure 3). On average, single-day trips cost
$3.70 for EV charging compared to
$24.88 for ICE vehicle fuel costs. The average multi-day trip costs
$15.69 in an EV compared to the
$103.65 for gas cars. Based on an average fuel efficiency of 8.9 L/100 km, this represents a savings of 85%. Beyond provincial electrical grid pricing, charging costs vary by station; thus, analyzing the Level 3 charging available along each route shows additional regional trends. The Klondike Gold Rush route through the Yukon’s Kluane National Park, for instance, would cost approximately
$351 in an average ICE vehicle, and
$57 (a savings of 84%) based on Yukon’s electricity; but with free Level 3 charging stations along the 10-day itinerary, electricity costs could be as low as
$0 (100% savings). Quebec and Manitoba also have low-cost Level 3 charging, with the average cost at
$2.00 and
$6.00 per hour of charging versus
$19 hourly in Alberta. The remaining provinces have average Level 3 charging costs of
$15 per hour.
4. Discussion
Canada is a vast country full of large, outdoor tourist attractions including provincial and national parks and historic sites. Under the Federal Sustainable Development Strategy [
15], Parks Canada committed to reducing its GHG emissions from its facilities and fleet to be 40% below 2005 levels by 2030, which is consistent with national interim emission reductions targets on the pathway to net zero. This networks of protected areas themselves provide a nature-based climate solution by conserving biodiversity, protecting ecosystem services, connecting landscapes, and capturing and storing carbon [
39]. Using electric vehicles to access these natural areas provides not only a reduction in emissions, but also limits the air and noise pollution at destinations, which has co-benefits for wildlife and vegetation [
7,
23,
47,
48]. Despite the multi-faceted benefits of EV use in natural areas, there continue to be significant challenges that must be addressed to facilitate the EV transition.
Transitioning to EVs will fundamentally shift drive tourism [
9,
10,
31]. The results of this research suggest how the infrastructural capacity, including the linear density of chargers, the convenience of charging at tourism venues, accommodations and amenities, relative fuel costs and carbon emissions may prompt changing tourist patterns as EV sales and usages continue to grow in Canada and globally [
12]. These shifting geographic and temporal tourism patterns require rethinking drive tourism and travel to address new challenges and look for ways to provide opportunities in remote and rural regions as public and private institutions invest in charging infrastructure and EV policy [
30].
Decarbonizing Canada’s travel and transportation sector in a way that is equitable, inclusive, and accessible is necessary to meet Canada’s just transition legislation to build a low-carbon future that leaves no one behind [
49]. Accessibility and affordability are key conditions for EVs to be a viable option in tourism and transportation. Right now, many EV owners in Canada are of or above the upper-to-middle class. Currently, longer range EVs available in Canada are at the top of the price range. For example, BMW and Tesla produce vehicles with battery ranges comparable to an average ICE sedan [
18,
40,
41] but are considered luxurious and are priced accordingly. While a Tesla Model 3 Long Range can provide a sufficient range for a transition away from ICE vehicles, its cost is comparable to that of an ICE sports car. When it comes to more affordable models, Hyundai attempts to set the standard, though with EVs with half or just over 60% of the range of upper-tier Tesla models [
50,
51]. This data demonstrates that low-carbon road trip tourism is already possible in Canada, but is mainly accessible to those who are of or above upper-to-middle class.
By phasing out ICE vehicles, without affordability and accessibility in mind, the risk of both pushback on the EV transition and social inequities may increase. This analysis purposefully used a more affordable range of EVs, but we must further consider everyone in the transition to a greener Canada. The overall EV readiness ratings of the national park itineraries improve with future EVs with longer-range capabilities. Higher-end and longer-range models like, for example, the long-range Tesla 3 (530 km) further demonstrate that low-carbon summer road trip tourism is already possible and convenient in many parts of Canada, but at a higher cost, which means considering access and affordability. EV ownership, despite the comparable pricing of certain new EV models, often requires a higher initial investment and longer waiting times. Only a small number of provinces are offering incentives towards EV purchases, with the caveat that these must be new EVs, with no incentives being offered towards used EVs. Pushing the purchase of new vehicles not only furthers the environmental impact of consumerism, but it also places EVs outside the price-range of many individuals and reinforces the narrative that decreasing the carbon footprint of driving and commuting is an earned luxury. Private charging networks such as Tesla-only super-chargers further exacerbate this inaccessibility and, thus, were not included in this analysis.
High and unstable energy costs are a key threat to travel and tourism both now and in the future, which will only be exacerbated with climate change and decarbonization [
33,
37]. The results show an average of 85% in charging and fuel savings when using an EV on these routes. Placing these savings in an annual perspective, if a Chevrolet Bolt (EV) and Chevrolet Trax (comparable ICE vehicle) were both driven 20,000 km, their respective annual costs in charging and fueling would be
$400 and
$3000 [
42,
43]. Energy cost instability is also relevant to the electrical grid. The cost per kWh of electricity is currently highest in the Northwest Territories (
$0.382/kWh), Nunavut (
$0.375), Yukon (
$0.187), and Saskatchewan (
$0.181) versus being as low as
$0.073/kWh and
$0.099/kWh in Quebec and Manitoba [
43]. Results show these provinces, as well as Newfoundland and Labrador, and Northern Ontario, are key places where investment in charging infrastructure would increase connectivity. With more remote areas of Canada having less access to charging infrastructure, charging deserts are being created, resulting in a problem comparable to food deserts. Northern Canadians, Indigenous people, and Canadians living in rural areas are being forced into using ICE vehicles for a longer period simply due to where they live.
Some of these same regions, including Nunavut, Saskatchewan, Nova Scotia, and Alberta, have high-carbon-intensive electricity grids, meaning electric vehicles emit over 120 g of CO
2e per kilometre, on average [
44]. While this is still less than the 206 g of CO
2e emitted by an ICE vehicle [
6], the reliance on high carbon grids may lead to similar critiques to those found in Indonesia on the impact of electric vehicle transitions in an eco-tourism destination if the key power source continues to be coal-fired power stations [
34]. Linking the EV transition to the decarbonization of electricity grids is therefore essential to truly decarbonize drive transport and travel. A case study of Florida, USA-based initiatives are an example of linking transportation sector policy—“Drive Electric Orlando”—with destination-wide sustainability goals and energy security concerns—“Green Destination Orlando” [
37]. Waiting for the grid-wide transition to renewables to invest in EV infrastructure will leave these provinces behind on the EV transition. As these provinces decarbonize their electricity sources, emissions for EV-based travel will drop even faster, wherein linking the decarbonization of electricity could be done in conjunction so that EV usage and infrastructure contribute to small reductions in the short term, and when grids decarbonize, transportation sectors’ emissions will simultaneously drop significantly.
Developing EV infrastructures for inter-city and tourism travel requires strategic planning considerations that are different from the needs of commuters and intra-urban travel. The tourism community, including federal/provincial tourism agencies, destination communities, and accommodation and attraction operators, need to collaborate to advocate for and plan a charging infrastructure that supports the tourism experience. The ability to charge while staying at accommodations is critical for multi-day trips, yet our review of the over 6700 accommodations listed on Booking.com across Canada revealed that in August 2023, only 14% had any charging capacity. Hotels were somewhat more prepared for this growing market segment, with 22% having some charging capacity. Access to attractions in destinations poses an additional ‘last mile/kilometer’ challenge. While 33 national parks and over 70% of suggested destinations along the 94 assessed routes have charging stations, these are primarily placed in info-centre parking lots. Placing charging stations in strategic locations at destinations near tourism locations such as trailheads, beaches, and historical sites would make EVs as convenient as ICE vehicles during nature-based tourism since charging stations require EV drivers to wait while their vehicles charge. Ramos et al. [
47] suggests these could provide economic opportunities, create jobs, and add value in the creation of “smart” destinations, if planned appropriately. Alternatively, there could be strategic thinking about how to deal with the “last mile” transportation from the charging station to a desirable location to wait, such as those with public transit, bike- and scooter-sharing programs, or other options. In rural areas with high amounts of tourism and low amounts of vehicle ownership, Einolander and Kiviaho [
36], Zorn and Suni [
33] suggest that EV sharing systems could be especially relevant, citing examples in Norway and the USA that use app-based platforms to share electric vehicles. This would provide a new solution for tourists from out-of-the-region, province, or country, wherein, currently, EVs are only rarely available to rent from traditionally ICE rental vehicle companies, and at higher prices where they are available.
While results demonstrate that EVs deliver huge benefits in the form of lower energy costs and climate change-causing GHG emissions, and infrastructural investment and technological advancement could ensure EVs are as convenient as ICE vehicles, it is worthwhile to rethink transit and mobility at large including the symbolic associations between cars and leisure travel [
9], and to implement key technology, management, and policies at the onset of this transition to guide the EV revolution to address not only climate change but other, related travel and transport issues. Currently 21% of rural Canadians feel there are no EV models that meet their vehicle needs (compared with only 10% of urban respondents) [
17]. Research to understand what vehicle needs drive tourists, nature-based tourists, national parks visitors, and outdoor recreation participants require would be valuable to ensure the proper infrastructure, such as charging stations for electric RVs or in campgrounds, is increasingly available. Furthermore, understanding the changing range with vehicle weight and aerodynamics from, for example, canoes, kayaks, skis, or bikes strapped to cars may also point to the development of EV-specific add-ons which would assist the transition. Future research could also investigate the feasibility and challenges associated with other zero-emission technologies such as hydrogen vehicles.
Beyond incentivizing their use by improving their capabilities, as EVs alter mobility, new policies will be needed to address these changes. At present, there are limited policies, zoning legislations, or laws regarding EVs and/or the association of EVs with climate change within Canada, which can be divided into incentive policies, criminal acts, and zoning. The City of London (2021) in England, for example, addresses urban congestion and smog with a congestion charge within the downtown area for ICE vehicles, while allowing access to downtown and free or reduced charge parking for zero-emission vehicles. In a tourism context, many destinations such as the Alta and Snowbird ski resort in Utah, USA are placing free EV parking in prime locations to encourage low-carbon travel and reduce the air pollution in their local valley [
52]. Ontario and Quebec have added EV charger blocking to their provincial highway laws as criminal acts resulting in fines between
$100 and
$200 [
21,
53]. Vancouver, British Columbia, Sudbury, Ontario, and London, Ontario, have or are working on municipal bylaws which prohibit the use of an EV-charging parking space by an ICE vehicle [
19,
20,
54,
55]. Similar concerns and opportunities arise differently across the provinces with regard to policies surrounding single-occupant EVs in carpool lanes, or on ferries [
56], and thinking critically about how such policies may work now and in the future as more people drive EVs.
Conversely, serious concerns have been raised about the environmental impact of EV production including, specifically, the sustainability of Li-ion batteries [
57], and EVs also do not solve many other tourism, transport, and mobility challenges such as those of congestion, traffic, and parking [
23]. In 2018, over 25.1 million people visited national parks and national historic sites in Canada, with over 4.1 million visitors to Banff National Park alone [
58]. Using passenger vehicles at current average capacities of 1.6 people per car mean that current visitation causes the travel of 2.6 million cars in Banff National Park annually and 15.7 million cars across all national parks and historic sites. Car travel also requires large areas of land, estimated to be 5 acres per 1000 people (or 625 cars) at both the source market and the destination [
48], which is within a small, fragile ecosystem or is damaging to cultural sites. This land and energy use, as well as traffic and parking congestion can be reduced significantly using (electric) busses; only 61,500 bus trips or 4100 trains would be required annually to serve Banff [
48]. In highly trafficked urban-to-rural tourism corridors such as Calgary—Banff, Vancouver’s Sea to Sky, Toronto—Georgian Bay, or the Montreal—Quebec’s St. Lawrence region, especially those areas with small and crowded tourism and recreation destinations, may benefit from pursuing (electrified) public transit alongside EV development to alleviate additional mobility, transportation, and over-tourism concerns.
5. Conclusions
As Canada is preparing for the phase-out of ICE vehicles (new ICE sales are to end in 2035), understanding the EV readiness of provinces and territories for inter-city and nature-based tourism travel is a key part of the transition and emission reduction strategy for Canadian domestic tourism. Tourism is responsible for creating substantial emissions at a global scale and the industry recognizes its responsibility to reduce emissions to be consistent with the science-based targets within the Paris Agreement. The absence of detailed climate change response strategies, both in adaptation and mitigation, raises fundamental questions about whether tourism truly can be one of the economic pillars in a decarbonized and climate-resilient economy [
38,
59,
60,
61,
62,
63]. The EV readiness of Great Canadian Road Trips is an indicator of the country’s progress on the low-carbon transition. This analysis demonstrated that important infrastructure gaps must be addressed to facilitate the decarbonization of road-based tourism transport in Canada and to provide equal access to national park-based tourism for the growing EV market. While the convenience of EV road trips is not yet equal to that of ICE engine vehicles in all regions, the future of EVs results shows increasing viability and parity with ICE vehicle use in tourism and road trip situations.
This research provides a new and transferable methodology that can be applied to other tourism itineraries and destinations both within Canada and abroad to assess EV readiness and highlight potential policy or infrastructural gaps within a region. Furthermore, to provide a temporal analysis of the EV transition and decarbonization, this study can be easily reassessed as EV ranges improve, gas or electricity prices change, or electricity grids decarbonize to demonstrate the rate of improvement and direct future management, policies, and investments to decarbonize drive tourism. More multidisciplinary research into the co-benefits as well as the trade-offs of EVs’ use, production, and life cycle may help guide the EV transition and decarbonization transformation of tourism and transportation.
The rapid transition to EVs that is upon us, including the charging infrastructure investment, technological advancement, and user behaviour, offer an opportunity to rethink and reimagine tourism and travel that fits a decarbonized future. This will require not only increased EV infrastructures and incentives, but wider systemic changes in cross-country travel and rural transit systems, rethinking the life cycle of vehicle production, and shifting our electricity production to renewable sources. To reduce the barriers to entry and to encourage drivers and tourists alike to switch to electric vehicles, there needs to be significant education and communication to demonstrate how to rent, purchase, receive rebates, charge, and use these new vehicles and charging systems, and to depoliticize the electric vehicle. In the rural travel and drive tourism sector specifically, an increased range, four-wheel drive, and the ability to transport outdoor recreation equipment such as skis, bikes, or canoes might further encourage EV use across Canada’s natural parks and remote landscapes. EV access to parks, trails, and outdoor recreation of all types needs to be comparable to those of ICE vehicles to achieve the policy goal of 100% EV new vehicle sales in 2035. That will only become a reality when their access and convenience, cost, and ease of use become comparable to or better than that of ICE vehicles.


