
Opportunities and Challenges for Locally Sourced Meat and Seafood: An Online Survey of U.S. Restaurant Procurers


Abstract
:1. Introduction
2. Materials and Methods
Regression Models
3. Results
3.1. Characteristics of All Restaurant Respondents
3.2. Characteristics of Restaurants Purchasing Local Proteins
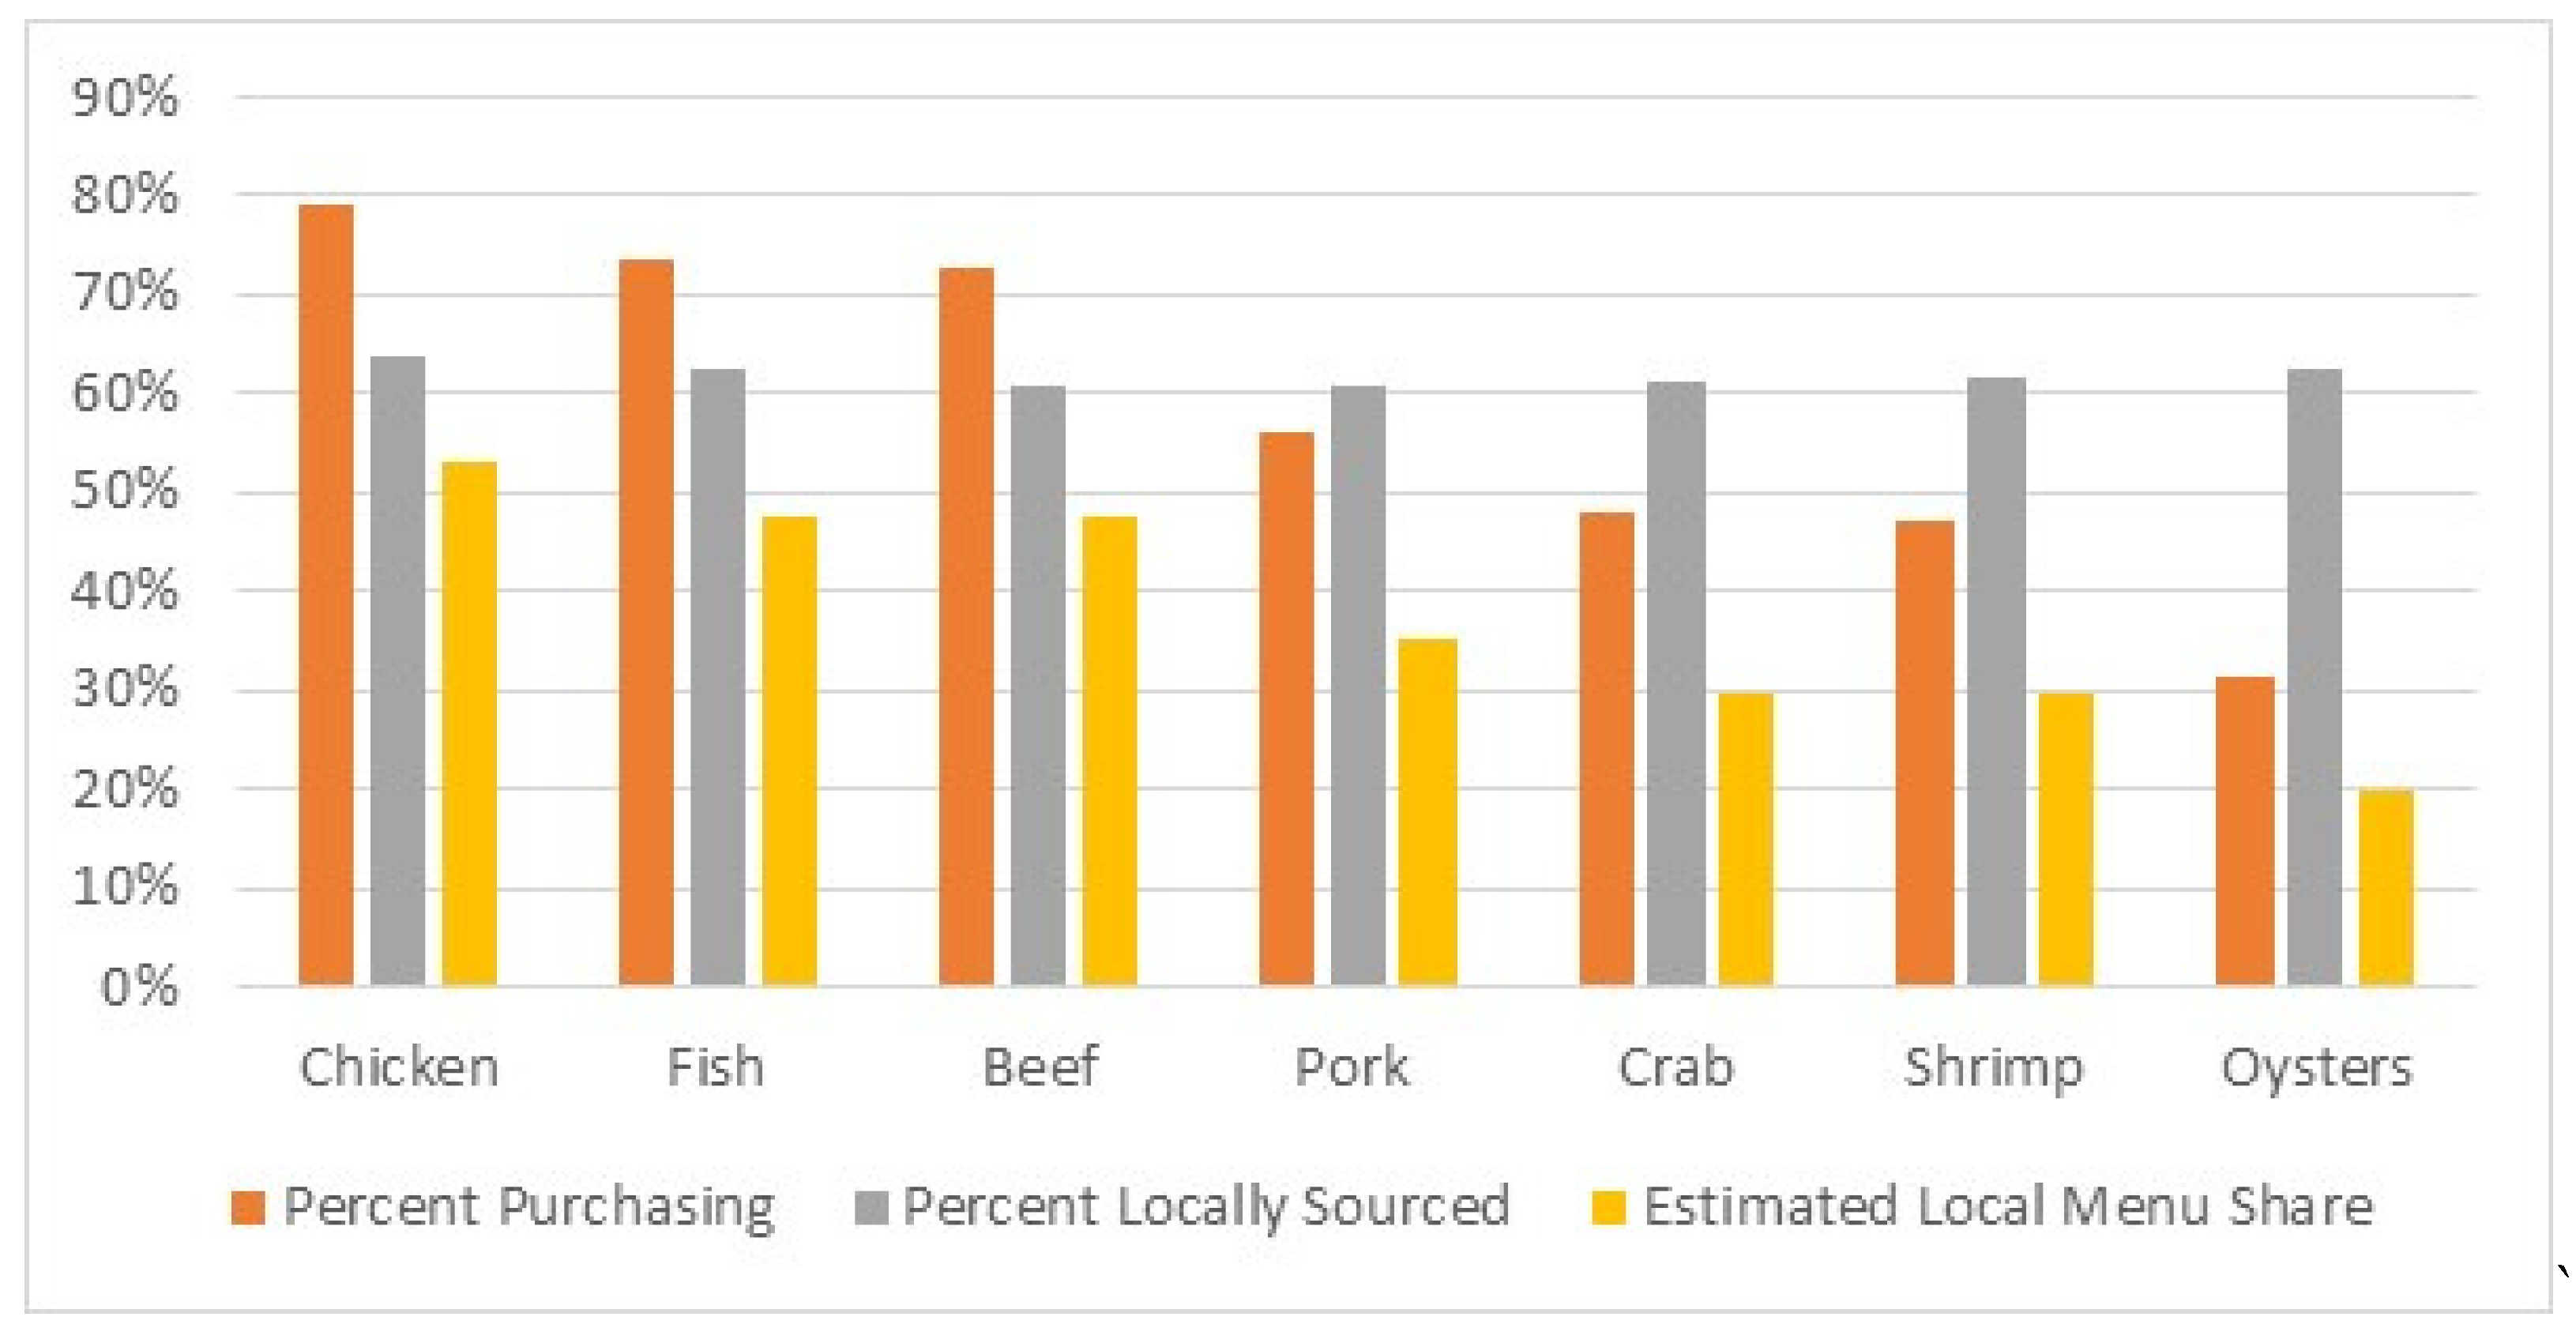
3.3. Local Proteins Purchased and Desired
3.4. Desired Traits and Barriers When Purchasing Local Proteins
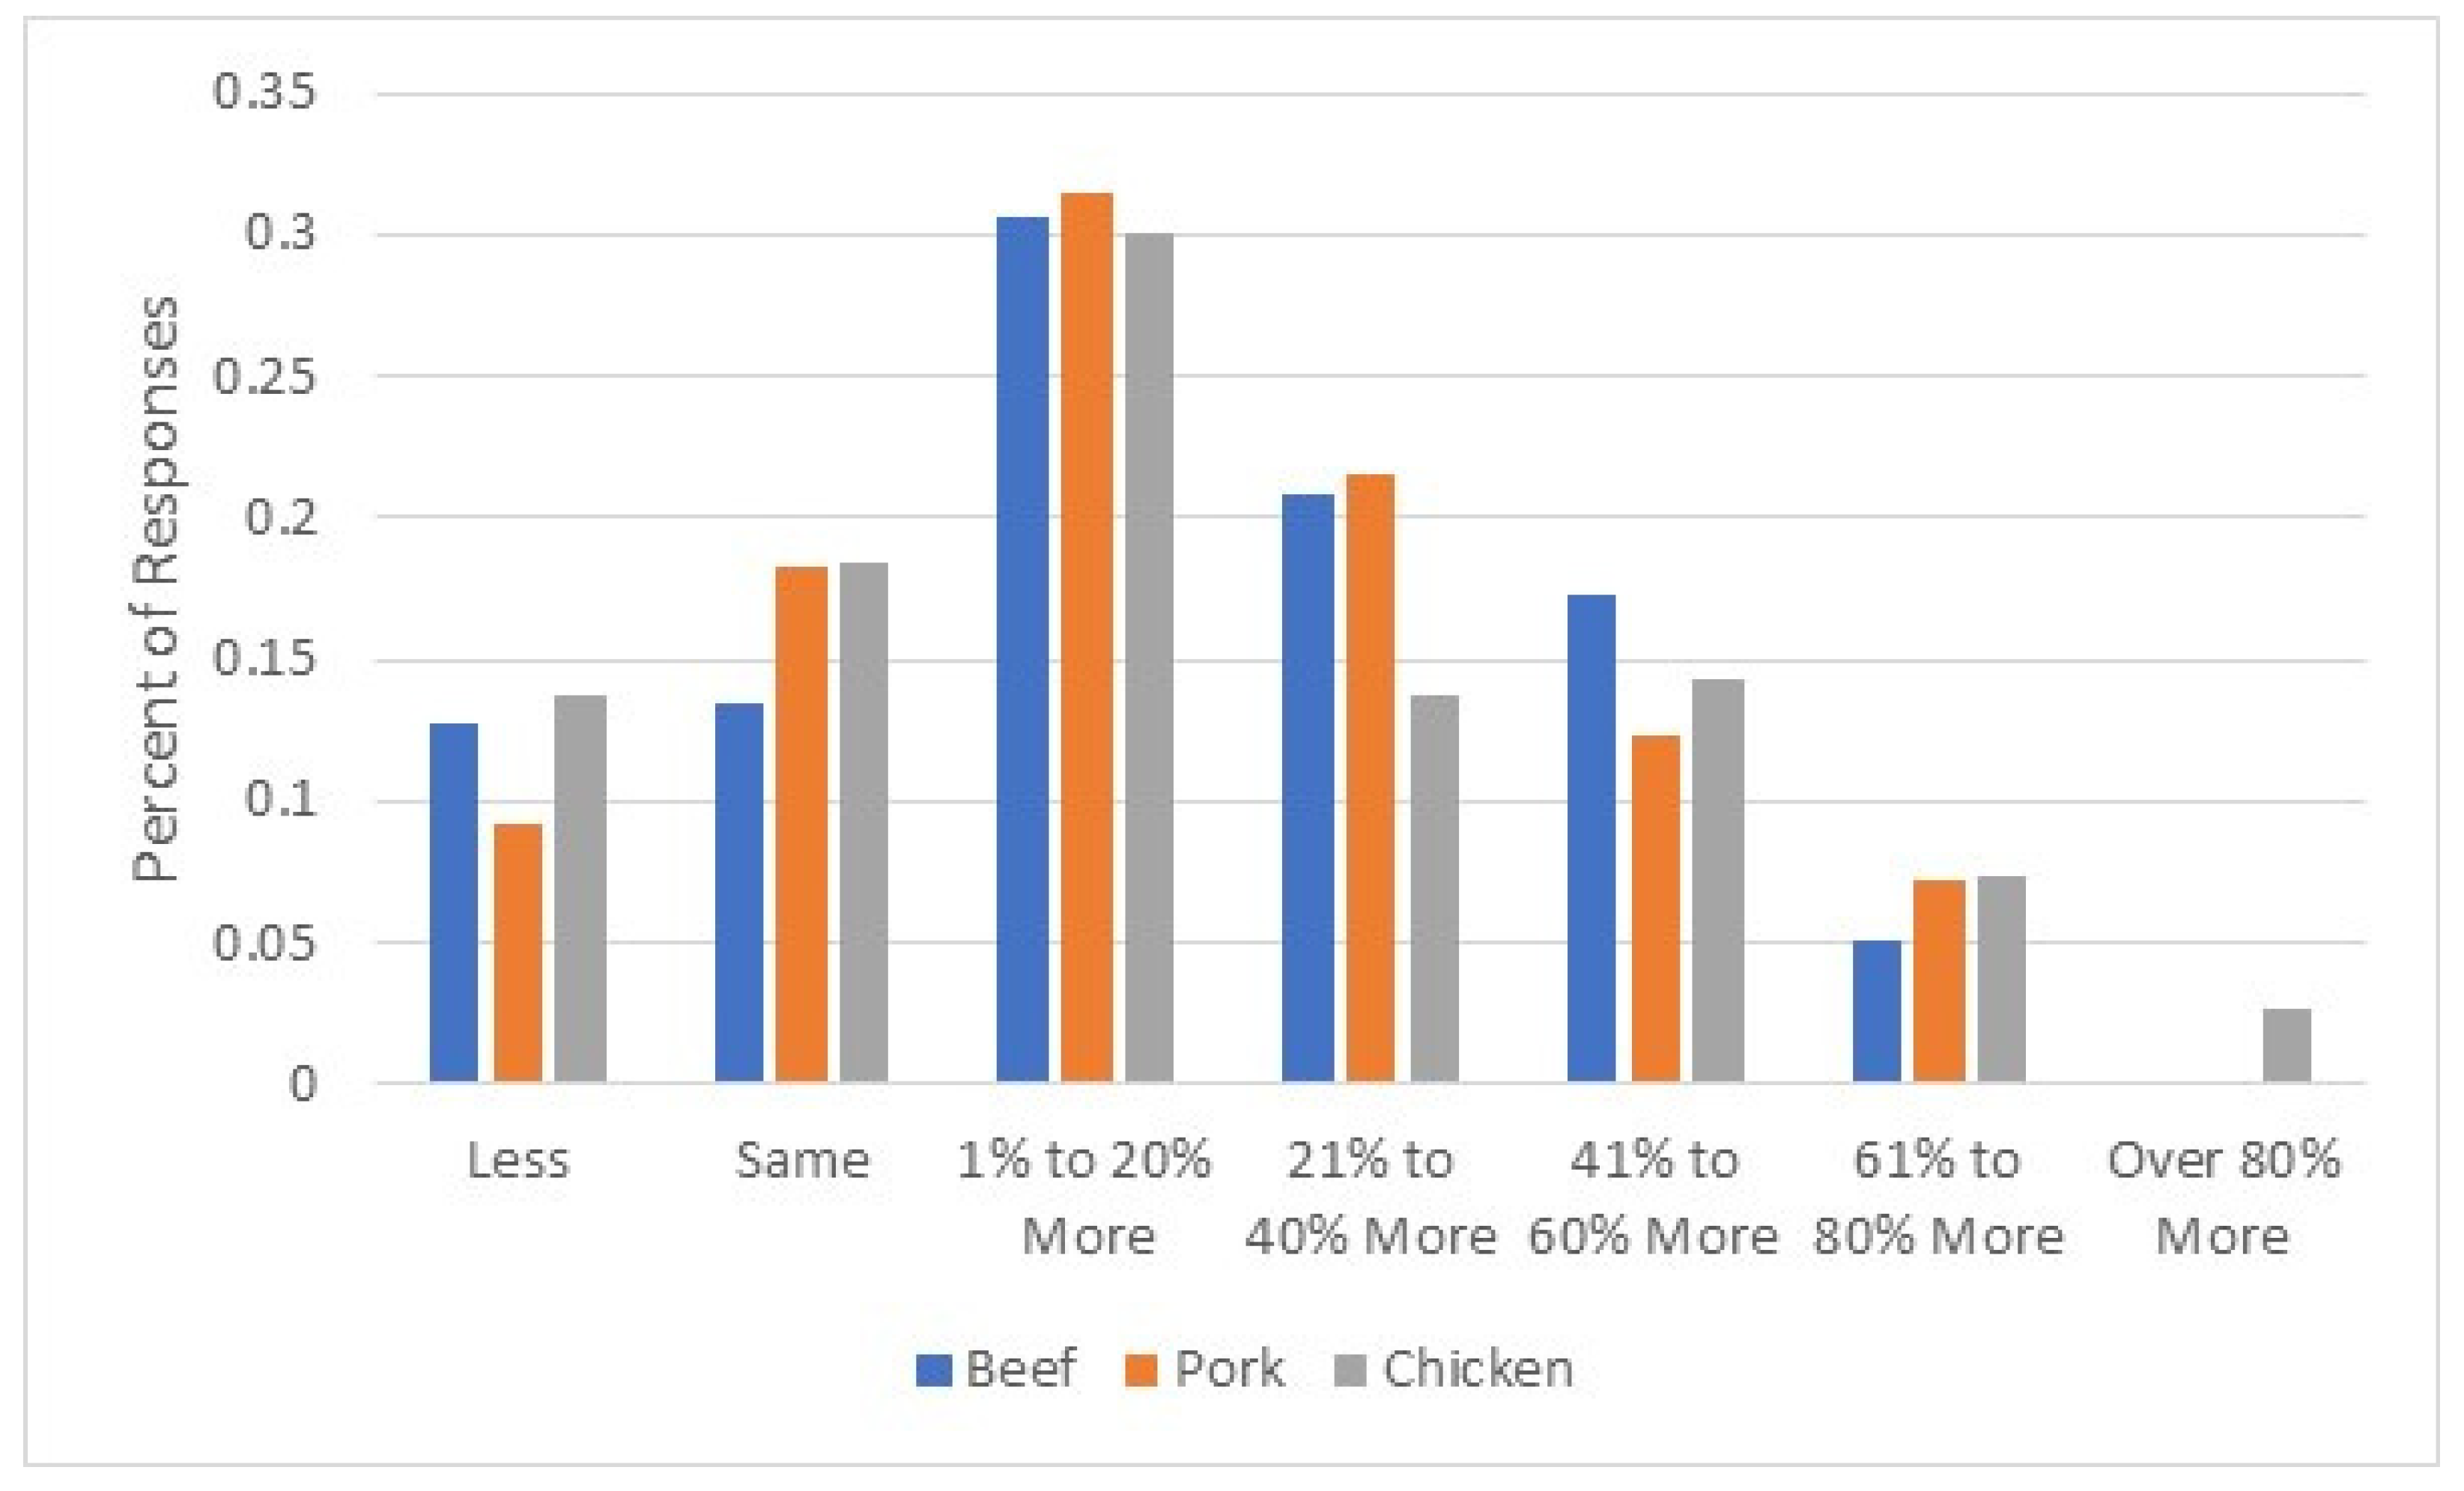
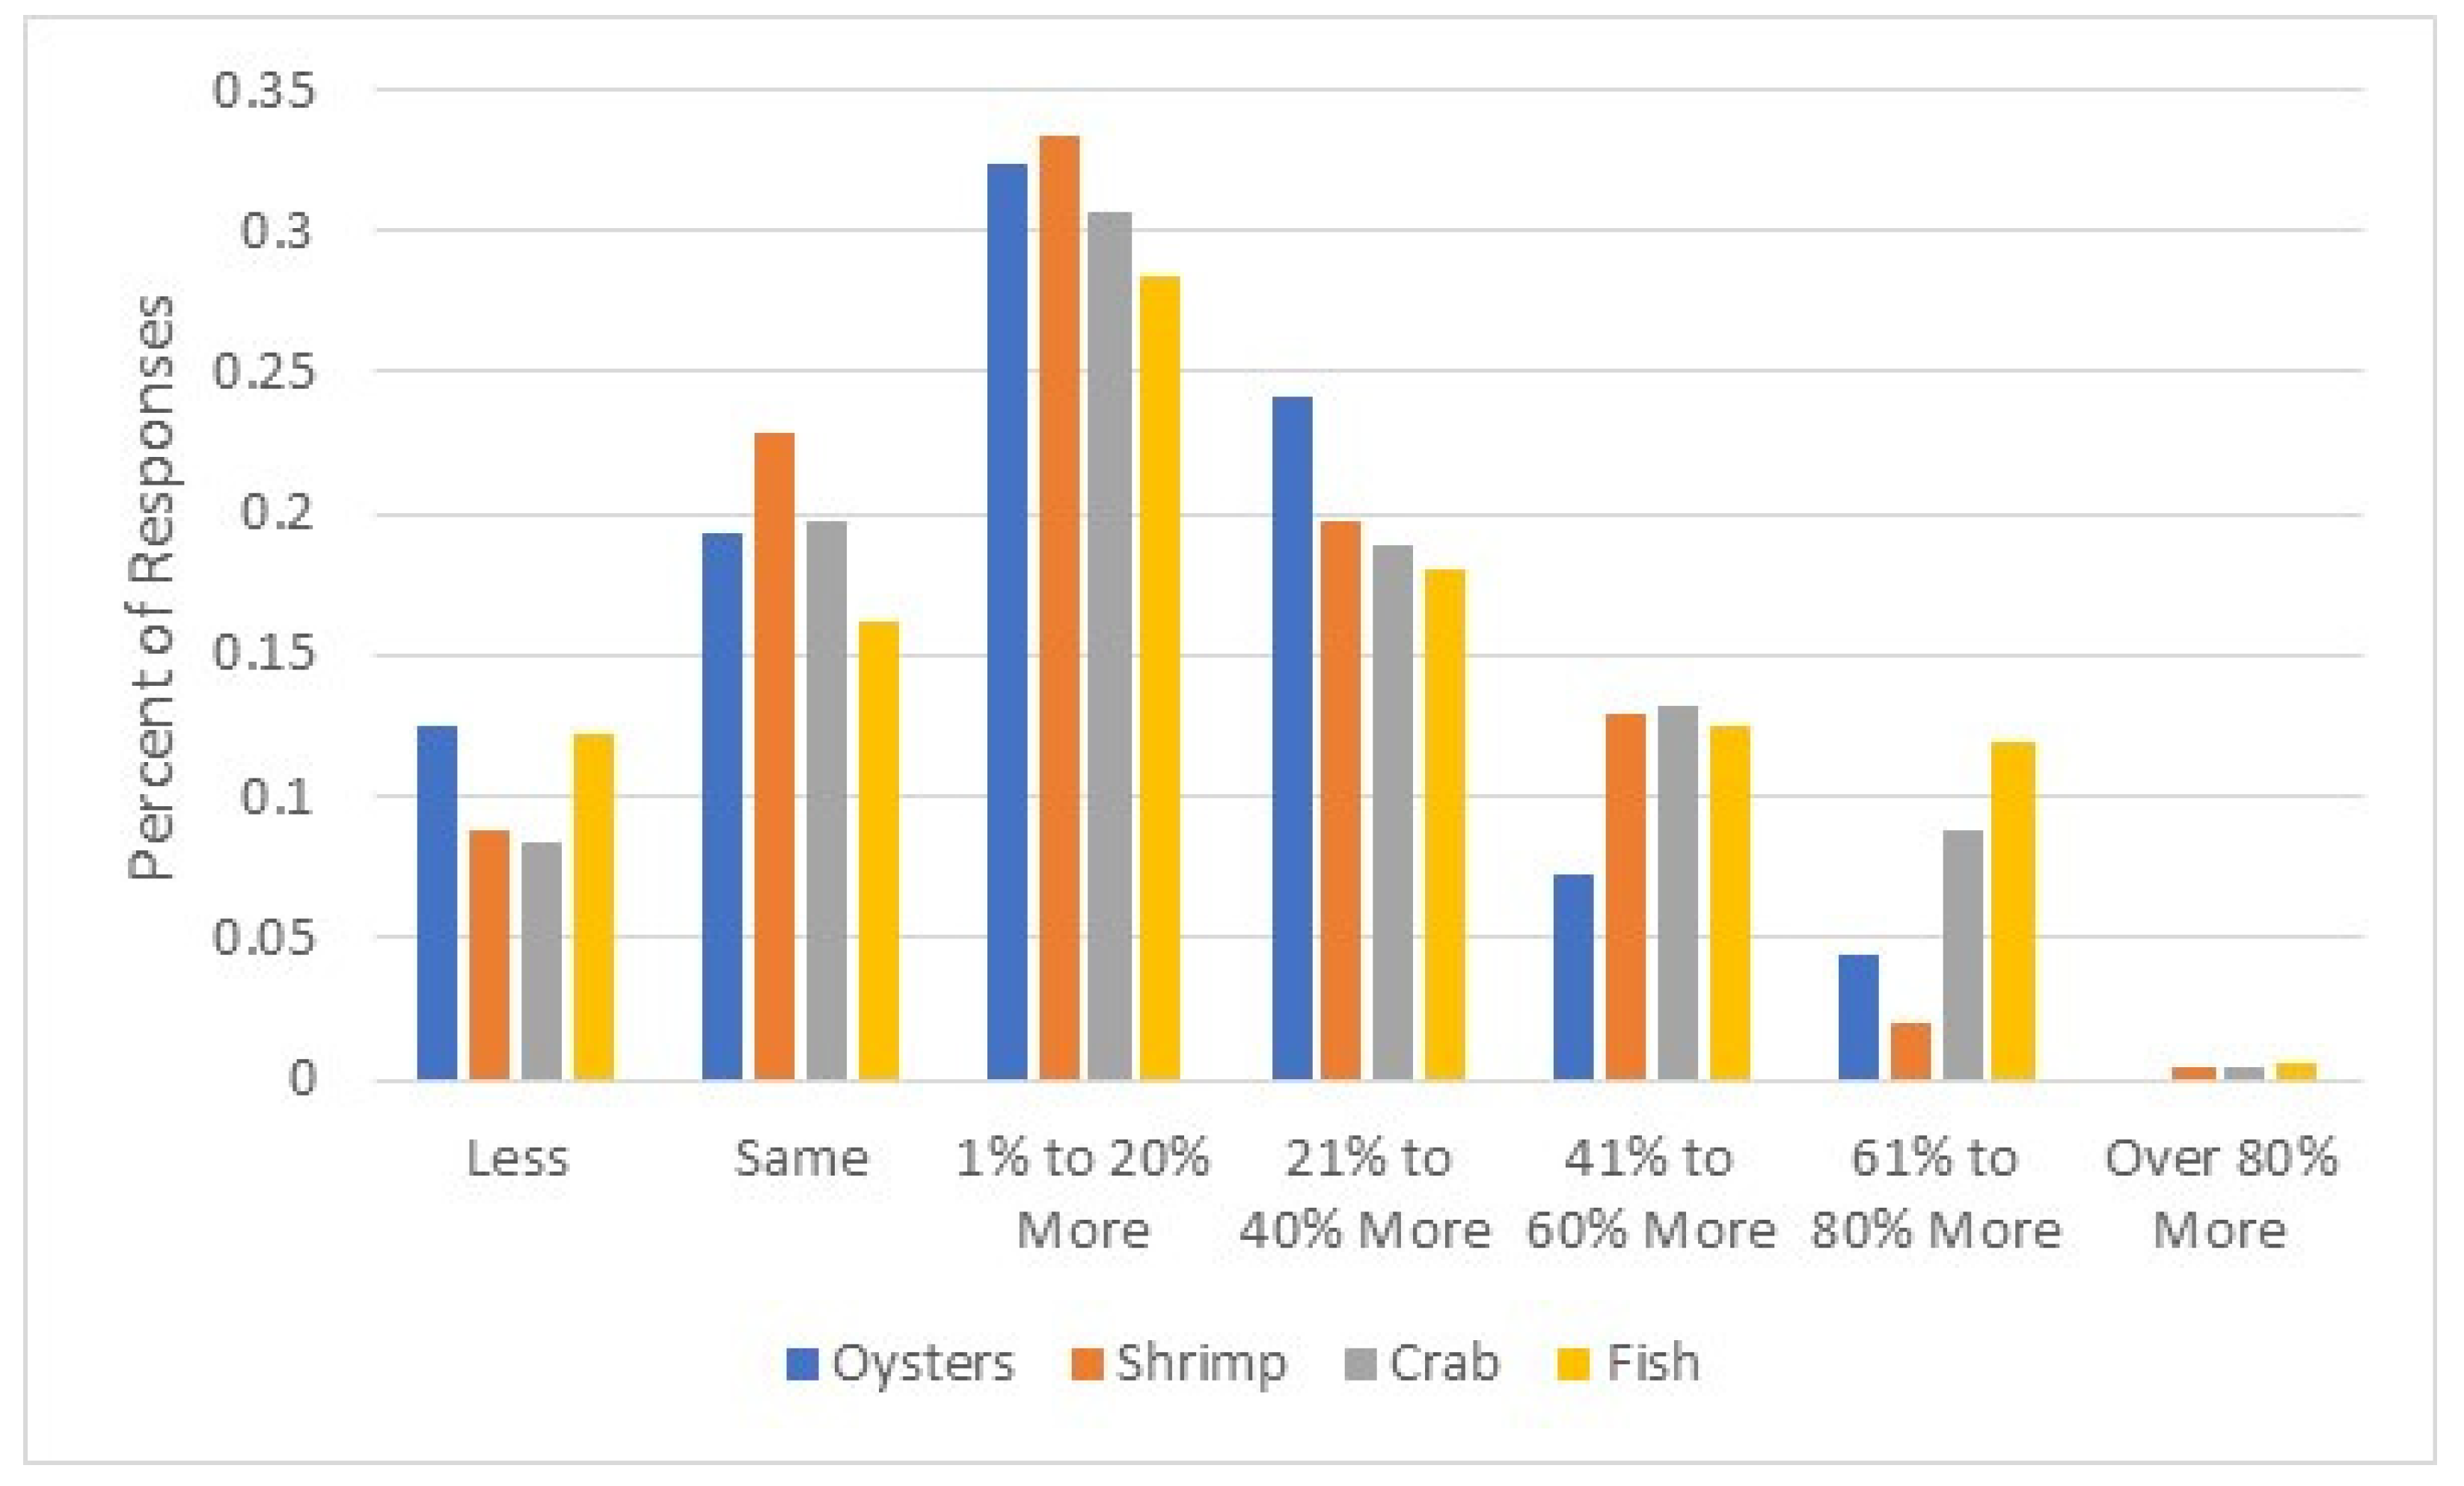
3.5. Willingness to Pay for Local Proteins
3.6. Logistic Regression Results
3.7. Ordered Logit Regression Results
4. Discussion
4.1. Characteristics of Restaurants That Buy Local Proteins
4.2. Desired Attributes of Local Meat and Seafood
4.3. Barriers to Purchasing or Purchasing More Local Proteins
4.4. Restaurants’ Willingness to Pay for Local Proteins
5. Conclusions
6. Limitations and Future Research
Author Contributions
Funding
Institutional Review Board Statement
Informed Consent Statement
Data Availability Statement
Acknowledgments
Conflicts of Interest
Appendix A. Regression Tables

| Local Beef | Local Pork | Local Chicken | ||||
|---|---|---|---|---|---|---|
| Coefficients | Value/SE | t Value | Value/SE | t Value | Value/SE | t Value |
| Type | −0.327 | −4.23 *** | −0.311 | −3.51 *** | −0.149 | −2.19 ** |
| (0.077) | (0.088) | (0.068) | ||||
| Seats | −0.117 | −1.08 | −0.208 | −1.74 * | −0.331 | −3.18 *** |
| (0.107) | (0.101) | (0.104) | ||||
| EntréeCost | 0.158 | 1.75 * | −0.023 | −0.23 | 0.046 | 0.54 |
| (0.090) | (0.101) | (0.086) | ||||
| Alcohol | −0.096 | 0.37 | −0.0502 | −0.18 | −0.0273 | −0.12 |
| (0.259) | (0.272) | (0.231) | ||||
| LocalRes | −0.085 | −0.60 | −0.239 | −1.52 | −0.208 | −1.54 |
| (0.140) | (0.157) | (0.135) | ||||
| OtherLocal | −0.016 | −0.05 | 0.474 | 1.37 | 0.110 | 0.41 |
| (0.308) | (0.346) | (0.270) | ||||
| Years | 0.124 | 0.88 | 0.222 | 1.38 | 0.195 | 1.45 |
| (0.139) | (0.160) | (0.135) | ||||
| South | −0.671 | −3.10 ** | −0.386 | −1.62 | −0.787 | −3.81 *** |
| (0.216) | (0.238) | (0.206) | ||||
| East | 0.308 | 1.43 | 0.317 | 1.31 | 0.469 | 2.32 ** |
| (0.214) | (0.242) | (0.202) | ||||
| Intercepts: | Value | Std. Error | Value | Std. Error | Value | Std. Error |
| 1|2 | −2.553 | 0.7101 | −2.652 | 0.8214 | −2.4071 | 0.6573 |
| 2|3 | −1.602 | 0.6962 | −1.246 | 0.8014 | −1.2592 | 0.6466 |
| 3|4 | −0.122 | 0.6922 | 0.2760 | 0.7945 | 0.1354 | 0.6428 |
| 4|5 | 1.015 | 0.6983 | 1.5174 | 0.8012 | 0.9238 | 0.6468 |
| 5|6 | 3.326 | 0.7294 | 2.8865 | 0.8339 | 1.9099 | 0.6420 |
| 6|7 | 3.3241 | 0.7122 | ||||
| Res. Dev.: 952.12 | Res. Dev.: 773.98 | Res. Dev.: 1131.29 | ||||
| AIC: 980.12 | AIC: 801.98 | AIC: 1161.29 | ||||
| Local Oysters | Local Shrimp | Local Crab | Local Fish | |||||
|---|---|---|---|---|---|---|---|---|
| Coefficients | Value/SE | t Value | Value/SE | t Value | Value/SE | t Value | Value/SE | t Value |
| Type | −0.064 | −0.67 | 0.066 | −0.76 | 0.180 | −1.93 * | −0.155 | −2.26 ** |
| (0.096) | (0.087) | (0.093) | (0.069) | |||||
| Seats | −0.062 | −0.0.45 | 0.177 | 1.42 | 0.102 | 0.78 | −0.305 | −2.91 *** |
| (0.139) | (0.124) | (0.130) | (0.105) | |||||
| EntréeCost | 0.095 | 0.88 | −0.100 | −1.02 | −0.005 | −0.05 | −0.040 | −0.44 |
| (0.108) | (0.098) | (0.102) | (0.089) | |||||
| Alcohol | −0.092 | −0.29 | 0.448 | 1.62 | 0.172 | 0.60 | 0.044 | 0.19 |
| (0.311) | (0.276) | (0.286) | (0.230) | |||||
| LocalRes | −0.205 | −1.15 | −0.252 | −1.49 | −0.328 | −1.93 * | −0.376 | −2.64 *** |
| (0.177) | (0.168) | (0.169) | (0.142) | |||||
| OtherLocal | 0.634 | 1.73 * | 0.314 | 0.90 | 0.817 | 2.23 ** | 0.040 | 0.16 |
| (0.367) | (0.348) | (0.366) | (0.263) | |||||
| Years | 0.140 | 0.74 | 0.031 | 0.21 | −0.011 | 0.06 | 0.169 | 1.24 |
| (0.190) | (0.147) | (0.179) | (0.136) | |||||
| South | −0.360 | −1.38 | −0.400 | −1.66 * | −0.367 | −1.47 | −0.756 | −3.64 *** |
| (0.261) | (0.240) | (0.249) | (0.208) | |||||
| East | 0.267 | 1.02 | −0.184 | −0.77 | 0.026 | 0.11 | 0.190 | 0.94 |
| (0.261) | (0.238) | (0.242) | (0.202) | |||||
| Intercepts | Value | Std. Error | Value | Std. Error | Value | Std. Error | Value | Std. Error |
| 1|2 | −0.8987 | 0.9233 | −1.4092 | 0.8802 | −1.3682 | 0.9123 | −2.6332 | 0.6600 |
| 2|3 | 0.3229 | 0.9122 | 0.2035 | 0.8722 | 0.1874 | 0.9061 | −1.5423 | 0.6487 |
| 3|4 | 1.7476 | 0.9194 | 1.6390 | 0.8769 | 1.6044 | 0.9107 | −0.2431 | 0.6418 |
| 4|5 | 3.3137 | 0.9453 | 2.7803 | 0.8848 | 2.5642 | 0.9139 | 0.6769 | 0.6440 |
| 5|6 | 4.5622 | 0.9989 | 4.9403 | 0.9733 | 3.6745 | 0.9298 | 1.6776 | 0.6521 |
| 6|7 | 6.5659 | 1.3252 | 6.7702 | 1.3478 | 4.6683 | 0.9418 | ||
| Res. Dev.: 640.76 | Res. Dev.: 775.65 | Res. Dev.: 756.44 | Res. Dev.: 1091.36 | |||||
| AIC: 668.8 | AIC: 805.65 | AIC: 86.44 | AIC: 1121.36 | |||||
| Local Beef | Local Pork | Local Chicken | ||||
|---|---|---|---|---|---|---|
| Coefficients | Value/SE | t Value | Value/SE | t Value | Value/SE | t Value |
| Type | 0.138 | 1.73 * | −0.043 | −0.47 | 0.089 | 1.29 |
| (0.080) | (0.092) | (0.069) | ||||
| Seats | −0.203 | −1.80 * | 0.139 | 1.01 | −0.174 | −1.51 |
| (0.113) | (0.137) | (0.115) | ||||
| EntréeCost | 0.250 | 2.47 ** | 0.168 | 1.53 | 0.190 | 2.00 ** |
| (0.102) | (0.110) | (0.095) | ||||
| Alcohol | 0.590 | 2.06 * | 0.607 | 2.00 ** | 0.453 | 1.78 * |
| (0.286) | (0.302) | (0.254) | ||||
| LocalRes | −0.262 | −1.66 * | −0.402 | −2.11 ** | −0.124 | −0.84 |
| (0.157) | (0.190) | (0.148) | ||||
| OtherLocal | 0.539 | 1.57 | 0.710 | 1.81 * | 0.222 | 0.82 |
| (0.343) | (0.392) | (0.270) | ||||
| Years | −0.127 | −0.08 | −0.065 | −0.35 | −0.081 | −0.55 |
| (0.157) | (0.185) | (0.148) | ||||
| South | −0.580 | −2.58 *** | −0.784 | −3.00 *** | −0.912 | −4.21 *** |
| (0.225) | (0.261) | (0.218) | ||||
| East | −0.039 | −0.17 | 0.363 | 1.35 | 0.1570 | 0.24 |
| (0.229) | (0.268) | (0.211) | ||||
| Intercepts: | Value | Std. Error | Value | Std. Error | Value | Std. Error |
| 1|2 | −1.8739 | 0.8182 | −0.6589 | 0.9259 | −3.3809 | 0.7730 |
| 2|3 | 0.3974 | 0.7625 | 1.1839 | 0.8938 | −1.1106 | 0.6943 |
| 3|4 | 1.3068 | 0.7866 | 2.3225 | 0.9072 | −0.1978 | 0.6936 |
| 4|5 | 2.9769 | 0.7807 | 3.4859 | 0.9230 | 1.4612 | 0.6961 |
| Res. Dev.: 738.09 | Res. Dev.: 618.67 | Res. Dev.: 832.53 | ||||
| AIC: 809.09 | AIC: 644.67 | AIC: 858.53 | ||||
| Local Oysters | Local Shrimp | Local Crab | Local Fish | |||||
|---|---|---|---|---|---|---|---|---|
| Coefficients | Value/SE | t Value | Value/SE | t Value | Value/SE | t Value | Value/SE | t Value |
| Type | 0.020 | −0.15 | −0.106 | −1.01 | −0.035 | −0.33 | 0.012 | 0.17 |
| (0.139) | (0.105) | (0.108) | (0.071) | |||||
| Seats | 0.080 | 0.38 | 0.016 | 0.11 | 0.005 | 0.03 | −0.114 | −1.02 |
| (0.209) | (0.147) | (0.152) | (0.111) | |||||
| EntréeCost | 0.169 | 1.19 | 0.101 | 0.90 | 0.231 | 2.04 ** | 0.221 | 2.28 ** |
| (0.142) | (0.112) | (0.114) | (0.097) | |||||
| Alcohol | 0.455 | 1.09 | 1.240 | 3.51 *** | −0.118 | −0.37 | 0.386 | 1.55 |
| (0.416) | (0.354) | (0.316) | (0.249) | |||||
| LocalRes | 0.113 | 0.47 | −0.627 | −2.9 *** | 0.290 | 1.52 | 0.155 | 1.02 |
| (0.244) | (0.211) | (0.190) | (0.152) | |||||
| OtherLocal | 1.075 | 2.15 ** | 0.532 | 1.31 | 0.099 | 0.25 | −0.146 | −0.53 |
| (0.500) | (0.406) | (0.395) | (0.276) | |||||
| Years | −0.169 | −0.72 | 0.289 | 1.75 * | 0.044 | 0.22 | −0.004 | −0.03 |
| (0.234) | (0.165) | (0.200) | (0.140) | |||||
| South | −0.701 | −1.93 * | −0.213 | −0.74 | −0.449 | −1.60 | −0.785 | −3.6 *** |
| (0.364) | (0.288) | (0.280) | (0.220) | |||||
| East | 0.333 | 0.92 | −0.213 | −0.74 | 0.127 | 0.46 | 0.151 | 0.70 |
| (0.363) | (0.290) | (0.275) | (0.222) | |||||
| Intercepts: | Value |
Std. Error | Value |
Std. Error | Value |
Std. Error | Value |
Std. Error |
| 1|2 | −1.9286 | 1.2013 | −0.1773 | 1.0876 | −3.6269 | 1.1065 | −3.5999 | 0.7555 |
| 2|3 | −0.4058 | 1.1670 | 2.1664 | 1.0192 | −1.4695 | 1.0265 | −1.5073 | 0.6932 |
| 3|4 | 0.4673 | 1.1654 | 3.2413 | 1.0289 | −0.4141 | 1.0201 | −0.4988 | 0.6908 |
| 4|5 | 2.4269 | 1.1785 | 4.7954 | 1.0626 | 1.3195 | 1.0235 | 0.8894 | 0.6908 |
| Res. Dev.: 329.16 | Res. Dev.: 504.80 | Res. Dev.: 521.74 | Res. Dev.: 810.18 | |||||
| AIC:355.2 | AIC:530.80 | AIC:547.74 | AIC:836.18 | |||||
| Local Beef | Local Pork | Local Chicken | ||||
|---|---|---|---|---|---|---|
| Coefficients | Value/SE | t Value | Value/SE | t Value | Value/SE | t Value |
| Type | 0.054 | 0.56 | −0.013 | −0.12 | 0.162 | 1.72 * |
| (0.097) | (0.111) | (0.094) | ||||
| Seats | −0.633 | −3.99 *** | −0.411 | −2.21 ** | −0.622 | −3.64 *** |
| (0.159) | (0.186) | (0.171) | ||||
| EntréeCost | 0.232 | 1.71 | 0.113 | 0.80 | 0.067 | 0.48 |
| (0.135) | (0.142) | (0.141) | ||||
| Alcohol | 1.420 | 4.02 *** | 0.824 | 2.36 ** | 1.234 | 3.72 *** |
| (0.353) | (0.349) | (0.331) | ||||
| LocalRes | −0.326 | −1.56 | −0.497 | −2.30 ** | −0.531 | −2.43 ** |
| (0.209) | (0.216) | (0.218) | ||||
| OtherLocal | 0.271 | 0.61 | 0.634 | 1.42 | 0.019 | 0.05 |
| (0.441) | (0.446) | (0.374) | ||||
| Years | 0.350 | 1.75 * | 0.238 | 1.00 | 0.038 | 0.18 |
| (0.200) | (0.238) | (0.204) | ||||
| South | −0.420 | −1.41 | −0.421 | −1.35 | −0.656 | −2.20 ** |
| (0.298) | (0.312) | (0.298) | ||||
| East | 0.418 | 1.40 | 0.218 | 0.71 | 0.671 | 2.29 ** |
| (0.298) | (0.309) | (0.292) | ||||
| Intercepts | Value | Std. Error | Value | Std. Error | Value | Std. Error |
| 1|2 | −3.6948 | 1.3521 | −1.9778 | 1.1650 | −3.9954 | 1.1682 |
| 2|3 | 0.1272 | 0.9241 | 0.1387 | 1.0764 | −1.2411 | 0.9523 |
| 3|4 | 1.5592 | 0.9247 | 1.2700 | 1.0775 | 0.2357 | 0.9467 |
| 4|5 | 3.0660 | 0.9415 | 2.7328 | 1.0904 | 1.8436 | 0.9554 |
| Res. Dev.: 485.26 | Res. Dev.: 423.27 | Res. Dev.: 458.27 | ||||
| AIC: 511.26 | AIC: 449.27 | AIC: 484.27 | ||||
| Local Oysters | Local Shrimp | Local Crab | Local Fish | |||||
|---|---|---|---|---|---|---|---|---|
| Coefficients | Value/SE | t Value | Value/SE | t Value | Value/SE | t Value | Value/SE | t Value |
| Type | −0.260 | −2.08 ** | −0.046 | −0.38 | 0.068 | 0.55 | 0.146 | 1.56 |
| (0.125) | (0.121) | (0.125) | (0.094) | |||||
| Seats | 0.064 | 0.35 | −0.135 | −0.79 | 0.178 | 0.95 | −0.348 | −2.22 ** |
| (0.182) | (0.169) | (0.187) | (0.157) | |||||
| EntréeCost | 0.290 | 2.08 ** | 0.175 | 1.20 | 0.067 | 0.47 | 0.333 | 2.47 ** |
| (0.139) | (0.146) | (0.142) | (0.135) | |||||
| Alcohol | 0.713 | 1.89 * | 1.389 | 3.80 *** | 0.969 | 2.45 ** | 1.487 | 4.51 *** |
| (0.376) | (0.365) | (0.395) | (0.330) | |||||
| LocalRes | 0.225 | 0.98 | −0.040 | −0.18 | −0.179 | −0.76 | 0.249 | 1.06 |
| (0.230) | (0.222) | (0.234) | (0.233) | |||||
| OtherLocal | −0.144 | −0.30 | 0.090 | 0.19 | −0.110 | −0.21 | −0.191 | −0.53 |
| (0.474) | (0.471) | (0.516) | (0.330) | |||||
| Years | −0.422 | −2.03 ** | −0.055 | −0.25 | 0.035 | 0.15 | −0.043 | −0.19 |
| (0.207) | (0.224) | (0.238) | (0.218) | |||||
| South | −0.658 | −2.04 ** | −0.522 | −1.66 * | −0.270 | −0.85 | −0.101 | −0.35 |
| (0.323) | (0.314) | (0.317) | (0.284) | |||||
| East | 0.554 | 1.69 | 0.454 | 1.43 | 0.393 | 1.17 | 0.167 | 059 |
| (0.328) | (0.317) | (0.336) | (0.286) | |||||
| Intercepts | Value | Std. Error | Value | Std. Error | Value | Std. Error | Value | Std. Error |
| 1|2 | −6.1667 | 1.5393 | −4.4130 | 1.5268 | −2.2887 | 1.3931 | −3.7622 | 1.1009 |
| 2|3 | −3.3800 | 1.1869 | −1.2753 | 1.1774 | 0.4836 | 1.2384 | −1.3115 | 0.9605 |
| 3|4 | −1.5956 | 1.1451 | 0.0573 | 1.1678 | 1.7955 | 1.2533 | 0.0485 | 0.9567 |
| 4|5 | 0.6698 | 1.1451 | 2.4388 | 1.1844 | 3.4385 | 1.2795 | 1.8564 | 0.9646 |
| Res. Dev.: 346.94 | Res. Dev.: 378.41 | Res. Dev.: 386.92 | Res. Dev.: 473.12 | |||||
| AIC:372.32 | AIC: 404.41 | AIC:412.92 | AIC:499.12 | |||||
References
- Adu-Gyamfi, A., Omer, R. I., Bartlett, J. R., Tackie, D. N. O., & Perry, B. J. (2016). Assessing florida consumer attitudes and beliefs about locally or regionally produced livestock and products. Professional Agricultural Workers Journal, 4(1), 11. [Google Scholar]
- Agabriel, J., Faure, B., Lebreton, F. X., Lherm, M., Micol, D., Garcia-Launay, F., Pradel, P., Angeon, V., & Martin, B. (2014). Salers: The Potential of a local cattle breed to contribute to the development of its home territory through its image and identified products. Cahiers Agricultures, 23(2), 138–147. [Google Scholar] [CrossRef]
- Angelopoulos, G. -P., Schulp, J. A., & De Oliveira Menezes, V. (2019). Local food and authenticity in Greek restaurants. Research in Hospitality Management, 9(1), 63–68. [Google Scholar] [CrossRef]
- Bacig, M., & Young, C. A. (2019). The halo effect created for restaurants that source food locally. Journal of Foodservice Business Research, 22(3), 209–238. [Google Scholar] [CrossRef]
- Barska, A., & Wojciechowska-Solis, J. E. (2020). Consumers and local food products: A perspective for developing online shopping for local goods in Poland. Sustainability, 12(12), 4958. [Google Scholar] [CrossRef]
- Batzios, C. H., Angelidis, P., Moutopoulos, D. K., Anastasiadou, C. H., & Chrisopolitou, V. (2003). Consumer attitude towards shellfish in the Greek market: A pilot study. Mediterranean Marine Science, 4(2), 155. [Google Scholar] [CrossRef]
- Brain, R., Curtis, K., & Hall, K. (2015). Utah farm-chef-fork: Building sustainable local food connections. Journal of Food Distribution Research, 46(1), 1–10. [Google Scholar]
- Byrd, E. S., Widmar, N. J. O., & Wilcox, M. D. (2018). Are consumers willing to pay for local chicken breasts and pork chops? Journal of Food Products Marketing, 24(2), 235–248. [Google Scholar] [CrossRef]
- Chamberlain, C. (2013, December 18). Visa crunches lunch numbers: Southerners eat out the most. Nashville Scene (Nashville, TN). Available online: https://www.nashvillescene.com/food_drink/visa-crunches-lunch-numbers-southerners-eat-out-the-most/article_3ea12a3a-339f-5ac0-aa9a-b7acb592be8c.html (accessed on 24 October 2022).
- Chambers, S., Lobb, A., Butler, L., Harvey, K., & Bruce Traill, W. (2007). Local, national and imported foods: A qualitative study. Appetite, 49(1), 208–213. [Google Scholar] [CrossRef]
- Cheng, H., & Capps, O. (1988). Demand analysis of fresh and frozen finfish and shellfish in the United States. American Journal of Agricultural Economics, 70(3), 533–542. [Google Scholar] [CrossRef]
- Cheplick, D. S., Motallebi, M., Richards, S., Dickes, L., Gaines, G., & Walters, K. (2021). Seafood consumption preferences and attributes influencing awareness of South Carolina aquaculture products. Food Distribution Research Society, 52(3), 24–45. [Google Scholar]
- Cho, C., Todd, J. E., & Saksena, M. (2018) September 27. Food spending of middle-income households hardest hit by the great recession. In Amber waves; U. S. Department of Agriculture Economic Research Service. Available online: https://www.ers.usda.gov/amber-waves/2018/september/food-spending-of-middle-income-households-hardest-hit-by-the-great-recession/ (accessed on 24 October 2022).
- Choi, J., Park, J., Jeon, H., & Asperin, A. E. (2021). Exploring local food consumption in restaurants through the lens of locavorism. Journal of Hospitality Marketing and Management, 30(8), 982–1004. [Google Scholar] [CrossRef]
- CRS. (2020). Local and urban food systems: Selected farm bill and other federal programs. congressional research service report #R46538. Available online: https://crsreports.congress.gov/product/pdf/R/R46538 (accessed on 26 November 2024).
- Curtis, K. (2014). Premium potential for geographically labeled, differentiated meat products. Journal of Agriculture, Food Systems, and Community Development, 4(2), 97–111. [Google Scholar] [CrossRef]
- Curtis, K., Feuz, S., & Aybar, N. (2012). Consumer willingness to pay for specialty meats. Utah State University Cooperative Extension, Department of Applied Economics. Available online: https://digitalcommons.usu.edu/cgi/viewcontent.cgi?referer=&httpsredir=1&article=2015&context=extension_curall (accessed on 24 October 2022).
- Curtis, K. R., & Cowee, M. W. (2009). Direct marketing local food to chefs: Chef preferences and perceived obstacles. Journal of Food Distribution Research, 40(2), 26–36. [Google Scholar] [CrossRef]
- Dragon, L. R. (2016). The dissemination of local food rhetoric via restaurant wait staff: A pilot study [Ph.D. dissertation, Syracuse University]. [Google Scholar]
- Eastwood, D. B. (1996). Using customer surveys to promote farmers’ markets: A case study. Journal of Food Distribution Research, 27(3), 23–30. [Google Scholar] [CrossRef]
- Grannis, J., Hooker, N. H., & Thilmany, D. (2000, June 29–July 1). Consumer preference for specific attributes in natural beef products. Western Agricultural Economics Association Annual Meeting (p. 36406), Vancouver, BC, Canada. [Google Scholar] [CrossRef]
- Greene, W. H. (2012). Econometric analysis (7th ed.). Prentice-Hall. [Google Scholar]
- Griffith, A., McKay, L., DeLong, K., Jensen, K., Boyer, C., & Lambert, D. (2018). Estimating restaurant willingness to pay for local beef (W 830). The University of Tennessee Extension Institute of Agriculture. Available online: https://utbeef.tennessee.edu/wp-content/uploads/sites/127/2020/11/W830.pdf (accessed on 26 August 2024).
- Guzman, J. (2020, May 5). The meat shortage has arrived: Grocers limit meat purchases as coronavirus threatens supply. The Hill. Available online: https://thehill.com/changing-america/resilience/natural-disasters/496135-grocers-limit-meat-purchases-as-coronavirus (accessed on 26 November 2024).
- Gwin, L., & Lev, L. (2011). Meat and poultry buying at farmers markets: A survey of shoppers at three markets in Oregon. Clemson University, Clemson Cooperative Extension. Available online: https://tigerprints.clemson.edu/joe/vol49/iss1/20/ (accessed on 24 October 2022).
- Harper, J. (2015). The new man and the sea: Climate change perceptions and sustainable seafood preferences of florida reef anglers. Journal of Marine Science and Engineering, 3(2), 299–328. [Google Scholar] [CrossRef]
- Herrmann, R. O., Rauniyar, G. P., Hanson, G. D., & Wang, G. (1994). Identifying frequent seafood purchasers in the northeastern U.S. Agricultural and Resource Economics Review, 23(2), 226–235. [Google Scholar] [CrossRef]
- House, L., Hanson, T. R., & Sureshwaran, S. (2003). U.S. consumers: Examining the decision to consume oysters and the decision of how frequently to consume oysters. Journal of Shellfish Research, 22(1), 52–59. [Google Scholar]
- Inwood, S. M., Sharp, J. S., Moore, R. H., & Stinner, D. H. (2009). Restaurants, chefs and local foods: Insights drawn from application of a diffusion of innovation framework. Agriculture and Human Values, 26(3), 177–191. [Google Scholar] [CrossRef]
- Knight, E. P., House, L., Nelson, M. C., & Degner, R. L. (2006). An evaluation of consumer preferences regarding goat meat in the south. Journal of Food Distribution Research, 37(1), 88–96. [Google Scholar] [CrossRef]
- Lang, M., & Lemmerer, A. (2019). How and why restaurant patrons value locally sourced foods and ingredients. International Journal of Hospitality Management, 77, 76–88. [Google Scholar] [CrossRef]
- Lillywhite, J. M., & Simonsen, J. (2014). E. consumer preferences for locally produced food ingredient sourcing in restaurants. Journal of Food Products Marketing, 20(3), 308–324. [Google Scholar] [CrossRef]
- Lin, B. -H. (2020). COVID-19 working paper: Shares of commodity consumption at home, restaurants, fast food places, schools, and other away-from-home places: 2013-16; (USDA ERS AP-085). U.S. Department of Agriculture Economic Research Service. Available online: https://www.ers.usda.gov/publications/pub-details/?pubid=100137 (accessed on 24 October 2022).
- Lin, M. S., Sharma, A., & Ouyang, Y. (2020). Role of Signals in consumers’ economic valuation of restaurant choices. Journal of Hospitality & Tourism Research, 44(7), 1080–1100. [Google Scholar] [CrossRef]
- Loureiro, M. L., & Hine, S. (2002). Discovering niche markets: A comparison of consumer willingness to pay for local (colorado grown), organic, and GMO-free products. Journal of the Agricultural and Applied Economics, 34(3), 477–487. [Google Scholar] [CrossRef]
- Love, D. C., Asche, F., Conrad, Z., Young, R., Harding, J., Nussbaumer, E. M., Thorne-Lyman, A. L., & Neff, R. (2020). Food sources and expenditures for seafood in the United States. Nutrients, 12(6), 1810. [Google Scholar] [CrossRef]
- Lusk, J., & McCluskey, J. J. (2020). Consumer behavior during the pandemic. In Economic impacts of COVID-19 on food and agricultural markets, CAST commentary QTA2020-3 (pp. 11–13). Council for Agricultural Science and Technology. Available online: https://www.cast-science.org/wp-content/uploads/2020/06/QTA2020-3-COVID-Impacts.pdf (accessed on 26 November 2024).
- Makweya, F. L., & Oluwatayo, I. B. (2019). Consumers’ preference and willingness to pay for graded beef in polokwane municipality, South Africa. Italian Journal of Food Safety, 8(1), 46–54. [Google Scholar] [CrossRef]
- McEachern, M. G., Warnaby, G., Carrigan, M., & Szmigin, I. (2010). Thinking locally, acting locally? Conscious consumers and farmers’ markets. Journal of Marketing Management, 26(5–6), 395–412. [Google Scholar] [CrossRef]
- McKay, L. C., DeLong, K. L., Jensen, K. L., Griffith, A. P., Boyer, C. N., & Lambert, D. M. (2019). Estimating restaurant willingness to pay for local beef. Agribusiness, 35(4), 610–624. [Google Scholar] [CrossRef]
- Megicks, P., Memery, J., & Angell, R. J. (2012). Understanding local food shopping: Unpacking the ethical dimension. Journal of Marketing Management, 28(3–4), 264–289. [Google Scholar] [CrossRef]
- Merritt, M. G., Delong, K. L., Griffith, A. P., & Jensen, K. L. (2018). Consumer willingness to pay for tennessee certified beef. Journal of the Agricultural and Applied Economics, 50(2), 233–254. [Google Scholar] [CrossRef]
- Naspetti, S., & Bodini, A. (2008). Consumer perception of local and organic products: Substitution or complementary goods? The International Journal of Interdisciplinary Social Sciences, 3(2), 111–122. [Google Scholar] [CrossRef]
- Niche Meat Processor Assistance Network. (2022, June 23). State funding programs for meat processing facility improvements/upgrades/new facilities. Available online: https://www.nichemeatprocessing.org/state-funding-programs-for-meat-processing-facility-improvements-upgrades-new-facilities/ (accessed on 23 June 2022).
- NRA. (2010). National restaurant association research and economic analysis. Available online: https://restaurant.org/research-and-media/research/ (accessed on 23 May 2023).
- Ortiz, A. (2010). Customers’ willingness to pay a premium for locally sourced menu items [Master’s thesis, Iowa State University]. [Google Scholar] [CrossRef]
- Pepinski, K., & Thilmany, D. 2004 September. Direct marketing agricultural producers to restaurants: The case of Colorado crop to cuisine. (AMR 04-03). Colorado State University Extension. [Google Scholar]
- Pesci, S., & Brinkley, C. (2022). Can a farm-to-table restaurant bring about change in the food system?: A case study of Chez Panisse. Food, Culture & Society, 25(5), 997–1018. [Google Scholar] [CrossRef]
- Picardy, J. A., Cash, S. B., & Peters, C. (2020). Uncommon alternative: Consumers’ willingness to pay for niche pork tenderloin in New England. Journal of Food Distribution Research, 51(2), 61–91. [Google Scholar] [CrossRef]
- Quagrainie, K. K. (2019). Consumer willingness to pay for a saline fish species grown in the US Midwest: The case of striped bass Morone saxatilis. Journal of the World Aquaculture Society, 50(1), 163–171. [Google Scholar] [CrossRef]
- Reynolds-Allieaâ’, K., & Fields, D. (2012). A comparative analysis of Alabama restaurants: Local vs. non-local food purchase. Journal of Food Distribution Research, 43(1), 1–10. [Google Scholar]
- Richards, S. (2020). Livestock producer survey results. [Unpublished report for Berkeley Electric Cooperative and the South Carolina Cattlemen’s Association; copy in possession of first author]. College of Agriculture, Forestry and Life Sciences, Clemson University. [Google Scholar]
- Richards, S., & Vassalos, M. (2020). COVID-19 amplifies local meat supply chain issues in South Carolina. Journal of Agriculture, Food Systems, and Community Development, 10(1), 191–195. [Google Scholar] [CrossRef]
- Richards, S., & Vassalos, M. (2021). COVID-19 and consumer demand for local meat products in South Carolina. Journal of Agriculture, Food Systems, and Community Development, 10(3), 31–36. [Google Scholar] [CrossRef]
- Richards, S., Vassalos, M., & Motallebi, M. (2022). Factors affecting consumer purchasing decisions and willingness to pay for oysters in South Carolina. Food Distribution Research Society, 53(2), 1–25. [Google Scholar]
- Roy, H., & Ballantine, P. W. (2020). Preferences and attitudes toward locally produced food sourcing in wholesale distributors: Restaurant and chef perspectives. Journal of Hospitality and Tourism Management, 45, 544–558. [Google Scholar] [CrossRef]
- Sanders, D. R., Moon, W., & Kuethe, T. H. (2007). Consumer willingness-to-pay for fresh pork attributes. Journal of Agribusiness, 25(2), 163–179. [Google Scholar] [CrossRef]
- Severt, K., Shin, Y. H., Chen, H. S., & DiPietro, R. B. (2022). Measuring the relationships between corporate social responsibility, perceived quality, price fairness, satisfaction, and conative loyalty in the context of local food restaurants. International Journal of Hospitality & Tourism Administration, 23(3), 623–645. [Google Scholar] [CrossRef]
- Shafieizadeh, K., & Tao, C. -W. (2020). How does a menu’s information about local food affect restaurant selection? The roles of corporate social responsibility, transparency, and trust. Journal of Hospitality and Tourism Management, 43, 232–240. [Google Scholar] [CrossRef]
- Sharma, A. (2007). Economic viability of local food marketing for Iowa restaurants, growers/producers. (Leopold Center Completed Grant Reports 274). Leopold Center for Sustainable Agriculture, Iowa State University. Available online: http://lib.dr.iastate.edu/leopold_grantreports/274 (accessed on 24 October 2022).
- Sharma, A., Moon, J., & Strohbehn, C. (2014). Restaurant’s decision to purchase local foods: Influence of value chain activities. International Journal of Hospitality Management, 39, 130–143. [Google Scholar] [CrossRef]
- Shi, R., & Hodges, A. W. (2016). Shopping at farmers’ markets: Does ease of access really matter? Renewable Agriculture and Food Systems, 31(5), 441–451. [Google Scholar] [CrossRef]
- Sri Lestari, V., Natsir, A., Karim, H., & Patrick, I. (2016). Factors affecting consumers’ willingness to pay for chicken meat from biosecure farms. International Journal of Economics and Management Engineering, 10(6), 2062–2066. [Google Scholar] [CrossRef]
- Stanton, J. L., Wiley, J. B., & Wirth, F. F. (2012). Who are the locavores? Journal of Consumer Marketing, 29(4), 248–261. [Google Scholar] [CrossRef]
- Stutzman, A. (2008). A meta-analysis of willingness to pay for local beef [Master’s thesis, Kansas State University]. Available online: https://krex.k-state.edu/dspace/handle/2097/40674 (accessed on 24 October 2022).
- Tackie, D. N. O., Bartlett, J. R., Adu-Gyamfi, A., De-Heer, S. M., Quarcoo, F. A., & Perry, B. J. (2018). The impact of socioeconomic factors and meat attributes on willingness to pay for locally or regionally produced livestock products in Georgia. International Journal of Economics, Commerce & Management, 5(11), 153–175. [Google Scholar]
- Tait, P., Rutherford, P., Driver, T., Li, X., Saunders, C., & Dalziel, P. (2018). Consumer insights and willingness to pay for attributes. Beef products in California, USA. (Research Report No. 348). Lincoln University, Agribusiness and Economics Research Unit. Available online: https://researcharchive.lincoln.ac.nz/handle/10182/10037 (accessed on 24 October 2022).
- The Food Industry Association [FMI], and Foundation for Meat and Poultry Education and Research. (2020). The power of meat: Midyear 2020 edition. Available online: https://www.fmi.org/forms/store/ProductFormPublic/power-of-meat-midyear-2020-edition (accessed on 26 November 2024).
- The New York Times. (2021, July 1). See Reopening plans and mask mandates for all 50 states. The New York Times Online. Available online: https://www.nytimes.com/interactive/2020/us/states-reopen-map-coronavirus.html (accessed on 26 November 2024).
- Thilmany, D. D., Grannis, J. L., & Sparling, E. (2003). Regional demand for natural beef products in Colorado: Target consumers and willingness to pay. Journal of Agribusiness, 21(2). [Google Scholar] [CrossRef]
- Torres, N. (2016, June 15). Why sourcing local food is so hard for restaurants. Harvard Business Review. Available online: https://hbr.org/2016/06/why-sourcing-local-food-is-so-hard-for-restaurants (accessed on 24 October 2022).
- Umberger, W. J., Feuz, D. M., Calkins, C. R., & Sitz, B. M. (2003). Country-of-origin labeling of beef products: U.S. consumers’ perceptions. Journal of Food Distribution Research, 34(3), 103–116. [Google Scholar] [CrossRef]
- US Census Bureau. (2020). Resident population for the 50 states, 2020 Census; United States Census Bureau. Available online: https://www2.census.gov/programs-surveys/decennial/2020/data/apportionment/apportionment-2020-table02.pdf (accessed on 2 December 2024).
- US Census Bureau. (2022) September 13. Income, poverty, and health insurance coverage in the U.S.: 2021. Press release number CB22-153; United States Census Bureau. Available online: https://www.census.gov/newsroom/press-releases/2022/income-poverty-health-insurance-coverage.html (accessed on 24 October 2022).
- USDA. (2021) July 9. USDA announces $500 million for expanded meat & poultry processing capacity as part of efforts to increase competition, level the playing field for family farmers and ranchers, and build a better food system. Press release 0154.21; U.S. Department of Agriculture. Available online: https://www.usda.gov/media/press-releases/2021/07/09/usda-announces-500-million-expanded-meat-poultry-processing (accessed on 26 November 2024).
- USDA ERS. (2020). Food availability and consumption; U.S. Department of Agriculture Economic Research Service. Available online: https://www.ers.usda.gov/data-products/ag-and-food-statistics-charting-the-essentials/food-availability-and-consumption/ (accessed on 24 October 2022).
- USDA ERS. (2021). Local food sales continue to grow through a variety of marketing channels; U.S. Department of Agriculture Economic Research Service. Available online: https://www.ers.usda.gov/amber-waves/2021/october/local-food-sales-continue-to-grow-through-a-variety-of-marketing-channels/ (accessed on 26 November 2024).
- USDA ERS. (2024). U.S. consumers increased spending on food away from home in 2023, driving overall food spending growth; U.S. Department of Agriculture Economic Research Service. Available online: https://www.ers.usda.gov/amber-waves/2024/october/u-s-consumers-increased-spending-on-food-away-from-home-in-2023-driving-overall-food-spending-growth/ (accessed on 26 November 2024).
- Van Houcke, J., Altintzoglou, T., Linssen, J., & Luten, J. (2018). Quality perception, purchase intention, and the impact of information on the evaluation of refined pacific cupped oysters (Crassostrea gigas) by Dutch consumers. Journal of the Science of Food and Agriculture, 98(12), 4778–4785. [Google Scholar] [CrossRef]
- Wessells, C. R., & Anderson, J. G. (1995). Consumer willingness to pay for seafood safety assurances. Journal of Consumer Affairs, 29(1), 85–107. [Google Scholar] [CrossRef]
- Wright, R. E. (1995). Logistic regression. In L. G. Grimm, & P. R. Yarnold (Eds.), Reading and understanding multivariate statistics (pp. 217–244). American Psychological Association. [Google Scholar]
- Yangui, A., Gil, J. M., & Costa-Font, M. (2019). Spanish consumers’ behaviour and the determining factors of their willingness to pay for organic olive oil. Informacion Técnica Económica Agraria, 115(3), 252–269. [Google Scholar] [CrossRef]
- Yen, S. T., & Huang, C. L. (1996). Household demand for finfish: A generalized double-hurdle model. Australian Journal of Agricultural and Resource Economics, 21(2), 1–15. [Google Scholar] [CrossRef]
- Yoon, B., Chung, Y., & Jun, K. (2020). Restaurant industry practices to promote healthy sustainable eating: A content analysis of restaurant websites using the value chain approach. Sustainability, 12(17), 7127. [Google Scholar] [CrossRef]

| Variable | Description | Response Categories |
|---|---|---|
| Type | Restaurant Type | (1) Fine Dining, (2) Premium Casual, (3) Casual Dining, (4) Fast Casual Dining, (5) Family Style, (6) Fast Food |
| Seats | Number of Seats | (1) Under 25, (2) 25 to 49, (3) 50 to 74, (4) 75 to 99, (5) 100 to 124, |
| (6) 125 to 149, and (7) 150 or more | ||
| Entrée Cost | Average Entrée Price | (1) USD 10 to USD 14, (2) USD 15 to USD 19, (3) USD 20 to USD 24, (4) USD 25 to USD 29, (5) USD 30 to USD 34, |
| and (6) USD 35 and over | ||
| Alcohol | Serves Alcohol | (1) Serves alcohol, (0) Does not serve alcohol |
| OtherLocal | Buys Other Local Foods | (1) Buys other local foods, (0) Does not buy other local foods |
| LocalRes | Percent Local Residents | (1) Mostly Tourists (>90%), (2) 75% Tourists/25% Local, |
| versus Tourist Customers | (3) 50% Tourists/50% Local, (4) 25% Tourists/75% Local, and (5) >90% Local | |
| Years | Years in Business | (1) 0 to 4 years, (2) 5 to 9 years, (3) 10 to 14 years, (4) 15 to 19 years, |
| (5) 20 to 24 years, and (6) over 25 years | ||
| South | Located in Southern U.S. | (1) Located in Southern U.S., (0) Not Located in Southern U.S. |
| East | Located in Eastern U.S. | (1) Located in Eastern U.S., (0) Not Located in Eastern U.S. |
| Percent | |
|---|---|
| Type of Restaurant | |
| Fine Dining | 26.2% |
| Premium Casual Dining | 22.6% |
| Casual Dining | 18.9% |
| Fast Casual Dining | 8.7% |
| Family Style | 9.2% |
| Fast Food | 14.3% |
| Seating Capacity | |
| Under 25 Seats | 1.9% |
| 25 to 49 Seats | 23.3% |
| 50 to 74 Seats | 37.9% |
| 75 to 99 Seats | 28.2% |
| 100 to 124 Seats | 6.8% |
| 125 to 149 Seats | 1.5% |
| 150 or More Seats | 0.5% |
| Average Entrée Cost | |
| USD 10 to USD 14 | 1.7% |
| USD 15 to USD 19 | 13.1% |
| USD 20 to USD 24 | 37.6% |
| USD 25 to USD 29 | 24.5% |
| USD 30 to USD 34 | 14.8% |
| USD 35 or More | 8.3% |
| Serves Alcohol | |
| Yes | 76.7% |
| No | 23.3% |
| Percent of Customers Local Versus Tourists | |
| Mostly Local (more than 90%) | 10.9% |
| 75% Local, 25% Tourists | 54.9% |
| 50% Local, 50% Tourists | 27.9% |
| 25% Local, 75% Tourists | 6.3% |
| Mostly Tourists (more than 90%) | 0.0% |
| Years Restaurant Has Been in Business | |
| 0 to 4 Years | 2.7% |
| 5 to 9 Years | 39.1% |
| 10 to 14 Years | 47.1% |
| 15 to 19 Years | 8.7% |
| 20 to 24 Years | 1.2% |
| 25 Years or More | 1.2% |
| Location of Restaurant in the United States | |
| Northeastern U.S. | 23.3% |
| Northwestern U.S. | 24.5% |
| Southeastern U.S. | 26.9% |
| Southwestern U.S. | 25.2% |
| Purchase (Yes) | Purchase (No) | Difference (Y − N) | t-Test | |
|---|---|---|---|---|
| Type of Restaurant | ||||
| Fine Dining | 25.6% | 33.3% | −7.7% | |
| Premium Casual Dining | 23.2% | 15.2% | 8.1% | |
| Casual Dining | 19.8% | 9.1% | 10.7% | |
| Fast Casual Dining | 8.7% | 9.1% | −0.4% | NS |
| Family Style | 7.7% | 27.3% | −19.6% | |
| Fast Food | 15.0% | 6.1% | 9.0% | |
| Seating Capacity | ||||
| Under 25 Seats | 2.1% | 0.0% | 2.1% | |
| 25 to 49 Seats | 24.0% | 15.2% | 8.9% | |
| 50 to 74 Seats | 37.5% | 42.4% | −5.0% | |
| 75 to 99 Seats | 28.0% | 30.3% | −2.3% | NS |
| 100 to 124 Seats | 6.6% | 9.1% | −2.5% | |
| 125 to 149 Seats | 1.3% | 3.0% | −1.7% | |
| 150 or More Seats | 0.5% | 0.0% | 0.5% | |
| Average Entrée Cost | ||||
| USD 10 to USD 14 | 1.6% | 3.0% | −1.4% | |
| USD 15 to USD 19 | 12.7% | 18.2% | −5.5% | |
| USD 20 to USD 24 | 36.7% | 48.5% | −11.8% | ** |
| USD 25 to USD 29 | 25.3% | 15.2% | 10.2% | |
| USD 30 to USD 34 | 14.8% | 15.2% | −0.4% | |
| USD 35 or More | 9.0% | 0.0% | 9.0% | |
| Serves Alcohol | ||||
| Yes | 77.3% | 69.7% | 7.6% | NS |
| No | 22.7% | 30.3% | −7.6% | |
| Percent of Customers Local Versus Tourists | ||||
| Mostly Local (more than 90%) | 11.3% | 6.1% | 5.3% | |
| 75% Local, 25% Tourists | 54.4% | 60.6% | −6.3% | |
| 50% Local, 50% Tourists | 28.2% | 24.2% | 4.0% | NS |
| 25% Local, 75% Tourists | 6.1% | 9.1% | −3.0% | |
| Mostly Tourists (more than 90%) | 0.0% | 0.0% | 0.0% | |
| Years Restaurant Has Been in Business | ||||
| 0 to 4 Years | 2.6% | 3.0% | −0.4% | |
| 5 to 9 Years | 38.0% | 51.5% | −13.5% | |
| 10 to 14 Years | 47.5% | 42.4% | 5.1% | ** |
| 15 to 19 Years | 9.2% | 3.0% | 6.2% | |
| 20 to 24 Years | 1.3% | 0.0% | 1.3% | |
| 25 Years or More | 1.3% | 0.0% | 1.3% | |
| Location of Restaurant in the United States | ||||
| Northeastern U.S. | 22.2% | 36.4% | −14.2% | |
| Northwestern U.S. | 25.3% | 15.2% | 10.2% | |
| Southeastern U.S. | 26.6% | 30.3% | −3.7% | ** |
| Southwestern U.S. | 25.9% | 18.2% | 7.7% | |
| Frequency | Percent | |
|---|---|---|
| Local Proteins Purchased | ||
| Local Meats Only | 23 | 6.1% |
| Local Seafood Only | 16 | 4.2% |
| Both Local Meats and Seafood | 340 | 89.7% |
| Does Restaurant Buy Other Local Products? | ||
| Yes | 273 | 72.0% |
| No | 106 | 28.0% |
| What Other Local Products Purchased? (n = 273) | ||
| Local produce | 199 | 52.5% |
| Non-alcoholic beverages | 167 | 44.1% |
| Alcoholic beverages | 159 | 42.0% |
| Other | 1 | 0.3% |
| Purchasers | Non-Purchasers | Difference | |
|---|---|---|---|
| Barriers to those purchasing (n = 379) and not purchasing (n = 33) | |||
| Quality of the product is inconsistent | 43.8% | 78.8% | −35.0% |
| Price point is too high | 42.0% | 69.7% | −27.7% |
| Limited availability/difficulty sourcing | 40.1% | 48.5% | −8.4% |
| Quality of the product does not meet my specifications | 33.5% | 33.3% | 0.2% |
| Seafood needs to be processed | 27.2% | 15.2% | 12.0% |
| Meats need to be processed | 23.2% | 9.1% | 14.1% |
| I do not know where to source | 7.9% | 6.1% | 1.9% |
| Customers do not value local meats and seafood | 5.8% | 3.0% | 2.8% |
| Other | 0.0% | 0.0% | 0.0% |
| Purchasers | Non-Purchasers | Difference | |
|---|---|---|---|
| Would You Buy/Buy More Local Proteins if More Convenient? | |||
| Yes | 80.8% | 70.6% | 10.2% |
| No | 19.2% | 29.4% | −10.2% |
| What Would Make Purchasing Local Proteins More Convenient? | |||
| An aggregator of local protein (i.e., protein hub) | 51.7% | 35.3% | 16.5% |
| A distributor of local protein | 61.5% | 23.5% | 38.0% |
| A wholesale market or buying point | 51.7% | 58.8% | −7.1% |
| Direct delivery from producers | 32.2% | 17.6% | 14.5% |
| Other | 0.7% | 0.0% | 0.7% |
| Coefficients: | Value | Std. Error | Marginal Effects |
|---|---|---|---|
| Type | 0.001 | 0.008 | 0.000 |
| Seats | −0.031 * | 0.014 | −0.034 |
| EntréeCost | 0.029 * | 0.012 | 0.035 |
| Alcohol | 0.016 | 0.032 | 0.014 |
| LocalRes | 0.022 | 0.019 | −0.023 |
| Years | 0.048 ** | 0.017 | 0.054 |
| South | 0.019 | 0.027 | 0.024 |
| East | −0.063 * | 0.027 | −0.068 |
| (Intercept) | 0.839 *** | 10.818 | |
| N | 412 | ||
| AIC | 94.23 |
| Protein | Willingness to Pay for Local Proteins | Purchasing Frequency of Local Proteins | Purchasing More Local Proteins |
|---|---|---|---|
| Beef | Type (−) *** | Type (+) * | |
| Seats (−) * | Seats (−) *** | ||
| Entrée Cost (+) * | Entrée Cost (+) ** | ||
| Alcohol (+) * | Alcohol (+) *** | ||
| South (−) ** | Local Residents (−) * | Years (+) * | |
| South (−) *** | |||
| Pork | Type (−) *** | Alcohol (+) ** | Seats (−) ** |
| Seats (−) * | Local Residents (−) ** | Alcohol (+) ** | |
| Other Local Foods (+) * | Local Residents (−) ** | ||
| South (−) *** | |||
| Chicken | Type (−) ** | Type (+) * | |
| Seats (−) *** | Seats (−) *** | ||
| Entrée Cost (+) ** | Alcohol (+) *** | ||
| Alcohol (+) * | Local Residents (−) ** | ||
| South (−) *** | South (−) *** | South (−) ** | |
| East (+) ** | East (+) ** | ||
| Oysters | Type (−) ** | ||
| Entrée Cost (+) ** | |||
| Other Local Foods (+) * | Other Local Foods (+) ** | Alcohol (+) * | |
| Years (−) ** | |||
| South (−) * | South (−) ** | ||
| Shrimp | South (−) * | Alcohol (+) *** | Alcohol (+) *** |
| Years (+) * Local Residents (−) *** | South (−) * | ||
| Crab | Type (−) ** | ||
| Other Local Foods (+) ** | |||
| Local Residents (−) * | Entrée Cost (+) ** | Alcohol (+) ** | |
| Fish | Type (−) ** | Entrée Cost (+) ** | Seats (−) ** |
| Seats (−) *** | Entrée Cost (+) ** | ||
| Local Residents (−) *** | |||
| South (−) *** | South (−) *** | Alcohol (+) *** |
Disclaimer/Publisher’s Note: The statements, opinions and data contained in all publications are solely those of the individual author(s) and contributor(s) and not of MDPI and/or the editor(s). MDPI and/or the editor(s) disclaim responsibility for any injury to people or property resulting from any ideas, methods, instructions or products referred to in the content. |
© 2024 by the authors. Licensee MDPI, Basel, Switzerland. This article is an open access article distributed under the terms and conditions of the Creative Commons Attribution (CC BY) license (https://creativecommons.org/licenses/by/4.0/).
Share and Cite
Richards, S.; Vassalos, M. Opportunities and Challenges for Locally Sourced Meat and Seafood: An Online Survey of U.S. Restaurant Procurers. Tour. Hosp. 2025, 6, 1. https://doi.org/10.3390/tourhosp6010001
Richards S, Vassalos M. Opportunities and Challenges for Locally Sourced Meat and Seafood: An Online Survey of U.S. Restaurant Procurers. Tourism and Hospitality. 2025; 6(1):1. https://doi.org/10.3390/tourhosp6010001
Chicago/Turabian StyleRichards, Steven, and Michael Vassalos. 2025. "Opportunities and Challenges for Locally Sourced Meat and Seafood: An Online Survey of U.S. Restaurant Procurers" Tourism and Hospitality 6, no. 1: 1. https://doi.org/10.3390/tourhosp6010001
APA StyleRichards, S., & Vassalos, M. (2025). Opportunities and Challenges for Locally Sourced Meat and Seafood: An Online Survey of U.S. Restaurant Procurers. Tourism and Hospitality, 6(1), 1. https://doi.org/10.3390/tourhosp6010001