
A Decadal Change in Shorebird Populations in Response to Temperature, Wind, and Precipitation at Hilton Head Island, South Carolina, USA


Simple Summary
Abstract
1. Introduction
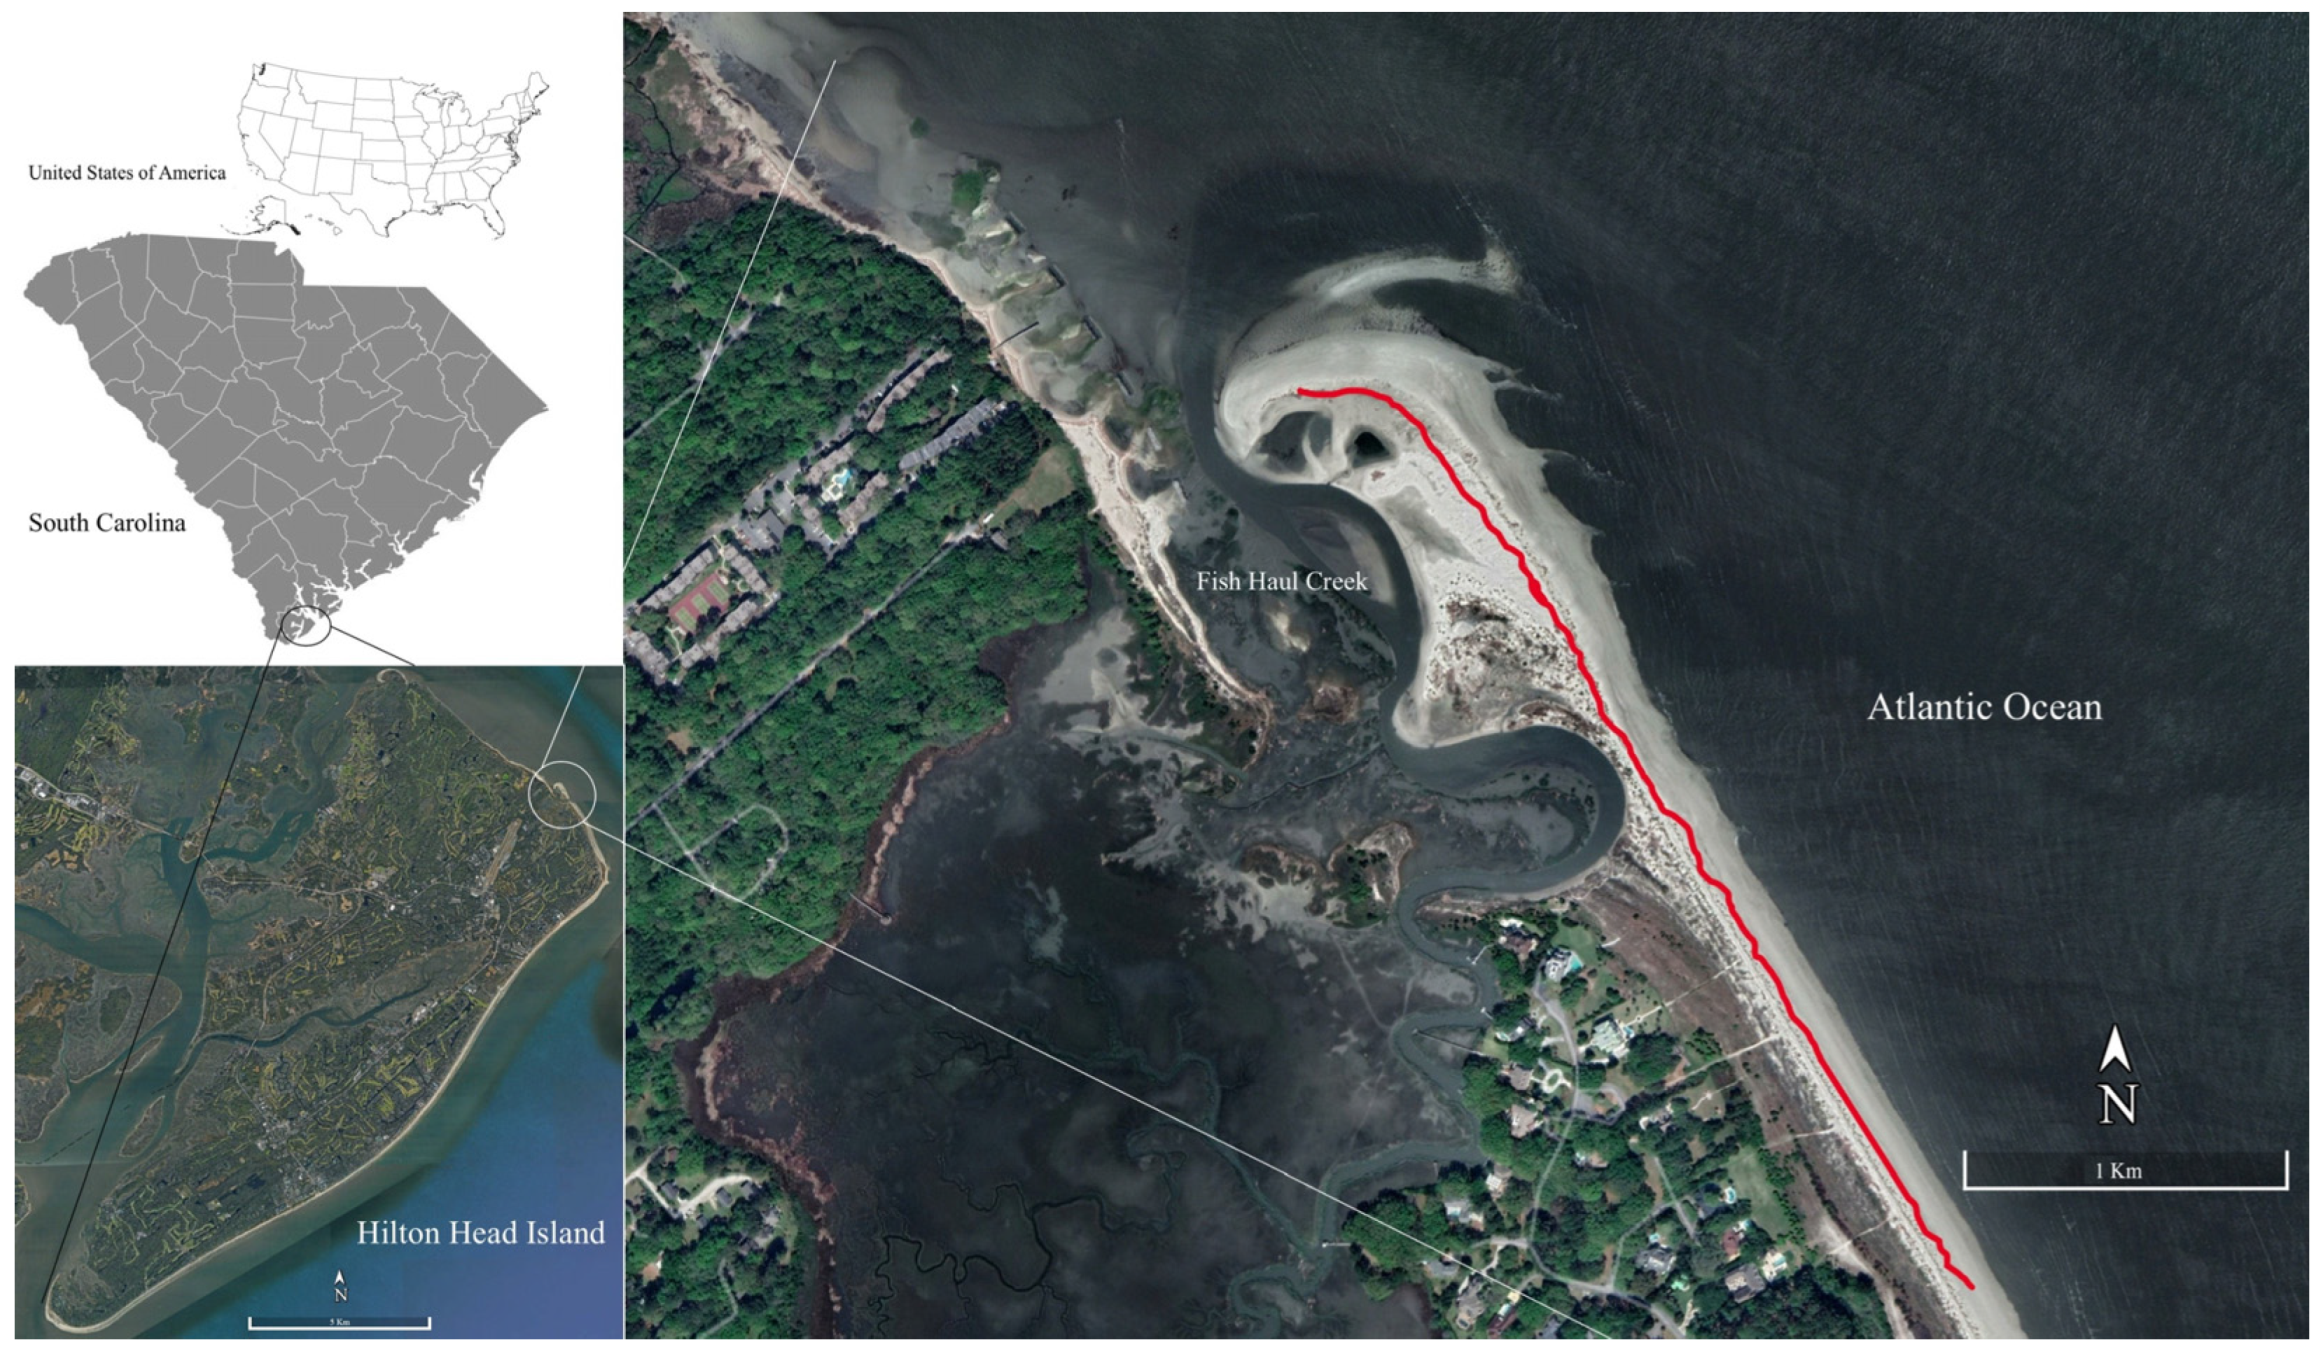
2. Study Area
3. Materials and Methods
3.1. Shorebird Counting Data
3.2. Meteorological Data
3.3. Statistical Analysis
3.3.1. Trend Analysis Using the Mann–Kendall Test and Sen’s Slope
3.3.2. Generalized Additive Models (GAMs) with Poisson Distribution and Log Link
- log is the log link function;
- E(Yi) is the expected count of shorebirds in year i;
- β0 is the intercept;
- fk (Xk) represents smooth functions of the predictor variables (X1 = annual mean average temperature, X2 = annual mean precipitation, X3 = annual mean average wind speed).
- L is the likelihood of the model;
- k is the number of estimated parameters in the model.
4. Results
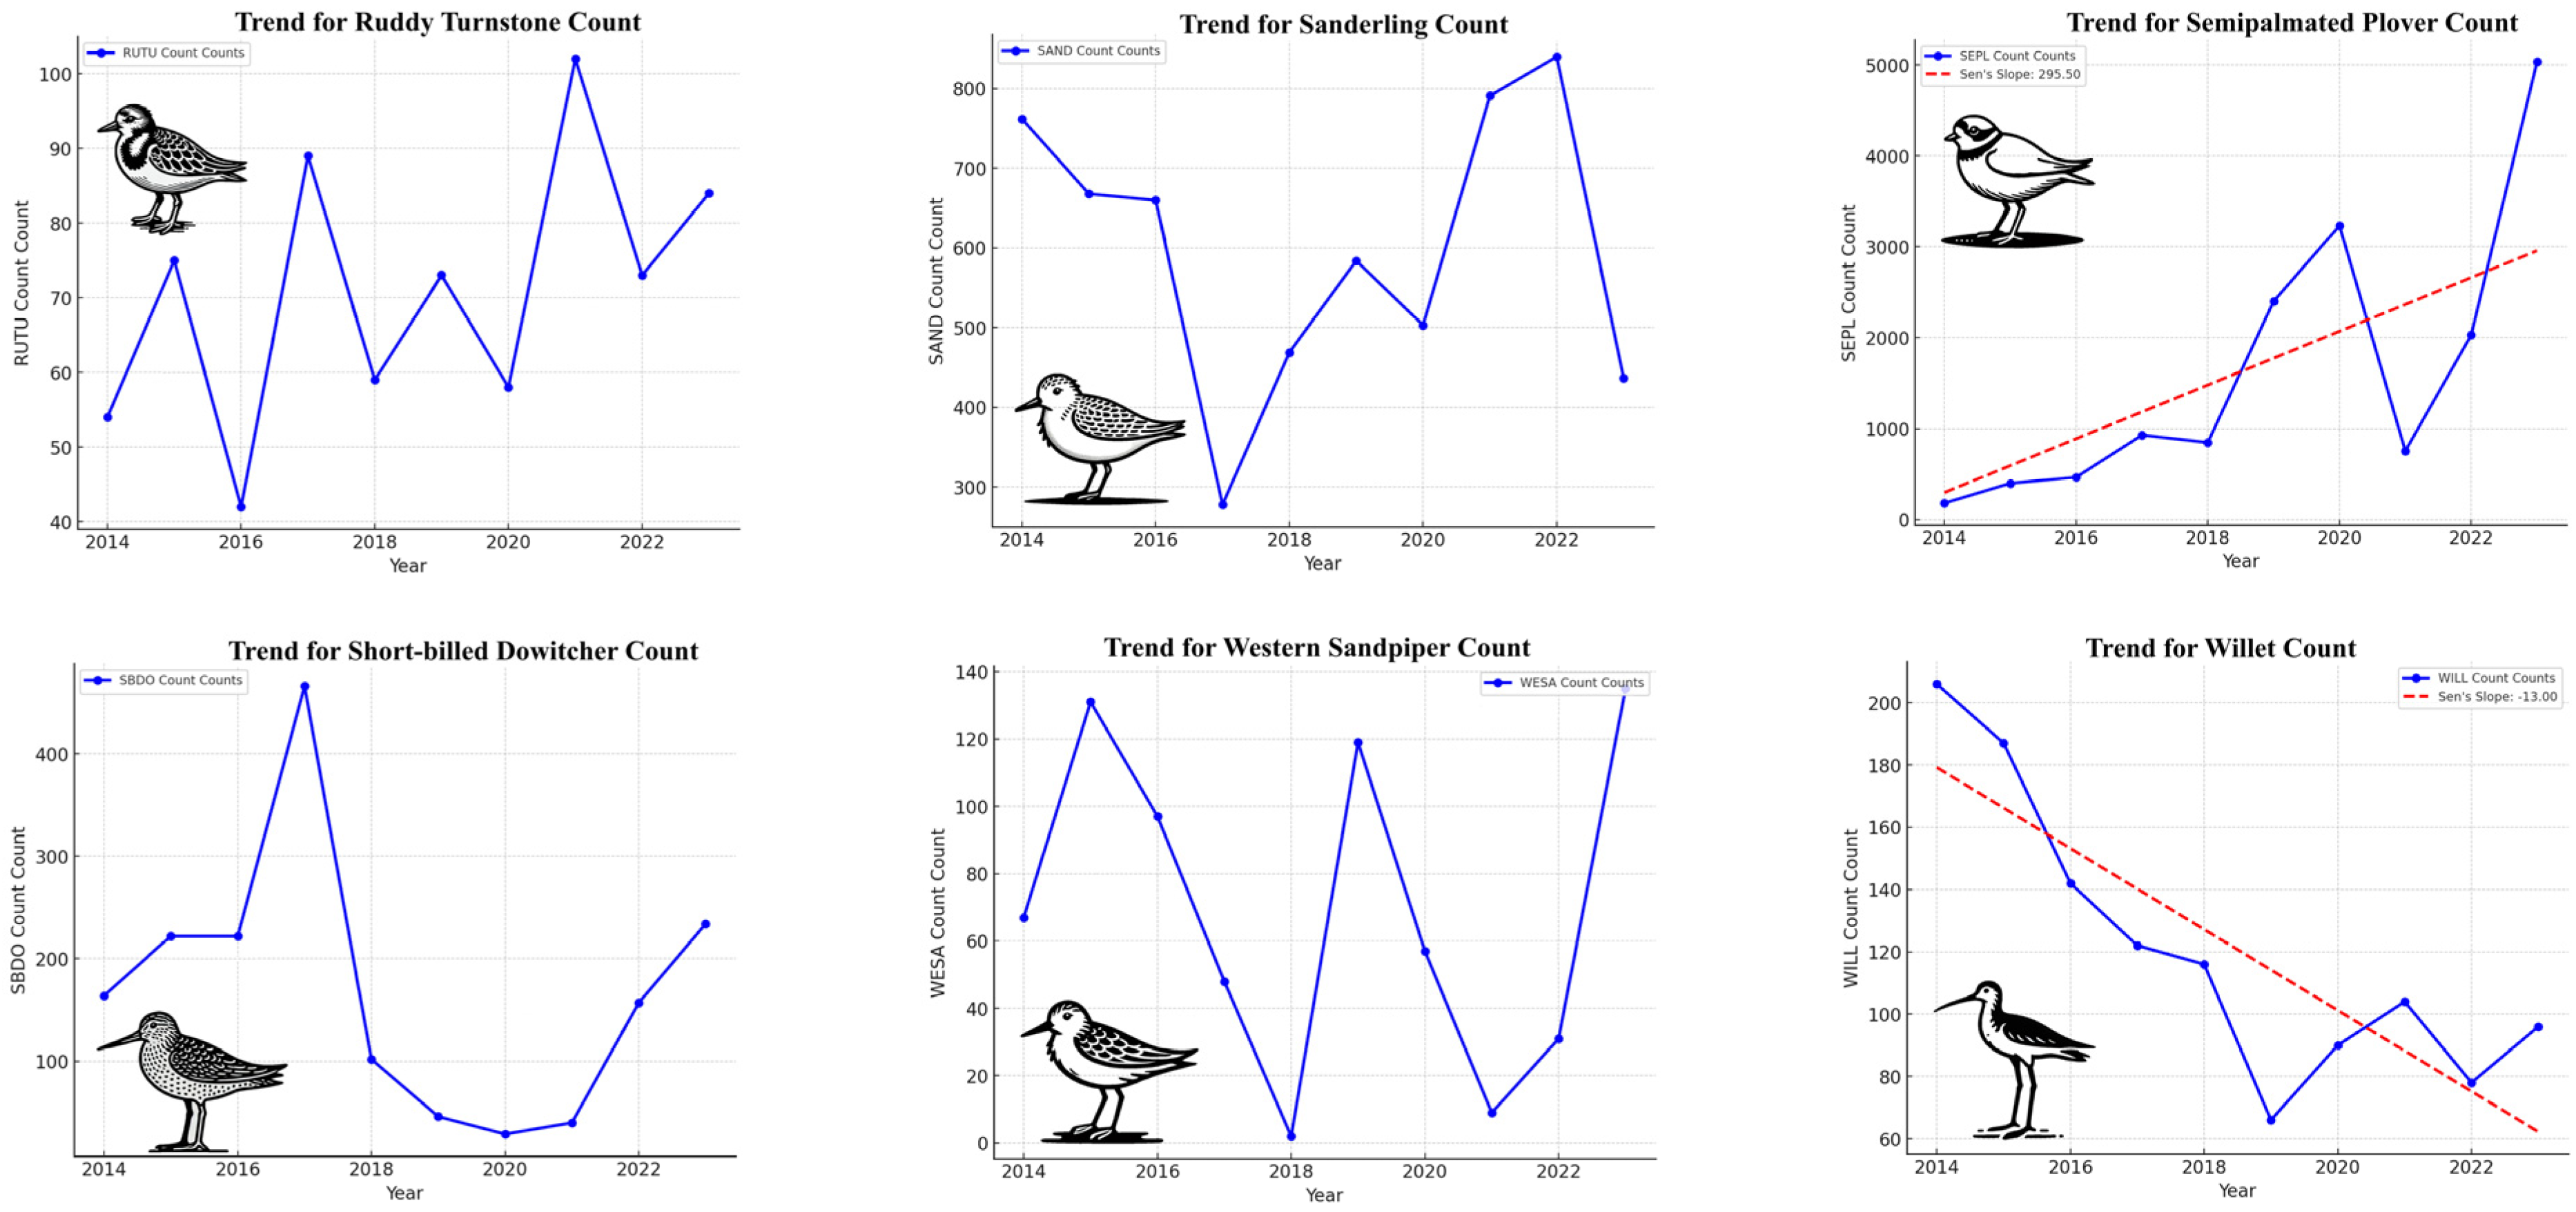
4.1. Mann–Kendall Test and Sen’s Slope for Trend
4.1.1. Significant Trends
4.1.2. Non-Significant Trends
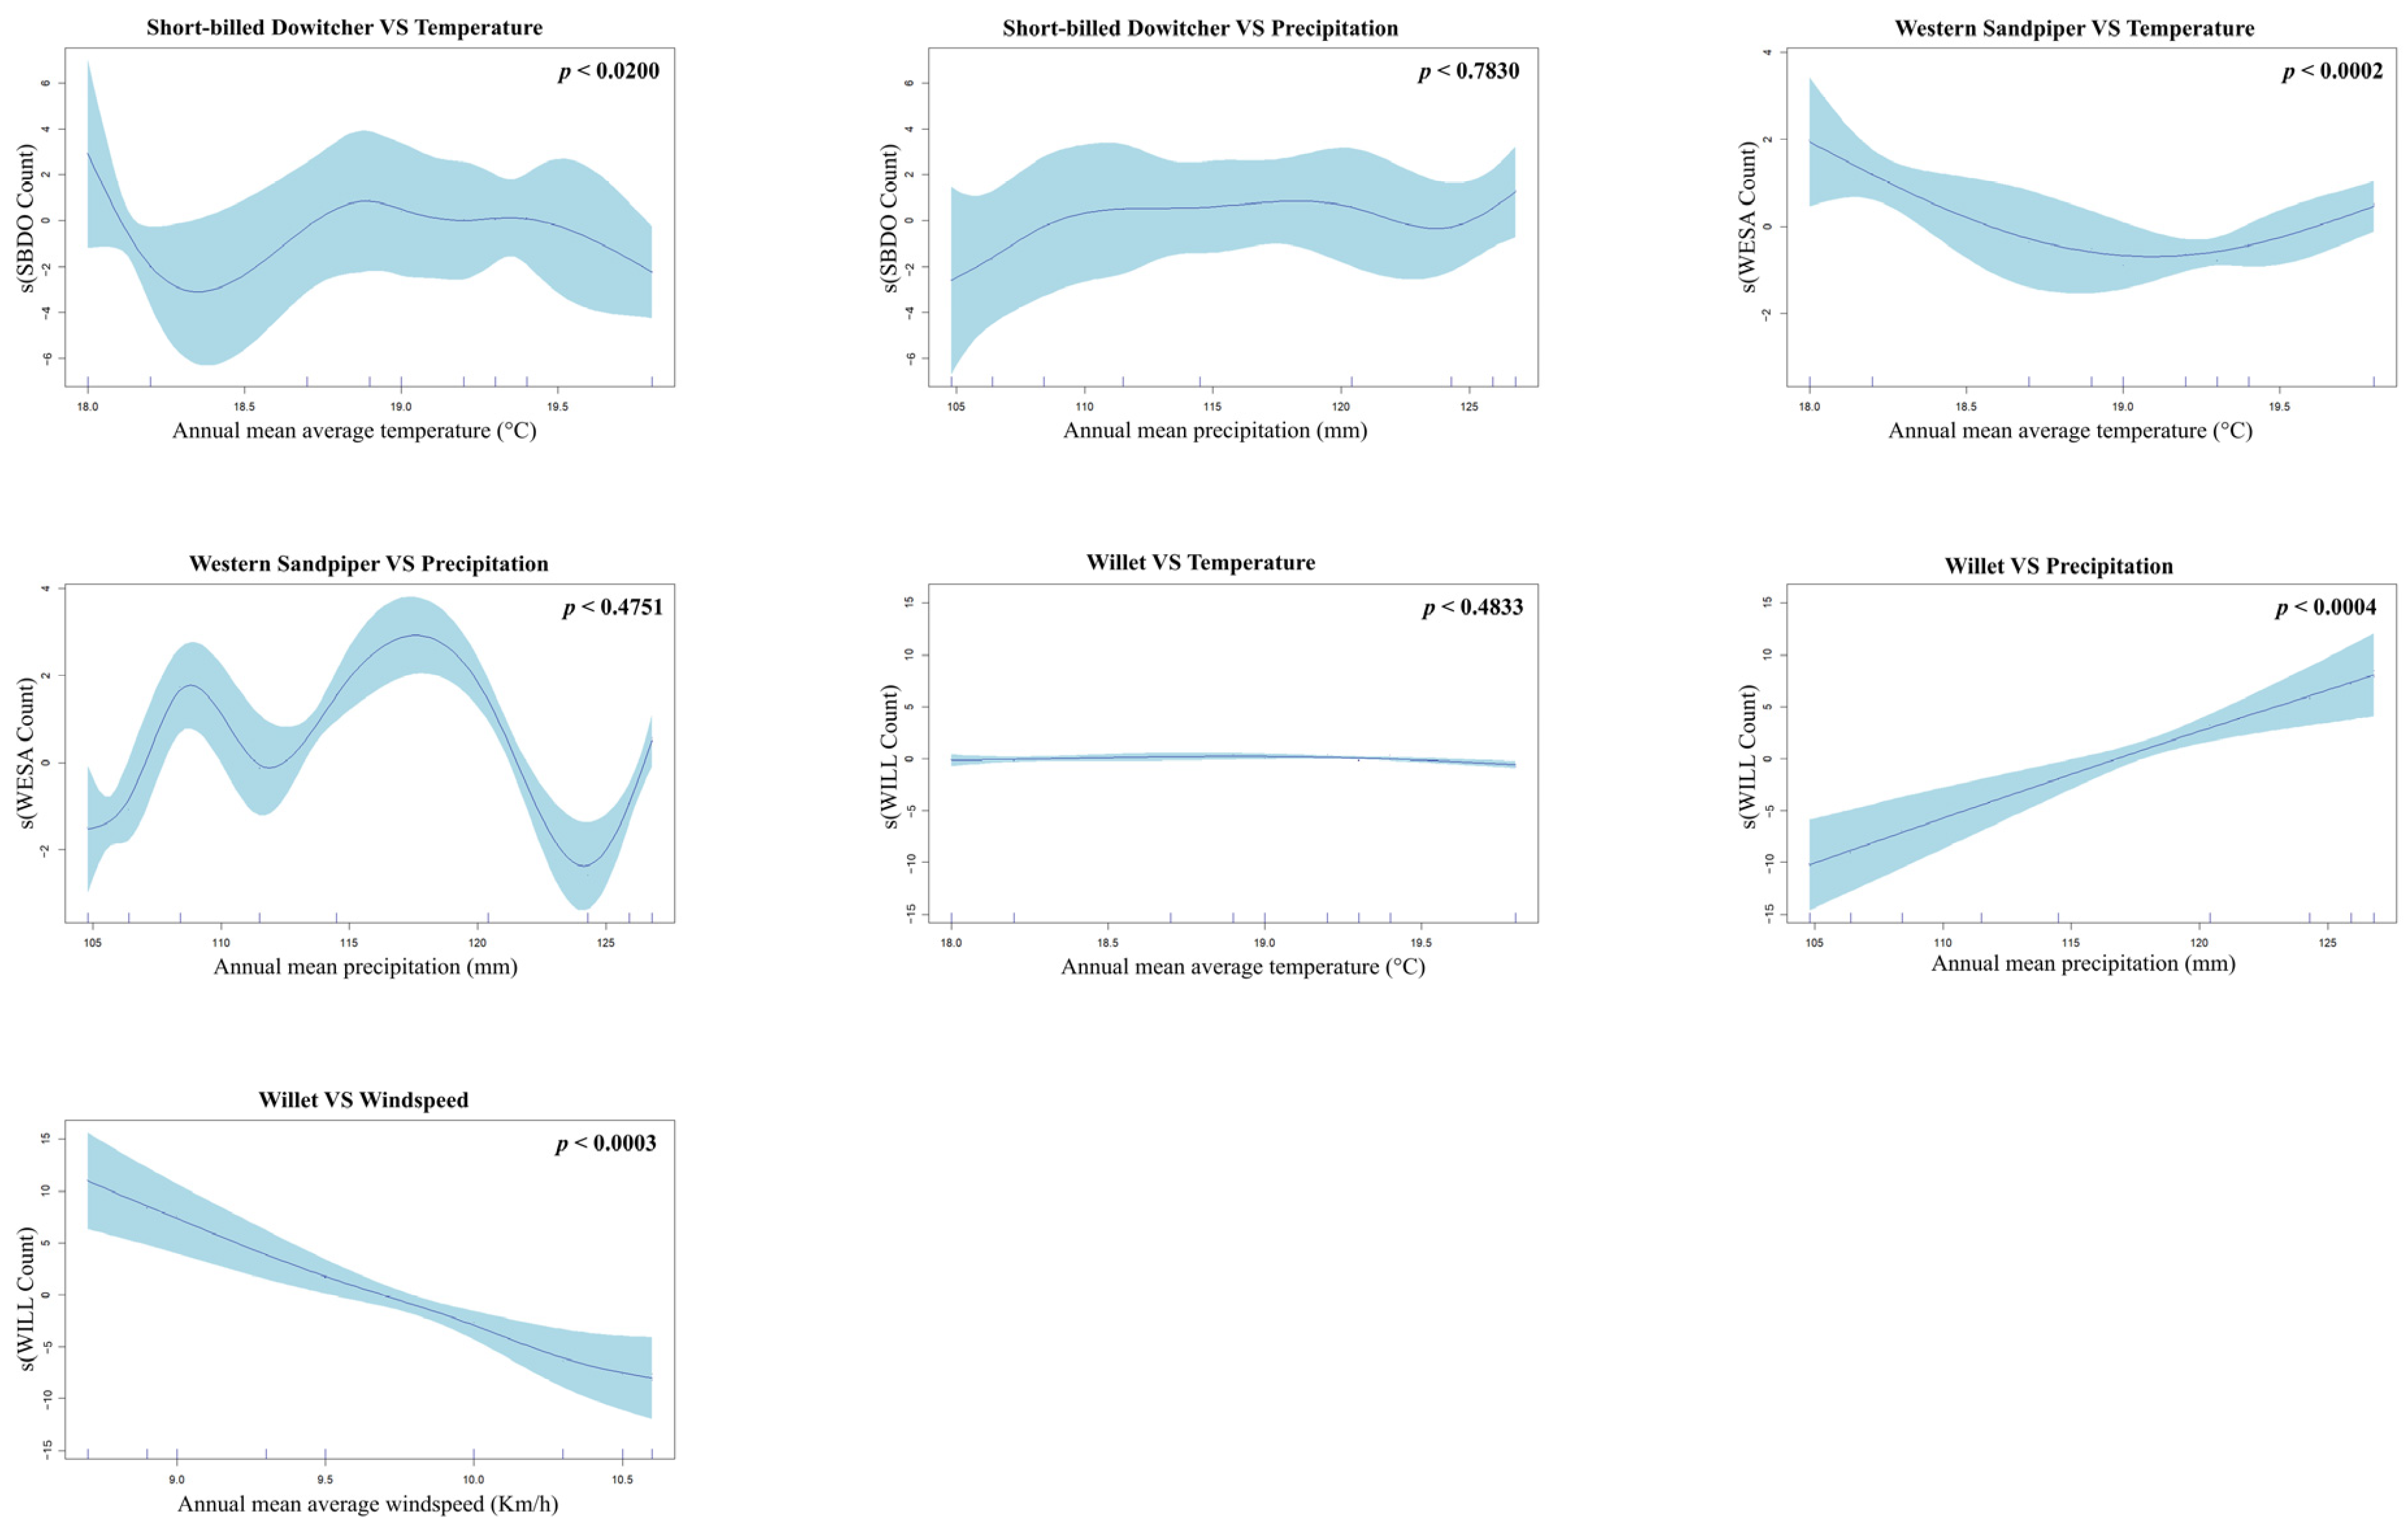
4.2. Poisson Generalized Additive Models (GAMs) with a Log Link Function
5. Discussion
5.1. Population Trends over Time
5.2. Meteorological Drivers of Population Changes
6. Conclusions
Author Contributions
Funding
Institutional Review Board Statement
Data Availability Statement
Acknowledgments
Conflicts of Interest
Appendix A. Shorebird Species Recorded at the Survey Location, Including Scientific Names and Codes
| Species | Scientific Name | Species Code |
| American Avocet | Recurvirostra americana | AMAV |
| American Oystercatcher | Haematopus palliatus | AMOY |
| Black-bellied Plover | Pluvialis squatarola | BBPL |
| Dunlin | Calidris alpina | DUNL |
| Greater Yellowlegs | Tringa melanoleuca | GRYE |
| Killdeer | Charadrius vociferus | KILL |
| Least Sandpiper | Calidris minutilla | LESA |
| Lesser Yellowlegs | Tringa flavipes | LEYE |
| Marbled Godwit | Limosa fedoa | MAGO |
| Piping Plover | Charadrius melodus | PIPL |
| Red Knot | Calidris canutus | REKN |
| Ruddy Turnstone | Arenaria interpres | RUTU |
| Sanderling | Calidris alba | SAND |
| Semipalmated Plover | Charadrius semipalmatus | SEPL |
| Short-billed Dowitcher | Limnodromus griseus | SBDO |
| Spotted Sandpiper | Actitis macularius | SPSA |
| Western Sandpiper | Calidris mauri | WESA |
| Whimbrel | Numenius phaeopus | WHIM |
| Willet | Tringa semipalmata | WILL |
| Wilson’s Plover | Charadrius wilsonia | WIPL |
References
- Chen, I.C.; Hill, J.K.; Ohlemüller, R.; Roy, D.B.; Thomas, C.D. Rapid range shifts of species associated with high levels of climate warming. Science 2011, 333, 1024–1026. [Google Scholar] [CrossRef]
- Petrauski, L.; S Owen, G. Constantz, and J. T. Anderson. Changes in avian spring arrival dates of 115 species in the central Appalachians over 127 years. Am. J. Clim. Change 2023, 12, 527–547. [Google Scholar] [CrossRef]
- Urban, M.C. Accelerating extinction risk from climate change. Science 2015, 348, 571–573. [Google Scholar] [CrossRef]
- Newton, I. The Migration Ecology of Birds; Elsevier: Amsterdam, The Netherlands, 2023. [Google Scholar]
- Sillett, T.S.; Holmes, R.T.; Sherry, T.W. Impacts of a global climate cycle on population dynamics of a migratory songbird. Science 2000, 288, 2040–2042. [Google Scholar] [CrossRef]
- Vickery, J.A.; Ewing, S.R.; Smith, K.W.; Pain, D.J.; Bairlein, F.; Škorpilová, J.; Gregory, R.D. The decline of A fro-P alaearctic migrants and an assessment of potential causes. Ibis 2014, 156, 1–22. [Google Scholar] [CrossRef]
- Gratto-Trevor, C.; Smith, P.A.; Morrison, R.G.; Aubry, Y.; Cotter, R. Population trends in Semipalmated Sandpipers from migration counts. Waterbirds 2012, 35, 96–105. [Google Scholar] [CrossRef]
- Koleček, J.; Reif, J.; Šálek, M.; Hanzelka, J.; Sottas, C.; Kubelka, V. Global population trends in shorebirds: Migratory behaviour makes species at risk. Sci. Nat. 2021, 108, 9. [Google Scholar] [CrossRef]
- Smith, P.A.; Smith, A.C.; Andres, B.; Francis, C.M.; Harrington, B.; Friis, C.; Morrison, R.G.; Paquet, J.; Winn, B.; Brown, S. Accelerating declines of North America’s shorebirds signal the need for urgent conservation action. Ornithol. Appl. 2023, 125, duad003. [Google Scholar] [CrossRef]
- Studds, C.; Kendall, B.; Murray, N.; Wilson, H.; Rogers, D.; Clemens, R.; Gosbell, K.; Hassell, C.J.; Jessop, R.; Melville, D.S.; et al. Rapid population decline in migratory shorebirds relying on yellow sea tidal mudflats as stopover sites. Nat. Commun. 2017, 8, 14895. [Google Scholar] [CrossRef]
- Muñoz-Salas, E.I.; Palacios, E.; Alfaro, L.; Reiter, M.E. Winter population trends and environmental drivers for three species of temperate shorebirds. Glob. Ecol. Conserv. 2023, 46, e02557. [Google Scholar] [CrossRef]
- Anderson, J.T.; Tacha, T.C.; Muehl, G.T.; Lobpries, D. Wetland use by waterbirds that winter in coastal Texas. Natl. Biol. Serv. Inf. Technol. Rep. 1996, 8, 40. Available online: https://apps.dtic.mil/sti/pdfs/ADA347391.pdf (accessed on 15 July 2024).
- Myers, J.P.; Morrison, R.G.; Antas, P.Z.; Harrington, B.A.; Lovejoy, T.E.; Sallaberry, M.; Senner, S.E.; Tarak, A. Conservation strategy for migratory species. Am. Sci. 1987, 75, 19–26. [Google Scholar]
- Galbraith, H.; DesRochers, D.W.; Brown, S.; Reed, J.M. Predicting vulnerabilities of North American shorebirds to climate change. PLoS ONE 2014, 9, e108899. [Google Scholar] [CrossRef]
- Meltofte, H. (Ed.) Effects of Climate Variation on the Breeding Ecology of Arctic Shorebirds; Museum Tusculanum Press: Copenhagen, Denmark, 2007; Volume 59. [Google Scholar]
- International Wader Study Group Bulletin. 101/102. 2023. Available online: https://sora.unm.edu/sites/default/files/journals/iwsgb/v101-102/p0008-p0012.pdf (accessed on 15 August 2024).
- Piersma, T. Using the power of comparison to explain habitat use and migration strategies of shorebirds worldwide. J. Ornithol. 2007, 148 (Suppl. 1), 45–59. [Google Scholar] [CrossRef]
- Stroud, D.A.; Baker, A.; Blanco, D.E.; Davidson, N.C.; Delany, S.; Ganter, B.; Zöckler, C. The conservation and population status of the world’s waders at the turn of the millennium. In Waterbirds Around the World: A Global Overview of the Conservation, Management and Research of the World’s Waterbird Flyways; Boere, G.C., Galbraith, C.A., Stroud, D.A., Eds.; The Stationery Office: London, UK, 2006; pp. 643–648. [Google Scholar]
- Pearce-Higgins, J.W.; Brown, D.J.; Douglas, D.J.; Alves, J.A.; Bellio, M.; Bocher, P.; Verkuil, Y.I. A global threats overview for Numeniini populations: Synthesising expert knowledge for a group of declining migratory birds. Bird Conserv. Int. 2017, 27, 6–34. [Google Scholar] [CrossRef]
- Senner, N.R.; Stager, M.; Sandercock, B.K. Ecological mismatches are moderated by local conditions for two populations of a long-distance migratory bird. Oikos 2017, 126, 61–72. [Google Scholar] [CrossRef]
- Pelton, M.M.; Padula, S.R.; Garcia-Walther, J.; Andrews, M.; Mercer, R.; Porter, R.; Linscott, J.A. Kiawah and Seabrook islands are a critical site for the Rufa Red Knot (Calidris canutus rufa). bioRxiv 2022. [Google Scholar] [CrossRef]
- Carlson-Bremer, D.; Norton, T.M.; Gilardi, K.V.; Dierenfeld, E.S.; Winn, B.; Sanders, F.J.; Johnson, C.K. Health assessment of American oystercatchers (Haematopus palliatus palliatus) in Georgia and South Carolina. J. Wildl. Dis. 2010, 46, 772–780. [Google Scholar] [CrossRef]
- Gauthier, S.; May, B.; Vasseur, L. Ecosystem-based adaptation to protect avian species in coastal communities in the greater Niagara region, Canada. Climate 2021, 9, 91. [Google Scholar] [CrossRef]
- Elmore, J.A.; Londe, D.W.; Davis, C.A.; Fuhlendorf, S.D.; Loss, S.R. Associations with landscape and local-scale wetland habitat conditions vary among migratory shorebird species during stopovers. Wildl. Biol. 2023, 2024, e01132. [Google Scholar] [CrossRef]
- Golet, G.H.; Low, C.; Avery, S.; Andrews, K.; McColl, C.J.; Laney, R.; Reynolds, M.D. Using ricelands to provide temporary shorebird habitat during migration. Ecol. Appl. 2018, 28, 409–426. [Google Scholar] [CrossRef]
- Steen, V.; Skagen, S.K.; Noon, B.R. Preparing for an uncertain future: Migrating shorebird response to past climatic fluctuations in the Prairie Potholes. Ecosphere 2018, 9, e02095. [Google Scholar] [CrossRef]
- Kwon, E.; Weiser, E.L.; Lanctot, R.B.; Brown, S.C.; Gates, H.R.; Gilchrist, G.; Kendall, S.J.; Lank, D.B.; Liebezeit, J.R.; McKinnon, L.; et al. Geographic variation in the intensity of warming and phenological mismatch between Arctic shorebirds and invertebrates. Ecol. Monogr. 2019, 89, e01383. [Google Scholar] [CrossRef]
- Webb, E.B.; Smith, L.M.; Vrtiska, M.P.; Lagrange, T.G. Effects of local and landscape variables on wetland bird habitat use during migration through the Rainwater Basin. J. Wildl. Manag. 2010, 74, 109–119. [Google Scholar] [CrossRef]
- Barbaree, B.A.; Reiter, M.E.; Hickey, C.M.; Strum, K.M.; Isola, J.E.; Jennings, S.; Tarjan, L.M.; Strong, C.M.; Stenzel, L.E.; Shuford, W.D. Effects of drought on the abundance and distribution of non-breeding shorebirds in central California, USA. PLoS ONE 2020, 15, e0240931. [Google Scholar] [CrossRef]
- Bjørnstad, O.N.; Grenfell, B.T. Noisy clockwork: Time series analysis of population fluctuations in animals. Science 2001, 293, 638–643. [Google Scholar] [CrossRef]
- Grenfell, B.T.; Wilson, K.; Finkenstädt, B.F.; Coulson, T.N.; Murray, S.; Albon, S.D.; Crawley, M.J. Noise and determinism in synchronized sheep dynamics. Nature 1998, 394, 674–677. [Google Scholar] [CrossRef]
- Yalden, D.W.; Pearce-Higgins, J.W. Density-dependence and winter weather as factors affecting the size of a population of Golden Plovers Pluvialis apricaria. Bird Study 1997, 44, 227–234. [Google Scholar] [CrossRef]
- Correia, E.; Granadeiro, J.P.; Santos, B.; Regalla, A.; Mata, V.A.; Catry, T. Trophic ecology of a migratory shorebird community at a globally important non-breeding site: Combining DNA metabarcoding and conventional techniques. Mar. Ecol. Prog. Ser. 2023, 705, 127–144. [Google Scholar] [CrossRef]
- Burger, J.; Niles, L. Effects on five species of shorebirds of experimental closure of a beach in New Jersey: Implications for severe storms and sea-level rise. J. Toxicol. Health Part A 2014, 77, 1102–1113. [Google Scholar] [CrossRef]
- Gallagher, C.P.; Lea, E.V. Overwintering habitat of American Dipper, Cinclus mexicanus, observed in an Arctic groundwater spring feeding on Dolly Varden, Salvelinus malma. Arctic 2019, 72, 82–87. [Google Scholar] [CrossRef]
- Souza-Cole, I.; Arthur, S.; Jensen, L.; Sesser, K.A.; Strum, K.M. Slow and steady: Gradual drawdown of private wetlands supports shorebirds during northbound migration. J. Fish Wildl. Manag. 2020, 11, 562–571. [Google Scholar] [CrossRef]
- Hands, H.M.; Ryan, M.R.; Smith, J.W. Migrant shorebird use of marsh, moist-soil, and flooded agricultural habitats. Wildl. Soc. Bull. 1973–2006 1991, 19, 457–464. [Google Scholar]
- Boyce, A.J.; Shamon, H.; Kunkel, K.E.; McShea, W.J. Grassland bird diversity and abundance in the presence of native and non-native grazers. Avian Conserv. Ecol. 2021, 16, 13. [Google Scholar] [CrossRef]
- Newton, D.; Day, A.; Gillies, C.; Fernández, E. A review of evidence-based evaluation of measures for assessing social and emotional well-being in Indigenous Australians. Aust. Psychol. 2015, 50, 40–50. [Google Scholar] [CrossRef]
- Chesser, R.T.; Burns, K.J.; Cicero, C.; Dunn, J.L.; Kratter, A.W.; Lovette, I.J.; Asmussen, P.C.; Remsen, J.V.; Stotz, D.F.R.; Winker, K. Sixtieth supplement to the American Ornithological Society’s checklist of North American Birds. The Auk 2019, 136, ukz042. [Google Scholar] [CrossRef]
- Ward, J.; Bryant, J.; Wand, H.; Kaldor, J.; Delaney-Thiele, D.; Worth, H.; Betts, S.; Waples-Crowe, P.; Cairnduff, S.; Coburn, T.; et al. Methods of a national survey of young aboriginal and torres strait islander people regarding sexually transmissible infections and bloodborne viruses. Aust. N. Z. J. Public Health 2016, 40, S96–S101. [Google Scholar] [CrossRef]
- National Oceanic and Atmospheric Administration. Available online: https://www.weather.gov/ (accessed on 15 July 2024).
- Kendall, M.G. Rank Correlation Methods; Griffin: London, UK, 1975. [Google Scholar]
- Mann, H.B. Nonparametric tests against trend. Econom. J. Econom. Soc. 1945, 13, 245–259. [Google Scholar] [CrossRef]
- Hamed, K.H. Trend detection in hydrologic data: The Mann–Kendall trend test under the scaling hypothesis. J. Hydrol. 2008, 349, 350–363. [Google Scholar] [CrossRef]
- Yue, S.; Pilon, P.; Cavadias, G. Power of the Mann–Kendall and Spearman’s rho tests for detecting monotonic trends in hydrological series. J. Hydrol. 2002, 259, 254–271. [Google Scholar] [CrossRef]
- Hirsch, R.M.; Slack, J.R. A nonparametric trend test for seasonal data with serial dependence. Water Resour. Res. 1984, 20, 727–732. [Google Scholar] [CrossRef]
- R Core Team. R: A Language and Environment for Statistical Computing. Vienna: R Foundation for Statistical Computing. Version 4.3.3. 2024. Available online: https://www.R-project.org/ (accessed on 22 August 2023).
- Sen, P.K. Estimates of the regression coefficient based on Kendall’s tau. J. Am. Stat. Assoc. 1968, 63, 1379–1389. [Google Scholar] [CrossRef]
- Wood, S.N. Generalized Additive Models: An Introduction with R; Chapman and Hall/CRC: Boca Raton, FL, USA, 2017. [Google Scholar]
- Bowman, T.D.; Silverman, E.D.; Gilliland, S.G.; Leirness, J.B. Status and trends of North American sea ducks. In Ecology and conservation of North American Sea Ducks. Studies in Avian Biology; CRC Press: New York, NY, USA, 2015; pp. 1–28. [Google Scholar]
- Hernández-Navarro, A.J.; Robledano, F.; Jiménez-Franco, M.V.; Royle, J.A.; Calvo, J.F. Long-term trends of local bird populations based on monitoring schemes: Are they suitable for justifying management measures? J. Ornithol. 2024, 165, 355–367. [Google Scholar] [CrossRef]
- Wang, X.; Kuang, F.; Tan, K.; Ma, Z. Population trends, threats, and conservation recommendations for waterbirds in China. Avian Res. 2018, 9, 1–13. [Google Scholar] [CrossRef]
- Gibson, D.; Chaplin, M.K.; Hunt, K.L.; Friedrich, M.J.; Weithman, C.E.; Addison, L.M.; Catlin, D.H. Impacts of anthropogenic disturbance on body condition, survival, and site fidelity of nonbreeding Piping Plovers. Condor Ornithol. Appl. 2018, 120, 566–580. [Google Scholar] [CrossRef]
- Maslo, B.; Leu, K.; Pover, T.; Weston, M.A.; Schlacher, T.A. Managing birds of conservation concern on sandy shores: How much room for future conservation actions is there? Ecol. Evol. 2018, 8, 10976–10988. [Google Scholar] [CrossRef]
- Walker, K.M.; Fraser, J.D.; Catlin, D.H.; Ritter, S.J.; Robinson, S.G.; Bellman, H.A.; Papa, S.T. Hurricane Sandy and engineered response created habitat for a threatened shorebird. Ecosphere 2019, 10, e02771. [Google Scholar] [CrossRef]
- Zeigler, E.J.S.S.L.; Gutierrez, B.T. Points, Transects, Beach Width: Barrier Island Geomorphology and Shorebird Habitat Metrics at 50-m Alongshore Transects and 5-m Cross-Shore Points: Rockaway Peninsula, NY, 2013–2014: U.S. Geological SURVEY Data Release. 2019. Available online: https://cmgds.marine.usgs.gov/catalog/whcmsc/SB_data_release/DR_P944FPA4/rock14_pts_trans_ubw_meta.html (accessed on 17 July 2024).
- US Fish and Wildlife Service. Endangered and Threatened Wildlife and Plants: Prohibitions and Permits. Fed. Regist. 1985, 50, 39681–39691. [Google Scholar]
- Wilson, H.; Kendall, B.; Fuller, R.; Milton, D.; Possingham, H. Analyzing variability and the rate of decline of migratory shorebirds in Moreton Bay, Australia. Conserv. Biol. 2011, 25, 758–766. [Google Scholar] [CrossRef]
- Lee, J.; Kim, I.; Lee, S.; Son, J.; Jang, J.; Sung, H. International importance of tidal flats in the Republic of Korea as shorebird stopover sites in the east Asian–Australasian flyway. Avian Conserv. Ecol. 2023, 18, 23. [Google Scholar] [CrossRef]
- Sanders, F.J.; Smith, A.D.; Thibault, J.M.; Carter, D.L.; Handmaker, M.C.; Smith, F.M. South Atlantic Bight–a final stop for Ruddy Turnstones migrating to the Arctic. J. Field Ornithol. 2023, 94, 5. [Google Scholar] [CrossRef]
- Li, X.; Hou, X.; Song, Y.; Shan, K.; Zhu, S.; Yu, X.; Mo, X. Assessing changes of habitat quality for shorebirds in stopover sites: A case study in Yellow River Delta, China. Wetlands 2019, 39, 67–77. [Google Scholar] [CrossRef]
- Baker, A.J.; Gonzalez, P.M.; Piersma, T.; Niles, L.J.; de Lima Serrano do Nascimento, I.; Atkinson, P.W.; Aarts, G. Rapid population decline in red knots: Fitness consequences of decreased refueling rates and late arrival in Delaware Bay. Proc. R. Soc. London. Ser. B Biol. Sci. 2004, 271, 875–882. [Google Scholar] [CrossRef]
- Mizrahi, D.S.; Peters, K.A. Relationships between sandpipers and horseshoe crab in Delaware Bay: A synthesis. In Biology and Conservation of Horseshoe Crabs; Tanacredi, J.T., Bottom, M.L., Smith, D.R., Eds.; Springer Science: New York, NY, USA, 2009; pp. 65–88. [Google Scholar]
- Martin, P.D.; Jenkins, J.L.; Adams, F.J.; Jorgenson, M.T.; Matz, A.C.; Payer, D.C.; Reynolds, P.E.; Tidwell, A.C.; Zelenak, J.R. Wildlife Response to Environmental Arctic Change (WildREACH): Predicting Future Habitats of Arctic Alaska; Fish and Wildlife Service: Fairbanks, AK, USA, 2009. [Google Scholar]
- Brlík, V.; Pakanen, V.M.; Jaakkonen, T.; Arppe, H.; Jokinen, J.; Lakka, J.; Blomqvist, D.; Hahn, S.; Valkama, J.; Koivula, K. Survival fluctuation is linked to precipitation variation during staging in a migratory shorebird. Sci. Rep. 2022, 12, 19830. [Google Scholar] [CrossRef] [PubMed]
- Gill Jr, R.E.; Douglas, D.C.; Handel, C.M.; Tibbitts, T.L.; Hufford, G.; Piersma, T. Hemispheric-scale wind selection facilitates bar-tailed godwit circum-migration of the Pacific. Anim. Behav. 2014, 90, 117–130. [Google Scholar] [CrossRef]
- Haest, B.; Hüppop, O.; Bairlein, F. Weather at the winter and stopover areas determines spring migration onset, progress, and advancements in Afro-Palearctic migrant birds. Proc. Natl. Acad. Sci. USA 2020, 117, 17056–17062. [Google Scholar] [CrossRef]
- Liechti, F. Birds: Blowin’by the wind? J. Ornithol. 2006, 147, 202–211. [Google Scholar] [CrossRef]
- Richardson, W. Timing of bird migration in relation to weather: Updated review. In Bird Migration: Physiology and Ecophysiology; Springer: Berlin/Heidelberg, Germany, 1990; pp. 78–101. [Google Scholar]
- Richardson, W.J. Timing and amount of bird migration in relation to weather: A review. Oikos 1978, 30, 224–272. [Google Scholar] [CrossRef]
- Gill Jr, R.E.; Tibbitts, T.L.; Douglas, D.C.; Handel, C.M.; Mulcahy, D.M.; Gottschalck, J.C.; Piersma, T. Extreme endurance flights by landbirds crossing the Pacific Ocean: Ecological corridor rather than barrier? Proc. R. Soc. B Biol. Sci. 2009, 276, 447–457. [Google Scholar] [CrossRef]
- Klaassen, R.H.; Alerstam, T.; Carlsson, P.; Fox, J.W.; Lindström, Å. Great flights by great snipes: Long and fast non-stop migration over benign habitats. Biol. Lett. 2011, 7, 833–835. [Google Scholar] [CrossRef]
- Piersma, T.; Jukema, J. Budgeting the flight of a long-distance migrant: Changes in nutrient reserve levels of bar-tailed godwits at successive spring staging sites. Ardea 1990, 55, 315–337. [Google Scholar] [CrossRef]
- Alerstam, T.; Gudmundsson, G.A. Migration patterns of tundra birds: Tracking radar observations along the Northeast Passage. Arctic 1999, 52, 346–371. [Google Scholar] [CrossRef]
- Green, M. Flying with the wind-spring migration of Arctic-breeding waders and geese over South Sweden. Ardea 2004, 92, 145–159. [Google Scholar]
- Gudmundsson, G.A. Spring migration of the knot Calidris c. canutus over southern Scandinavia, as recorded by radar. J. Avian Biol. 1994, 25, 15–26. [Google Scholar] [CrossRef]
- Hedenström, A.; Alerstam, T.; Bäckman, J.; Gudmundsson, G.A.; Henningsson, S.; Karlsson, H.; Rosén, M.; Strandberg, R. Radar observations of Arctic bird migration in the Beringia region. Arctic 2009, 62, 25–37. [Google Scholar] [CrossRef]
- Ma, Z.; Hua, N.; Zhang, X.; Guo, H.; Zhao BI, N.; Ma, Q.; Tang, C. Wind conditions affect stopover decisions and fuel stores of shorebirds migrating through the south Yellow Sea. Ibis 2011, 153, 755–767. [Google Scholar] [CrossRef]
- Richardson, W.J. Southeastward shorebird migration over Nova Scotia and New Brunswick in autumn: A radar study. Can. J. Zool. 1979, 57, 107–124. [Google Scholar] [CrossRef]


| Species | Scientific Name | Total Count |
|---|---|---|
| Black-bellied Plover | Pluvialis squatarola | 1709 |
| Dunlin | Calidris alpina | 18,376 |
| Least Sandpiper | Calidris minutilla | 975 |
| Marbled Godwit | Limosa fedoa | 2207 |
| Piping Plover | Charadrius melodus | 558 |
| Red Knot | Calidris canutus | 1578 |
| Ruddy Turnstone | Arenaria interpres | 709 |
| Sanderling | Calidris alba | 5992 |
| Semipalmated Plover | Charadrius semipalmatus | 16,279 |
| Short-billed Dowitcher | Limnodromus griseus | 1682 |
| Western Sandpiper | Calidris mauri | 696 |
| Willet | Tringa semipalmata | 1207 |
| Species | Mann–Kendall Z | Trend | Sen’s Slope |
|---|---|---|---|
| Black-bellied Plover | −1.97 | Decreasing | −23.00 |
| Dunlin | 1.07 | No trend | 154.66 |
| Least Sandpiper | −0.18 | No trend | −0.33 |
| Marbled Godwit | −1.97 | Decreasing | −23.33 |
| Piping Plover | 2.78 | Increasing | 9.00 |
| Red Knot | 0.36 | No trend | 6.12 |
| Ruddy Turnstone | 1.17 | No trend | 3.33 |
| Sanderling | −0.18 | No trend | −8.00 |
| Semipalmated Plover | 2.68 | Increasing | 295.50 |
| Short-billed Dowitcher | −0.63 | No trend | −10.83 |
| Western Sandpiper | −0.36 | No trend | −3.40 |
| Willet | −2.68 | Decreasing | −13.00 |
| Species | Model | AIC | Covariant | edf | Ref.df | Chi.sq | p-Value |
|---|---|---|---|---|---|---|---|
| Black-bellied Plover | Model 2: Temp + Precip | 88.01 | Temp | 5.23 | 5.24 | 11.05 | 0.0291 |
| Precip | 3.74 | 3.76 | 2.47 | 0.7102 | |||
| Dunlin | Model 3: All Predictors | 112.44 | Temp | 3.13 | 3.31 | 608.39 | <2 × 10⁻¹⁶ |
| Precip | 3.52 | 3.84 | 164.93 | <2 × 10⁻¹⁶ | |||
| Wind | 1.50 | 1.59 | 92.58 | <2 × 10⁻¹⁶ | |||
| Least Sandpiper | Model 2: Temp + Precip | 71.16 | Temp | 1.71 | 1.83 | 15.60 | 0.0016 |
| Precip | 4.12 | 4.24 | 7.09 | 0.1524 | |||
| Marbled Godwit | Model 3: All Predictors | 88.97 | Temp | 1.00 | 1.00 | 13.77 | 0.0002 |
| Precip | 6.01 | 6.10 | 290.67 | <2 × 10⁻¹⁶ | |||
| Wind | 1.00 | 1.00 | 6.93 | 0.0084 | |||
| Piping Plover | Model 2: Temp + Precip | 75.36 | Temp | 6.37 | 6.51 | 120.21 | <2 × 10⁻¹⁶ |
| Precip | 2.33 | 2.43 | 10.38 | 0.0242 | |||
| Red Knot | Model 2: Temp + Precip | 77.40 | Temp | 7.00 | 7.00 | 98.00 | <2 × 10⁻¹⁶ |
| Precip | 1.84 | 1.98 | 1.57 | 0.4750 | |||
| Ruddy Turnstone | Model 2: Temp + Precip | 77.08 | Temp | 2.06 | 2.34 | 3.47 | 0.2383 |
| Precip | 4.94 | 5.71 | 27.42 | 0.0008 | |||
| Sanderling | Model 2: Temp + Precip | 101.25 | Temp | 6.77 | 6.97 | 232.82 | <2 × 10⁻¹⁶ |
| Precip | 1.00 | 1.00 | 33.98 | <2 × 10⁻¹⁶ | |||
| Short-billed Dowitcher | Model 2: Temp + Precip | 86.44 | Temp | 5.06 | 5.07 | 11.76 | 0.0200 |
| Precip | 3.93 | 3.94 | 1.81 | 0.7830 | |||
| Semipalmated Plover | Model 3: All Predictors | 107.86 | Temp | 6.94 | 6.96 | 3514.23 | <2 × 10⁻¹⁶ |
| Precip | 1.01 | 1.02 | 16.62 | 0.0001 | |||
| Wind | 1.02 | 1.02 | 16.33 | <2 × 10⁻¹⁶ | |||
| Western Sandpiper | Model 2: Temp + Precip | 75.92 | Temp | 6.24 | 6.24 | 24.87 | 0.0002 |
| Precip | 1.74 | 1.75 | 1.72 | 0.4751 | |||
| Wind | 1.01 | 1.01 | 0.46 | 0.5002 | |||
| Willet | Model 3: All Predictors | 85.29 | Temp | 2.28 | 2.37 | 1.22 | 0.4833 |
| Precip | 1.42 | 1.45 | 21.86 | 0.0004 | |||
| Wind | 4.89 | 5.12 | 29.61 | 0.0003 |
Disclaimer/Publisher’s Note: The statements, opinions and data contained in all publications are solely those of the individual author(s) and contributor(s) and not of MDPI and/or the editor(s). MDPI and/or the editor(s) disclaim responsibility for any injury to people or property resulting from any ideas, methods, instructions or products referred to in the content. |
© 2025 by the authors. Licensee MDPI, Basel, Switzerland. This article is an open access article distributed under the terms and conditions of the Creative Commons Attribution (CC BY) license (https://creativecommons.org/licenses/by/4.0/).
Share and Cite
Suthar, A.R.; Biggs, A.R.; Anderson, J.T. A Decadal Change in Shorebird Populations in Response to Temperature, Wind, and Precipitation at Hilton Head Island, South Carolina, USA. Birds 2025, 6, 14. https://doi.org/10.3390/birds6010014
Suthar AR, Biggs AR, Anderson JT. A Decadal Change in Shorebird Populations in Response to Temperature, Wind, and Precipitation at Hilton Head Island, South Carolina, USA. Birds. 2025; 6(1):14. https://doi.org/10.3390/birds6010014
Chicago/Turabian StyleSuthar, Akshit R., Alan R. Biggs, and James T. Anderson. 2025. "A Decadal Change in Shorebird Populations in Response to Temperature, Wind, and Precipitation at Hilton Head Island, South Carolina, USA" Birds 6, no. 1: 14. https://doi.org/10.3390/birds6010014
APA StyleSuthar, A. R., Biggs, A. R., & Anderson, J. T. (2025). A Decadal Change in Shorebird Populations in Response to Temperature, Wind, and Precipitation at Hilton Head Island, South Carolina, USA. Birds, 6(1), 14. https://doi.org/10.3390/birds6010014