Article

Aerodynamics of Flight Formations in Birds: A Quest for Energy Efficiency

Université de Reims Champagne-Ardenne, Institute of Thermal, Mechanical, and Materials Engineering ITheMM, Moulin de la Housse, CEDEX 2, 51687 Reims, France
*
Author to whom correspondence should be addressed.
Birds 2025, 6(2), 15; https://doi.org/10.3390/birds6020015
Submission received: 13 January 2025 / Revised: 14 March 2025 / Accepted: 17 March 2025 / Published: 24 March 2025

Simple Summary

This study aims to understand how wake vortex dynamics, influenced by birds’ relative positions, affect aerodynamic forces. Using computational modeling and a finite volume method, the research analyses complex vortex formations in the wake of Canada Geese under specific flight conditions. The findings underscore the critical role of positional strategies in maximizing the aerodynamic advantages of formation flight. These insights contribute significantly to understanding the organization and optimization of flying bird formations, shedding light on collective animal behavior.

Abstract

While the formation flight of birds offers numerous benefits, such as reduced predation risk, improved orientation, and enhanced communication, the aerodynamic interactions between birds are not fully understood due to their inherent complexity. This study explores the wake vortex dynamics of two flying birds and their influence on aerodynamic forces, based on their relative positions in a group. Using a computational finite volume method, the 3D vortex patterns in the wake of Canada Geese (Branta canadensis) flying at 1000 m altitude and 13.9 m/s airspeed were modeled. The results reveal a complex, undulating vortex structure shaped by the wingbeat amplitude and frequency. The analysis shows that trailing birds positioning their wingtips within the upwash region of vortices that are generated by a leading bird significantly reduce drag and enhance lift, achieving up to a 32% improvement in aerodynamic efficiency, calculated as the lift-to-drag ratio. An optimal separation distance of approximately one wavelength (3.47 m) between birds has been identified, leading to a 7% reduction in both mean drag force and aerodynamic power requirements. These findings, extrapolated to larger bird groups, offer valuable insights into the organization and optimal positioning of birds flying in V-formations, advancing our understanding of collective flight dynamics.

1. Introduction

Formation flight, particularly the iconic V-formation observed in flying birds, represents one of nature’s most fascinating aerodynamic strategies [1,2,3,4,5,6,7,8]. This highly organized flight pattern, widely studied for its energy saving benefits, enables birds to optimize their locomotive efficiency during long journeys [9,10,11,12]. By strategically positioning themselves to exploit the vortices that are generated by the wings of the bird ahead, birds in formation significantly reduce their energy expenditure. Studies have demonstrated that this cooperative strategy allows birds to conserve between 20% and 30% of their energy compared to solitary flight, with the exact savings being influenced by factors such as bird size and the spacing between wingtips [5,8,13,14,15].
V-formation flight offers substantial energy saving advantages, supported by empirical evidence. Lissaman and Schollenberger [5] demonstrated a remarkable 45% reduction in drag for birds flying in formation compared to solo flight. Similarly, Weimerskirch et al. [11] observed trained Great white pelicans (Pelecanus onocrotalus) achieving a 45% reduction in wingbeat frequency and a 11.4% to 14.5% decrease in heart rate while flying in formation. These birds also flapped less frequently and glided longer, translating into energy savings of 1.7% to 3.4%. These findings underscore the critical role of formation flight in conserving energy, a vital resource for birds given its influence on survival and reproduction [16,17].
In V-formation (Figure 1), the lead bird bears the primary burden of energy expenditure by facing the full aerodynamic drag, while trailing birds align themselves to capitalize on the low-pressure wake that is created by the leader [2,5,18,19]. This strategic positioning minimizes drag and enhances lift. Because of fatigue, birds frequently rotate leadership roles, so that the extra effort of the leading bird is often spread among several birds in a flock [2,13,17]. Despite its efficiency, the precise aerodynamic mechanisms underlying V-formation flight remain complex and not fully understood. Factors such as wake dynamics, vortex interactions, and wingbeat synchronization require further investigation to unravel the constraints and strategies shaping this behavior. Advances in both experimental and computational methods continue to shed light on these dynamics, offering new perspectives on the biomechanics of avian flight [20].
The study of bird flight mechanics has evolved significantly in recent decades [21], beginning with early investigations by Magnan et al. [22], who used tobacco smoke to visualize the wake vortices generated by a Rock Dove (Columba livia). These pioneering efforts revealed looping vortices during slow flight, providing the first evidence of structured wake patterns corresponding to wingbeat cycles. While early photographic records lacked precision, advances in video technology now provide high-resolution materials for analysis and 3D insights into bird flight dynamics [23]. Modern techniques such as digital particle image velocimetry (DPIV) have since enabled detailed visualization of wake dynamics, although they are often limited to smaller, slower-flying birds in controlled environments [24,25,26]. Computational fluid dynamics (CFD) has emerged as a powerful alternative, offering detailed insights into aerodynamic phenomena without the constraints of wind tunnel experiments. For instance, Maeng et al. [27] investigated energy savings in Canada Geese using numerical simulations, while Song et al. [28] modeled the wing flapping motion of a Calliope hummingbird (Selasphorus calliope) using dynamic mesh methods. These studies highlight the potential of CFD to complement experimental approaches, providing a more comprehensive understanding of bird flight.
Building on prior research exploring the influence of lateral (wingtip) spacing on aerodynamic forces in gliding flight [29], this study focused on the impact of longitudinal spacing (i.e., measured along the direction of forward translation) during flapping flight. Specifically, we analyzed how wake vortex characteristics change with varying distances between two Canada Geese flying in formation. Through computational simulations using the finite volume method, we visualized the 3D vortex patterns forming in the wake of geese flying at 1000 m altitude and a speed of 13.9 m/s.
We aimed for our findings to deepen our understanding of the aerodynamics underlying V-formation flight and its role in long-distance flight. By elucidating the relationship between bird positioning and aerodynamic performance, this research provides valuable insights into the evolutionary strategies that enable birds to achieve remarkable energy efficiency during their journeys.

2. Materials and Methods

2.1. Geometric Setup and Computational Framework

The approximated bird geometry, as shown in Figure 2, was developed using ANSYS 2020 R2 Workbench Design Modeler®, a CAD software.
The design was inspired by the actual shape of a Canada Goose’s wing in a flight position, with a wingspan of 0.72 m and a representative chord length of 0.3 m [30,31]. Our CAD model development methodology drew on the work of Liu et al. [30] and Dimitriadis et al. [31]. Liu et al. provided detailed analyses of the avian wing geometry using 3D laser scanning, covering parameters such as camber line, airfoil thickness, wing planform, and twist, all expressed through analytical formulas. Our model of the Canada Goose wing incorporates these aerodynamic features, though simplified for numerical modeling. Certain details, like the emargination of primary feathers, were omitted. The numerical method developed in this study prompts consideration of how wing morphological simplifications affect flight mechanics. The preliminary results [29] aligned with the existing literature [32], confirming consistency with previous findings on drag force [33], wing characteristics, and the bird’s weight.
The primary objective of this study was to determine the optimal longitudinal distance between two flying birds from an aerodynamic perspective. To achieve this, the concept of wavelength was employed, which represents the distance that a bird travels during one wingbeat cycle. The longitudinal distance was systematically varied from half a wavelength to one and a half wavelengths, corresponding to a range of 1.7375 m to 5.2125 m. The lateral separation, or wingtip spacing (WTS), was fixed at 26 cm, based on findings from a previous study [29]. Additionally, the distance between the bird geometry and the computational domain boundaries was carefully defined to ensure adherence to established best practices in computational fluid dynamics (CFD). These measures were taken to maintain a blockage ratio of less than 3%, in line with CFD guidelines [34].

2.2. Boundary Conditions

To simulate the aerodynamic conditions of flight, we specified an inlet velocity of 50 km/h (13.9 m/s) at the computational domain’s entrance, reflecting the average speed of a Canada Goose during flight [35]. At the domain’s outlet, we applied an ambient static pressure boundary condition. To ensure the conservation of mass, we assumed that all gradients at this boundary were zero. For the upper and lateral surfaces of the computational domain, a symmetry boundary condition was implemented, modeled as sliding walls. This method guarantees that both the normal velocity component and the normal gradients at the boundary are zero, ensuring that the flow remains parallel to the surfaces. On the bird’s body, we applied a no-slip wall condition with zero roughness to accurately simulate the interaction between the airflow and the bird’s surface. The birds were assumed to be flying at an altitude of 1000 m, where the air density was set to 1.11 kg/m³, consistent with standard atmospheric conditions at that altitude [36]. A detailed summary of the key computational fluid dynamics (CFD) parameters and the dimensional characteristics of the bird is presented in Table 1.

2.3. Computational Mesh

Meshing of the computational domain relied on a grid independence analysis conducted in a prior study [29]. The 3D unstructured mesh was created using ANSYS Workbench Meshing, featuring approximately 7.5 × 10⁶ elements for the single-bird case and up to 16.5 × 10⁶ elements for two-bird simulations with variable spacing. To resolve viscous and laminar boundary layers accurately, a highly refined inflation layer of 15 prismatic layers was applied to the bird’s body wall, with a progressive growth rate of 1.2. The first layer’s height was set to 10 μm to achieve a Y+ value below 1, essential for precise boundary layer representation. The surface mesh resolution on the bird’s body was optimized at 0.005 m to ensure a balance between computational accuracy and efficiency. A fine mesh refinement zone surrounded the bird and its wake, where element sizes averaged 0.05 m or less, enabling detailed resolution of flow structures. The remainder of the domain utilized a coarser Cartesian mesh, significantly reducing the computational load without compromising the fidelity of flow dynamics.

2.4. Methods for Real-Time Mesh Adaptation

This study modeled the wing motion of a bird in flight based on the dynamics of its wingbeat, as illustrated in Figure 2. The wing’s complex motion incorporates multiple rotational components that significantly influence flight mechanics. For numerical efficiency and simplified modeling, the wing was approximated as a rigid body. While the average flapping frequency of Canada Geese is around 4 Hz [37], it can vary depending on environmental factors such as altitude [38]. To simulate wing motion in real time, an adaptive dynamic mesh was employed to update the wing’s position at each time step (Δt = 0.001 s). The Fluent© solver automatically handled volumetric mesh updates using interpolation-based remeshing, an approach that is particularly suited to large displacements and intricate geometries. The solver was programmed with user-defined functions (UDFs) to integrate the wing’s trajectory, which includes three distinct rigid-body rotational motions: flapping and pitching, combined with a backward movement.
Within an orthonormal reference frame (O, x, y, z), these motions were represented as time-dependent functions (t), with their dynamics being governed by specific equations [35].
Su et al. [39] combined three distinct motions using specific kinematic equations to generate a wingbeat motion that was similar to that of a real bird. Compared to the values observed in Canada Geese during flight, the kinematic parameters of our model fall within similar ranges, although some differences may exist due to methodological variations and the specific experimental conditions of each study.
In an orthonormal coordinate system, a flapping motion is described as an angular oscillation around the x-axis. Let ϕ(t) represent the flapping angle; then, the position of the wingtip in the z-direction is given by the following:
z ( t ) = A f s i n ( ω t + ϕ 0 )
where Af is the flapping amplitude, ω is the angular frequency (ω = 2πf, with f being the frequency in Hz), and ϕ0 is the initial phase of the flapping motion.
Pitching refers to the rotational motion of the wing about its longitudinal z-axis. The pitching angle, denoted as θ(t), is described by the following:
θ ( t ) = A p s i n ( ω t + θ 0 )
where Ap is the amplitude of the pitching rotation, and θ represents the initial phase for the pitching motion.
A backward movement simulates the wing rotation backwards from its original position. Let r(t) denote this distance during the backward process:
r ( t ) = r 0 + A r s i n ( ω t + ψ 0 )
Here, r0 is the average length of the wing (or its unfolded length), Ar is the amplitude of the backward motion, and ψ0 is the initial phase of the backward movement.

2.5. Computational Approaches

The calculations were carried out using the ANSYS Fluent© 2020 R2 CFD software. To solve the 3D Reynolds-averaged Navier–Stokes (RANS) equations, the SST k-ω turbulence model was applied [40]. For pressure–velocity coupling, the SIMPLE algorithm was utilized, with second-order discretization schemes, and gradients were determined using the least squares cell-based approach. The SST k-ω model, which is a two-equation model for turbulent viscosity, is commonly employed in a variety of aerodynamic simulations. It is particularly effective for flows with adverse pressure gradients and flow separation [37,38]. The momentum and continuity equations for an incompressible, isotropic fluid are expressed as follows:
( ρ u ) t + · ( ρ u u ) = p + μ 2 u + f
· u = 0
where u is the fluid velocity vector, ρ is the fluid density, p is the pressure, f is the volumetric force (gravity), and μ is the dynamic viscosity.
Throughout the iterative process, the drag and lift coefficients were monitored. The computations were performed on a Dell Precision 7920 workstation, utilizing Xeon Gold 6146 3.2 GHz processors in parallel. Assuming a constant flight altitude, the initial conditions consisted of constant velocity and pressure, with the temperature assumed to be constant, negating the need for an energy equation. The numerical method used in this study is identical to that of previous work [29,38]. The results obtained for both the individual wing and the entire bird were validated by comparing them with experimental data from the literature [29,38].

3. Results

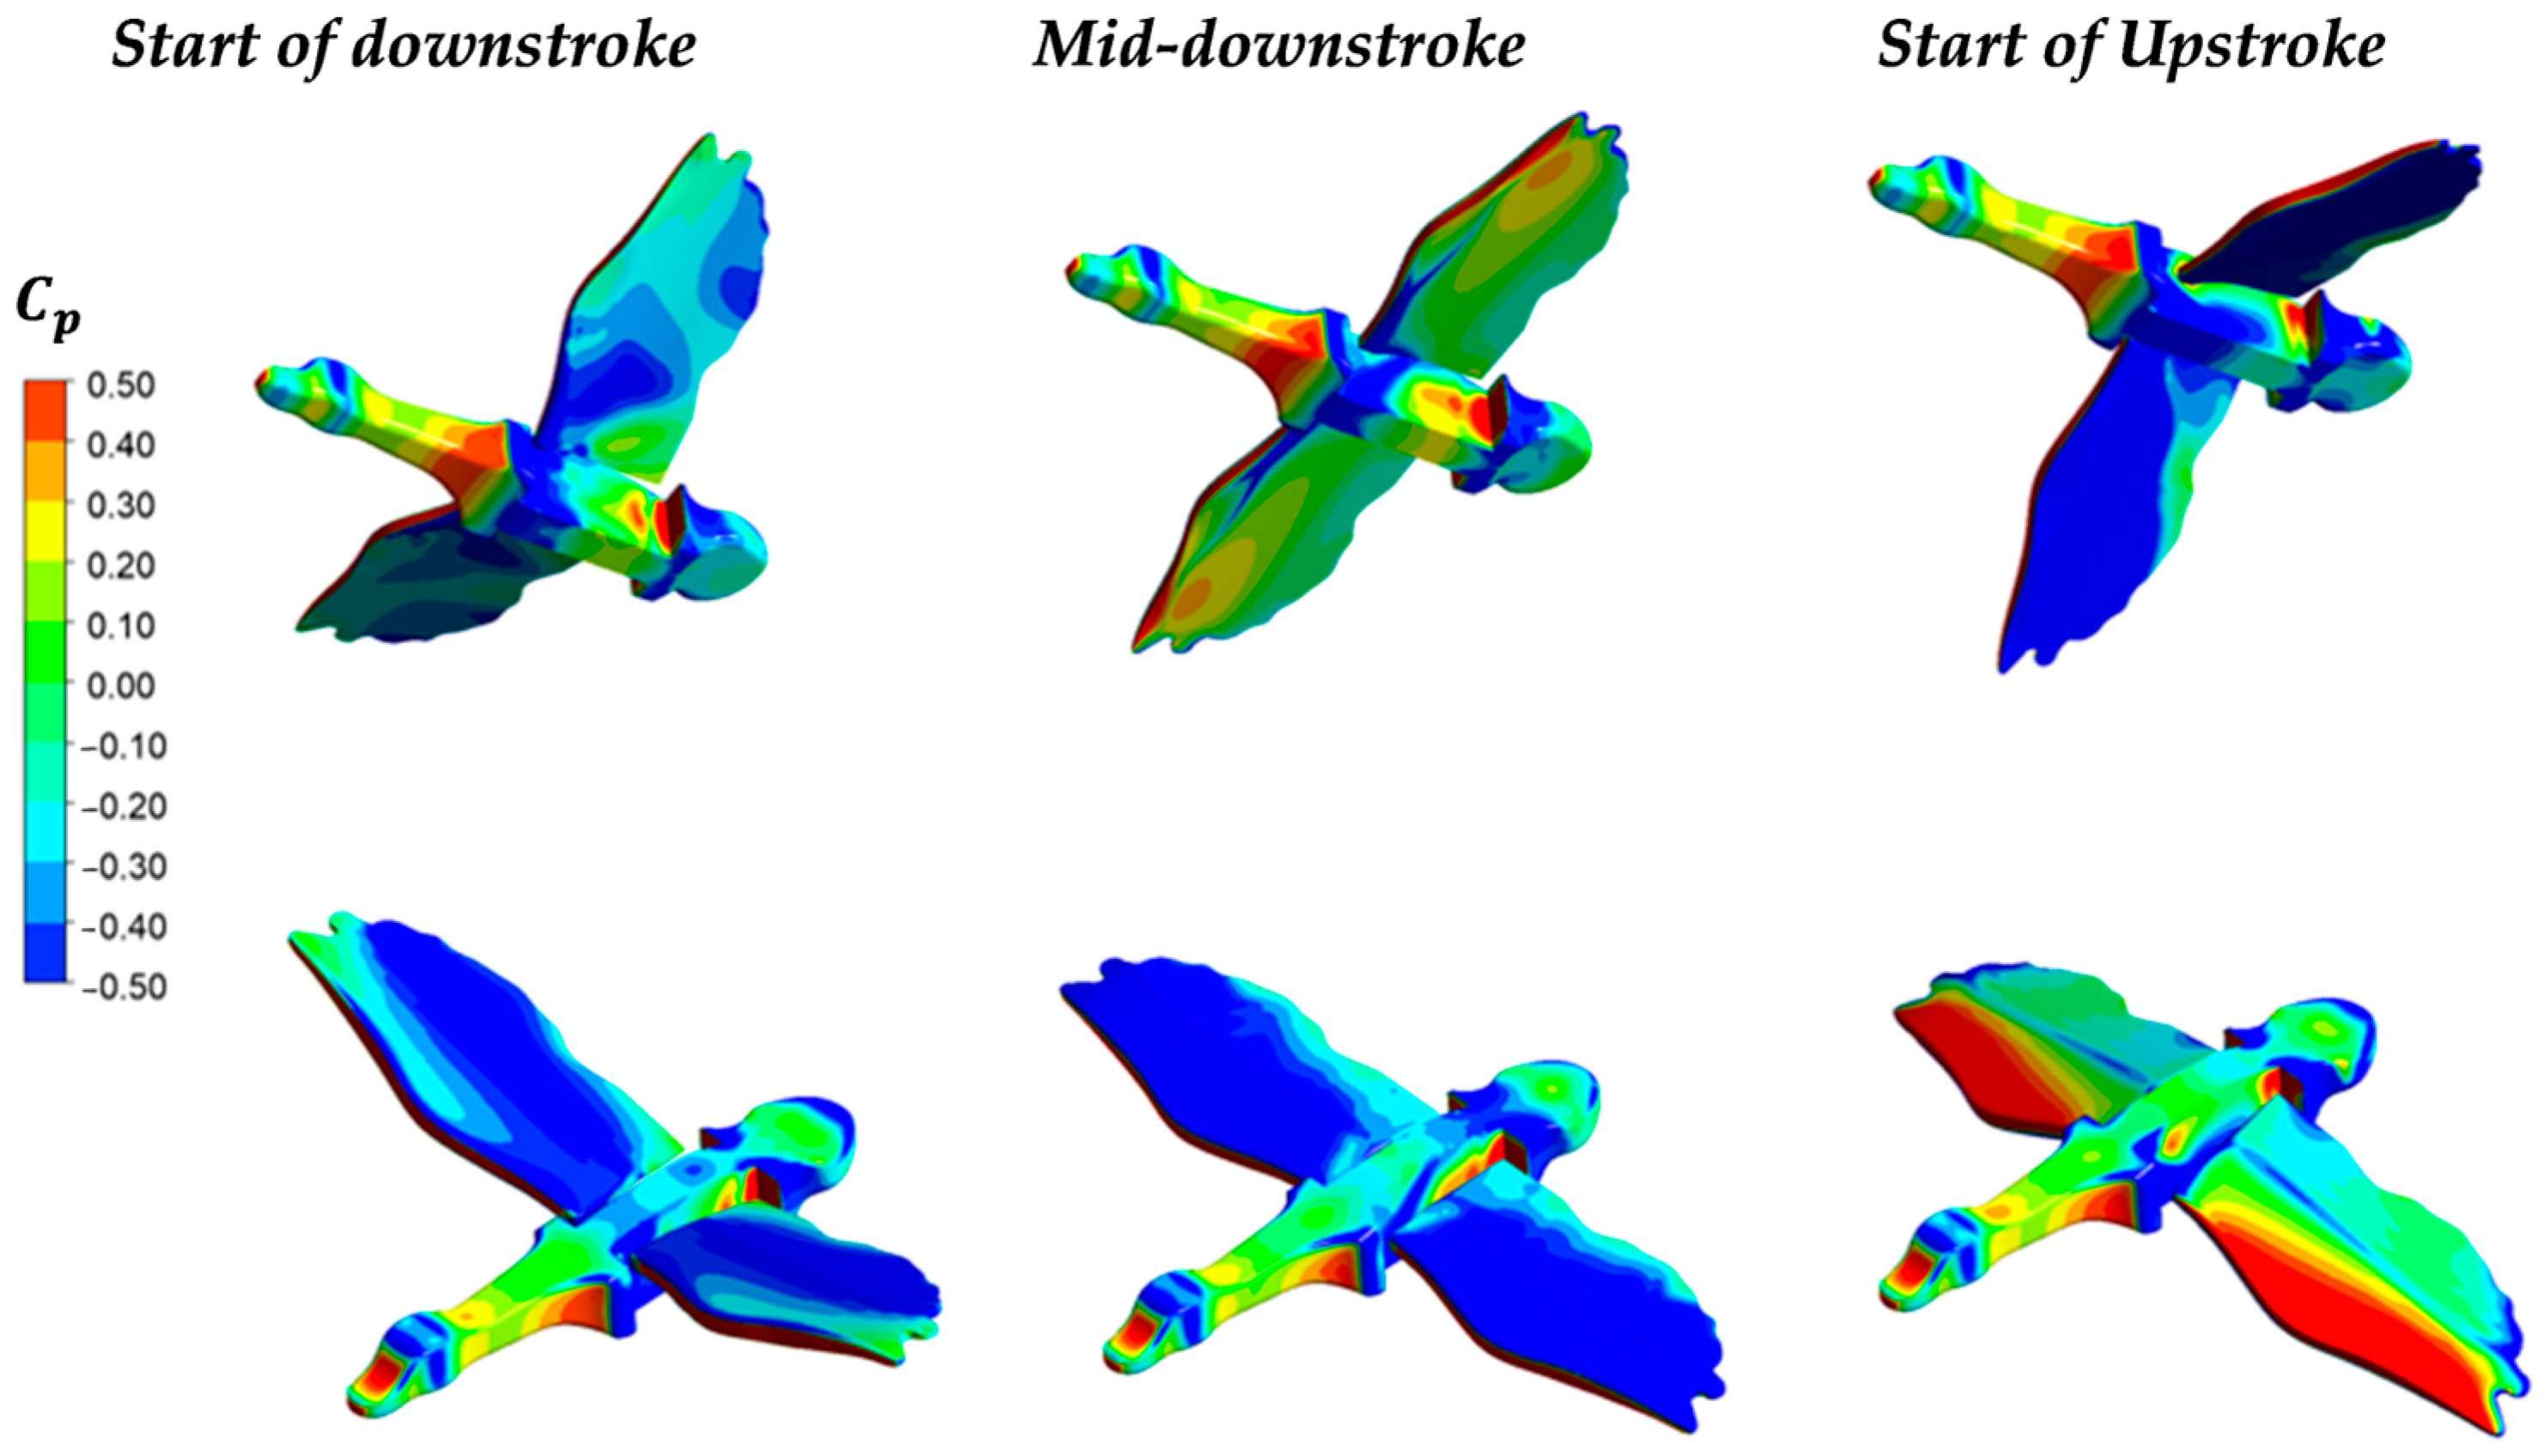
3.1. Aerodynamic Performance of a Lone Bird in Flight

Figure 3 illustrates the distribution of pressure coefficients on a bird’s body during a wingbeat cycle. To emphasize subtle changes in pressure, the pressure range was intentionally limited to the interval of [−0.5, 0.5]. The pressure coefficient, which quantifies the pressure distribution, is defined as follows:
C p = 2 P P 0 ρ u 2
where P is the static pressure, P0 is the reference static pressure (i.e., atmospheric pressure), ρ the air density, and u is the speed of the body through the fluid (m·s−1).
This dynamic wake is inherently complex and three-dimensional, making its structure challenging to fully capture using conventional methods. Computational fluid dynamics (CFD) offers a more realistic representation of this structure, providing quantitative insights into the aerodynamic forces acting on flying birds. For further details, Figure 4 depicts the flow streamlines in a bird’s wake across five vertical planes during the downstroke, upstroke, and mid-upstroke phases. Additionally, Figure 5 shows the vertical velocity plotted along a horizontal line passing through the vortex core at x = 1.73 m, 3.47 m, and 5.21 m in the bird’s wake for the downstroke, mid-downstroke, and upstroke phases, respectively. From the graph, two distinct zones can be identified: the upwash zone, where velocities are positive, and the downwash zone, where velocities are negative.
The velocity patterns exhibit a cyclical repetition with a gradual decrease in magnitude as the measurement planes move further from the bird. Figure 4 and Figure 5 indicate that the wake has an undulating and fluctuating nature, making it challenging to determine the optimal aerodynamic position within the wake.

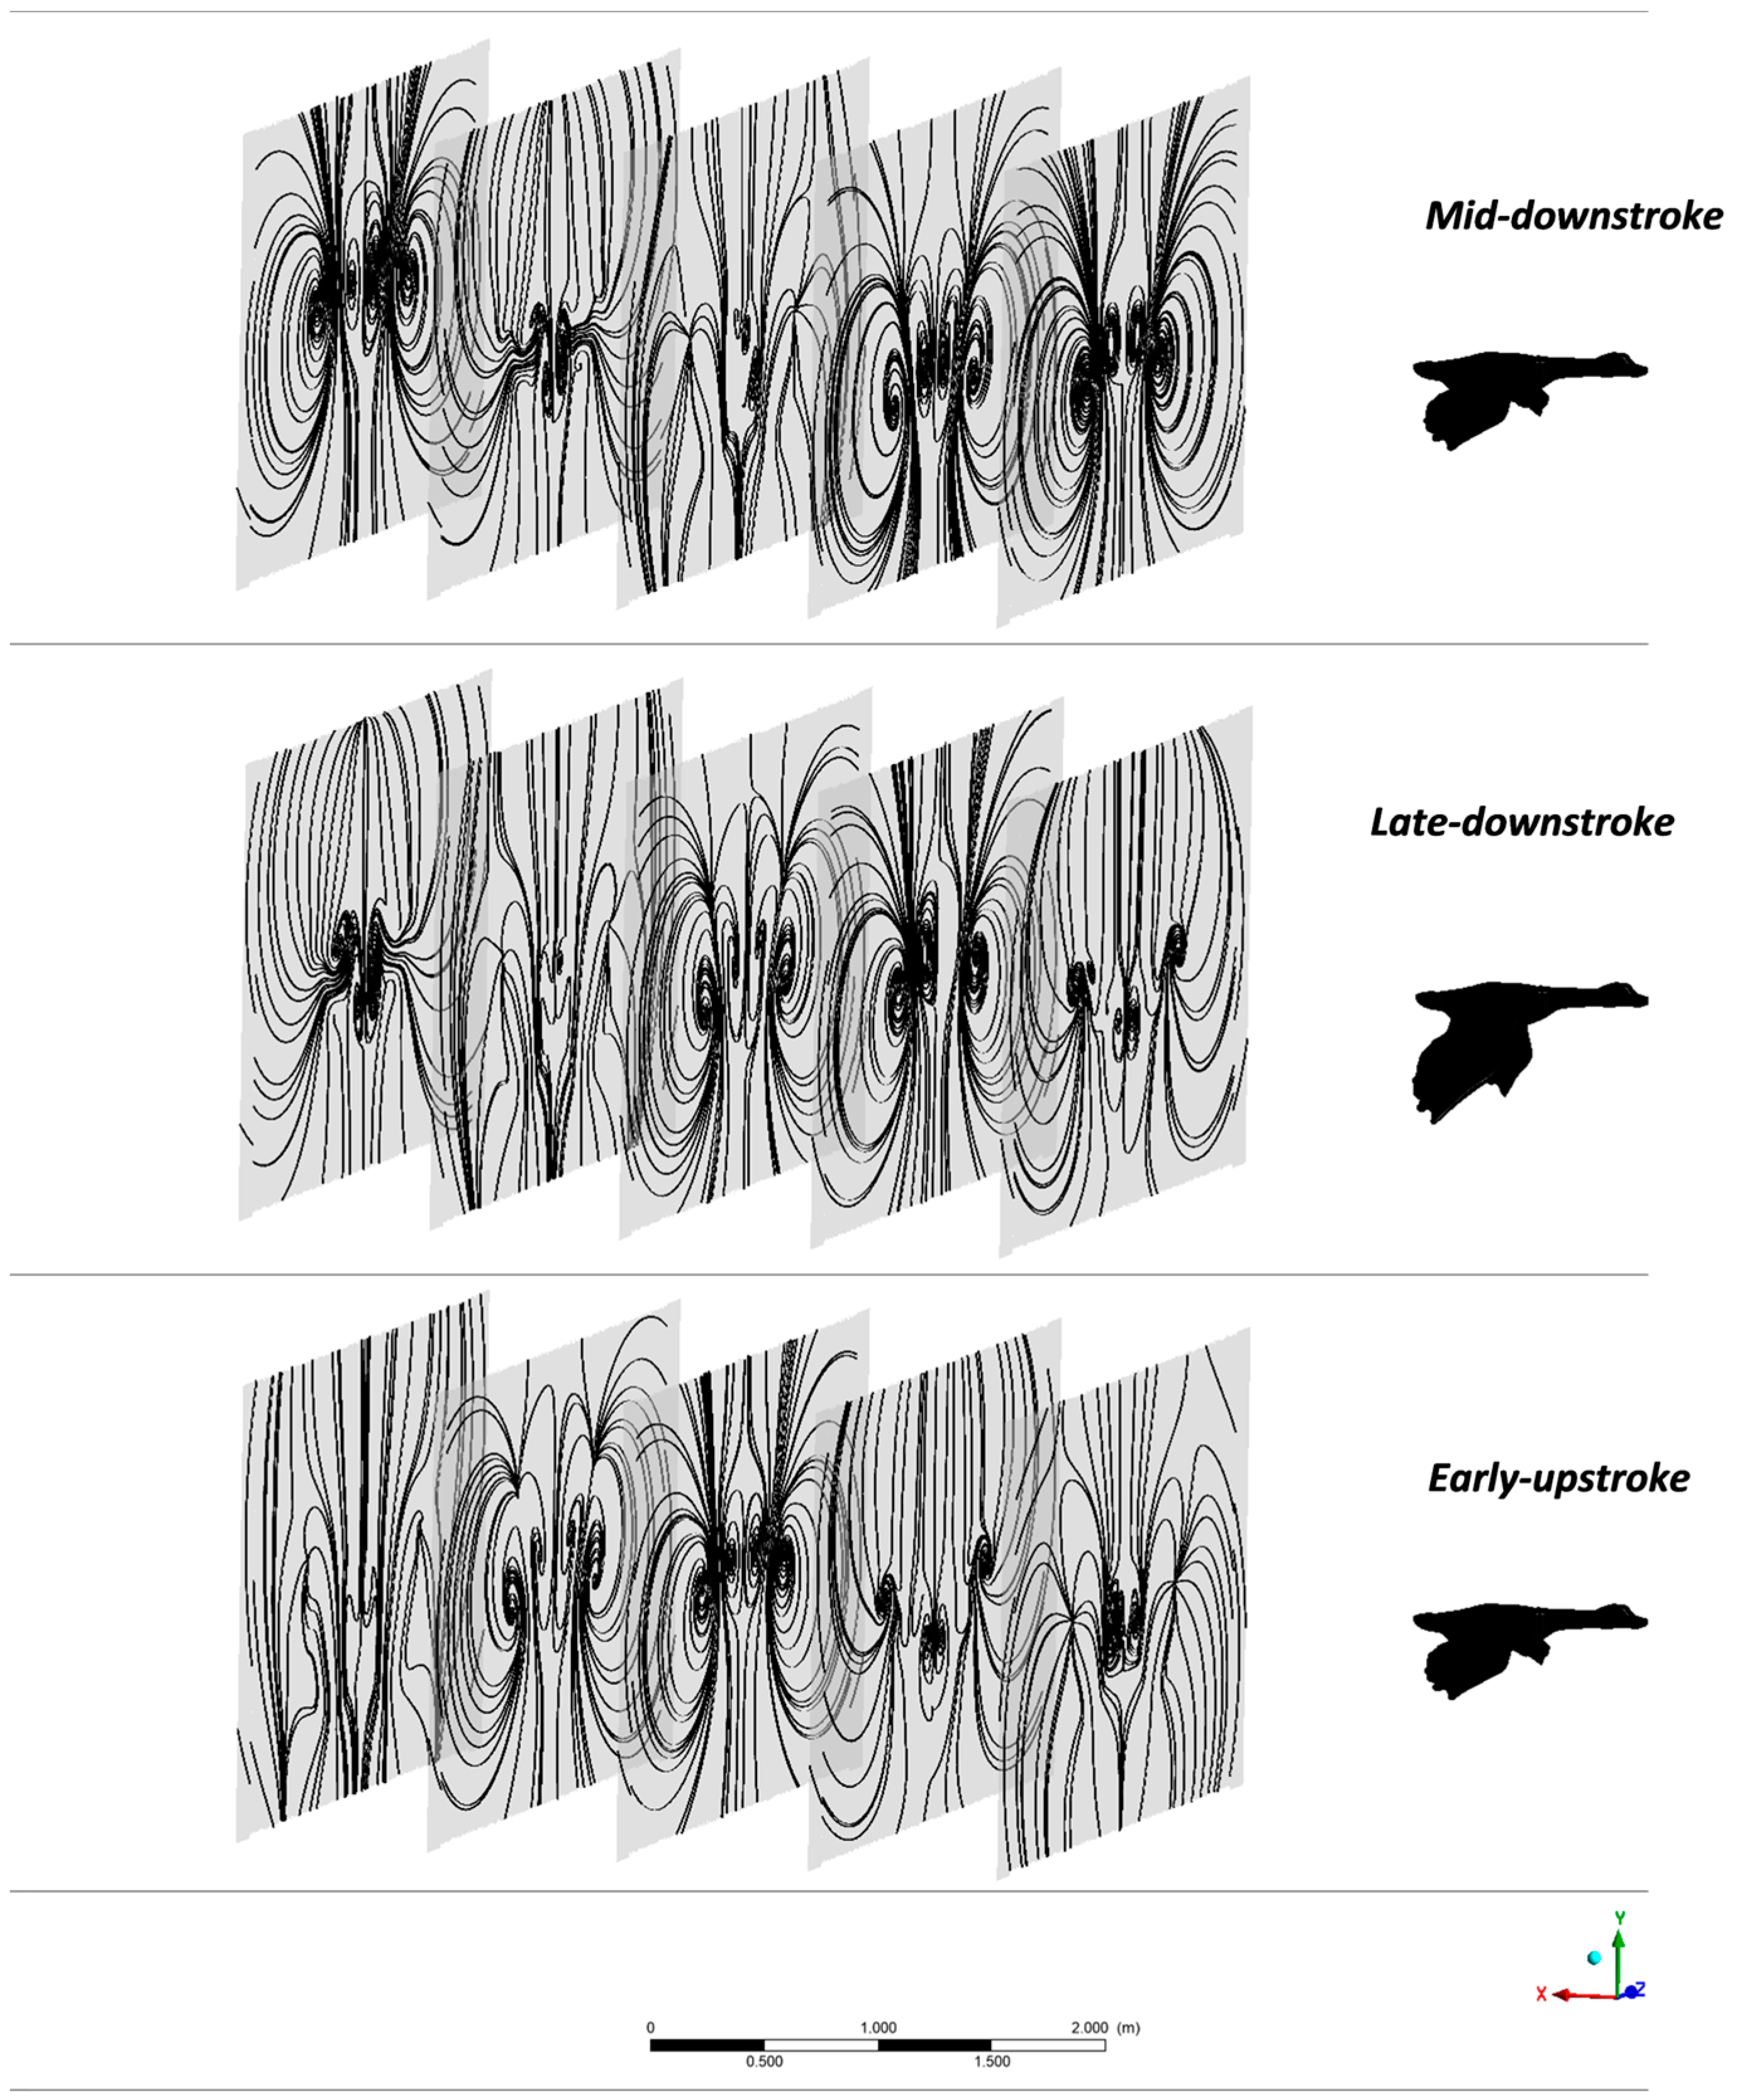
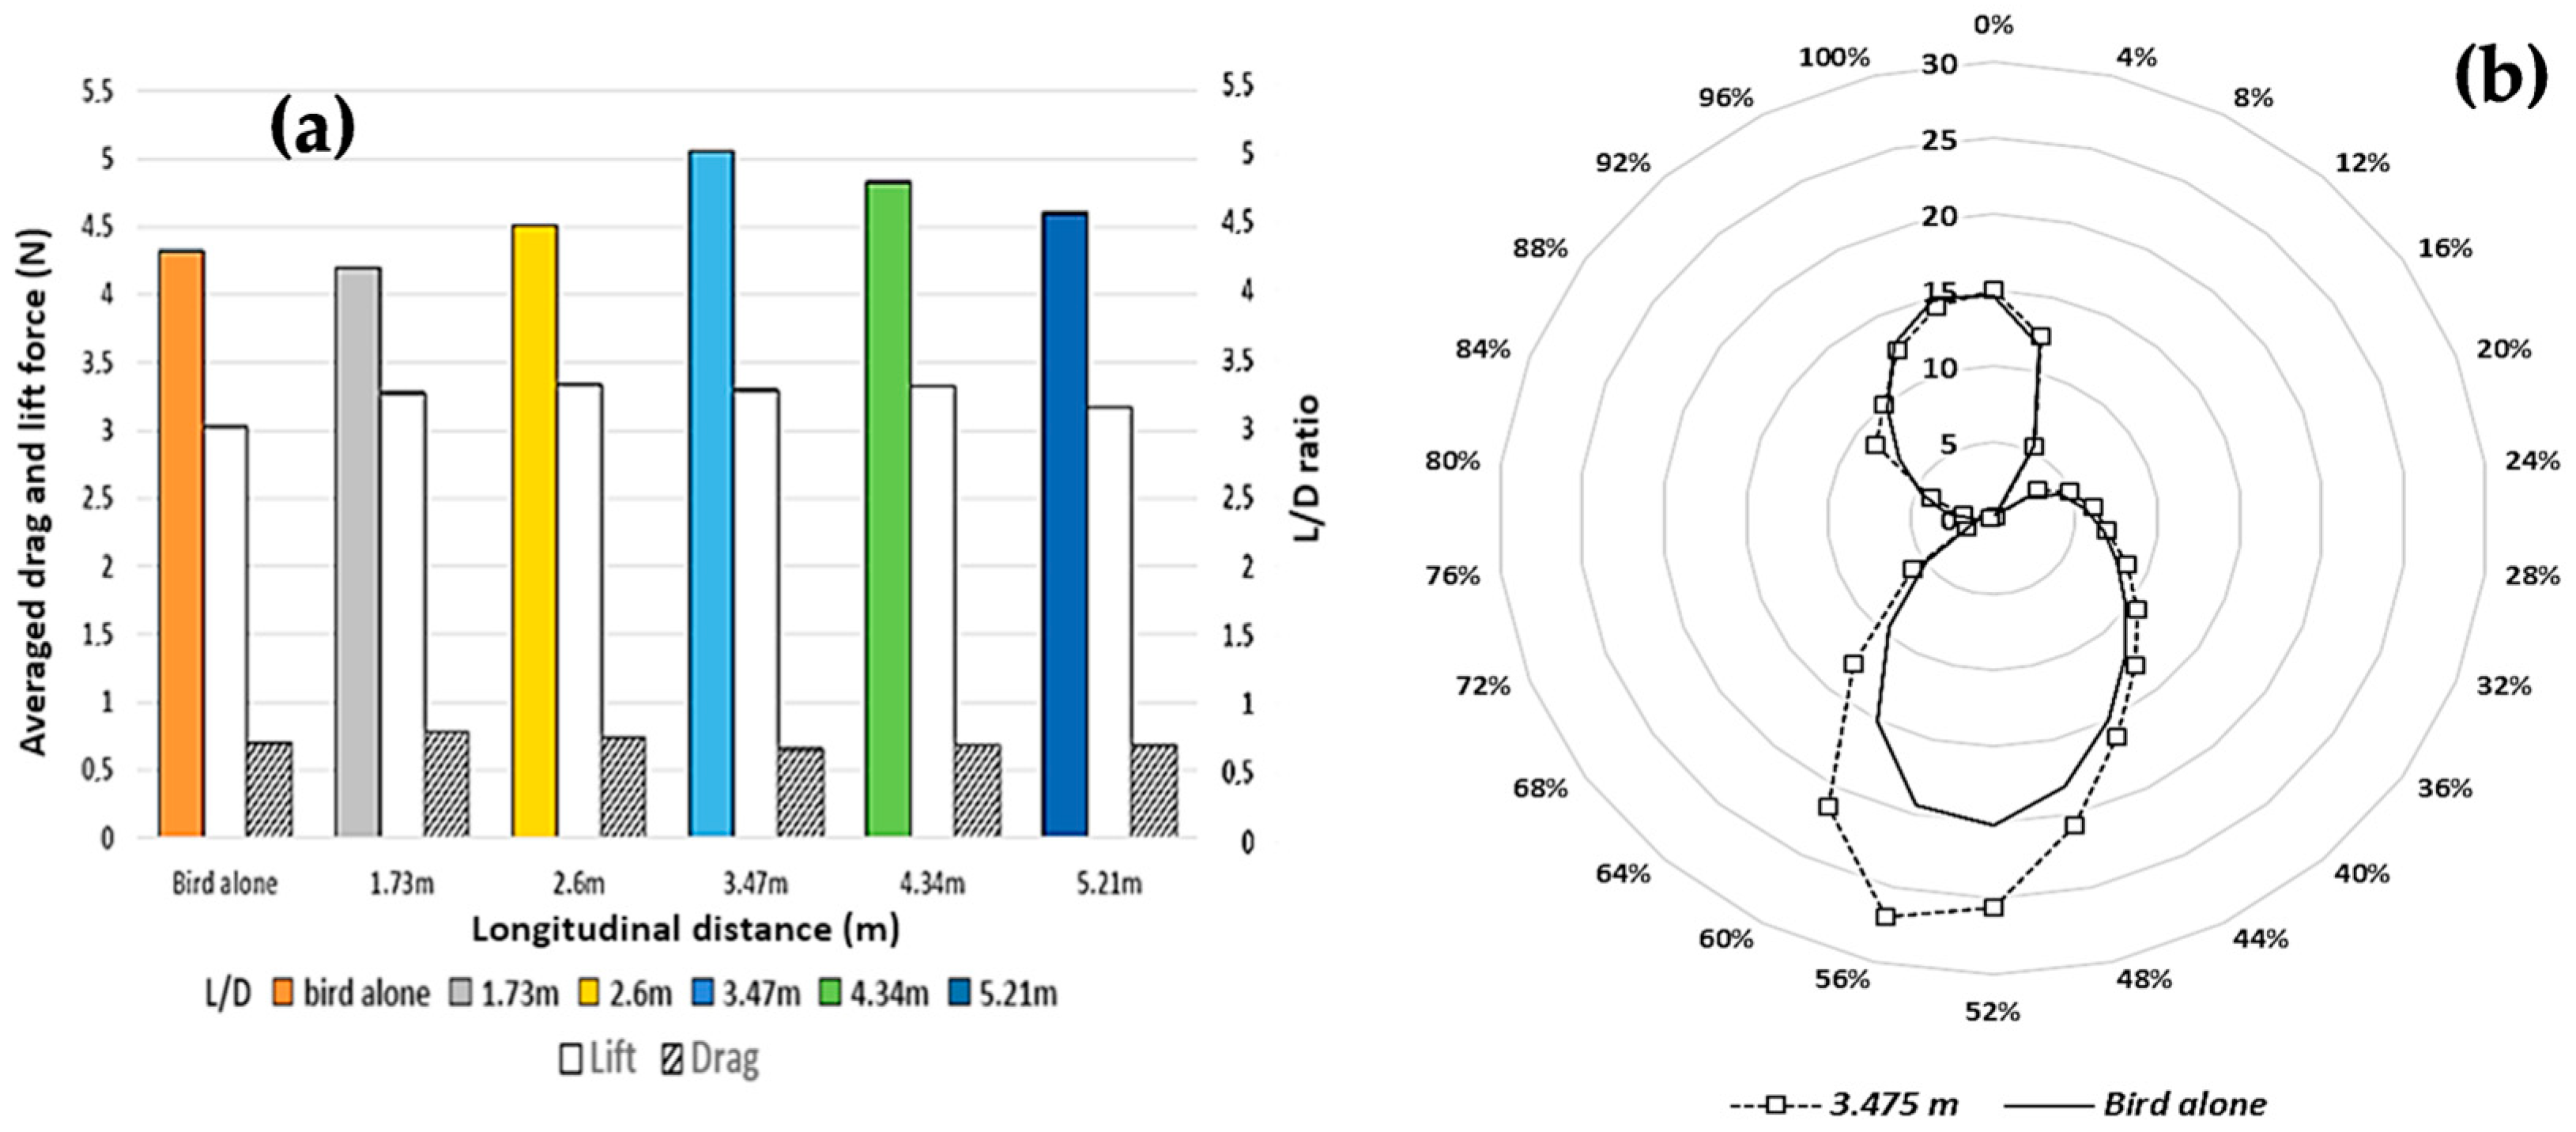
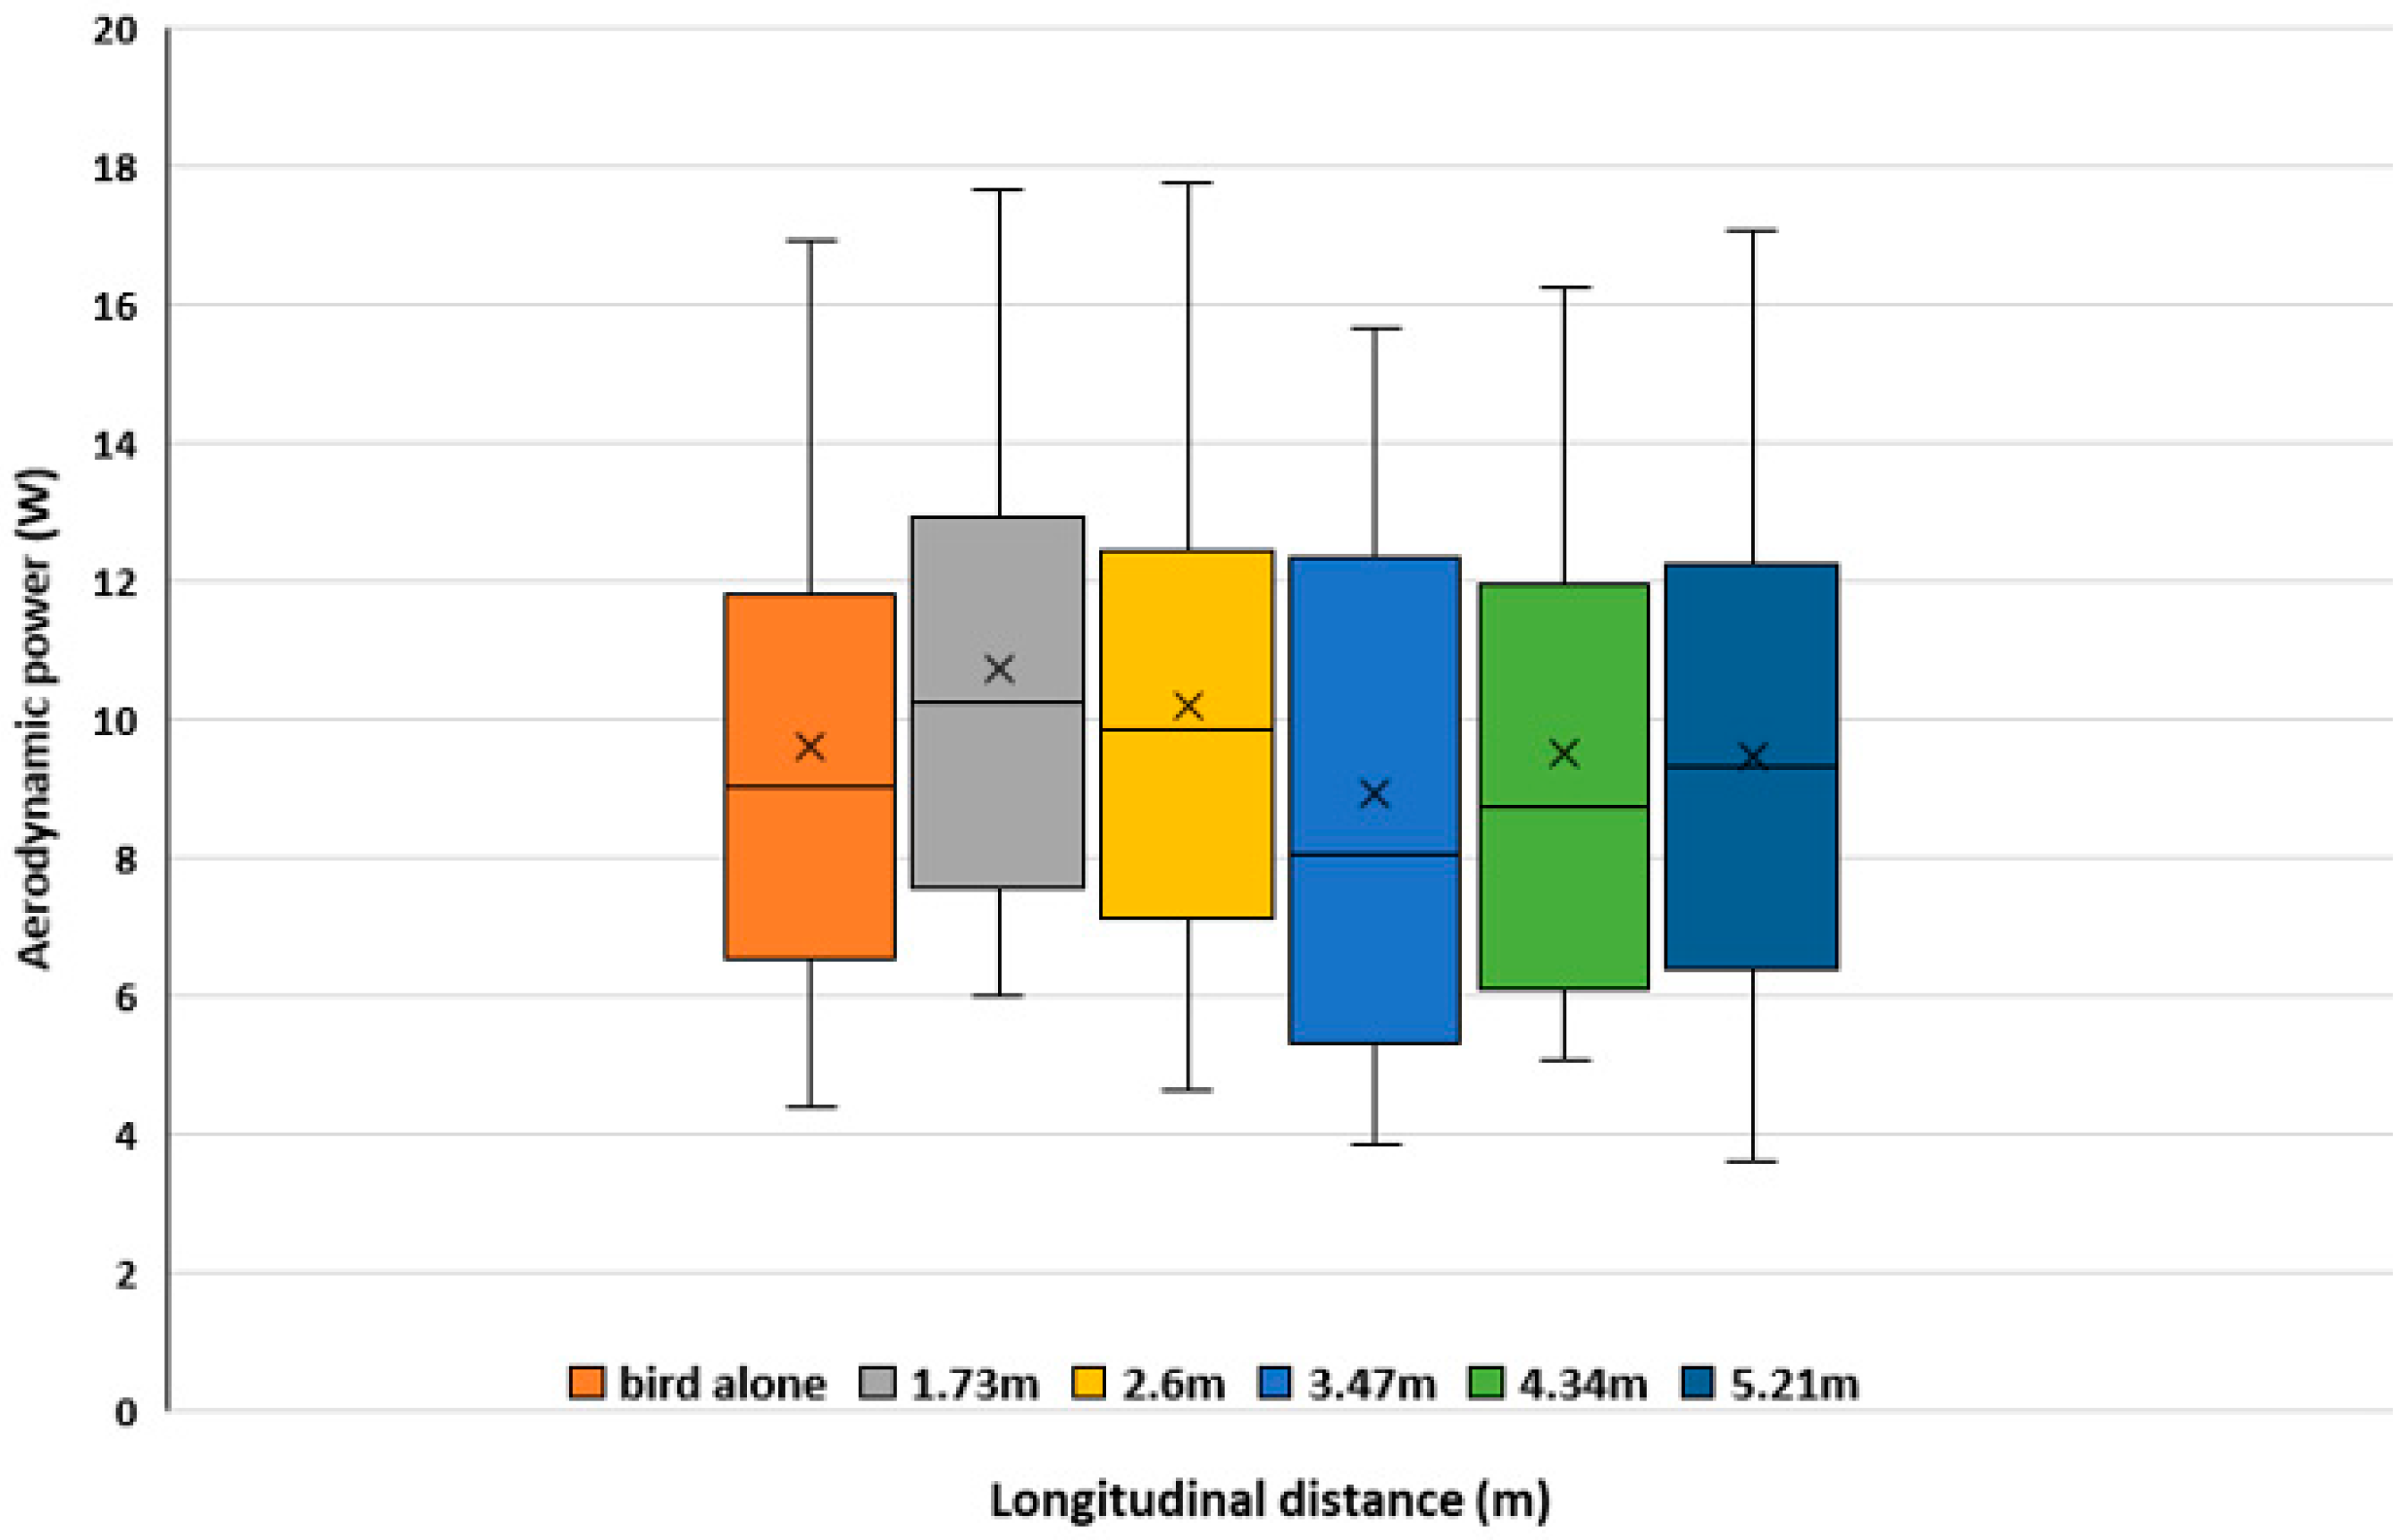
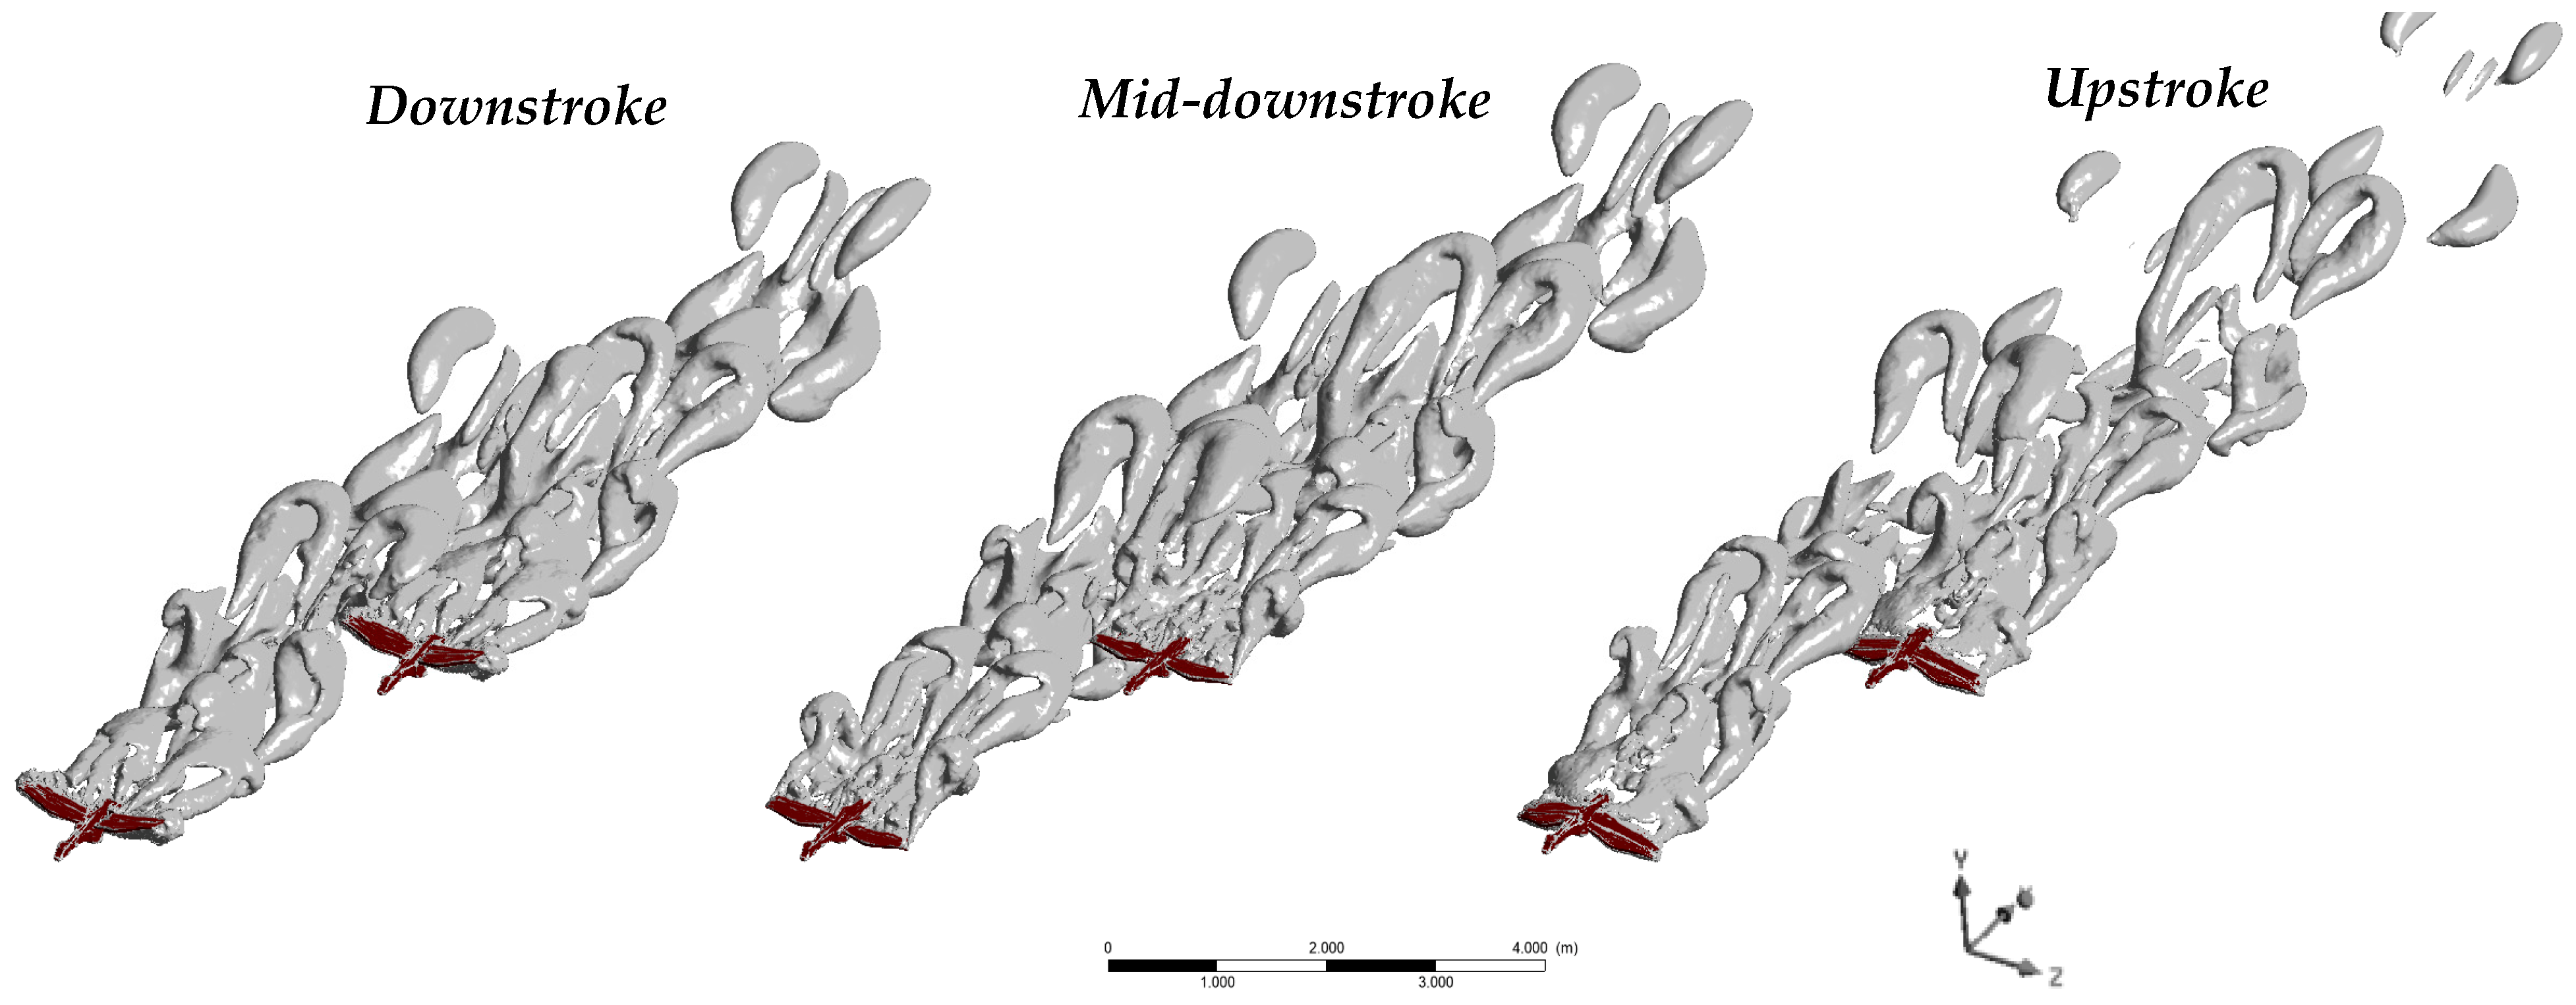
3.2. Aerodynamic Interactions Between Two Birds Flying in Formation

To assess the aerodynamic benefits of flying in the wake of another bird and to identify the optimal positioning, Figure 6a presents the drag and lift forces, averaged over a complete wingbeat cycle for a trailing bird at varying longitudinal distances (depths) from the leading bird. Please note that force monitoring (lift and drag) was carried out for the entire bird body, i.e., wings, body, and tail.
While the lift and drag forces naturally fluctuate throughout the wingbeat cycle, averaging these forces over a full cycle allows for a clearer and more consistent analysis.
The results indicate that the average drag force depends significantly on the distance between the birds.
Figure 6a further explores the variation in aerodynamic efficiency, represented by the lift-to-drag (L/D) ratio, for both a solitary bird and a trailing bird at different longitudinal separations. The L/D ratio is a critical measure of flight performance, reflecting how effectively lift is generated while minimizing the drag.
To provide a comprehensive overview, Figure 6b illustrates the evolution of the lift-to-drag (L/D) ratio throughout an entire wingbeat cycle as a percentage for both a solitary bird and a trailing bird positioned 3.47 m behind a leading bird.
To delve deeper into the analysis, the aerodynamic power that is required to overcome the drag force can be quantified, taking into account the longitudinal distance between the lead bird and the trailing bird. This relationship highlights the energetic benefits of optimal spacing, as trailing birds can significantly reduce their power expenditure by leveraging the upwash zones that are created in the leader’s wake. The aerodynamic power P(W) that is necessary for a bird to counteract the drag force can be expressed using the following relationship:
P = F D × U
with FD (N) being the drag force exerted on the bird and U (m·s−1) being the bird’s speed.
Figure 7 illustrates the aerodynamic power of the trailing bird as a function of its longitudinal distance from the leading bird compared to the power required by the leading bird alone. The graph provides an insight into the distribution of aerodynamic power throughout a flapping cycle and highlights the mean power value over time.
Figure 8 illustrates the wake structure, visualized using the Q-criterion for two birds flying in phase at 3.47 m and showing distinct moments of a typical wingbeat cycle.
Figure 9 further visualizes the wake structure, with vortices being color-coded by their x-vorticity, indicating their rotational directions. One wingtip vortex rotates clockwise, while the other rotates counterclockwise, preventing vortex merging.

4. Discussion

The mechanics of wing flapping involve complex, three-dimensional, unsteady motions that vary across the wing’s span [41]. This motion consists of two primary phases: the downstroke (power phase), which generates most of the thrust, and the upstroke (recovery phase), where the thrust generation depends on the wing shape [42].
During flight, the airflow fluctuates within the bird’s wake [43]. Flapping creates a pressure difference between the upper and lower wing surfaces, leading to lift production. During the downstroke, positive pressure builds below the wing and negative pressure above, generating lift. In the upstroke, the pressure distribution inverts, yet the upper surface generally maintains lower pressure than the lower surface on average [25,44]. This imbalance leads to wingtip vortices, as identified by Green [45], where the high-pressure airflow from below moves to the low-pressure upper surface, forming rotating vortices. The wake consists of two main structural components, wingtip and tail vortices, inducing a downstream rotational flow that eventually forms counter-rotating vortex pairs [29]. The strength of these vortices depends on the pressure difference, which is governed by the angle of attack. These vortices are critical in formation flight, as trailing birds exploit the upwash from the leader’s wake to reduce their energy expenditure. Throughout the wingbeat cycle, vertical velocities alternate, requiring trailing birds to position themselves to maximize upwash exposure while minimizing downwash effects. Since upwash velocities exceed downwash velocities, birds experience varying forces across their bodies, necessitating continuous position adjustments.
Force monitoring results indicate that at separation distances of 1.73 m and 2.6 m, trailing birds experience higher average drag than solitary birds. However, at greater distances, the drag progressively decreases, reaching its lowest value at 3.47 m—one full wingbeat cycle wavelength. The lift is consistently higher for trailing birds than for solitary ones across all distances, enhancing the aerodynamic advantage. A higher lift-to-drag (L/D) ratio indicates improved efficiency, which is critical for reducing energy consumption. At 1.73 m, the aerodynamic efficiency declines as the L/D ratio falls below that of an isolated bird, suggesting that excessive proximity to the leader creates unfavorable interactions. At the optimal 3.47 m separation, the trailing bird achieves a maximum L/D ratio of 27, compared to 20.4 for a solitary bird—representing a 32% improvement in aerodynamic efficiency over a wingbeat cycle.
Aerodynamic efficiency correlates with power requirements, which vary with the trailing bird’s distance from the leader. Since the aerodynamic power is directly proportional to the drag, optimal positioning within the upwash zone leads to significant drag reduction. At 3.47 m, the trailing bird experiences a 7% reduction in mean drag force, underscoring the energetic benefits of precise V-formation spacing. While formation flight conserves energy, only trailing birds benefit directly from upwash, necessitating role alternation to distribute the energetic burden [46]. Recent observations reveal asymmetries in forces acting on trailing birds’ wings [29], suggesting that birds adjust the lateral positions within the group to balance the energy distribution. Slightly trailing and laterally offset birds can further optimize efficiency by exploiting rotating air vortices at the leader’s wingtips.
Despite being fundamental to fluid dynamics, vortex detection remains challenging. The Q-criterion is commonly used to visualize vortices by identifying regions where vorticity dominates over strain rates and viscous stress. The wake features horizontal vortices with both upward and downward components. The strong counter-rotating vortices that are generated at wingtips during the downstroke play a crucial role in lift production [47,48,49,50,51]. Trailing birds aligning their wingtips with upward vortex components recover some lost energy, enhancing lift while reducing their energy expenditure. These vortices dissipate as the energy is transformed through viscosity, requiring birds to finely adjust the wingbeat phase with vortex motion. Birds employ various phasing strategies: symmetric phasing, where both wings beat in unison, or asymmetric phasing, where wingbeats are temporally offset. Portugal et al. [52] found that northern bald ibises (Geronticus eremita) consistently positioned their inner wings within the leader’s upwash region, aligning with aerodynamic theory [6,11]. Achieving this requires precise control of body posture and wingbeat phase to synchronize with the leader’s wingtip vortices.
This study is subject to several limitations that should be kept in mind when interpreting its results. Firstly, the simplified wing geometry used in the research does not fully represent the complexities of a real bird wing, particularly the role of feathers, which actively influence aerodynamics. Furthermore, the model presumes that the bird’s body and wings are rigid and unchanging, while in reality, bird wings are extremely flexible and adaptable. For real birds, the entire wing exhibits a spanwise twist and the feathers flex, particularly those of the hand-wing. Another limitation arises from the artificial separation of the wings from the bird’s body by a small distance, necessitated by constraints associated with dynamic meshing. Although this deviation has been shown to have a minimal effect on overall aerodynamic performance, it cannot be ignored that it may alter the airflow patterns. Furthermore, this study does not incorporate environmental factors such as the temperature, wind, and other external conditions, which are critical to real-world flight dynamics. These factors significantly impact aerodynamic parameters and overall flight behavior. Recognizing these limitations is essential for accurately interpreting the results and underscores the need for future research to address these gaps. By overcoming these constraints, we can achieve a more detailed and realistic comprehension of bird flight dynamics.

5. Conclusions

Our findings emphasize the critical role of inter-bird spacing in optimizing energy efficiency. Trailing birds, by positioning their wingtips within the upwash region of a leading bird’s wingtip vortex, can significantly enhance lift and reduce drag, resulting in an improvement of up to 32% in aerodynamic efficiency. Additionally, this study confirms that the optimal separation distance of approximately one wavelength (3.47 m) between birds aligns closely with theoretical predictions of vortex interactions. This spacing not only supports efficient aerodynamic interactions but also leads to a marked improvement in the lift-to-drag ratio, illustrating the energy saving potential of such strategies during long-distance journeys.
By analyzing average power values, it was observed that a longitudinal distance of 3.47 m enables a significant reduction in aerodynamic power, driven by a corresponding decrease in the mean drag force of approximately 7%. This finding underscores the importance of precise spacing in V-formation flight, allowing trailing birds to effectively exploit the upwash zones that are generated by the leading bird. Such energy-conserving strategies are essential for the remarkable endurance exhibited by flying bird species. The limitations include a simplified wing geometry, rigid-body assumptions, and the exclusion of environmental factors. Refined computational models should integrate real-world complexities—such as variable wind conditions, dynamic wing motions, hand-wing folding, and variations in wing surface area.
Advancing this knowledge may also inspire the development of bio-inspired technologies in engineering applications, paving the way for innovations in aviation and drone design.

Supplementary Materials

The following supporting information can be downloaded at: https://www.mdpi.com/article/10.3390/birds6020015/s1. Video S1: Wake structure past the bird.

Author Contributions

Conceptualization, F.B. (Fabien Beaumont) and G.P.; Data curation, F.B. (Fabien Bogard) and G.P.; Formal analysis, F.B. (Fabien Beaumont) and S.M.; Investigation, G.P.; Methodology, S.M. and F.B. (Fabien Bogard); Project administration, S.M.; Software, F.B. (Fabien Beaumont) and S.M.; Supervision, G.P.; Validation, F.B. (Fabien Bogard) and G.P.; Visualization, F.B. (Fabien Bogard) and G.P.; Writing—original draft, F.B. (Fabien Beaumont); Writing—review and editing, S.M. All authors have read and agreed to the published version of the manuscript.

Funding

This research received no external funding.

Institutional Review Board Statement

Not applicable.

Data Availability Statement

The original contributions presented in this study are included in the article/Supplementary Material. Further inquiries can be directed to the corresponding author.

Acknowledgments

The authors acknowledge the use of ChatGPT 4o (Open AI, https://chat.openai.com, accessed on 10 December 2024) for language improvement purposes only. The prompt used was “Rephrase to scientific English”.

Conflicts of Interest

The authors declare no conflicts of interest.

References

  1. Beaumont, F.; Murer, S.; Bogard, F.; Polidori, G. The Aerodynamic Mechanisms of the Formation Flight of Migratory Birds: A Narrative Review. Appl. Sci. 2024, 14, 5402. [Google Scholar] [CrossRef]
  2. Couzin, I.D.; Krause, J.; Franks, N.R.; Levin, S.A. Effective Leadership and Decision Making in Animal Groups on the Move. Nature 2004, 433, 513–516. [Google Scholar]
  3. Nagy, M.; Akos, Z.; Biro, D.; Vicsek, T. Hierarchical group dynamics in pigeon flocks. Nature 2010, 464, 890–894. [Google Scholar]
  4. May, R.M. Flight formations in Geese and other birds. Nature 1979, 282, 778–780. [Google Scholar]
  5. Lissaman, P.B.; Schollenberger, C.A. Formation flight of birds. Science 1970, 168, 1003–1005. [Google Scholar] [PubMed]
  6. Badgerow, J.P.; Hainsworth, F.R. Energy Savings through Formation Flight? A Reexamination of the Vee Formation. J. Theor. Biol. 1981, 93, 41–52. [Google Scholar]
  7. Cutts, C.J.; Speakman, J.R. Energy Savings in Formation Flight of Pink-Footed Geese. J. Exp. Biol. 1994, 189, 251–261. [Google Scholar]
  8. Hummel, D. Aerodynamic aspects of formation flight in birds. J. Theor. Biol. 1983, 104, 321–347. [Google Scholar]
  9. Liao, J.C.; Beal, D.N.; Lauder, G.V.; Triantafyllou, M.S. Fish exploiting vortices decrease muscle activity. Science 2003, 302, 1566–1569. [Google Scholar]
  10. Bill, R.G.; Hernnkind, W.F. Drag Reduction by Formation Movement in Spiny Lobsters. Science 1976, 193, 1146–1148. [Google Scholar]
  11. Weimerskirch, H.; Martin, J.; Clerquin, Y.; Alexandre, P.; Jiraskova, S. Energy saving in flight formation. Nature 2001, 413, 697–698. [Google Scholar] [PubMed]
  12. Fish, F.E. Kinematics of ducklings swimming in formation: Consequence of position. J. Exp. Zool. 1995, 273, 1–11. [Google Scholar] [CrossRef]
  13. Speakman, J.R.; Banks, D. The function of flight formation in Greylag geese (Anser anser): Energy saving or orientation? Ibis 1998, 140, 280–287. [Google Scholar]
  14. Chichka, D.F.; Speyer, J.L.; Park, C.G. Peek-Seeking Control with Application to Formation Flight. In Proceedings of the 38th IEEE Conference on Decision and Control (Cat. No. 99CH36304), Phoenix, AZ, USA, 7–10 December 1999; pp. 2463–2470. [Google Scholar]
  15. Andersson, M.; Wallander, J. Kin Selection and Reciprocity in Flight Formation? Behav. Ecol. 2004, 15, 158–162. [Google Scholar]
  16. Higdon, J.; Corrsin, S. Induced drag of a bird flock. Am. Nat. 1978, 112, 727–744. [Google Scholar]
  17. Badgerow, J. An Analysis of Function in the Formation Flight of Canada Geese. Auk 1988, 93, 41–52. [Google Scholar]
  18. Gould, L.L.; Heppner, F. The vee formation of Canada Geese. Auk 1974, 91, 494–506. [Google Scholar]
  19. Heppner, F.; Convissar, J.; Moonan, D.E., Jr.; Anderson, J. Visual angle and formation flight in Canada geese (Branta canadensis). Auk 1985, 102, 195–198. [Google Scholar] [CrossRef]
  20. Biewener, A.A. Biomechanics of Avian Flight. Curr. Biol. 2022, 32, R1110–R1114. [Google Scholar] [CrossRef]
  21. Rayner, J. A vortex theory of animal flight. Part 2. The forward flight of birds. J. Fluid. Mech. 1979, 91, 731–763. [Google Scholar] [CrossRef]
  22. Magnan, A.; Perrilliat-Botonet, C.; Girerd, H. Essais d’enregistrements cinématographiques simultanées dans trois directions perpendiculaires deux à deux de l’écoulement de l’air autour d’un oiseau en vol. C. R. Acad. Sci. Paris 1938, 206, 462–464. [Google Scholar]
  23. Chizhikova, S.; Mendez, L.X.; Hedrick, T.L. Behavior and Biomechanics: Flapping Frequency during Tandem and Solo Flights of Cliff Swallows. J. Exp. Biol. 2025, 228, jeb249393. [Google Scholar] [CrossRef]
  24. Spedding, G.R.; Rosén, M.; Hedenström, A. A family of vortex wakes generated by a thrush nightingale in free flight in a wind tunnel over its entire natural range of flight speeds. J. Exp. Biol. 2003, 206, 2313–2344. [Google Scholar] [CrossRef]
  25. Nafi, A.S.; Ben-Gida, H.; Guglielmo, C.G.; Gurka, R. Aerodynamic forces acting on birds during flight: A comparative study of a shorebird, songbird, and a strigiform. Exp. Therm. Fluid Sci. 2020, 113, 110018. [Google Scholar] [CrossRef]
  26. Michael, D. Animal locomotion: A new spin on bat flight. Curr. Biol. 2008, 18, 468–470. [Google Scholar]
  27. Maeng, J.S.; Park, J.H.; Min Jang, S.; Han, S.Y. A modeling approach to energy savings of flying Canada Geese using computational fluid dynamics. J. Theor. Biol. 2013, 320, 76–85. [Google Scholar] [PubMed]
  28. Song, J.; Tobalske, B.W.; Powers, D.R.; Hedrick, T.L.; Luo, H. Three-dimensional simulation for fast forward flight of a calliope hummingbird. R. Soc. Open Sci. 2016, 3, 160230. [Google Scholar]
  29. Beaumont, F.; Murer, S.; Bogard, F.; Polidori, G. Aerodynamic Interaction of Migratory Birds in Gliding Flight. Fluids 2023, 8, 50. [Google Scholar] [CrossRef]
  30. Liu, T.; Kuykendoll, K.; Rhew, R.D.; Jones, S. Avian Wings. In Proceedings of the 24th AIAA Aerodynamic Measurement Technology and Ground Testing Conference, Portland, OR, USA, 28 June–1 July 2004; AIAA Paper: Reston, VA, USA, 2004; pp. 2004–2186. [Google Scholar]
  31. Dimitriadis, G.; Gardiner, J.D.; Tickle, P.G.; Codd, J.; Nudds, R.L. Experimental and Numerical Study of the Flight of Geese. Aeronaut. J. 2015, 119, 803–832. [Google Scholar] [CrossRef]
  32. Mirzaeinia, A.; Heppner, F.; Hassanalian, M. An Analytical Study on Leader and Follower Switching in V-Shaped Canada Goose Flocks for Energy Management Purposes. Swarm Intell. 2020, 14, 117–141. [Google Scholar] [CrossRef]
  33. Withers, P.C. An Aerodynamic Analysis of Bird Wings as Fixed Aerofoils. J. Exp. Biol. 1981, 90, 143–162. [Google Scholar] [CrossRef]
  34. Blocken, B. Computational Fluid Dynamics for Urban Physics: Importance, Scales, Possibilities, Limitations, and Ten Tips and Tricks Towards Accurate and Reliable Simulations. Build. Environ. 2015, 91, 219–245. [Google Scholar] [CrossRef]
  35. Tucker, V.A.; Schmidt-Koenig, K. Flight speeds of birds in relation to energetics and wind directions. Auk 1971, 88, 97–107. [Google Scholar] [CrossRef]
  36. Fergus, C. Canada Goose. In Wildlife Notes-20, LDR0103; Pennsylvania Game Commission: Harrisburg, PA, USA, 2010. [Google Scholar]
  37. Funk, G.D.; Milsom, W.K.; Steeves, J.D. Coordination of Wingbeat and Respiration in the Canada Goose. I. Passive Wing Flapping. J. Appl. Physiol. 1985, 73, 1014–1024. [Google Scholar] [CrossRef]
  38. Beaumont, F.; Murer, S.; Bogard, F.; Polidori, G. Aerodynamics of a Flapping Wing as a Function of Altitude: New Insights into the Flight Strategy of Migratory Birds. Phys. Fluids 2021, 33, 127118. [Google Scholar] [CrossRef]
  39. Su, J.-Y.; Tang, J.-H.; Wang, C.-H.; Yang, J.-T. A Numerical Investigation on the Ground Effect of a Flapping-Flying Bird. Phys. Fluids 2013, 25, 093101. [Google Scholar] [CrossRef]
  40. Menter, F.R. Zonal two-equation k-ω turbulence model for aerodynamic flows. In Proceedings of the 23rd Fluid Dynamics, Plasmadynamics, and Lasers Conference, Orlando, FL, USA, 6–9 July 1993; AIAA Paper: Reston, VA, USA, 1993; pp. 1993–2906. [Google Scholar]
  41. Liu, T.; Wang, S.; Liu, H.; He, G. Engineering Perspective on Bird Flight: Scaling, Geometry, Kinematics and Aerodynamics. Prog. Aerosp. Sci. 2023, 142, 100933. [Google Scholar] [CrossRef]
  42. Beaumont, F.; Murer, S.; Bogard, F.; Polidori, G. Aerodynamic Mechanisms behind Energy Efficiency in Migratory Bird Formations. Phys. Fluids 2025, 37, 025202. [Google Scholar] [CrossRef]
  43. Tobalske, B.W. Aerodynamics of Avian Flight. Curr. Biol. 2022, 32, R1105–R1109. [Google Scholar] [CrossRef]
  44. Usherwood, J.R.; Hedrick, T.L.; Biewener, A.A. The aerodynamics of avian take-off from direct pressure measurements in Canada geese (Branta canadensis). J. Exp. Biol. 2003, 206, 4051–4066. [Google Scholar] [CrossRef]
  45. Green, S.I. Wing Tip Vortices. In Fluid Vortices; Kluwer Academic Publishers: Dordrecht, The Netherlands, 1995; pp. 1–40. [Google Scholar]
  46. Voelkl, B.; Portugal, S.J.; Unsöld, M.; Usherwood, J.R.; Wilson, A.M.; Fritz, J. Matching Times of Leading and Following Suggest Cooperation through Direct Reciprocity during V-Formation Flight in Ibis. Proc. Natl. Acad. Sci. USA 2015, 112, 2115–2120. [Google Scholar] [CrossRef] [PubMed]
  47. Muijres, F.T.; Johansson, L.C.; Winter, Y.; Hedenström, A. Comparative aerodynamic performance of flapping flight in two bat species using time-resolved wake visualization. J. R. Soc. Interface 2011, 8, 1418–1428. [Google Scholar] [CrossRef] [PubMed]
  48. Hubel, T.Y.; Hristov, N.I.; Swartz, S.M.; Breuer, K.S. Changes in kinematics and aerodynamics over a range of speeds in Tadarida brasiliensis, the Brazilian free-tailed bat. J. R. Soc. Interface 2012, 9, 1120–1130. [Google Scholar] [CrossRef] [PubMed]
  49. Hedenström, A.; Muijres, F.; von Busse, R.; Johansson, L.; Winter, Y.; Spedding, G. High-speed stereo DPIV measurement of wakes of two bat species flying freely in a wind tunnel. Exp. Fluids 2009, 46, 923–932. [Google Scholar] [CrossRef]
  50. Hubel, T.Y.; Riskin, D.K.; Swartz, S.M.; Breuer, K.S. Wake structure and wing kinematics: The flight of the Lesser Dog-faced Fruit Bat, Cynopterus brachyotis. J. Exp. Biol. 2010, 213, 3427–3440. [Google Scholar] [CrossRef]
  51. Thielicke, W.; Stamhuis, E. The influence of wing morphology on the three-dimensional flow patterns of a flapping wing at bird scale. J. Fluid Mech. 2015, 768, 240–260. [Google Scholar] [CrossRef]
  52. Portugal, S.J.; Hubel, T.Y.; Fritz, J.; Heese, S.; Trobe, D.; Voelkl, B.; Hailes, S.; Wilson, A.M.; Usherwood, J.R. Upwash exploitation and downwash avoidance by flap phasing in Ibis formation flight. Nature 2014, 505, 399–402. [Google Scholar] [CrossRef]
Figure 1. The distinctive V-formation that is commonly observed in bird flight (copyright-free picture by Kranich17 via Pixabay).
Birds 06 00015 g001
Figure 2. The longitudinal position of the leading bird relative to the trailing bird ranges from 1.73 m to 5.21 m. (a) The wing motion is characterized by three primary rigid-body rotation movements: flapping and pitching, combined with a backward movement. Dedicated subroutines are employed to implement the wing flapping frequency, the amplitude, and the rotational dynamics associated with these motions (b).
Birds 06 00015 g002
Figure 3. Distribution of the dimensionless pressure coefficients on the flying bird for three moments of a typical wing flapping cycle.
Birds 06 00015 g003
Figure 4. Streamlines displayed in five (y-z) vertical planes located in the wake of the bird (x = 1.73 m, 2.60 m, 3.47 m, 4.34 m, and 5.21 m) at a given time during the downstroke phase, the upstroke phase, and at the mid-upstroke.
Birds 06 00015 g004
Figure 5. Vertical velocity of the flow plotted along a stream-wise horizontal axis X at x = 1.73 m, 3.47 m, and 5.21 m, with y = 0 and −1.5 ≤ z (m) ≤ 1.5, for moments corresponding to the downstroke phase, upstroke phase, and mid-downstroke (a); x being the longitudinal distance from the bird, z the lateral distance from the bird, and y the vertical distance (b).
Birds 06 00015 g005
Figure 6. (a) Variation in the trailing bird’s average drag and lift relative to its longitudinal distance from the leading bird. Comparison of the lift-to-drag (L/D) ratio between a solitary bird and the trailing bird at various longitudinal distances from the leading bird. (b) Comparison of the lift-to-drag (L/D) ratio between a solitary bird and the trailing bird at a longitudinal distance of 3.47 m from the leading bird (expressed in percentage of one full flapping cycle).
Birds 06 00015 g006
Figure 7. Required aerodynamic power to overcome the drag force as a function of the longitudinal distance between the leading and trailing birds during a 0.25 s flapping cycle.
Birds 06 00015 g007
Figure 8. Visualization of the coherent vortical structures in the flow based on the Q-criterion method (Q = 5 × 10⁻⁴). Vortical structures of the two birds flying at a distance of 3.47 m during a typical flapping cycle (wingbeat frequency of 4 Hz).
Birds 06 00015 g008
Figure 9. Visualization of the coherent vortical structures in the flow based on the Q-criterion method (Q = 5 × 10⁻⁴). Vortical structures of the two birds flying at a distance of 3.47 m are colored based on the x-vorticity (blue: +ωx iso; red: −ωx iso).
Birds 06 00015 g009
Table 1. Primary computational fluid dynamics (CFD) settings and geometric features of a Canada Goose [30,31], with numerical simulations conducted under the assumption of flight at an altitude of 1000 m [36].
VariableDescriptionValue
Chord length (c)Distance between the front and rear edges of the wing0.3 m
Wing sizeTotal length of one wing0.72 m
Flight speed ( U )Average airspeed during flight13.9 m/s
WingspanDistance from wingtip to wingtip1.66 m
Flapping amplitude (k)Maximum vertical movement of the wingtip69 cm
Wingbeat frequency (f)Number of wingbeats per second4 Hz
Wavelength (λ)Distance covered in one wingbeat 3.475 m
Disclaimer/Publisher’s Note: The statements, opinions and data contained in all publications are solely those of the individual author(s) and contributor(s) and not of MDPI and/or the editor(s). MDPI and/or the editor(s) disclaim responsibility for any injury to people or property resulting from any ideas, methods, instructions or products referred to in the content.

