Article

In Vitro Drug Delivery through the Blood–Brain Barrier Using Cold Atmospheric Plasma

1
Graduate School of Medical Photonics, Shizuoka University, Hamamatsu 432-8561, Japan
2
Graduate School of Science and Technology, Shizuoka University, Hamamatsu 432-8561, Japan
3
Organization for Innovative and Social Collaboration, Shizuoka University, Hamamatsu 432-8561, Japan
4
Graduate School of Integrated Science and Technology, Shizuoka University, Hamamatsu 432-8561, Japan
*
Authors to whom correspondence should be addressed.
Macromol 2024, 4(3), 597-609; https://doi.org/10.3390/macromol4030036
Submission received: 4 July 2024 / Revised: 15 August 2024 / Accepted: 29 August 2024 / Published: 2 September 2024

Abstract

:
This study explores the potential of cold atmospheric plasma (CAP) to facilitate the delivery of large-molecule drugs to the brain. The blood–brain barrier (BBB) restricts the passage of most drugs, hindering treatment for neurological disorders. CAP generates reactive oxygen and nitrogen species (RONS) that may disrupt the BBB’s tight junctions, potentially increasing drug permeability. An in vitro BBB model and an immortalized cell line (bEND.3) were used in this experiment. Fluorescein isothiocyanate dextran (FD-4), a model drug, was added to the cells to determine drug permeability. Custom microplasma was used to produce reactive oxygen species (ROS). Trans-endothelial electrical resistance (TEER) measurements assessed the integrity of the BBB after the CAP treatment. A decrease in TEER was observed in the CAP-treated group compared to the controls, suggesting increased permeability. Additionally, fluorescence intensity measurements from the basal side of the trans-well plate indicated higher drug passage in the CAP-treated group. Moreover, the higher presence of ROS in the plasma-treated cells confirmed the potential of CAP in drug delivery. These findings suggest that CAP may be a promising approach for enhancing brain drug delivery.

Graphical Abstract

1. Introduction

The blood–brain barrier (BBB) is a critical defense mechanism in the brain that restricts the entry of most drugs [1,2]. It consists of endothelial cells, pericytes, and astrocytes, with the endothelial cells forming a continuous layer that is connected by tight junctions, adherent junctions, and gap junctions [3]. Among these, tight junctions play a crucial role in maintaining the barrier’s resistance and regulating the passage of substances [4,5,6]. The primary function of the BBB is to maintain the brain’s internal environment by controlling what can enter or exit, thereby protecting it from harmful agents [7].
Researchers have explored various methods like focused ultrasound, nanoparticles, peptites based drug delivery, and so on, to overcome this hurdle. Focused ultrasound (FUS), a non-invasive technique using high-frequency sound waves, disrupts tight junctions in the BBB [8,9,10]. However, FUS therapy can overheat the scalp and skull, causing discomfort, tissue damage, and reduced treatment effectiveness. This overheating may also contribute to calvaria marrow injuries. Excessive FUS or microbubbles can induce apoptosis and brain hemorrhage [11,12].
Nanoparticles, microscopic drug carriers, are designed to target BBB receptors, although may cause unintended side effects and off-target delivery [13,14,15]. These tiny particles must be carefully engineered to avoid inducing toxic or immune responses. Once administered, nanoparticles must remain stable in the bloodstream while navigating the complex biological environment of the body. Their tendency to accumulate in organs such as the liver and spleen can lead to long-term toxicity [16,17]. Peptide sequences mimicking natural BBB ligands offer promising drug delivery in the brain but lack controllability and scalability [18,19,20]. Peptides are quickly broken down by enzymes in the body, limiting their availability at target sites, and often struggle to cross cell membranes, especially in the brain. Furthermore, peptides can trigger immune responses, leading to side effects and reduced drug effectiveness [21,22].
These approaches, though innovative, highlight the need for a more refined strategy for BBB disruption. Ideally, the drug delivery method should be non-invasive to minimize brain tissue damage, targeted for specific (central nervous system) CNS delivery, controllable for precise disruption duration, and safe to avoid cell death.
Recently, cold atmospheric plasma (CAP) has gained significant attention in the field of medical science. Microplasma has a wide range of applications in biology, including surface modification and sterilization of skin, surface modification of inorganic materials, and water and harmful gas treatment [23,24,25,26]. It has various applications, including wound treatment, drug delivery [27,28], and even cancer therapy [29]. CAP generates reactive oxygen and nitrogen species (RONS) like superoxide radicals, proximities anions, and nitric oxide (NO) radicals [30]. The RONS, especially NO, disrupt the cell membrane and tight junctions of the BBB, as well as other intercellular junctions like adherents junctions [31].
In our research, we utilized CAP to generate RONS, which facilitate the passage of drugs across the BBB, thereby improving drug delivery to the brain and enhancing the effectiveness of medical treatments of brain disease.

2. Materials and Methods

2.1. Materials

A BBB kit (RBT-24H) and immortalized brain endothelial cells (bEnd.3[BEND3] (ATCC®CRL-2299™) were purchased from PharmaCoCell Company Ltd., Nagasaki, Japan and American Type Culture Collection, Manassas, VA, USA, respectively. Dulbecco’s Modified Eagle Medium (DMEM) and phosphate buffered saline (PBS) were purchased from Shimadzu Diagnostics Corporation (Tokyo, Japan). L-glutamine, penicillin–streptomycin, 0.25 w/v% Trypsin-1 mM EDTA.4Na solution (with phenol red), NaHCO3, and insulin (human recombinant) were purchased from FUJIFILM Wako Pure Chemical Corporation (Osaka, Japan). Fetal bovine serum (FBS) of Australian origin (triple 0.1 µm sterile filtered) was acquired from Serana Europe GmbH (Pessin, Germany). A trans-well plate with hanging insert or the upper compartment of trans-well plate (pore size 4 μm, HD, and PET membrane) was purchased from Corning(Falcon). A millicell ERS-2 volt–ohm meter was purchased from Merck Millipore, Darmstadt, Germany. Dojindo’s ROS Assay Kit-Highly Sensitive DCFH-DA was purchased from DOJINDO LABORATORIES (https://www.dojindo.co.jp, accessed on 1 July 2024), Japan. Fluorescein isothiocyanate dextran (FD-4) was purchased from (TdB Labs, Upsala, Sweden). Microplate reader (Spectra Fluor Plus, Tecan, Männedorf, Switzerland). Keyence Florescence Microscope All-in-one BZ-x800 was purchased from Keyence Corporation, Osaka, Japan. A cell counter (Countess) was purchased from ThermoFisher Scientific, Waltham, MA, USA), and an Attune NxT Flow Cytometer was purchased from ThermoFisher Scientific, USA).

2.2. Cell Culture: BBB Kit and bEND.3

A commercially available in vitro BBB model (BBB kit, RBT-24H) was used in this study. This kit comprises co-cultured primary Wistar rat brain microvascular endothelial cells (BMECs), astrocytes, and pericytes on trans-well membranes. The BBB kit was cultured on 24-well trans-well plates using DMEM medium at 37 °C with 5% CO2. The medium was changed every two days to maintain optimal cell viability.
Immortalized brain endothelial cells (bEnd.3[BEND3] (ATCC®CRL-2299™) were also used in this study. These cells were cultured in a growth medium consisting of DMEM supplemented with 10% FBS, 1% penicillin/streptomycin, 1% 200 mM L-glutamine, 1.6 g/L NaHCO3, and 4 µg/mL insulin. The cells were grown in standard T75 culture flasks under controlled environmental conditions. These conditions included a humidified atmosphere with 5% carbon dioxide (CO2), 90% humidity, and a constant temperature of 37 °C. To ensure optimal growth, the culture medium was replaced every two days. For experiments requiring a confluent cell monolayer, the bEnd.3 cells were seeded onto the membrane of the upper compartment of the trans-well plates at a density of 2 × 10⁶ cells per well. The culture medium for these cells was then replaced twice a week to maintain viability.
Trans-endothelial electrical resistance (TEER) measurements were performed daily to monitor the growth and integrity of the BBB model. TEER reflects the electrical resistance across the endothelial cell layer, with higher values indicating a stronger and tighter barrier [32,33,34]. An EVOM voltohmmeter (Millicell ERS-2) (Sarasota, FL, USA) was used for the TEER measurements. Electrodes were placed on the upper and basolateral (bottom) compartments of the trans-well plate. TEER values were calculated using the following formula:
TEER (Ω⋅cm2) = (Total R − Blank R) × Growth area of the cells on the upper compartment of trans-well plate [35].
where the following meanings apply:
Total R: measured resistance of the cell culture on the upper compartment;
Blank R: resistance of the medium in the trans-well plate (control);
Growth area of the cells: 0.33 cm2 for 24-trans-well plate and 4.67 cm2 for 6-trans-well plate.
A TEER value of ≥150 Ω⋅cm2 was considered for confluent and functional cells with tight intercellular junctions for both the BBB and bEND.3 cell culture monolayer, respectively.

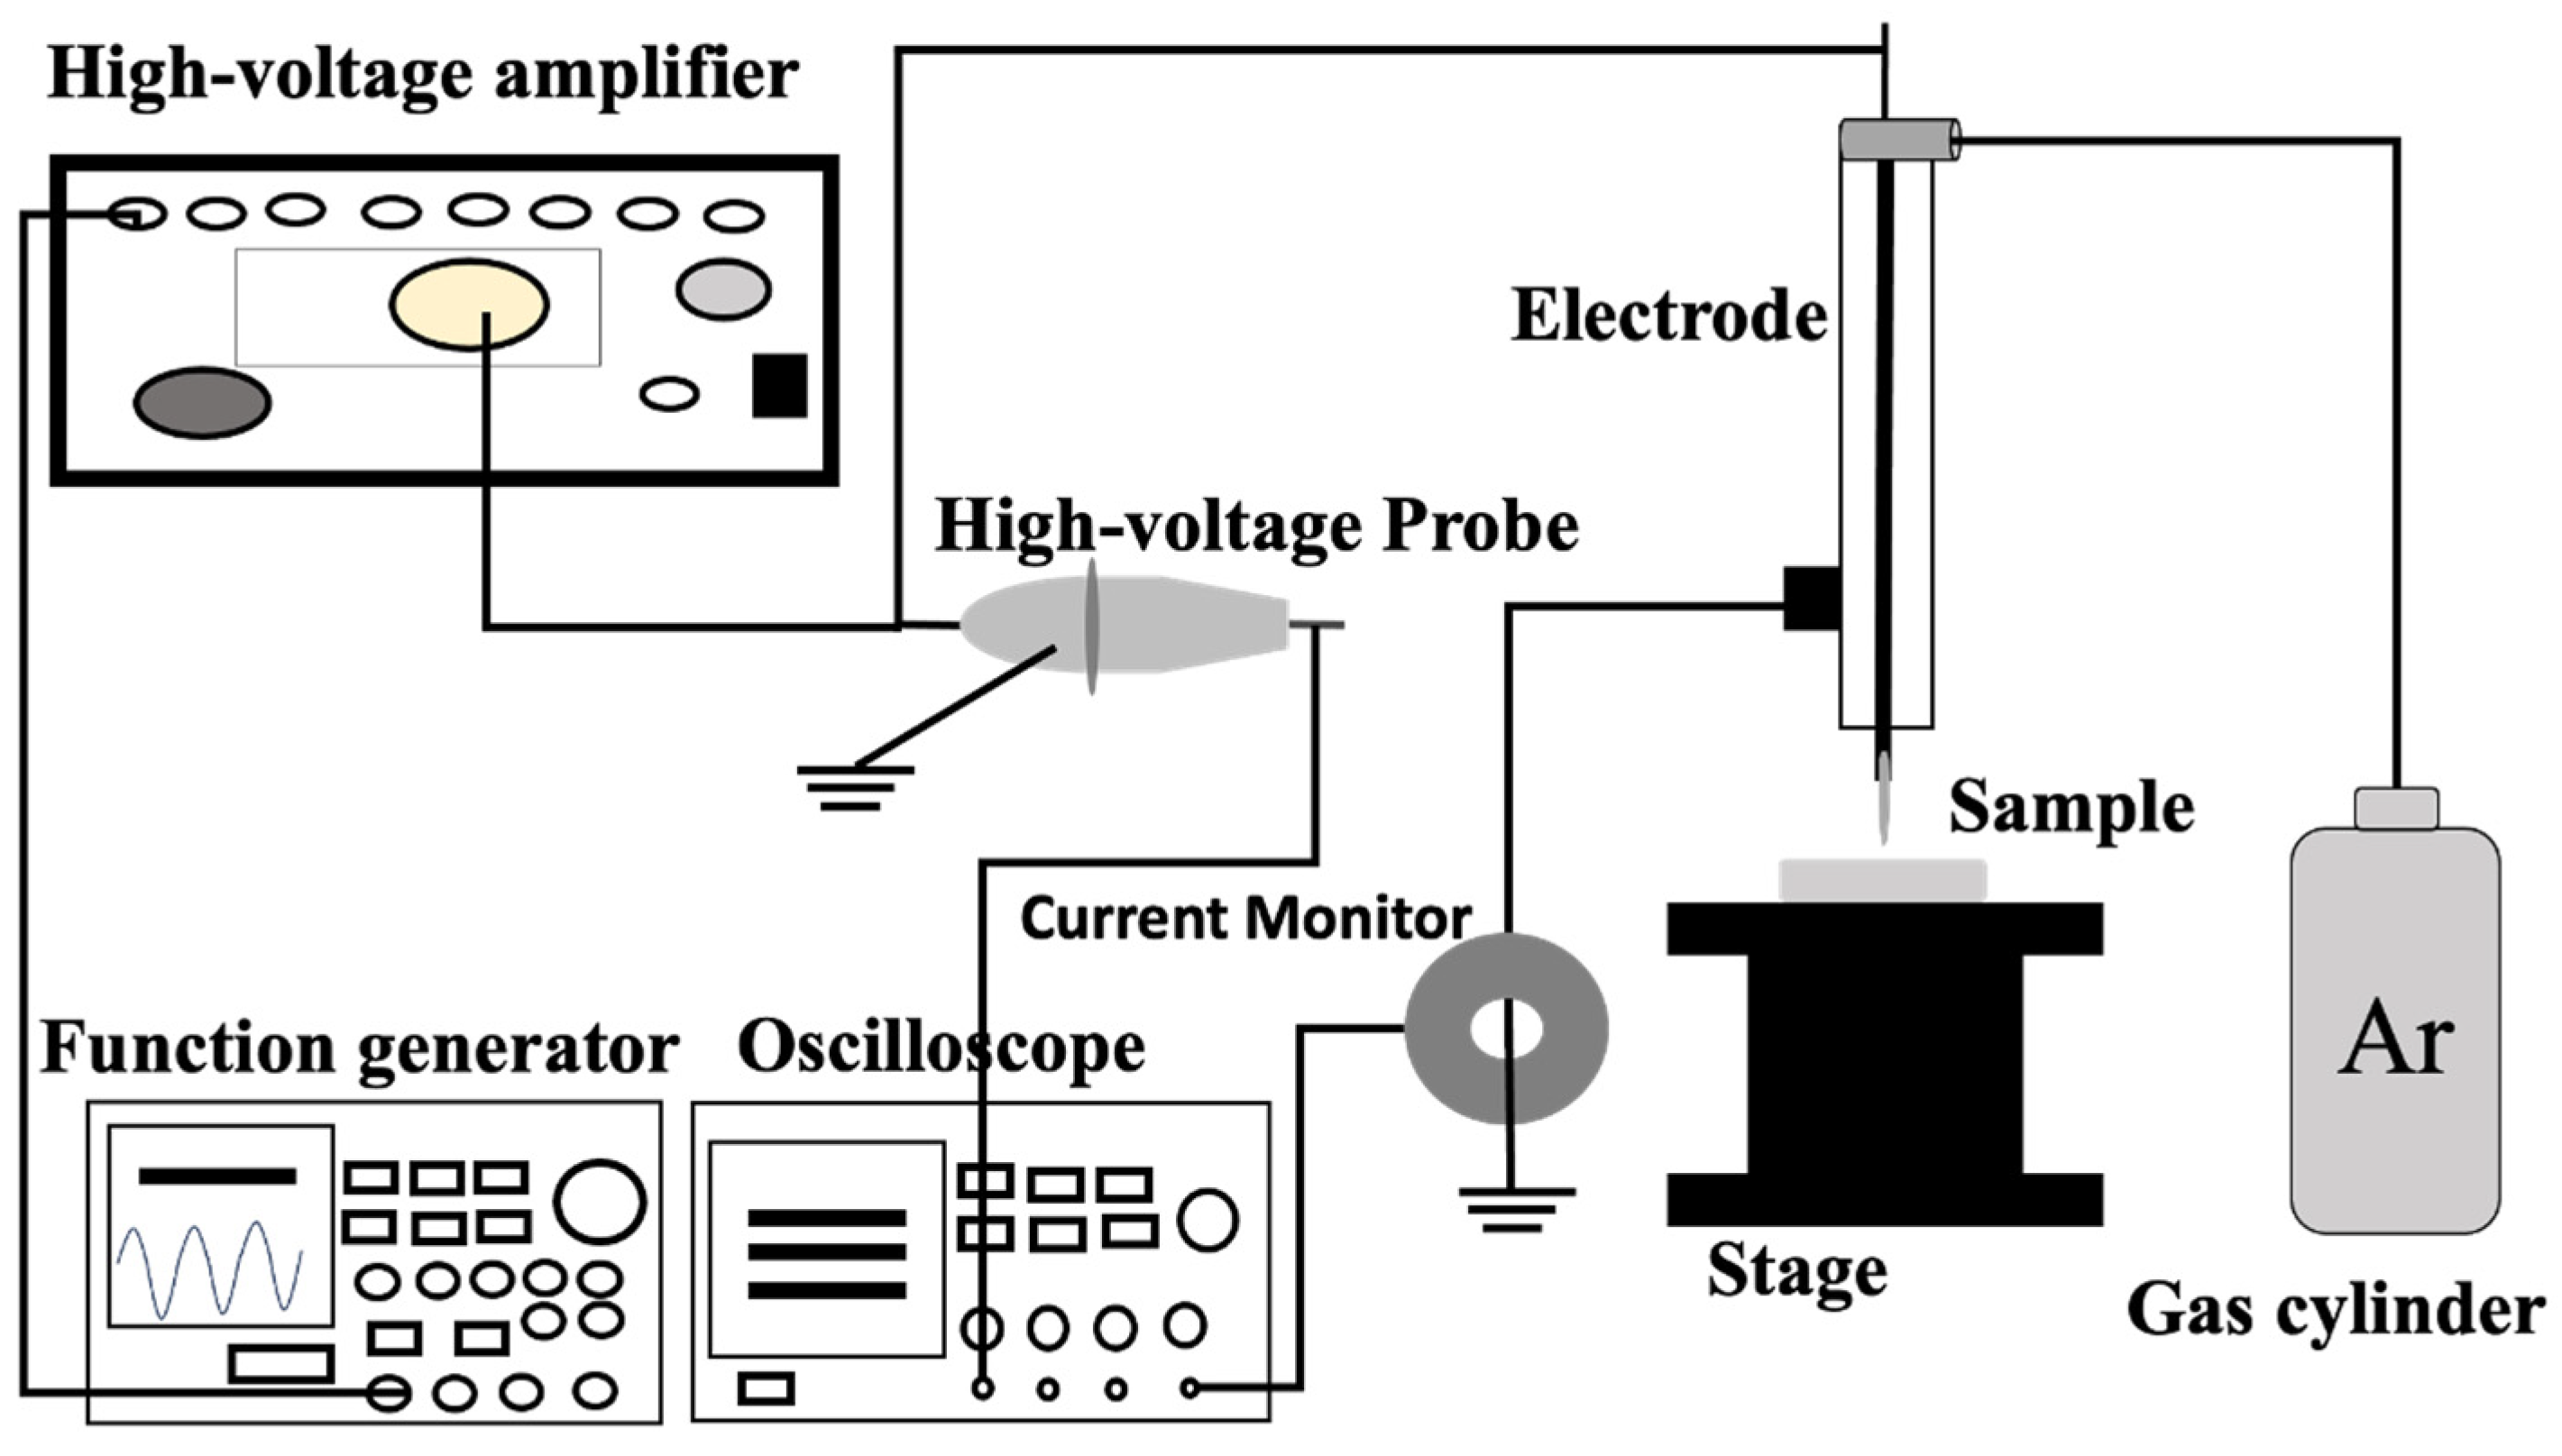
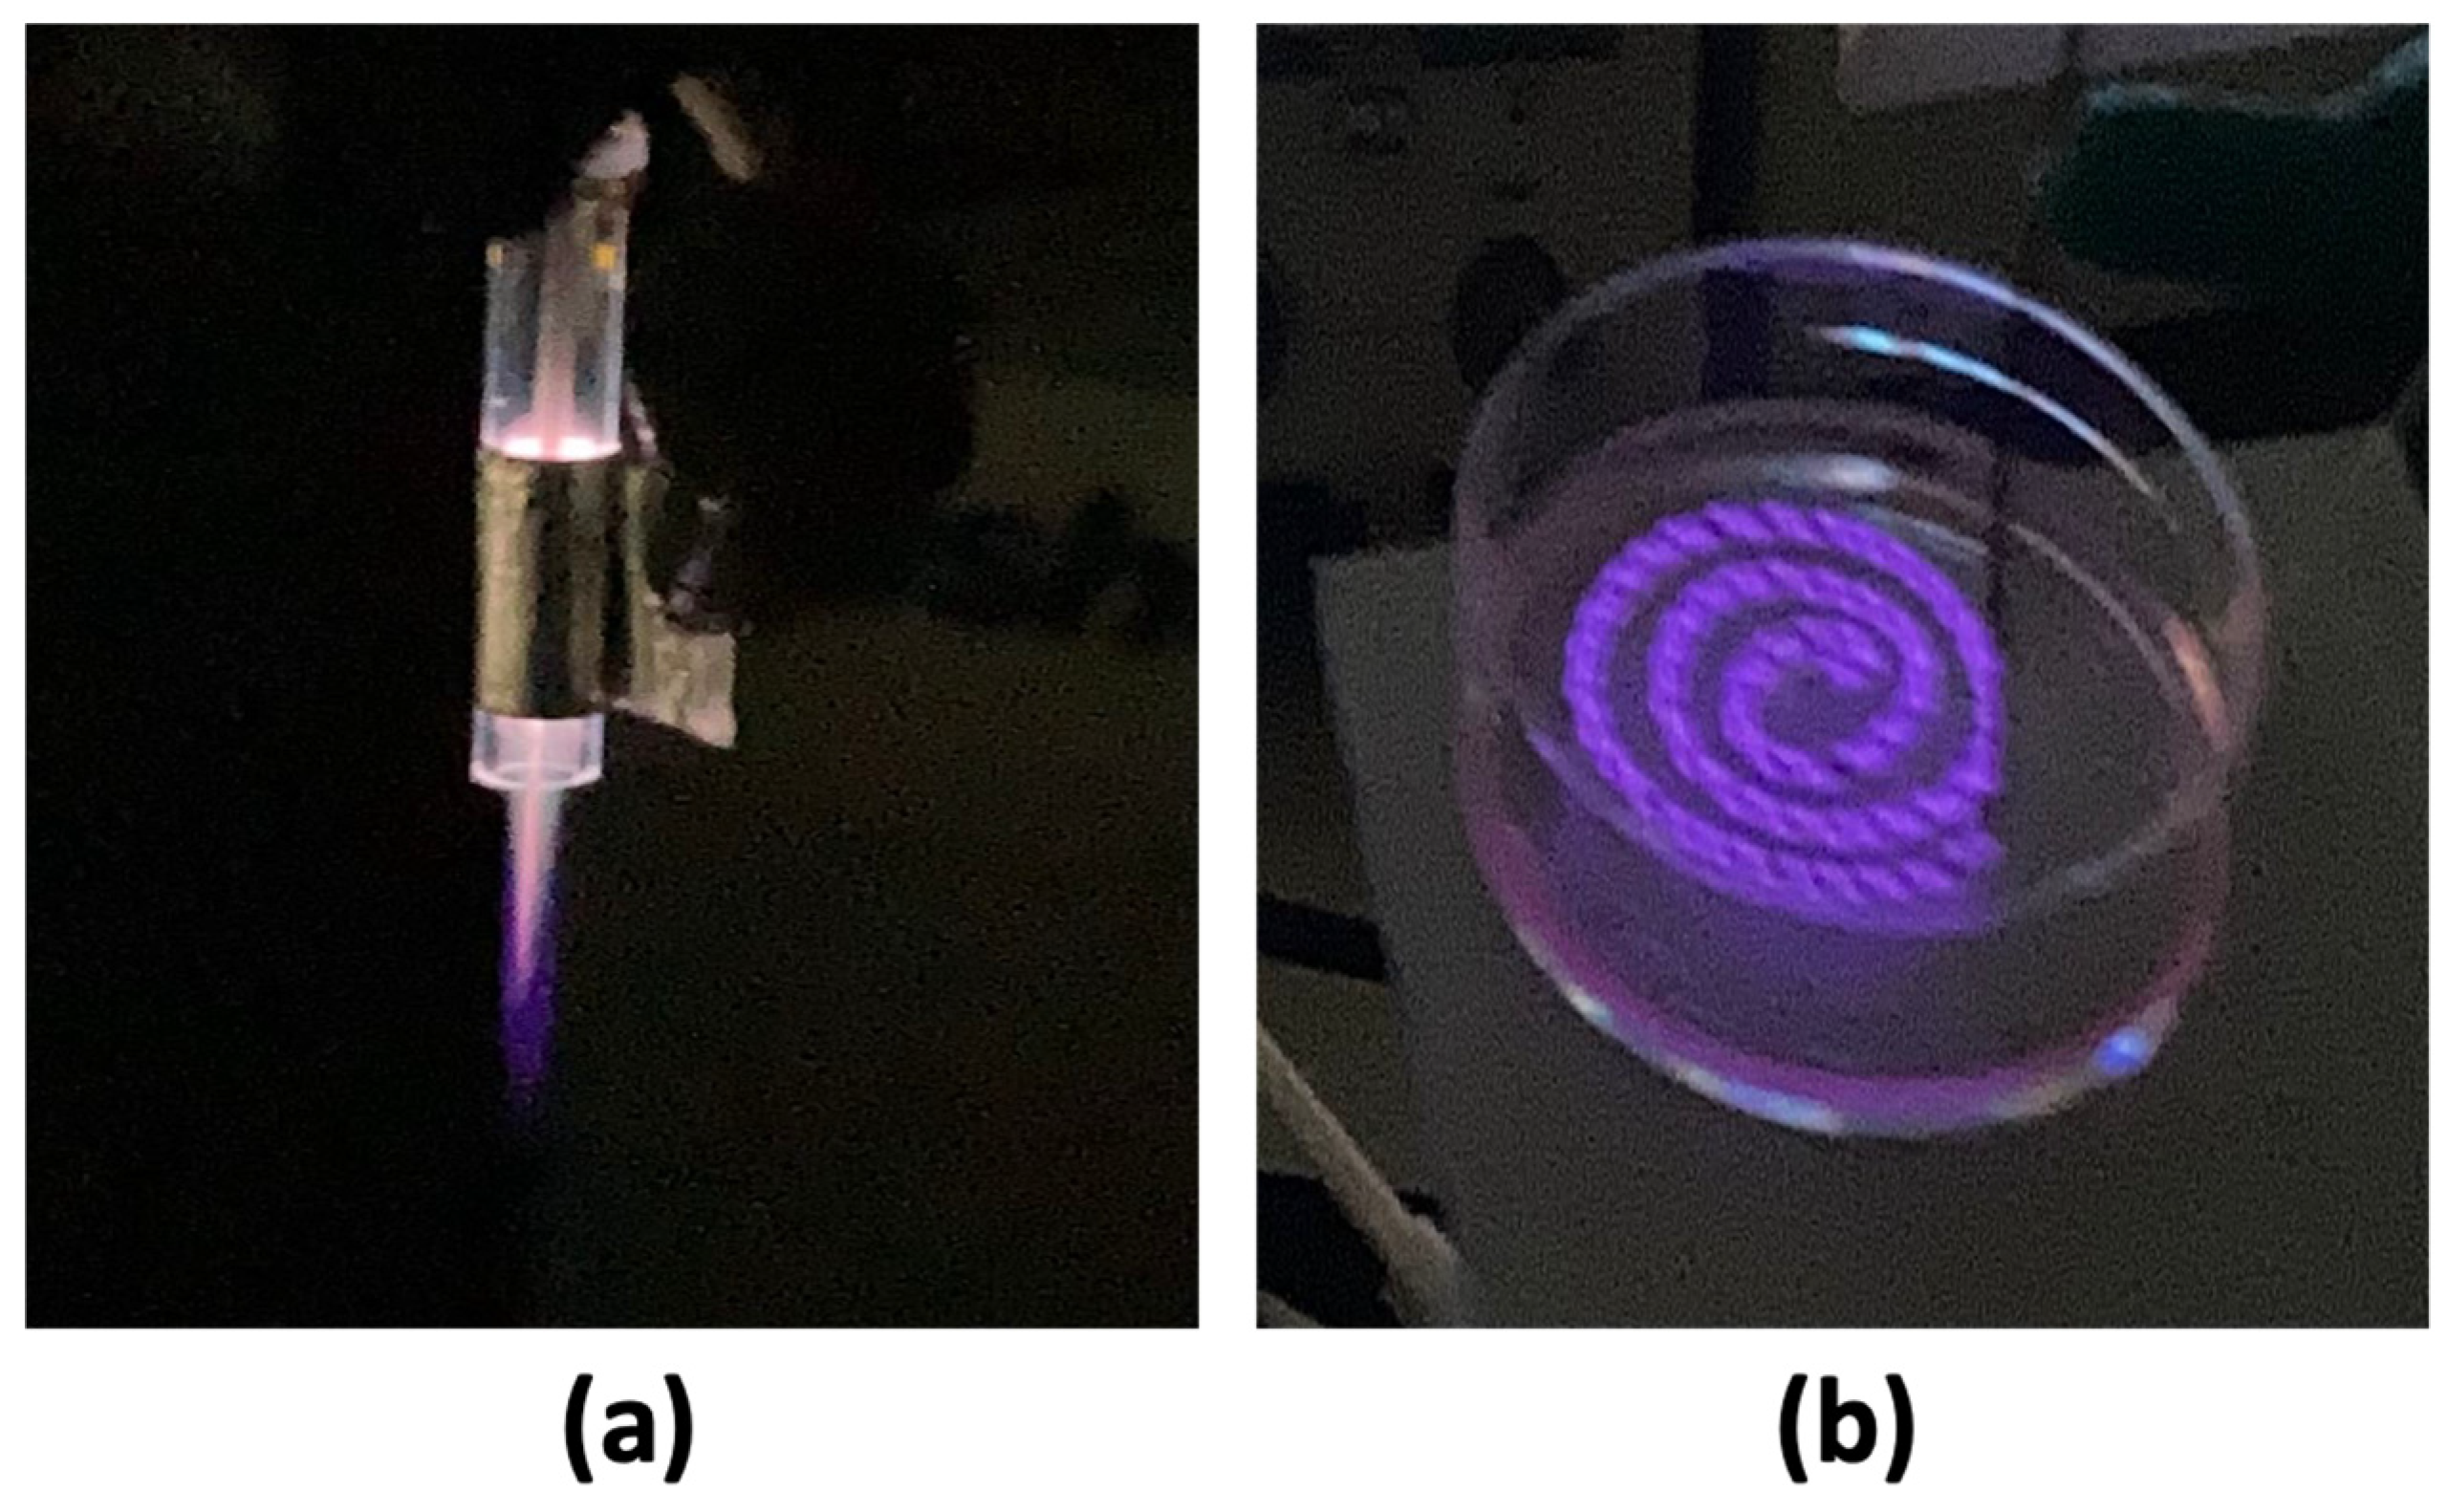
2.3. Plasma Set-Up: Plasma Jet and DBD Plasma

Two types of plasma-generating methods were utilized in this study: a plasma jet for the BBB cells, and Dielectric Barrier Discharge (DBD) plasma for the bEND.3 cells.
The BBB cell model was a ready-made culture in a 24-trans-well plate, and due to the small growth area in the upper compartment of the 24-well plate, the plasma jet was suitable to accommodate the plasma discharge.
The plasma discharge was generated from a function generator (model AFG3102, Tektronix). This discharge was amplified using a high-voltage amplifier (model 5/80, Trek). A high-voltage probe (model P6105A, Tektronix) connected to an oscilloscope (model TDS 2014B, Tektronix) was used to measure the discharge voltage. A Pearson current monitor, also connected to the oscilloscope, was used to measure the discharge current. The plasma jet [36] was designed using argon gas with a purity of 99.99%. A flow meter (Yamato) controlled the flow rate at 3 L per min (Figure 1 and Figure 2a).
For the DBD plasma generation, the microplasma electrode was generated according to Sadiq et. al. [37], formed by winding the ground electrode around the high-voltage (HV) electrode, with consistent spacing of 0.4 mm between each turn. A 2 mm distance was maintained between the surface of the microplasma electrode and bEND.3 cell culture during plasma discharge (Figure 1 and Figure 2b).

2.4. Plasma Conditions and Treatment

Once the TEER reached 150 Ω⋅cm2, indicating a confluence for both the BBB and bEND.3 cell culture, 3 μg/mL FD-4 with a molecular weight of 4.4 kDa was added to the upper compartment of the trans-well plate.
After the TEER confirmation and FD-4 addition, plasma irradiation was applied using a custom-built plasma jet with argon (Ar) gas flowing at a rate of 3 L/min The discharge voltage and frequency of the plasma jet for the BBB model were set to 2.2 kV0-p, 3 kV0-p, and 10 kHz, respectively. The plasma irradiation treatment was continued for 2 min, and a distance of 20 mm was maintained between the plasma discharge and the cell culture monolayer.
For the bEND.3 cell culture, spiral microplasma was applied with 5 kHz frequency using a sine wave, with 2 kVp-p, 3 kVp-p, and 4 kVp-p, respectively. The distance between the plasma discharge and the cell culture was 2 mm and the irradiation was continued for 2 min. In the DBD plasma generation, no gas flow was provided. Plasma was generated only based on atmospheric air.

2.5. Fluorescence Intensity Measurement

Following the plasma irradiation, the culture plate of both the BBB cells and bEND.3 cells were incubated for 1 h at 37 °C with 5% CO2. Then, fluorescence intensity was measured using a microplate reader from the basolateral part of the trans-well plates. The drug’s excitation maximum is 493 nm, and its emission maximum is 518 nm. The experiments were conducted independently at three different times. During each experiment, the samples were tested in triplicate to confirm the reproducibility of the results.

2.6. TEER Measurement

After plasma treatment and 1 h incubation at 37 °C with 5% CO2, the TEER was measured again, as mentioned in Section 2.2. Triplicate experiments for each sample were conducted to ensure reproducibility.

2.7. ROS Measurement

The reactive oxygen species (ROS) was measured using the ROS Assay Kit-Highly Sensitive DCFH-DA. When DCFH-DA is taken into the cell, it is deacetylated by esterase and transformed into DCFH. When the DCFH is promptly oxidized by ROS, it changes to a fluorescent DCF. The measured wavelength was as follows: excitation 480 nm/emission 530 nm. The kit contains Highly Sensitive DCFH-DA Dye and Loading Buffer (10×). The Highly Sensitive DCFH-DA Dye was diluted (1:1000) in reconstituted Loading Buffer solution to prepare the working solution. The 10× Loading Buffer (1:10) was diluted with double-deionized water.
The bEND.3 cells were cultured in a Petri dish and incubated at 37 °C with 5% CO2. Upon confluency, the culture was washed with PBS (twice) and the medium was changed. Then, the dye was added to the culture plate and plasma irradiation was performed with the DBD microplasma. After 10 min of incubation, the culture plate was washed twice with PBS and the images were taken using a Keyence Florescence Microscope All-in-one BZ-x800. For the quantitative value of the florescence intensity of the ROS, the image of whole plate was taken in the microscope and then converted to a quantitative value using imageJ software (imageJ 1.54g version). Triplicate experiments for each sample were conducted to ensure reproducibility.

2.8. Cell Viability Measurement

This experiment utilizes a dye exclusion assay with trypan blue to assess the cell viability of bEND.3 cells. The principle relies on the integrity of the cell membrane. Healthy cells with intact membranes repel trypan blue, a negatively charged dye. Conversely, compromised membranes in dead or unhealthy cells allow trypan blue to enter and stain the cytoplasm blue.
The control and plasma-treated cell groups were stained with trypan blue for subsequent cell counting. This staining differentiates between live and dead cell numbers.
The confluent cells on the Petri dish were washed twice with PBS and the medium was changed. The cells were irradiated with the DBD microplasma and incubated for two different durations: 1 h and 24 h.
Following each treatment with plasma and incubation period, the cells were washed twice with PBS (phosphate-buffered saline) to remove any dead cells or debris that might be present. Trypsin, a protease enzyme, was then added to detach the cells from the culture surface. After a brief incubation, culture medium containing FBS was added to neutralize the trypsin’s effect and achieve a single-cell suspension.
An aliquot of 10 μL of the cell suspension was mixed with trypan blue in a 1:1 ratio. A diluted sample was then loaded onto a hemocytometer and counted using an automated cell counter. As trypan blue is toxic to cells that are incubated for more than 10 min [38], the experiment was carried out immediately after adding the trypan blue. This counter differentiates between live cells (unstained) and dead cells (stained blue).
For more confirmation, cell viability was also measured with propidium iodide using an Attune NxT Flow Cytometer (Thermo Fisher Scientific). Propidium iodide (PI) is a fluorescent dye that binds to DNA but cannot enter cells with intact plasma membranes. This property allows PI to distinguish between dead cells, where the membrane is compromised, and live cells with intact membranes. PI is excited by wavelengths of 400–600 nm and emits between 600–700 nm, making it suitable for use with standard flow cytometry equipment to quantify cell death [39,40].
After 1 h and 24 h of plasma treatment, the cells were trypsinized, transferred to a centrifuge tube, and washed with PBS. Next, 100 μL of 1× binding buffer and 5 μL of propidium iodide were added and gently mixed by pipetting. The samples were then incubated at room temperature for 15 min. Following incubation, an additional 400 μL of 1× binding buffer was added to each tube. Non-irradiated cells stained with propidium iodide and unstained cells were used as controls. Triplicate experiments for each sample were conducted to ensure reproducibility.

2.9. Statistical Analysis

Group data are reported as mean ± SD, and comparisons between two groups were made using Student’s unpaired two-tailed t-test. A p value of <0.05 was considered statistically significant, with analyses performed in Microsoft Excel.

3. Results

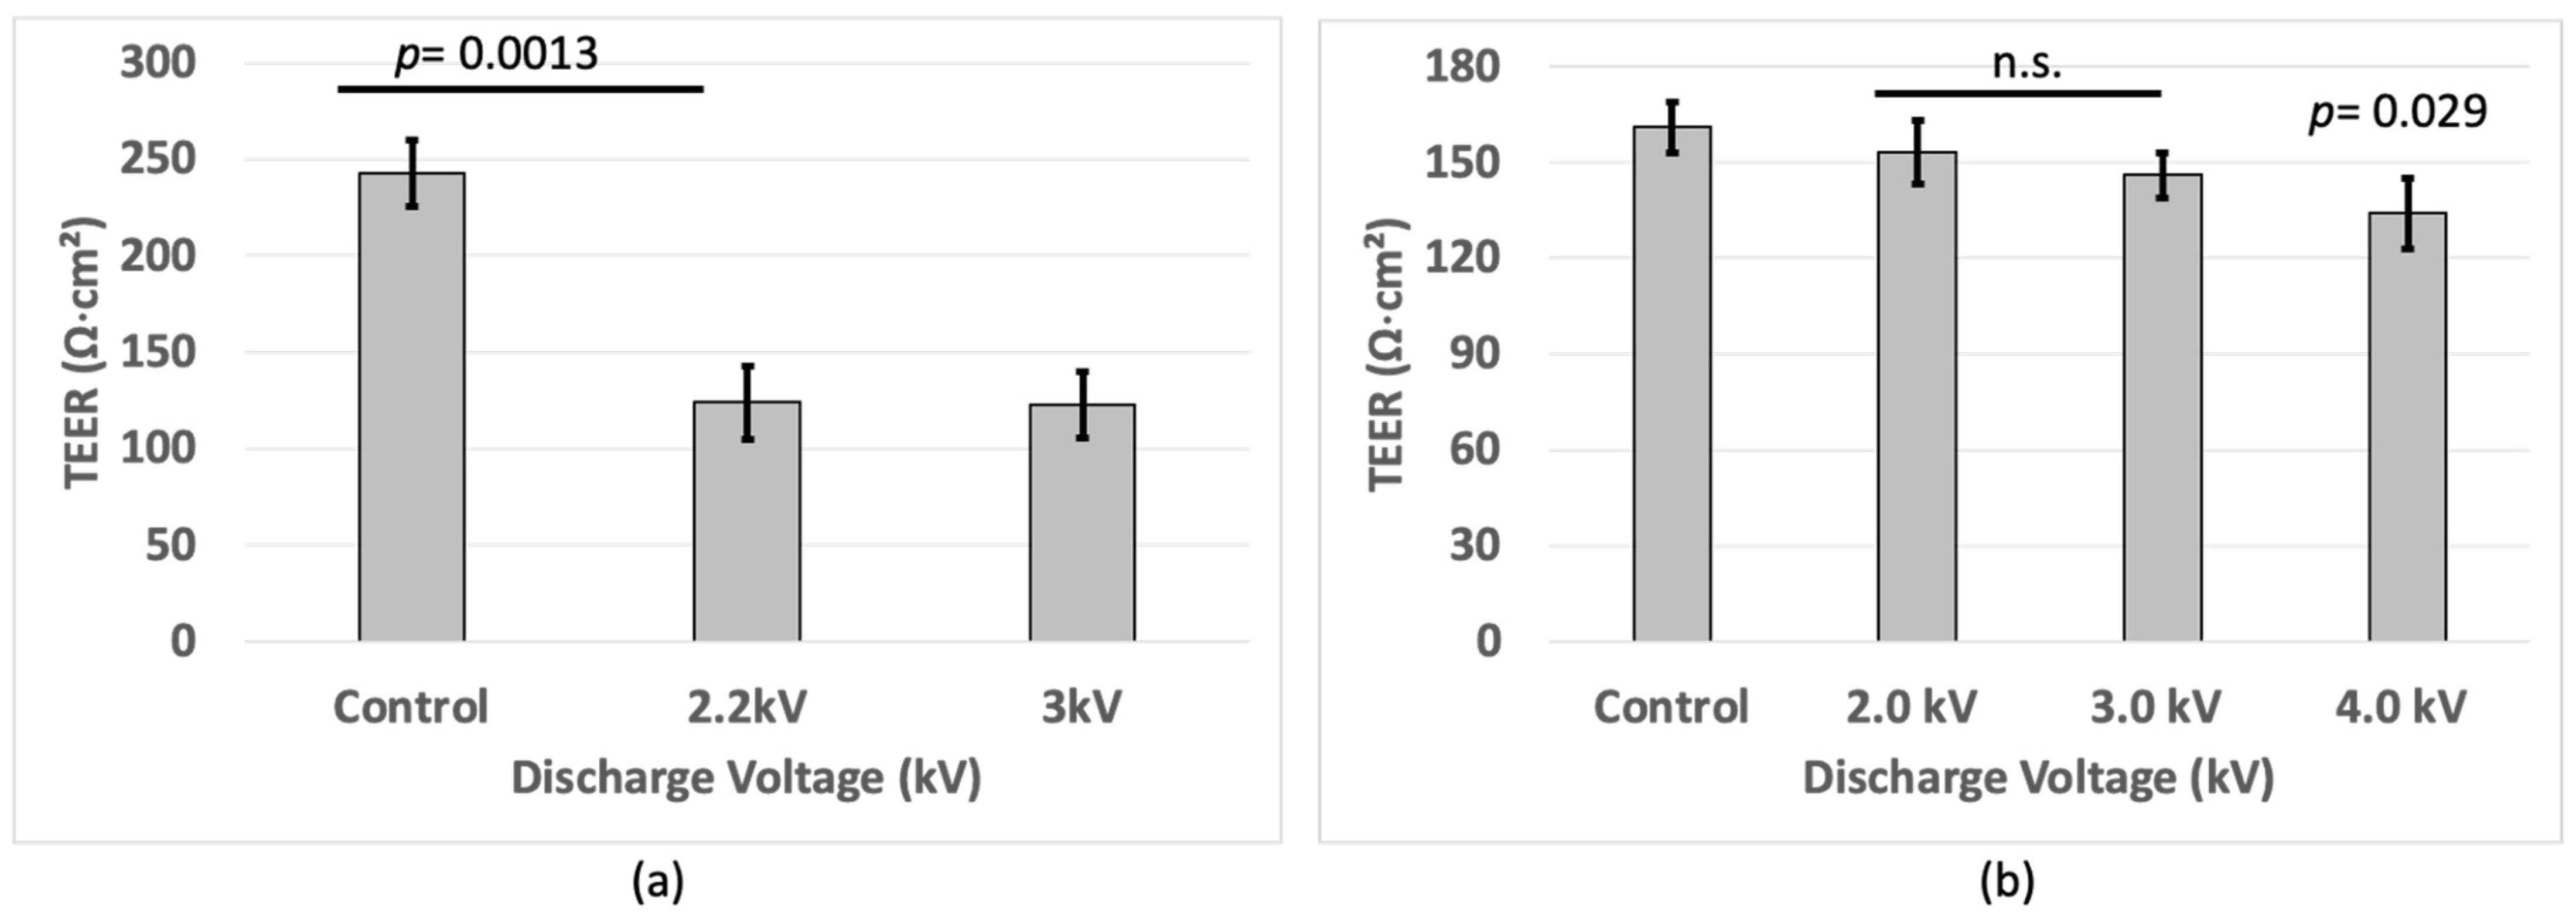
3.1. TEER Measurement

Following plasma irradiation, the cells were incubated for an additional 60 min to allow for interaction between the CAP-generated RONS and the BBB’s tight junctions. This incubation period allows sufficient time for the reactive species generated by the plasma, such as RONS, to interact with the components of the intercellular tight junction.
TEER measurements were performed again to evaluate the integrity of the tight junctions. In the BBB cell culture, a decrease (p < 0.05) in TEER was observed in the plasma-treated cells compared to the non-treated cells (controls). In both the 2.2 kV0-p and 3 kV0-p plasma discharge, the cells were equally affected, and this resulted in decreased TEER compared to the non-treated cells (Figure 3a).
In the bEND.3 cell culture, the results showed a small decrease (p < 0.05) in TEER from approximately 160 Ω∙cm2 to around 130 Ω∙cm2 upon microplasma irradiation with 4 kV, compared to the cells without plasma treatment (Figure 3b). This suggests that the plasma treatment successfully generated RONS that disrupted the intercellular tight junctions, leading to increased permeability [41,42]. Lower TEER values correspond to a more permeable BBB model and bEND.3 cells.

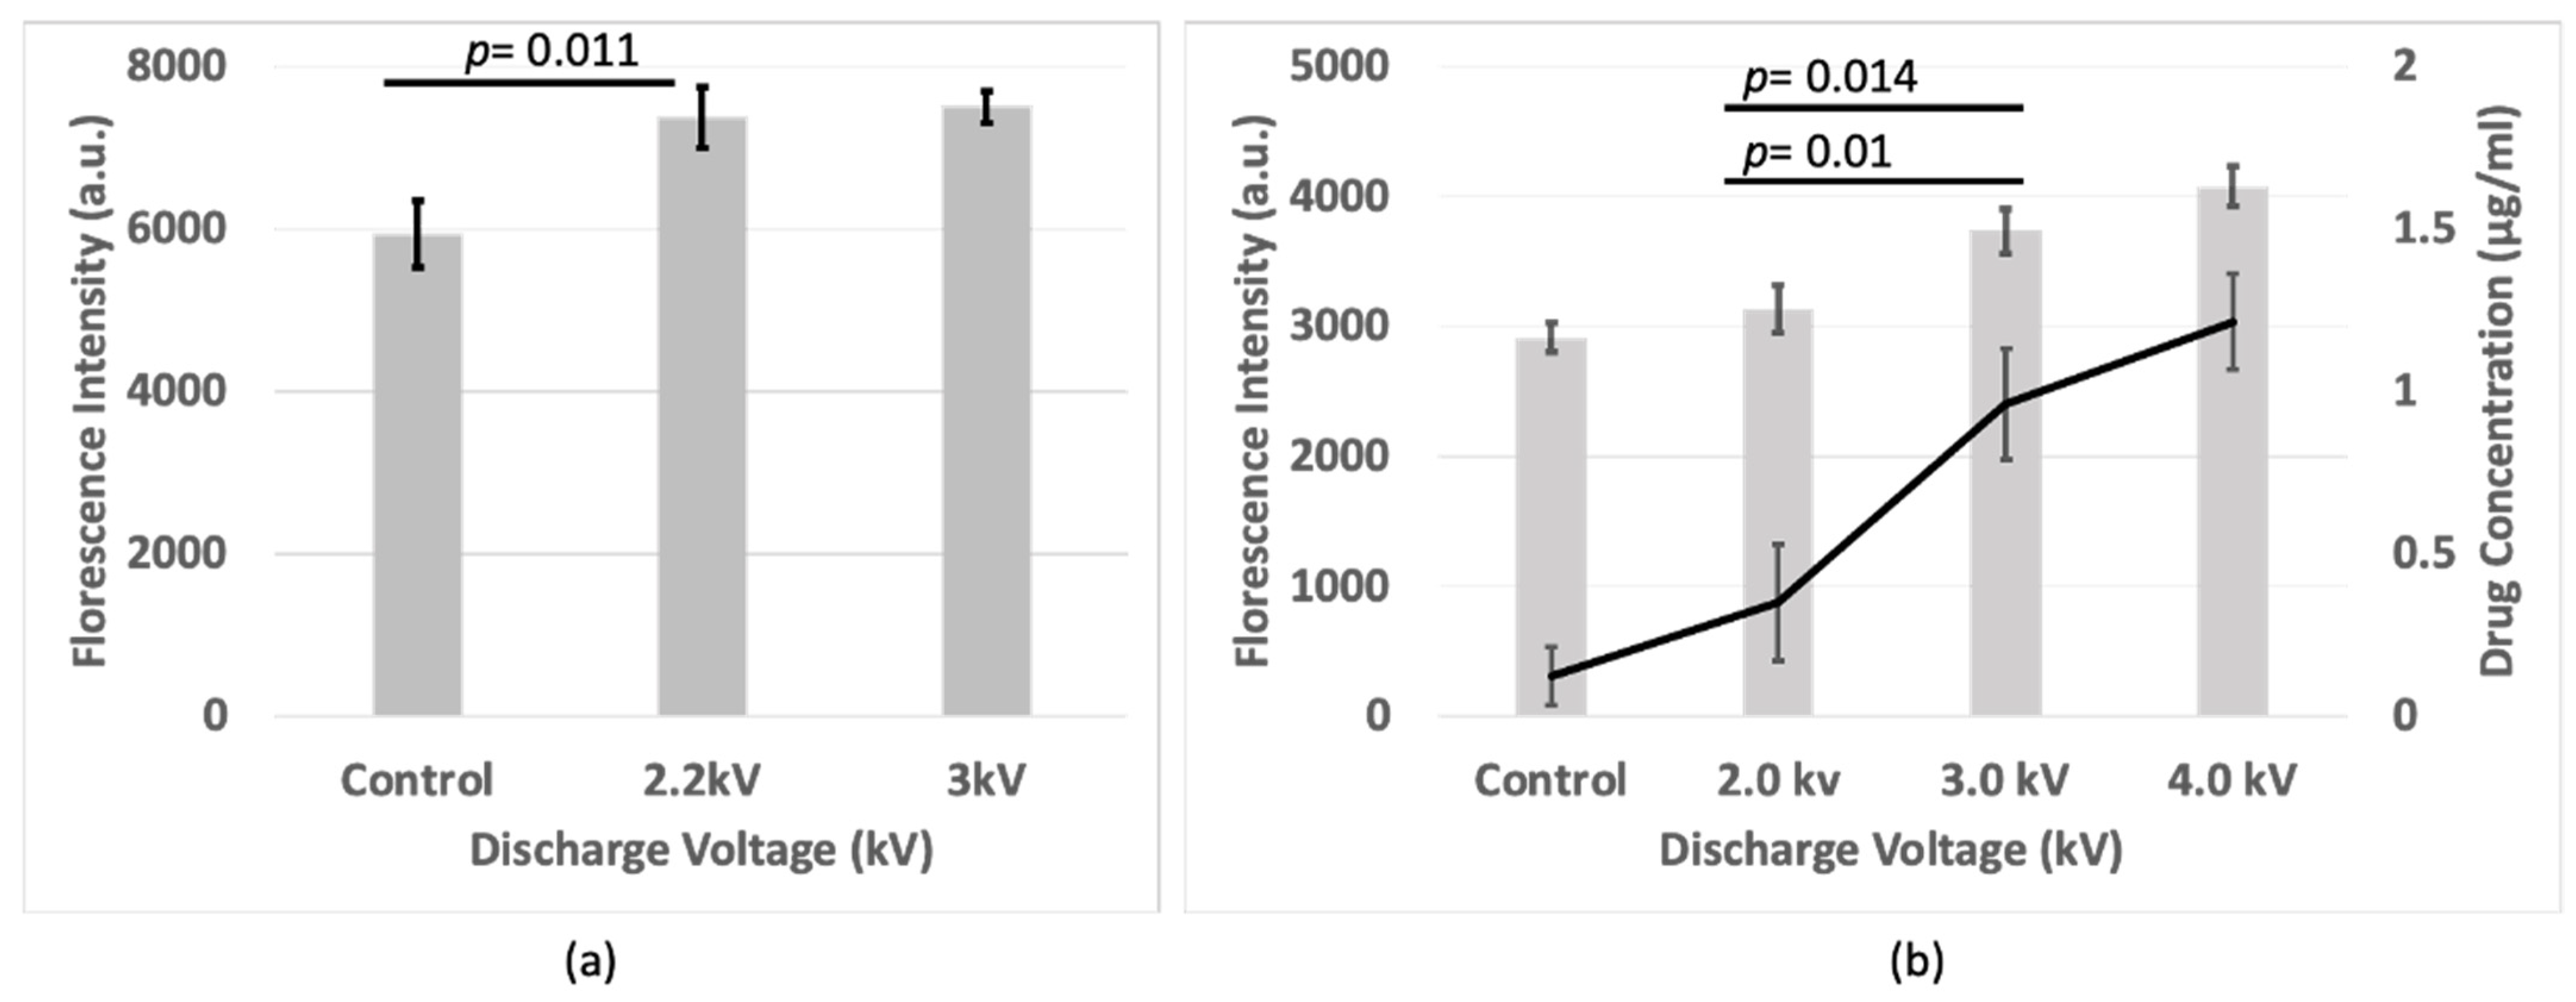
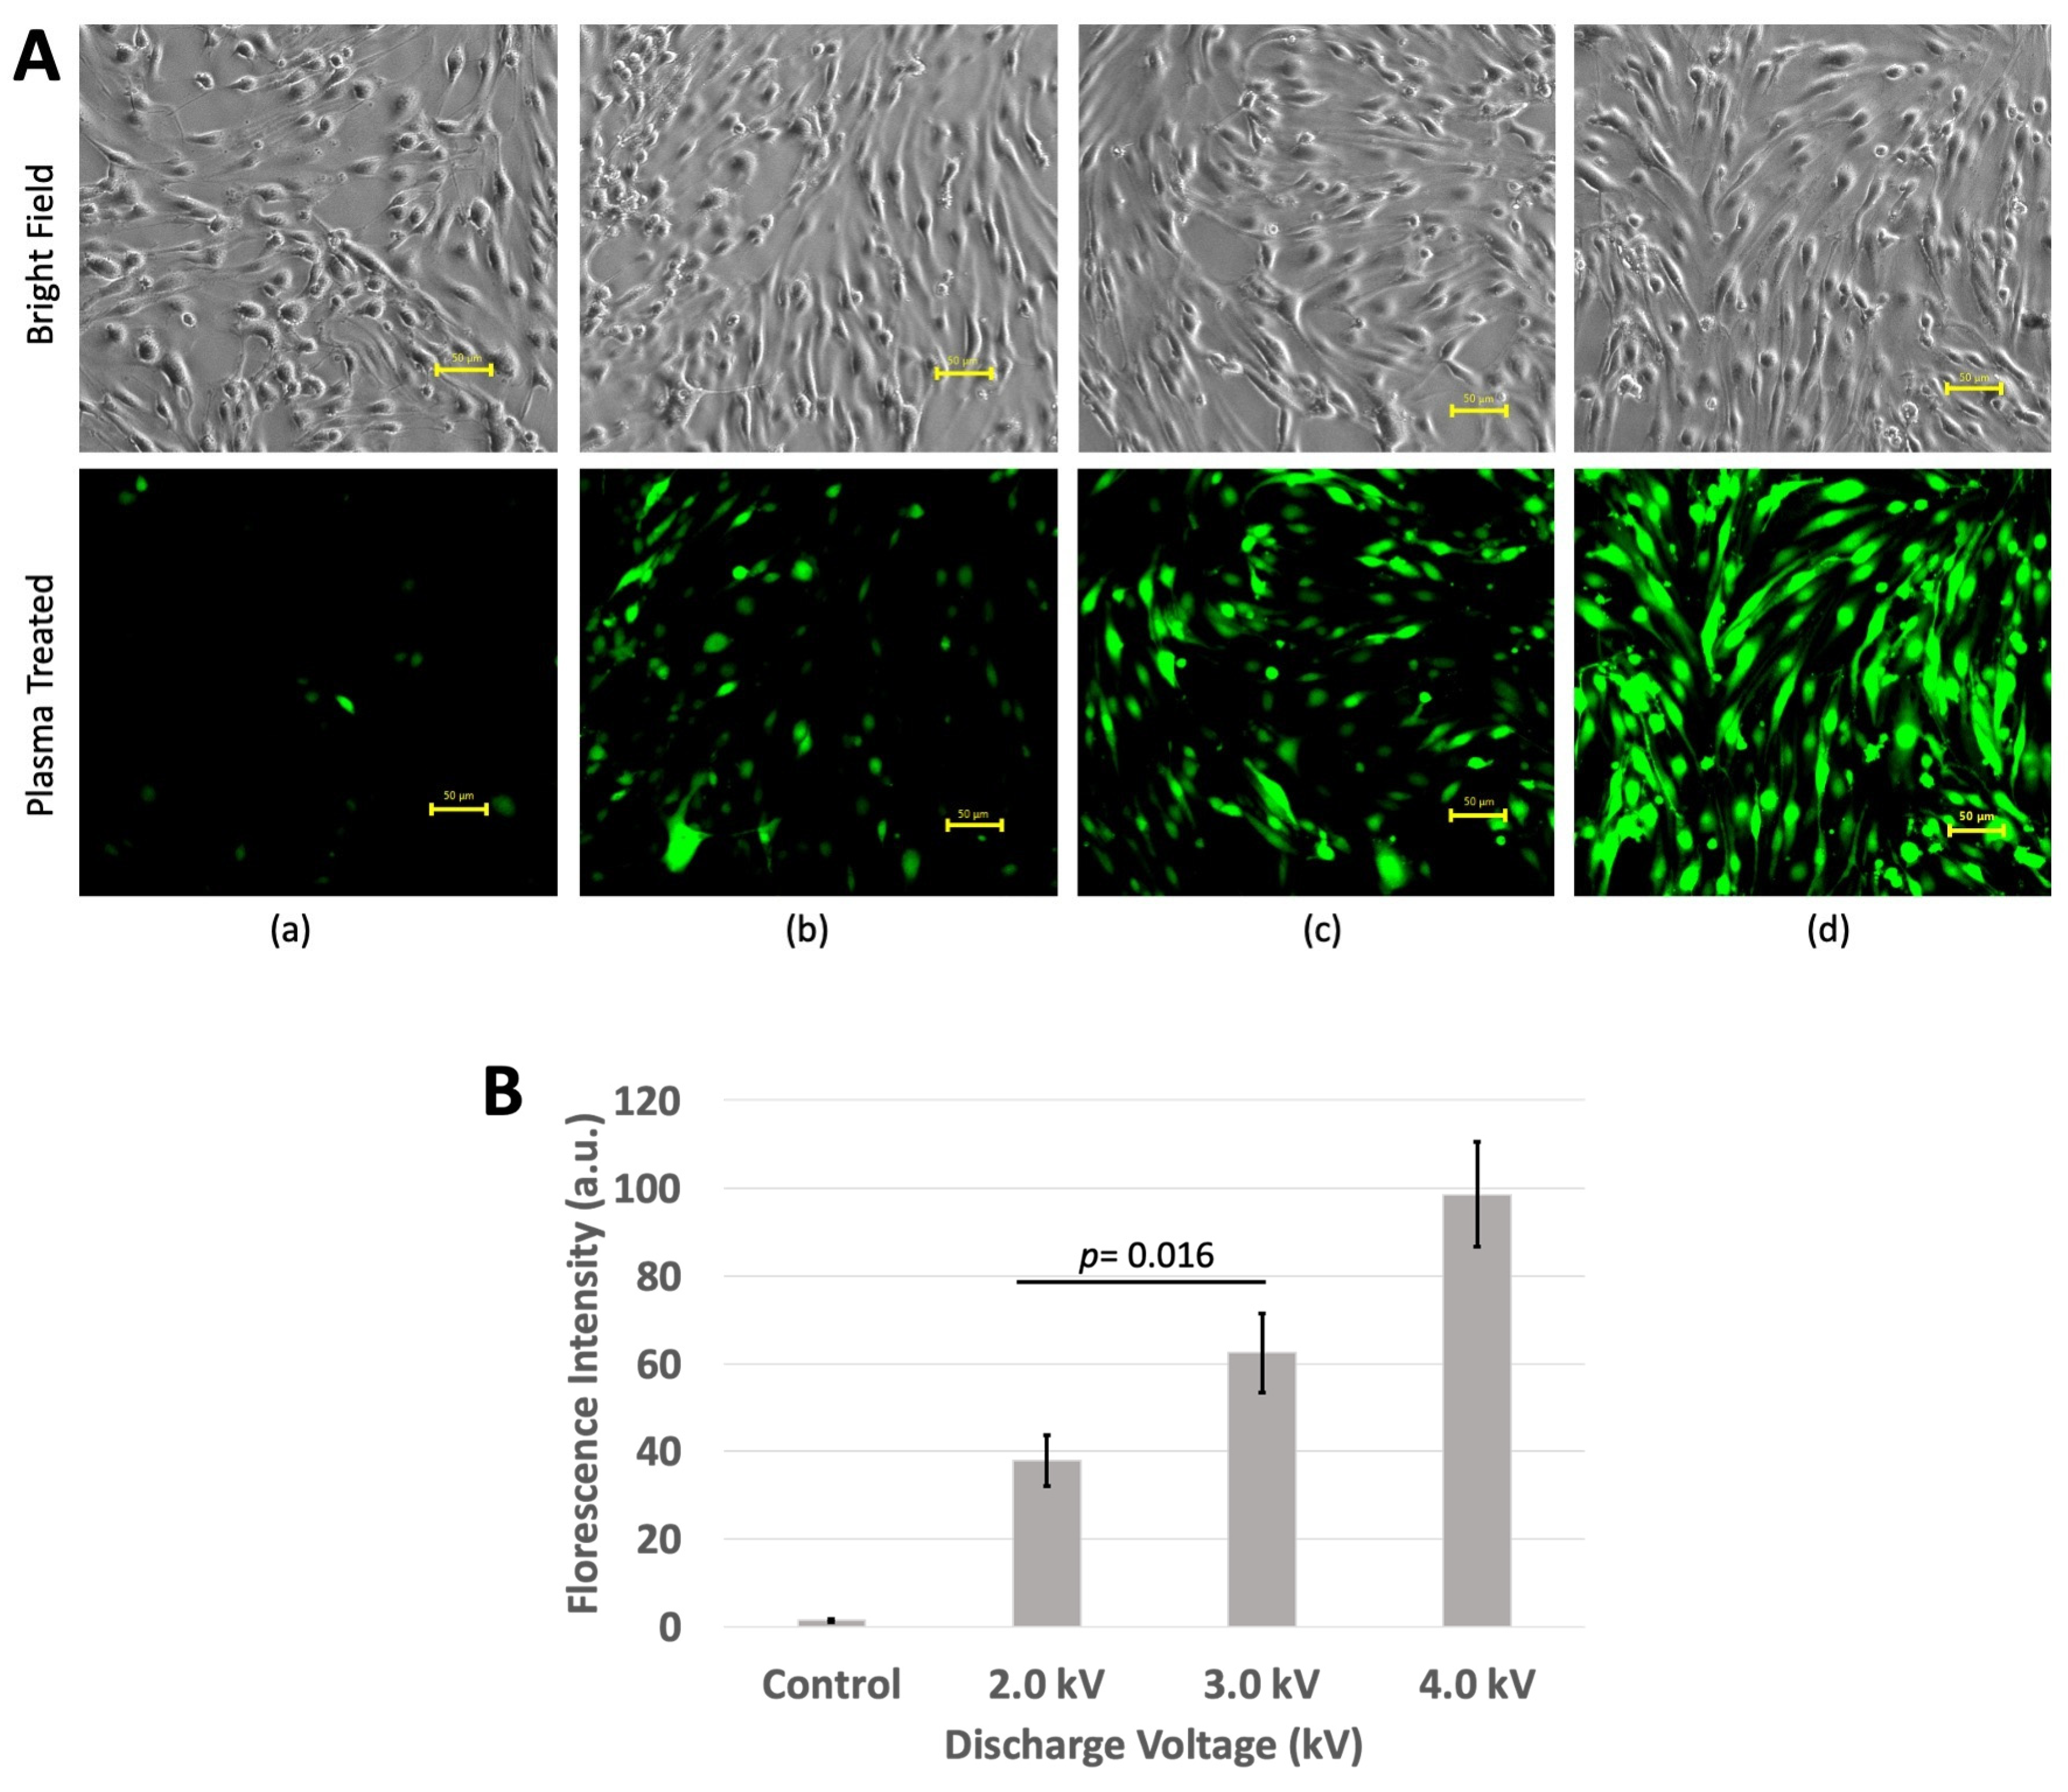
3.2. Florescence Intensity

Following plasma irradiation, the cells were incubated for an additional 1 h. Fluorescence intensity was measured again from the basolateral side. The fluorescence intensity measurements revealed an increase (p < 0.05) in the plasma-treated cells compared to the control group for the BBB and bEND.3 cell culture (Figure 4a,b). A calibration curve was made for only the monolayer of the bEND.3 cell culture to determine the concentration of drug passed to the bottom of the plate. The drug concentration was higher (p < 0.05) in the plasma-treated samples compared to the controls in the bEND.3 cells (Figure 4b).
This suggests that plasma irradiation disrupts the tight junction barrier, potentially allowing the drug to permeate more readily from the upper compartment of the trans-well plate (apical) to the lower compartment of the trans-well plate (basolateral). This enhanced fluorescence intensity signifies an accumulation of the drug at the basal surface of the plate, indicating its successful passage through the plasma-treated BBB model.

3.3. ROS Measurement
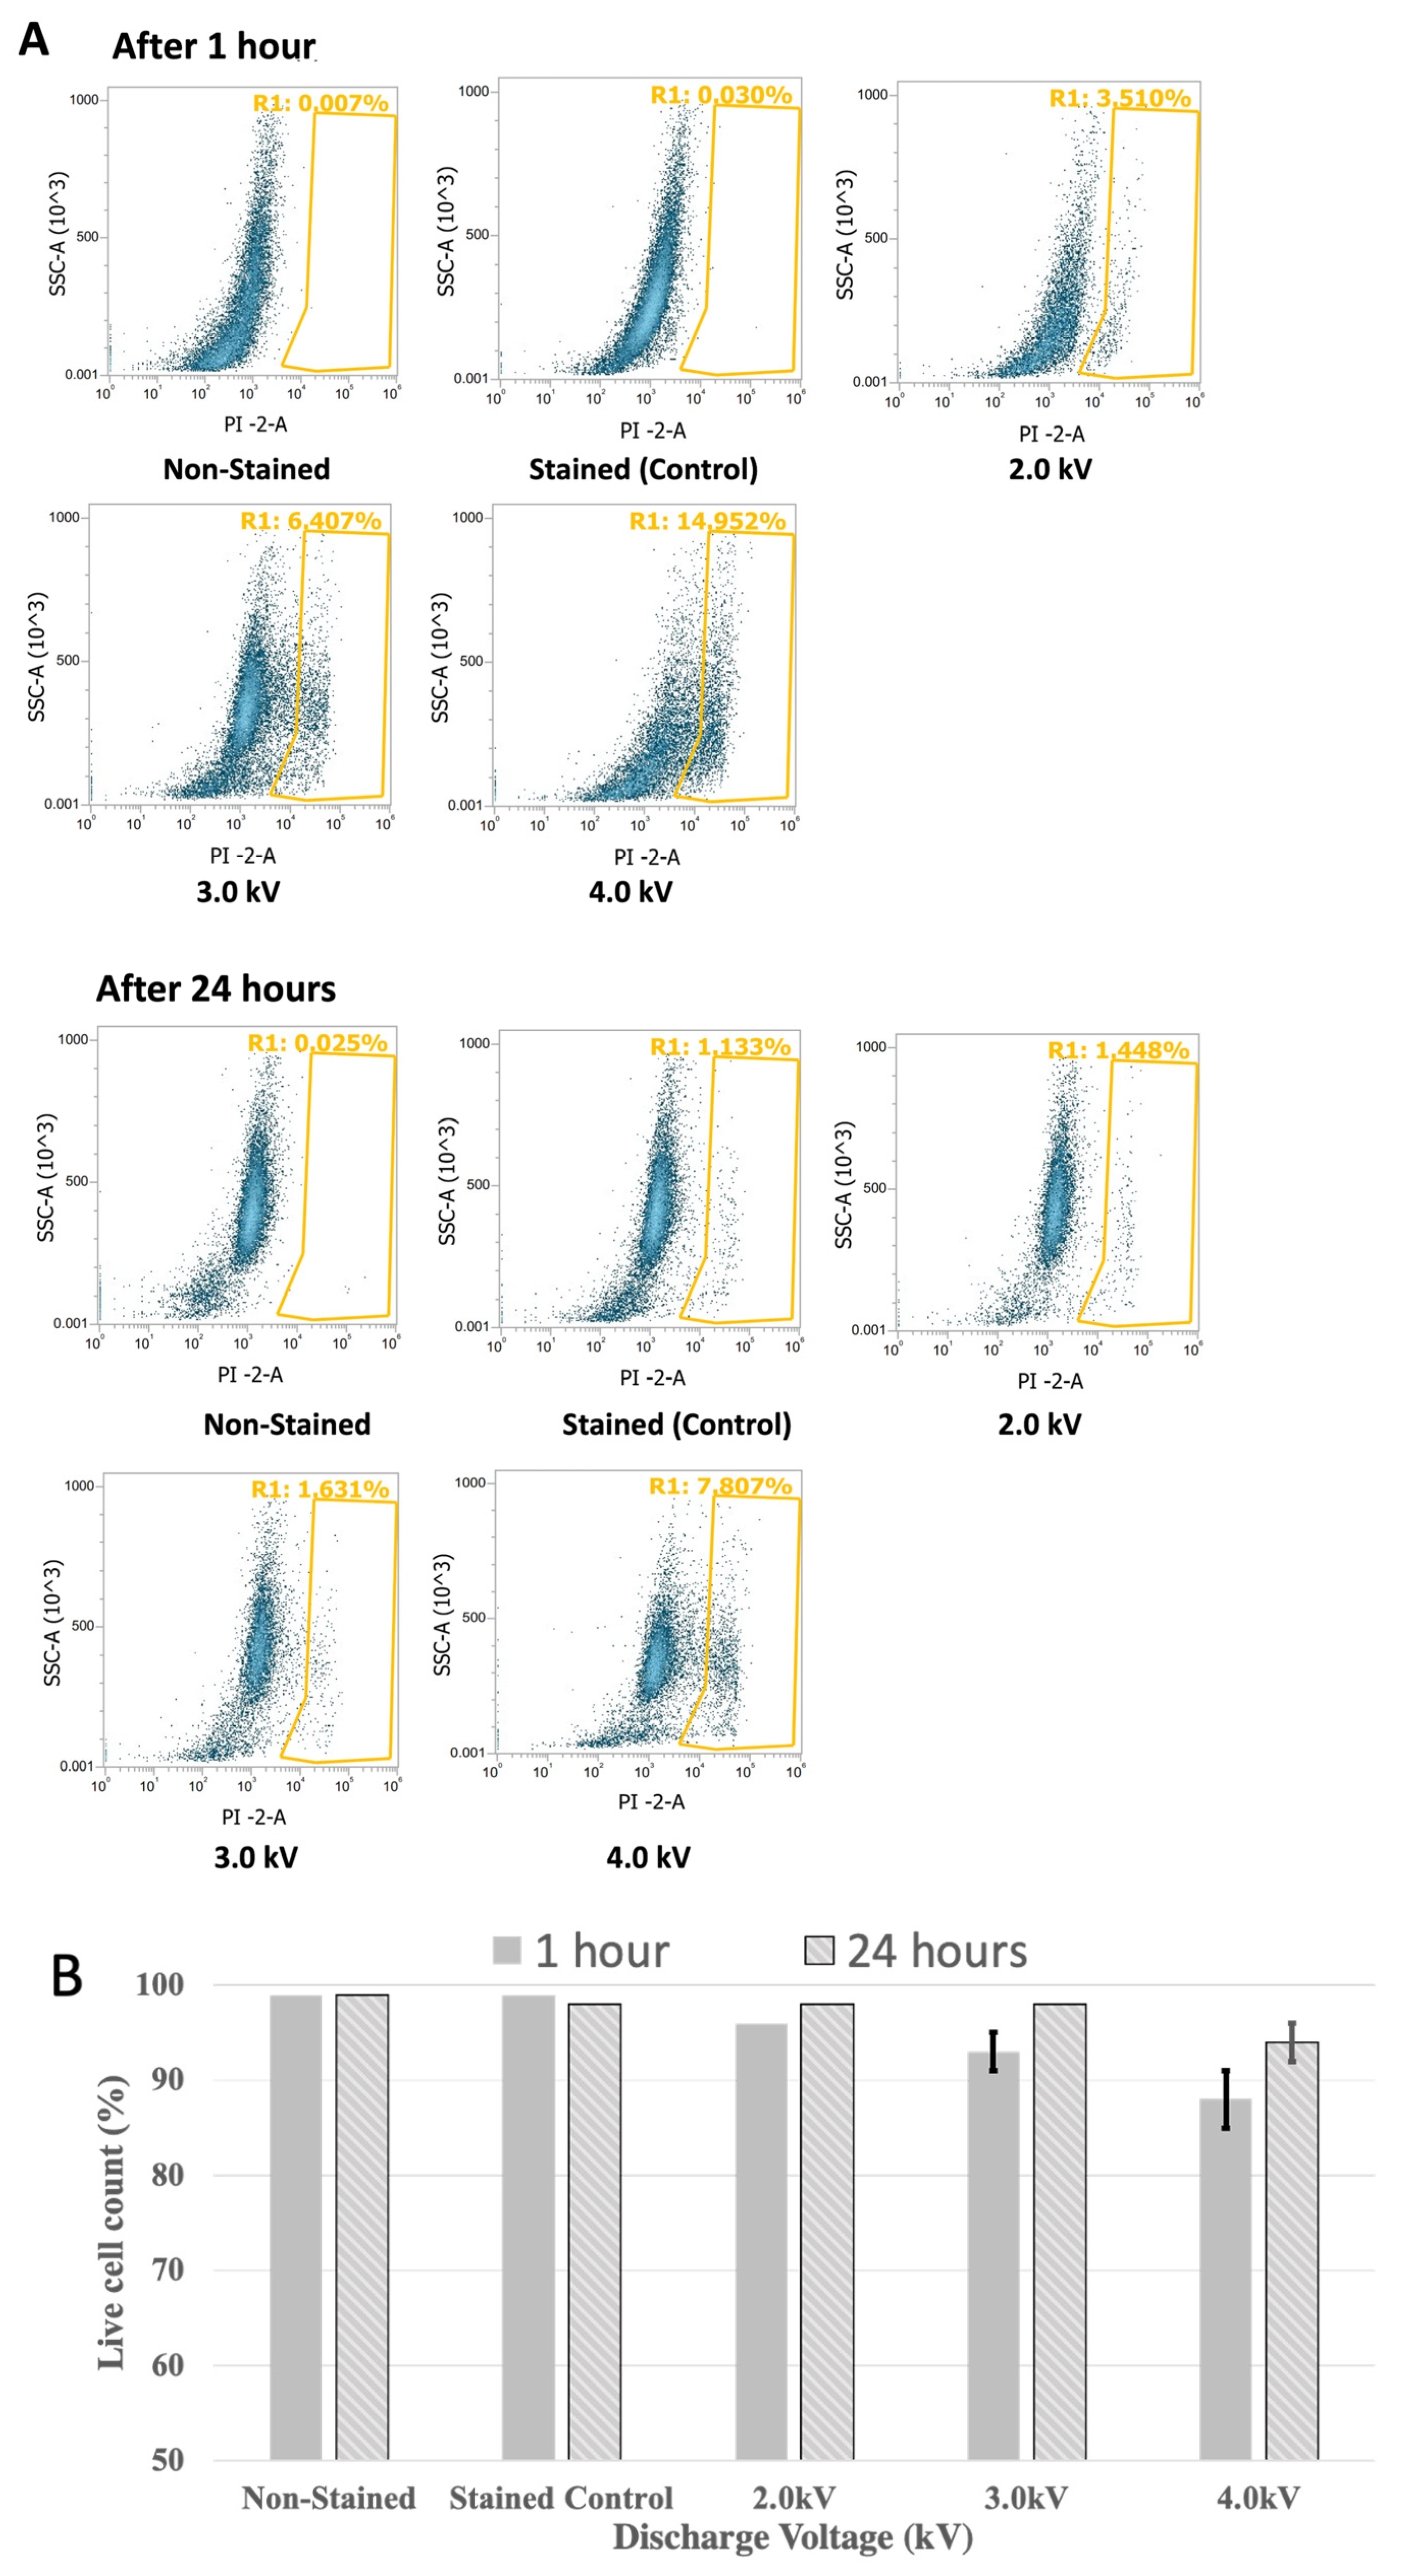
To confirm the role of oxidative damage in tight junction proteins, the total cellular ROS level was measured in the bEND.3 cells. As shown in Figure 5, an increase in the fluorescent signal of a ROS indicator (DCF) was observed in the cells after the plasma treatment. This indicates a substantial influx of ROS into the cells during the plasma treatment. The greater the exposure of the plasma, the more ROS accumulated within the cells. Following a 10 min incubation after the plasma treatment, the fluorescence levels become highest (p < 0.05) at 4 kV plasma discharge and lowest in non-treated cells. The higher the fluorescence level inside the cells, the higher the ROS production from the plasma discharge. The higher production of ROS might interact with tight junction proteins and therefore causes damage to those proteins (Figure 5A,B) [41,42,43,44].

3.4. Cell Viability

In this study, the effect of wire microplasma on the viability of bEND.3 cells was investigated. Cell viability after irradiating the cells with the microplasma and incubating them for 1 h and 24 h was evaluated. Following the plasma irradiation, the cells were immediately incubated in a standard cell culture incubator with 5% CO2.
A hemocytometer, a glass coverslip, and an automated cell counter (Countess) were used to assess the effects of plasma discharge on cell survival at both short (1 h) and long (24 h) incubation times.
Although non-treated cells have the highest cell viability, the results showed a decreased viability in the plasma-irradiated samples at voltages of 2 kV and 3 kV, with the lowest viability at 4 kV of plasma discharge at 1 h incubation. However, at 24 h incubation, the cell viability at 4 kV was increased being as similar to the cell viability at 2 kV and 3 kV, and that of non-treated cells (Figure 6a,b).
Flow cytometry analysis using propidium iodide revealed that after 1 h of plasma treatment, more than 95%, 90%, and 85% of the cells were alive at 2 kV, 3 kV, and 4 kV plasma discharge, respectively. After 24 h of plasma treatment, more than 98% of the cells were alive in all the treatments except for the 4 kV plasma treatment, where more than 92% of the cells remained alive (Figure 7A,B).

4. Discussion

This study investigated the effects of microplasma irradiation on an in vitro BBB model using a BBB kit and bEND.3 cells. The results provide compelling evidence for the potential of microplasma as a non-invasive method to transiently increase BBB permeability for targeted drug delivery.
The TEER measurements and fluorescence intensity analysis provided strong evidence for a microplasma-induced disruption of the tight junction barrier. The observed decrease in TEER values signifies a more permeable BBB model and bEND.3 culture [35]. This suggests that the RONS generated by the plasma likely interacted with crucial tight junction proteins, compromising their function and integrity [41,42]. This aligns with the increased fluorescence intensity observed in the lower compartment of the trans-well plate after the plasma treatment. The more fluorescence intensity in the basolateral part of the trans-well plate corresponds to the amount of the drug passed through the BBB or bEND.3 cell culture monolayer. The successful passage of the fluorescent drug across the BBB model and bEND.3 cells indicates a disruption in the barrier, allowing for increased permeability [45,46,47].
The increase in ROS levels after plasma treatment provides strong support for the proposed mechanism. Higher ROS production is a likely consequence of the plasma discharge [48]. These highly reactive molecules can directly damage tight junction proteins or their corresponding genes [49,50]. This oxidative stress could disrupt the protein structure and function, leading to increased permeability. For example, reactive species NO causes disruption in tight junction proteins [51,52].
Cell viability studies revealed a decrease in viability at higher voltages (4 kV) after short incubation times (1 h). This suggests potential cytotoxicity associated with the treatment at these parameters. However, the cell viability recovered at longer incubation times (24 h), suggesting the cells were able to repair some of the damage or adapt to the altered environment [53]. This highlights the importance of finding a balance between maximizing permeability and minimizing cell death.
Exploring the optimization of plasma parameters such as voltage and exposure time was important. By carefully optimizing these parameters, we may be able to achieve the desired level of BBB permeability with minimal impact on cell viability.

5. Conclusions

This study conducted a drug permeability analysis of BBB cells and brain endothelial cells following microplasma treatment. The study also measured ROS inside the cells to evaluate the interaction of ROS with the components of tight junctions. The cell viability was also measured, as the ROS has the ability to disrupt cellular metabolic activity.
In this study, reduced TEER and increased fluorescence intensity were observed at 2.2 kV and 3 kV of plasma discharge compared to non-treated cells in the BBB model.
Similarly, in bEND.3, reduced TEER and increased drug permeability were also observed at 2 kV, 3 kV, and 4 kV of plasma discharge compared to non-treated cells. The higher production of ROS at 3 kV and 4 kV causes oxidative damage to tight junctions and increases the permeability of the bEND.3 cell monolayer.
In this study, cell viability was reduced at 4 kV compared to the other plasma-treated cells. Cell death may also be responsible for increasing the permeability or leakiness of a cell monolayer. In this regard, the 3 kV plasma discharge is better suited to drug permeability in this study, as it causes minimal cell death. However, the study confirms successful drug delivery while minimizing cell death.
Future studies could explore the specific tight junction proteins targeted by RONS. Experiments like immunofluorescence staining could identify which proteins are most affected by the plasma treatment. Studying the expression levels of genes encoding tight junction proteins after plasma exposure could reveal if ROS are triggering changes in protein production. Moreover, in vivo studies could also be conducted for drug delivery in animal blood vessels by the intravenous injection of plasma-activated components like a plasma-activated drug medium or plasma-activated water. This is an indirect plasma treatment technique.
This study demonstrates the potential of microplasma technology to transiently increase BBB permeability for targeted drug delivery. By optimizing the treatment parameters, addressing the cytotoxicity concerns, and validating the findings in vivo, microplasma could emerge as a valuable tool for delivering therapeutic agents to the central nervous system.

Author Contributions

Conceptualization: M.J.A. and K.S.; methodology: M.J.A. and A.H.S.; formal analysis and investigation: M.J.A., A.H.S., J.K., S.A.R. and K.S.; validation and resources: K.S.; data curation: M.J.A. and K.S.; original draft writing: M.J.A.; review and editing: M.J.A., A.H.S., J.K., S.A.R., M.H., Y.T. and K.S.; supervision and funding: K.S. All authors have read and agreed to the published version of the manuscript.

Funding

This research was funded by JSPS KAKENHI Grant Numbers JP23K17473 and JP24H00794, and by the Photo-medical Engineering Super-area Fellowship.

Institutional Review Board Statement

Not applicable.

Data Availability Statement

Data are contained within the article.

Conflicts of Interest

The authors declare no conflicts of interest.

References

  1. Pardridge, W.M. Drug Transport across the Blood–Brain Barrier. J. Cereb. Blood Flow Metab. 2012, 32, 1959–1972. [Google Scholar] [CrossRef]
  2. Wu, D.; Chen, Q.; Chen, X.; Han, F.; Chen, Z.; Wang, Y. The Blood–Brain Barrier: Structure, Regulation, and Drug Delivery. Signal Transduct. Target. Ther. 2023, 8, 217. [Google Scholar] [CrossRef] [PubMed]
  3. Cabezas, R.; Ávila, M.; Gonzalez, J.; El-Bachá, R.S.; Báez, E.; GarcÃa-Segura, L.M.; Jurado Coronel, J.C.; Capani, F.; Cardona-Gomez, G.P.; Barreto, G.E. Astrocytic Modulation of Blood Brain Barrier: Perspectives on Parkinson’s disease. Front. Cell. Neurosci. 2014, 8, 211. [Google Scholar] [CrossRef]
  4. Kniesel, U.; Wolburg, H. Tight Junctions of the Blood–Brain Barrier. Cell. Mol. Neurobiol. 2000, 20, 57–76. [Google Scholar] [CrossRef]
  5. Stamatovic, S.M.; Johnson, A.M.; Keep, R.F.; Andjelkovic, A.V. Junctional Proteins of the Blood-Brain Barrier: New Insights into Function and Dysfunction. Tissue Barriers 2016, 4, e1154641. [Google Scholar] [CrossRef] [PubMed]
  6. Luissint, A.-C.; Artus, C.; Glacial, F.; Ganeshamoorthy, K.; Couraud, P.-O. Tight Junctions at the Blood Brain Barrier: Physiological Architecture and Disease-Associated Dysregulation. Fluids Barriers CNS 2012, 9, 23. [Google Scholar] [CrossRef]
  7. Daneman, R.; Prat, A. The Blood–Brain Barrier. Cold Spring Harb. Perspect. Biol. 2015, 7, a020412. [Google Scholar] [CrossRef]
  8. Arif, W.M.; Elsinga, P.H.; Gasca-Salas, C.; Versluis, M.; Martínez-Fernández, R.; Dierckx, R.A.J.O.; Borra, R.J.H.; Luurtsema, G. Focused Ultrasound for Opening Blood-Brain Barrier and Drug Delivery Monitored with Positron Emission Tomography. J. Control. Release 2020, 324, 303–316. [Google Scholar] [CrossRef] [PubMed]
  9. Burgess, A.; Shah, K.; Hough, O.; Hynynen, K. Focused Ultrasound-Mediated Drug Delivery through the Blood–Brain Barrier. Expert Rev. Neurother. 2015, 15, 477–491. [Google Scholar] [CrossRef]
  10. Burgess, A.; Hynynen, K. Drug Delivery across the Blood–Brain Barrier Using Focused Ultrasound. Expert Opin. Drug Deliv. 2014, 11, 711–721. [Google Scholar] [CrossRef]
  11. Baek, H.; Lockwood, D.; Mason, E.J.; Obusez, E.; Poturalski, M.; Rammo, R.; Nagel, S.J.; Jones, S.E. Clinical Intervention Using Focused Ultrasound (FUS) Stimulation of the Brain in Diverse Neurological Disorders. Front. Neurol. 2022, 13, 880814. [Google Scholar] [CrossRef]
  12. Tsai, H.-C.; Tsai, C.-H.; Chen, W.-S.; Inserra, C.; Wei, K.-C.; Liu, H.-L. Safety Evaluation of Frequent Application of Microbubble-Enhanced Focused Ultrasound Blood-Brain-Barrier Opening. Sci. Rep. 2018, 8, 17720. [Google Scholar] [CrossRef]
  13. Sharma, S.; Dang, S. Nanocarrier-Based Drug Delivery to Brain: Interventions of Surface Modification. Curr. Neuropharmacol. 2023, 21, 517–535. [Google Scholar] [CrossRef] [PubMed]
  14. Ahlawat, J.; Guillama Barroso, G.; Masoudi Asil, S.; Alvarado, M.; Armendariz, I.; Bernal, J.; Carabaza, X.; Chavez, S.; Cruz, P.; Escalante, V.; et al. Nanocarriers as Potential Drug Delivery Candidates for Overcoming the Blood–Brain Barrier: Challenges and Possibilities. ACS Omega 2020, 5, 12583–12595. [Google Scholar] [CrossRef]
  15. Pinheiro, R.G.R.; Coutinho, A.J.; Pinheiro, M.; Neves, A.R. Nanoparticles for Targeted Brain Drug Delivery: What Do We Know? Int. J. Mol. Sci. 2021, 22, 11654. [Google Scholar] [CrossRef] [PubMed]
  16. Kumah, E.A.; Fopa, R.D.; Harati, S.; Boadu, P.; Zohoori, F.V.; Pak, T. Human and Environmental Impacts of Nanoparticles: A Scoping Review of the Current Literature. BMC Public Health 2023, 23, 1059. [Google Scholar] [CrossRef] [PubMed]
  17. Xuan, L.; Ju, Z.; Skonieczna, M.; Zhou, P.-K.; Huang, R. Nanoparticles-Induced Potential Toxicity on Human Health: Applications, Toxicity Mechanisms, and Evaluation Models. MedComm 2023, 4, e327. [Google Scholar] [CrossRef]
  18. Sánchez-Navarro, M.; Giralt, E. Peptide Shuttles for Blood–Brain Barrier Drug Delivery. Pharmaceutics 2022, 14, 1874. [Google Scholar] [CrossRef]
  19. Islam, Y.; Leach, A.G.; Smith, J.; Pluchino, S.; Coxonl, C.R.; Sivakumaran, M.; Downing, J.; Fatokun, A.A.; Teixidò, M.; Ehtezazi, T. Peptide Based Drug Delivery Systems to the Brain. Nano Express 2020, 1, 012002. [Google Scholar] [CrossRef]
  20. McCully, M.; Sanchez-Navarro, M.; Teixido, M.; Giralt, E. Peptide Mediated Brain Delivery of Nano- and Submicroparticles: A Synergistic Approach. Curr. Pharm. Des. 2018, 24, 1366–1376. [Google Scholar] [CrossRef]
  21. Jawa, V.; Terry, F.; Gokemeijer, J.; Mitra-Kaushik, S.; Roberts, B.J.; Tourdot, S.; De Groot, A.S. T-Cell Dependent Immunogenicity of Protein Therapeutics Pre-Clinical Assessment and Mitigation–Updated Consensus and Review 2020. Front. Immunol. 2020, 11, 1301. [Google Scholar] [CrossRef] [PubMed]
  22. Wang, L.; Wang, N.; Zhang, W.; Cheng, X.; Yan, Z.; Shao, G.; Wang, X.; Wang, R.; Fu, C. Therapeutic Peptides: Current Applications and Future Directions. Signal Transduct. Target. Ther. 2022, 7, 48. [Google Scholar] [CrossRef]
  23. Bolgeo, T.; Maconi, A.; Gardalini, M.; Gatti, D.; Di Matteo, R.; Lapidari, M.; Longhitano, Y.; Savioli, G.; Piccioni, A.; Zanza, C. The Role of Cold Atmospheric Plasma in Wound Healing Processes in Critically Ill Patients. J. Pers. Med. 2023, 13, 736. [Google Scholar] [CrossRef] [PubMed]
  24. Blajan, M.; Umeda, A.; Shimizu, K. Surface Treatment of Glass by Microplasma. IEEE Trans. Ind. Appl. 2013, 49, 714–720. [Google Scholar] [CrossRef]
  25. Shimizu, K.; Muramatsu, S.; Sonoda, T.; Blajan, M. Water Treatment by Low Voltage Discharge in Water. Int. J. Plasma Environ. Sci. Technol. 2010, 4, 58–64. [Google Scholar] [CrossRef]
  26. Shimizu, K.; Kuwabara, T.; Blajan, M. Study on Decomposition of Indoor Air Contaminants by Pulsed Atmospheric Microplasma. Sensors 2012, 12, 14525–14536. [Google Scholar] [CrossRef] [PubMed]
  27. Lv, Y.; Nie, L.; Duan, J.; Li, Z.; Lu, X. Cold Atmospheric Plasma Jet Array for Transdermal Drug Delivery. Plasma Process. Polym. 2021, 18, 2000180. [Google Scholar] [CrossRef]
  28. Wen, X.; Xin, Y.; Hamblin, M.R.; Jiang, X. Applications of Cold Atmospheric Plasma for Transdermal Drug Delivery: A Review. Drug Deliv. Transl. Res. 2021, 11, 741–747. [Google Scholar] [CrossRef]
  29. Faramarzi, F.; Zafari, P.; Alimohammadi, M.; Moonesi, M.; Rafiei, A.; Bekeschus, S. Cold Physical Plasma in Cancer Therapy: Mechanisms, Signaling, and Immunity. Oxid. Med. Cell. Longev. 2021, 2021, 9916796. [Google Scholar] [CrossRef]
  30. Li, Y.; Tang, T.; Lee, H.; Song, K. Cold Atmospheric Pressure Plasma-Activated Medium Induces Selective Cell Death in Human Hepatocellular Carcinoma Cells Independently of Singlet Oxygen, Hydrogen Peroxide, Nitric Oxide and Nitrite/Nitrate. Int. J. Mol. Sci. 2021, 22, 5548. [Google Scholar] [CrossRef]
  31. Mu, K.; Yu, S.; Kitts, D.D. The Role of Nitric Oxide in Regulating Intestinal Redox Status and Intestinal Epithelial Cell Functionality. Int. J. Mol. Sci. 2019, 20, 1755. [Google Scholar] [CrossRef]
  32. Vigh, J.P.; Kincses, A.; Ozgür, B.; Walter, F.R.; Santa-Maria, A.R.; Valkai, S.; Vastag, M.; Neuhaus, W.; Brodin, B.; Dér, A.; et al. Transendothelial Electrical Resistance Measurement across the Blood–Brain Barrier: A Critical Review of Methods. Micromachines 2021, 12, 685. [Google Scholar] [CrossRef]
  33. Felix, K.; Tobias, S.; Jan, H.; Nicolas, S.; Michael, M. Measurements of Transepithelial Electrical Resistance (TEER) Are Affected by Junctional Length in Immature Epithelial Monolayers. Histochem. Cell Biol. 2021, 156, 609–616. [Google Scholar] [CrossRef] [PubMed]
  34. Maherally, Z.; Fillmore, H.L.; Tan, S.L.; Tan, S.F.; Jassam, S.A.; Quack, F.I.; Hatherell, K.E.; Pilkington, G.J. Real-time Acquisition of Transendothelial Electrical Resistance in an All-human, in vitro, 3-dimensional, Blood-brain Barrier Model Exemplifies Tight-junction Integrity. FASEB J. 2018, 32, 168–182. [Google Scholar] [CrossRef] [PubMed]
  35. Srinivasan, B.; Kolli, A.R.; Esch, M.B.; Abaci, H.E.; Shuler, M.L.; Hickman, J.J. TEER Measurement Techniques for In Vitro Barrier Model Systems. SLAS Technol. 2015, 20, 107–126. [Google Scholar] [CrossRef] [PubMed]
  36. Kristof, J.; Tran, A.N.; Blajan, M.G.; Shimizu, K. A Study of the Influence of Plasma Particles for Transdermal Drug Delivery. In Recent Global Research and Education: Technological Challenges; Jabłoński, R., Szewczyk, R., Eds.; Advances in Intelligent Systems and Computing; Springer International Publishing: Cham, Switzerland, 2017; Volume 519, pp. 167–173. ISBN 978-3-319-46489-3. [Google Scholar] [CrossRef]
  37. Sadiq, A.H.; Kristof, J.; Jahangir, A.M.; Rimi, S.A.; Mizuno, Y.; Shimizu, K. Spiral Wire Microplasma Inducing Growth and Viability of Nasal Cell. In Proceedings of the Recent Advances in Technology Research and Education; Ono, Y., Kondoh, J., Eds.; Springer Nature: Cham, Switzerland, 2024; pp. 164–173. [Google Scholar] [CrossRef]
  38. Kim, S.I.; Kim, H.J.; Lee, H.-J.; Lee, K.; Hong, D.; Lim, H.; Cho, K.; Jung, N.; Yi, Y.W. Application of a Non-Hazardous Vital Dye for Cell Counting with Automated Cell Counters. Anal. Biochem. 2016, 492, 8–12. [Google Scholar] [CrossRef]
  39. Riccardi, C.; Nicoletti, I. Analysis of Apoptosis by Propidium Iodide Staining and Flow Cytometry. Nat. Protoc. 2006, 1, 1458–1461. [Google Scholar] [CrossRef]
  40. Crowley, L.C.; Scott, A.P.; Marfell, B.J.; Boughaba, J.A.; Chojnowski, G.; Waterhouse, N.J. Measuring Cell Death by Propidium Iodide Uptake and Flow Cytometry. Cold Spring Harb. Protoc. 2016, 2016, pdb.prot087163. [Google Scholar] [CrossRef]
  41. Kim, K.A.; Jung, J.H.; Kang, I.G.; Choi, Y.S.; Kim, S.T. ROS Is Involved in Disruption of Tight Junctions of Human Nasal Epithelial Cells Induced by HRV16. Laryngoscope 2018, 128, E393–E401. [Google Scholar] [CrossRef]
  42. Rao, R. Oxidative Stress-Induced Disruption of Epithelial and Endothelial Tight Junctions. Front. Biosci. 2008, 13, 7210–7226. [Google Scholar] [CrossRef]
  43. Song, K.; Li, Y.; Zhang, H.; An, N.; Wei, Y.; Wang, L.; Tian, C.; Yuan, M.; Sun, Y.; Xing, Y.; et al. Oxidative Stress-Mediated Blood-Brain Barrier (BBB) Disruption in Neurological Diseases. Oxid. Med. Cell. Longev. 2020, 2020, 1–27. [Google Scholar] [CrossRef]
  44. Lochhead, J.J.; McCaffrey, G.; Quigley, C.E.; Finch, J.; DeMarco, K.M.; Nametz, N.; Davis, T.P. Oxidative Stress Increases Blood–Brain Barrier Permeability and Induces Alterations in Occludin during Hypoxia–Reoxygenation. J. Cereb. Blood Flow Metab. 2010, 30, 1625–1636. [Google Scholar] [CrossRef]
  45. Yang, J.Y.; Shin, D.-S.; Jeong, M.; Kim, S.S.; Jeong, H.N.; Lee, B.H.; Hwang, K.-S.; Son, Y.; Jeong, H.-C.; Choi, C.-H.; et al. Evaluation of Drug Blood-Brain-Barrier Permeability Using a Microfluidic Chip. Pharmaceutics 2024, 16, 574. [Google Scholar] [CrossRef]
  46. Gao, Z.; Chen, Y.; Cai, X.; Xu, R. Predict Drug Permeability to Blood–Brain-Barrier from Clinical Phenotypes: Drug Side Effects and Drug Indications. Bioinformatics 2017, 33, 901–908. [Google Scholar] [CrossRef]
  47. Geldenhuys, W.J.; Mohammad, A.S.; Adkins, C.E.; Lockman, P.R. Molecular Determinants of Blood–Brain Barrier Permeation. Ther. Deliv. 2015, 6, 961–971. [Google Scholar] [CrossRef]
  48. Ji, W.-O.; Lee, M.-H.; Kim, G.-H.; Kim, E.-H. Quantitation of the ROS Production in Plasma and Radiation Treatments of Biotargets. Sci. Rep. 2019, 9, 19837. [Google Scholar] [CrossRef]
  49. Han, X.; Fink, M.P.; Yang, R.; Delude, R.L. Increased iNOS Activity Is Essential for Intestinal Epithelial Tight Junction Dysfunction in Endotoxemic Mice. Shock 2004, 21, 261–270. [Google Scholar] [CrossRef] [PubMed]
  50. Mazzon, E.; De Sarro, A.; Caputi, A.P.; Cuzzocrea, S. Role of Tight Junction Derangement in the Endothelial Dysfunction Elicited by Exogenous and Endogenous Peroxynitrite and Poly(ADP-Ribose) Synthetase. Shock 2002, 18, 434–439. [Google Scholar] [CrossRef] [PubMed]
  51. Zech, J.-C.; Pouvreau, I.; Cotinet, A.; Goureau, O.; Varlet, B.L.; de Kozak, Y. Effect of Cytokines and Nitric Oxide on Tight Junctions in Cultured Rat Retinal Pigment Epithelium. Investig. Ophthalmol. Vis. Sci. 1998, 39, 1600–1608. [Google Scholar]
  52. Somosy, Z.; Bognár, G.; Horváth, G.; Köteles, G.J. Role of Nitric Oxide, cAMP and cGMP in the Radiation Induced Changes of Tight Junctions in Madin-Darby Canine Kidney Cells. Cell. Mol. Biol. 2003, 49, 59–63. [Google Scholar]
  53. Kurita, H.; Haruta, N.; Uchihashi, Y.; Seto, T.; Takashima, K. Strand Breaks and Chemical Modification of Intracellular DNA Induced by Cold Atmospheric Pressure Plasma Irradiation. PLoS ONE 2020, 15, e0232724. [Google Scholar] [CrossRef] [PubMed]
Figure 1. Schematic diagram of CAP set-up for plasma generation.
Macromol 04 00036 g001
Figure 2. (a) Plasma jet was set at 10 kHz discharge voltage of 2.2 kV and 3 kV, and (b) DBD plasma was set at 5 kHz discharge voltage of 2 kV, 3 kV, and 4 kV, respectively.
Macromol 04 00036 g002
Figure 3. TEER values of (a) BBB cell and (b) bEND.3 cells after plasma irradiation.
Macromol 04 00036 g003
Figure 4. Fluorescence intensity of FD-4 passed through (a) BBB cell, and (b) Fluorescence intensity and drug concentration of FD-4 passed through bEND.3 cells after plasma irradiations.
Macromol 04 00036 g004
Figure 5. ROS measurement using DCFH-DA kit. (A) (a) Non-treated cells showed little or no florescence, (b) 2 kV produced slightly increased florescence, (c) 3 kV produced more florescence than that of 2 kV, and (d) 4 kV produced the highest fluorescence. Images were taken using Keyence Florescence Microscope All-in-one BZ-x800, scale bar 50 μm. (B) Quantitative value of fluorescence. Intensity was calculated using imageJ software.
Macromol 04 00036 g005
Figure 6. Cell viability of bEND.3 cells after (a) 1 h and (b) 24 h incubation following plasma irradiations using trypan blue with hemocytometer.
Macromol 04 00036 g006
Figure 7. Cell viability of bEND.3 cells after 1 h and 24 h incubation following plasma irradiations using propidium iodide with flow cytometer. The Yellow-gated region shows dead cells in percentage and non gated cells are alive cells (A). Alive cells were shown in bar graph (B).
Macromol 04 00036 g007
Disclaimer/Publisher’s Note: The statements, opinions and data contained in all publications are solely those of the individual author(s) and contributor(s) and not of MDPI and/or the editor(s). MDPI and/or the editor(s) disclaim responsibility for any injury to people or property resulting from any ideas, methods, instructions or products referred to in the content.

