Article

The Clear Choice: Developing Transparent Cork for Next-Generation Sustainable Materials

1
CENIMAT—Centro de Investigação em Materiais, i3N—Institute for Nanomodelling, Nanostructures and Nanofabrication, Department of Materials Science, NOVA School of Sciences and Technology, Campus da Caparica, Caparica, 2829-516 Lisbon, Portugal
2
Unit for Innovation and Research in Engineering—UnIRE, Mechanical Engineering Department, Instituto Superior de Engenharia de Lisboa—ISEL, Lisbon Superior Institute of Engineering, Rua Conselheiro Emídio Navarro, 1, 1959-007 Lisboa, Portugal
3
LAQV/Requimte—Laboratório Associado para a Química Verde, Department of Chemistry, NOVA School of Science and Technology, Campus da Caparica, Caparica, 2829-516 Lisbon, Portugal
*
Author to whom correspondence should be addressed.
Macromol 2025, 5(2), 17; https://doi.org/10.3390/macromol5020017
Submission received: 6 March 2025 / Revised: 1 April 2025 / Accepted: 2 April 2025 / Published: 8 April 2025

Abstract

:
Many modern technologies rely on materials that harm the environment. Glass manufacturing, for instance, is both expensive and environmentally damaging. In response, scientists have developed a technique to replace glass with transparent wood, an innovative, versatile, and sustainable alternative. Wood naturally retains heat, is durable, and remains cost-effective, making it promising substitute for glass and plastic in window production. This innovation highlights the urgent need for eco-friendly technologies to replace or improve existing materials. This work explores cork as a sustainable alternative for producing transparent materials, potentially replacing transparent wood. Unlike wood, cork can be harvested from the same tree for up to 300 years. The process followed a method like transparent wood production, involving delignification, bleaching, and forced polymer impregnation. The choice of bleaching agent significantly impacted results—samples treated with sodium hypochlorite solution appeared whiter but became extremely fragile, whereas hydrogen peroxide preserved mechanical properties better. The resin-to-hardener ratio was crucial, with higher resin content improving polymer infiltration and transparency. While fully transparent cork was not achieved, the resulting translucent material lays the groundwork for future research in this field.

Graphical Abstract

1. Introduction

Cork is the bark of the oak, Quercus suber L., which is a tree characteristic of Mediterranean climates. The bark of this type of cork oak is harvested every 9 to 13 years, without damaging the tree, which continues to function as a source of cork throughout its lifetime, around 300 years [1]. To regenerate its bark, the oak tree captures the carbon present in the environment. A tree of this species from which the bark has been harvested absorbs up to five times more carbon dioxide (CO2) than one from which it has not been harvested, demonstrating a specific case where human intervention is beneficial [2]. Considering that one of the main causes for climate change is the emission of greenhouse gases, oak forests retain up to 14 million tons of carbon dioxide, therefore appearing as a solution for the reduction of these gas emissions. In Portugal, the CO2 retained by this species is around five million tons per year, which corresponds to 5% of the country’s total carbon emissions [3].
The cork oak forest is the basis of one of the most important ecosystems in the world for the preservation of biodiversity, being the natural habitat of 135 plant species and more than 200 animal species [3]. In Portugal, cork oak forests are the natural habitat of about 60% of the country’s mammals. In addition, it is important to mention the role of this type of forest in CO2 capture, hydrological cycle regulation, and environmental desertification prevention. The world production of cork in the year 2020 was about 200 thousand tons, with Portugal standing out as the largest producer, 46% of world production [4]. Altogether, cork oak forests represent a key factor for the economy and ecology of several Mediterranean countries [3], underlining the importance of better understanding this material and creating novel strategies for its exploitation.
Cork is a material of biological origin formed by layers of small cells, more than 40 million per cubic centimetre [5]. These cells have five layers of walls made up of various chemical compounds such as suberin, lignin, polysaccharides, waxes, and tannins. Suberin, the component with the highest percentage in cork, is a hydrophobic bio-polyester that acts as a protection between the plant and the environment. This occurs because suberin is a natural polyester made up of aromatic and aliphatic monomers joined together by ester bonds to form a three-dimensional (3D) structure [6]. Lignin is present in the cell wall of plants, increasing its rigidity and structural resistance. Furthermore, it is a complex random copolymer, whose monomer arrangement varies according to the type of plant and its tissue [7]. The polysaccharides present in cork consist mainly of cellulose and hemicellulose [8]. Additionally, tannins are phenolic or polyphenolic compounds and are usually divided into two groups: hydrolysable tannins and condensed tannins [9].
Cork’s structural components are suberin, lignin, and polysaccharides, and its closed cell configuration gives it highly intriguing physical properties [10]. This material combines fire resistance with insulation, lightness, flexibility, gas and water impermeability, low density, and being seemingly unaffected by microbial activity [5,11].
At the current time, there have been no reports of cork being used as a source to produce transparent materials, even though cork has the potential to play a significant role in this field of study. As previously stated, cork from the cork oak has exceptional physical and chemical qualities [12], as well as high dimensional stability, and is fully recyclable and reusable [13]. Given the previously characteristics, cork is beginning to be recognized as a material that can be used in technological evolution by a diverse variety of researchers [11]. This is supported by the fact that the number of published papers on cork has increased over time, indicating a growing scientific interest in this material [14].
Nowadays, cork by-products are mostly used as fuel for energy production, resulting in CO2 emissions into the atmosphere. Rather than being burned and contributing to the greenhouse effect, they can be used to create useful components, such as transparent materials, for a range of applications, enabling waste valorization of these by-products [6].
Knowledge of conventional delignification processes and polymer impregnation techniques provide a substantial base for inferences concerning transparent materials from cork. Furthermore, the high amount of research on transparent wood (TW) during the last few years [15] has added to a growing store of practical information that should facilitate further development on this topic. Subsequently, all topics ahead will revolve around TW, which will serve as the foundation for this research.
Due to significant light absorption and dispersion, natural wood is not transparent in the visible spectrum range. Both scattering and absorption must be reduced in order to make wood transparent [16]. This natural material’s dark colour and opaqueness are due to the presence of light-absorbing components such as lignin, chlorophyll, and tannins. Lignin, the primary component of wood (15–40% wt) [17], is responsible for most light absorption in wood (80–95%) [18], hence its complete or partial removal is required to obtain a transparent material. This criterion can be accomplished by a delignification process [19,20,21], which is the initial step in the manufacturing of transparent materials.
The most common way to extract lignin from biomass is through delignification under alkaline conditions, frequently used in the traditional pulping process [22,23]. Compared to (neutral) water media, where lignin is insoluble, alkaline media exhibit a much higher level of lignin solubility [24]. Alkaline delignification involves a few pulping procedures, with kraft pulping being the dominant way to make chemical pulps [25], due to its self-sufficiency in terms of energy demands, integrated recovery system of used chemicals, and its high-quality pulp production [26]. During this pulping process, the lignin hydrolysis/dissolution of biomass is targeted using a solution of sodium hydroxide (NaOH) and sodium sulphite (Na2SO3) under pressure and at high temperatures [27]. As previously stated, lignin is a collective name for a vast family of biopolymers composed of aromatic units bonded in various ways. To avoid non-comparable results and irreproducible material portfolios, it is critical to emphasize that each lignin is different [28], and when a chemical comparison between wood and cork is made, one must be sceptical.
A material’s ability to transmit light without significant light scattering is known as transparency. Translucent objects, on the other hand, allow light to pass through, despite deviating from Snell’s law. Photons may scatter internally or through one of the two surfaces when a transparent material has components with different refractive indices (RIs) [29]. It is important to refer that it is Snell’s law that explains the behaviour of light waves across different media. This law states that a planar wave splits into two waves as it passes the boundary between two homogeneous mediums with different optical properties. The transmitted wave travels into the second medium, and the reflected wave returns to the first medium [30]. A material is generally transparent if all its components have the same or very similar RI [29]. However, it is important to note that even if all constituents have the same RI, the material may still absorb specific light wavelengths, resulting in some colouration. To create TW, after the delignification process that reduces any form of colouration, a polymer with a suitable RI is used to permeate the delignified wood templates [19], generating a transparent material. This method is known as forced polymer impregnation [31], and it was first reported in a patent [32].
Transmittance and light scattering are two important parameters in characterizing the optical properties of transparent wood [33]. Transmittance can be described as the optical energy flux passing through a material, which includes both scattered light and light that travels without perceptible disturbance [16]. In normal or regular transmittance measurements of samples, the set-up is straightforward. Depending on the information required, a reliable source emits light, which is detected and evaluated by a radiometer, photometer, or spectroradiometer. The incidence flux of the source is measured by directly aligning the source with the detector. When the sample is placed between the source and the detector, the transmitted light is measured. The transmission of the sample can be expressed as spectral transmittance, based on the ratio of these two measurements [34]. Since the incident and transmitted beam diameters are nearly identical, no additional precautions are required for the detector to capture all the transmitted light. Light scattering occurs because of the inevitable mismatch between the refractive index of delignified wood and infiltrated polymer. Furthermore, the polymer infiltration process is not optimal due to the mesoporous hierarchical structure of wood templates [35], which have feature sizes ranging from micrometres (cellulose fibres, vessels, rays) [36] to nanometres (nano-fibrils) [37]. It is also crucial to know that polymer shrinkage during polymerization may result in additional air-filled gaps [38]. The small angle light scattering (SALS) technique can be used to make inferences regarding the above-mentioned primary factors: RI mismatch, multiscale porous hierarchical structures, and the presence of air-filled voids.
Transparent wood has drawn interest and has been a matter of investigation because of its various benefits, including light weight, environmental protection, and high mechanical characteristics [16]. Delignified wood templates are often impregnated with a resin that matches their RI, resulting in a high optical transparent material [19]. TW began to gain major relevance as a new material with strong potentialities, after being discovered and morphologically characterized by S. Fink in 1992 [39]. However, until two research teams from the University of Maryland [19] and the KTH Royal Institute of Technology [20] rediscovered the possibilities of transparent wood in 2016, this innovative concept had been largely forgotten. As a result, transparent wood can now be considered an innovative, versatile, and sustainable material for the development of new functional and structural systems that can impact different areas such as optics and photonics [40,41,42,43] energy efficiency [44,45,46,47], and structural applications [48,49,50].

2. Materials and Methods

2.1. Selection of Starting Material

The cork used in this work was collected in Benavente, Portugal and was cut using a knife, giving rise to small cubic-shape samples with average dimensions of 0.90 ± 0.07 cm × 1.20 ± 0.08 cm × 0.70 ± 0.05 cm (cCork). To study the effect of initial size, it was decided to micronize part of the cCork. Firstly, cCork was put through a water pre-treatment, which consisted in a boiling process for 4 h at 115 °C. Afterwards, it was micronized (mCork) into small pieces with the help of a kitchen blender (BeckenBHB4577, Portugal), and contained 28.5% water in relation to its total mass, presenting an average diameter dimension of 0.23 cm ± 0.03 cm. All the dimensions were determined using ImageJ software—version 1.5k [51].

2.2. Delignification Process

Prior to the delignification process, 10 g of cCork or mCork samples were boiled in water for 8 h at 115 °C. After the separation of the cork samples and the extraction liquid, the delignification process was carried out, according to similar procedures described in the literature [19,33,52]. The lignin removal solution was prepared by mixing 100 mL of sodium hydroxide (NaOH, >98%, Sigma-Aldrich, Alges, Portugal), with 2.5 mol∙L−1, and 100 mL of sodium sulphite (Na2SO3, >98%, Sigma-Aldrich), with 0.4 mol∙L−1. The cork samples were immersed in the lignin removal solution and kept boiling at 115 °C for 8 h, followed by filtration. The cork samples were then rinsed several times with hot water.

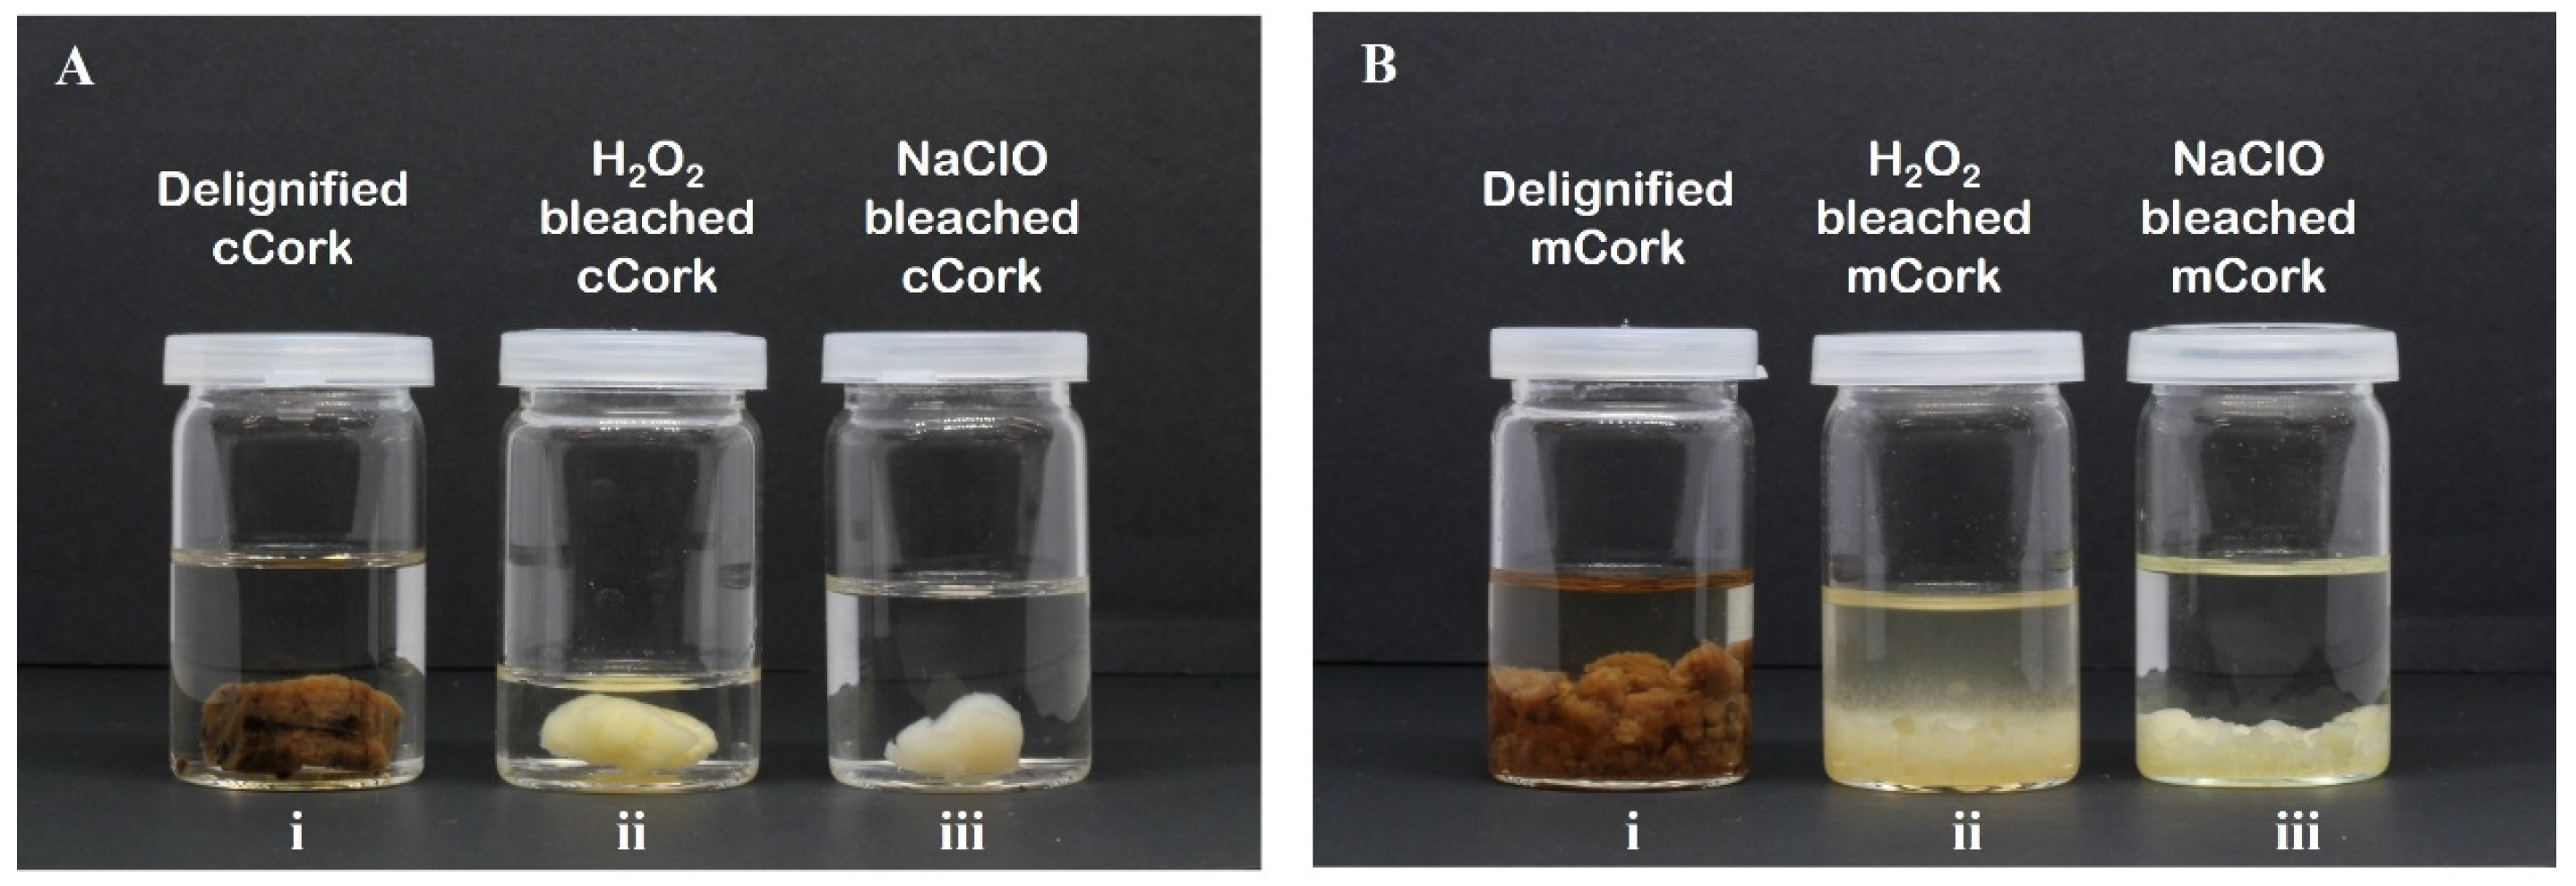
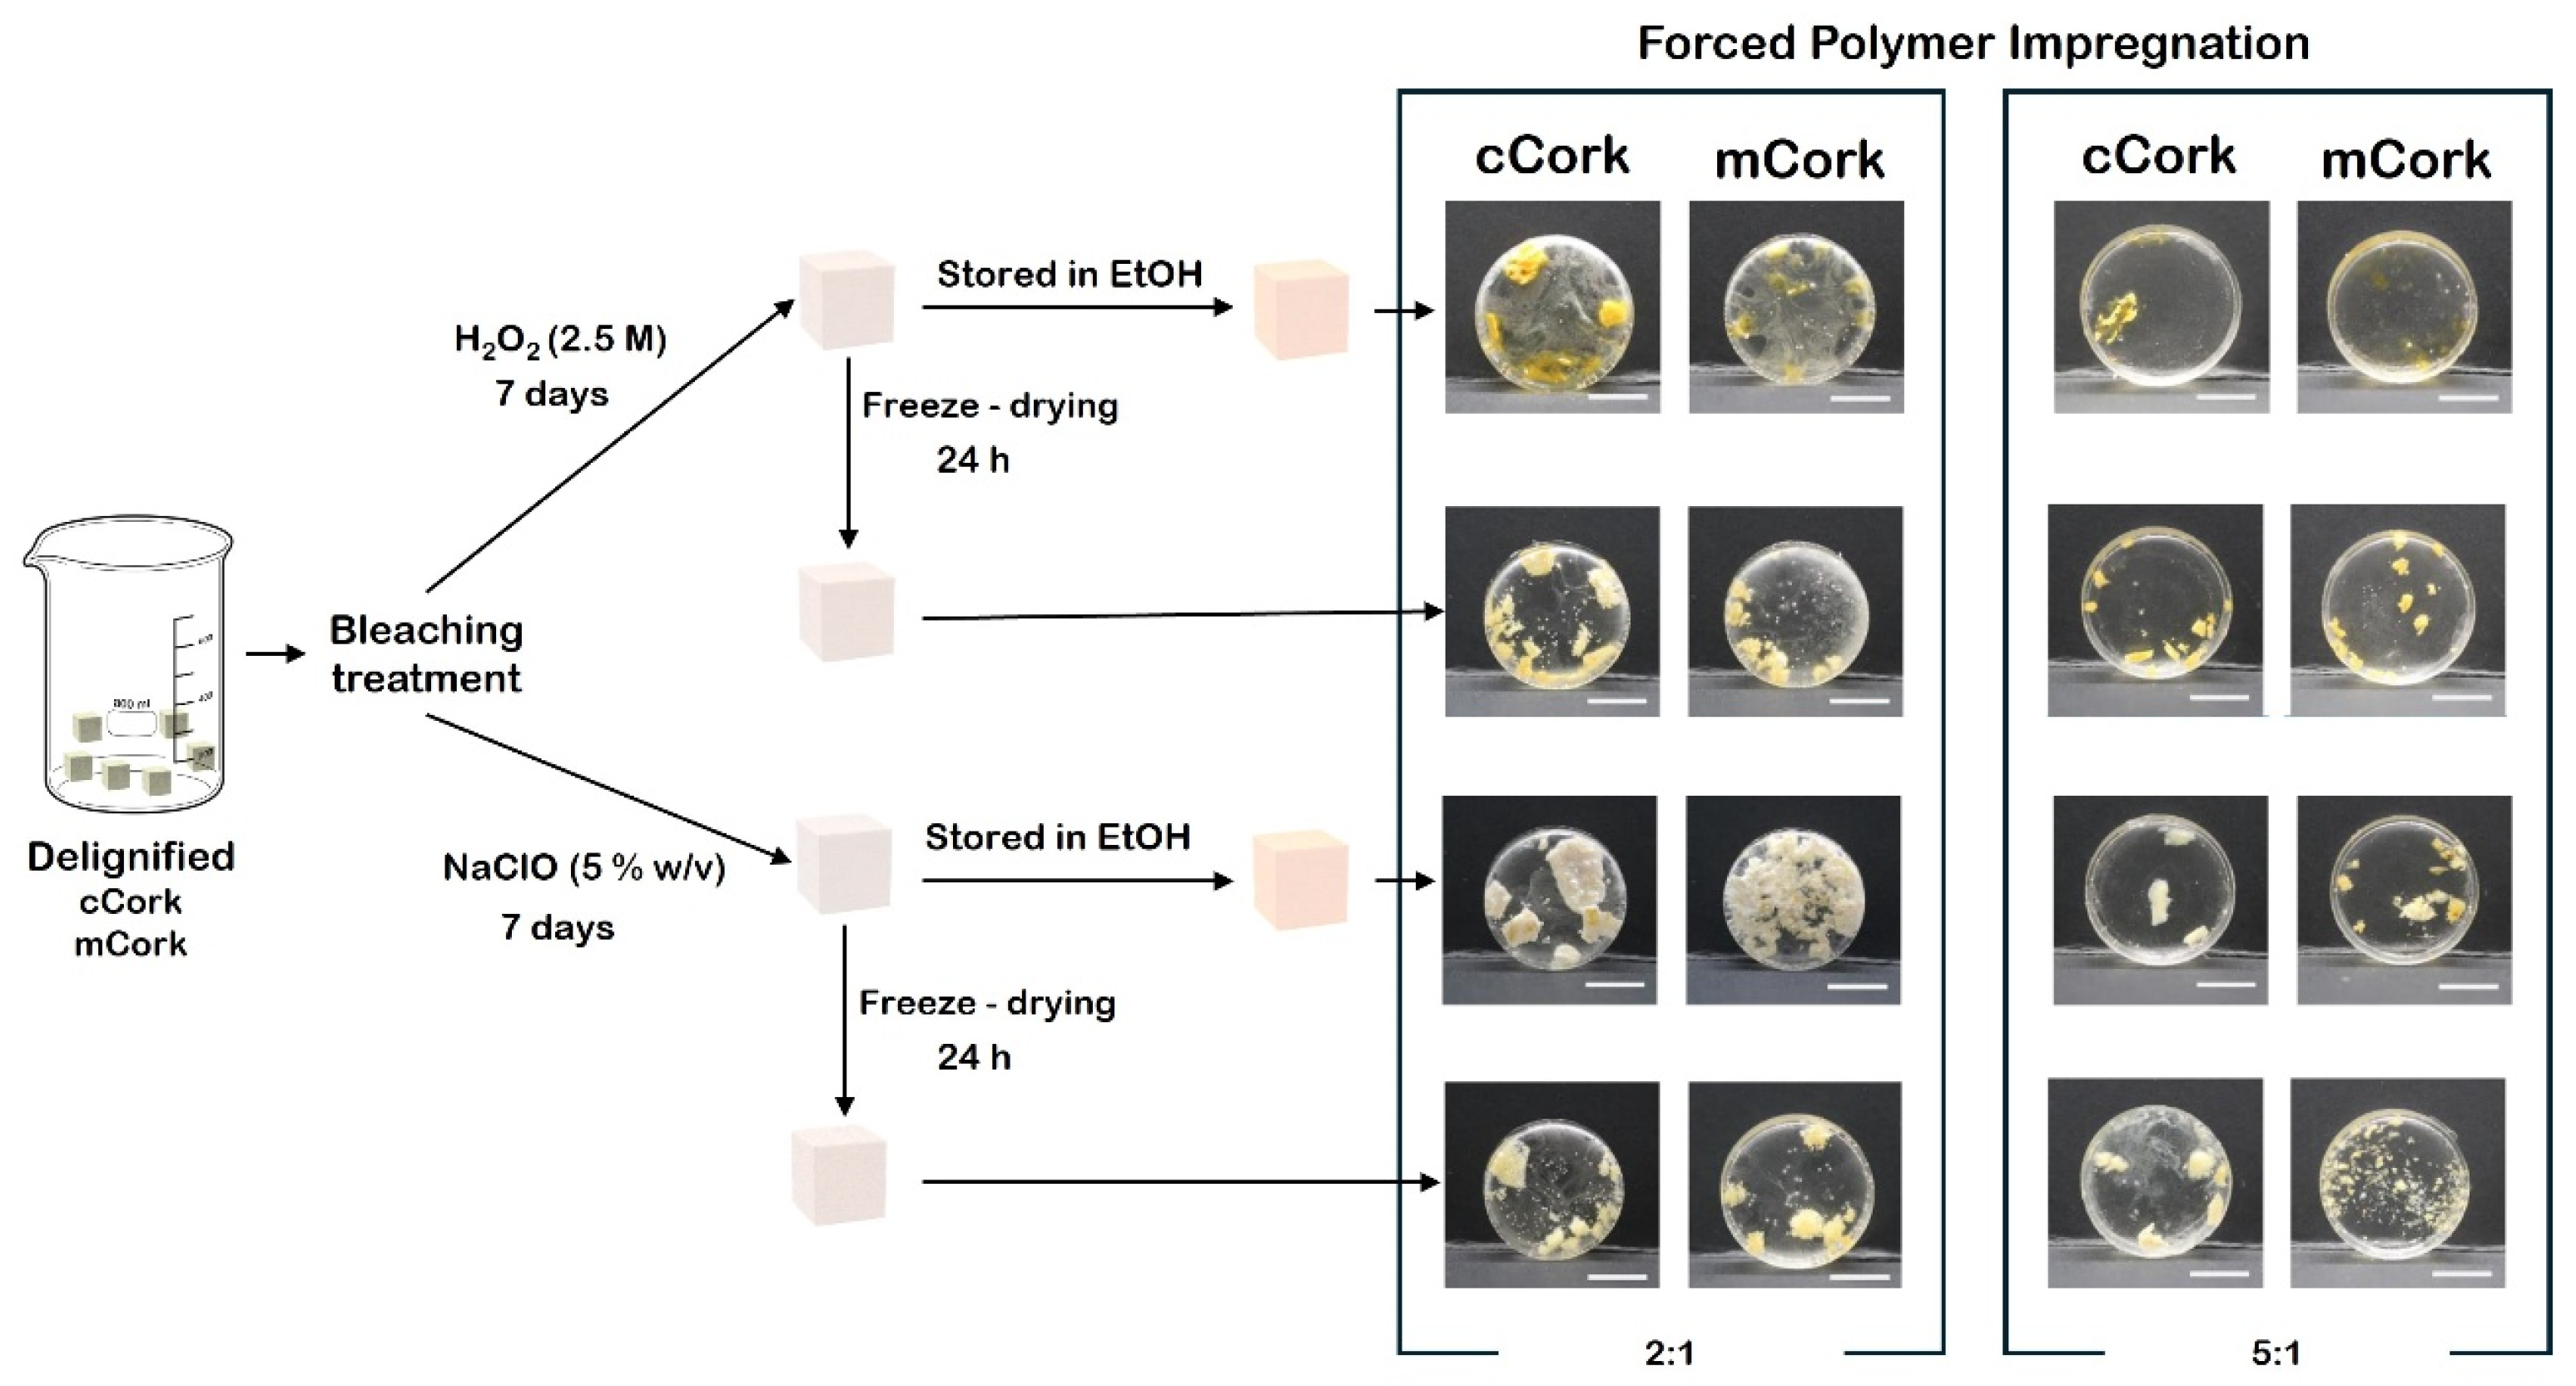
2.3. Bleaching Treatment

Two different bleaching solutions were tested: a 2.5 mol∙L−1 of hydrogen peroxide (H2O2, 35%, LabChem, Branchburg, NJ, USA) and 5% wt/v of sodium hypochlorite (NaClO, 2–3% wt/v, LabChem. Both sets of lignin free samples were collected, rinsed with water several times, and then preserved in ethanol (99%, BDH Chemicals, Radnor, PA, USA) at room temperature.

2.4. Forced Polymer Impregnation

Epoxy crystal resin was prepared by mixing resin and hardener (EpoxiCure® 2, Buehler, Leinfelden-Echterdingen, Germany) at different ratios (2:1; 5:1). The chemically treated cCork and mCork was placed in circular plastics moulds (diameter of 2.5 cm), previously brushed with a release agent (Buehler), and each cork sample was immersed in the liquid resin. The mixture was then degassed under 0.9 bar until no further bubbles observed. This procedure took around 30 min and was performed three times. The samples were then kept static for 3 days at room temperature before being extracted from the moulds. The final samples had a thickness between 0.5 to 0.7 cm.

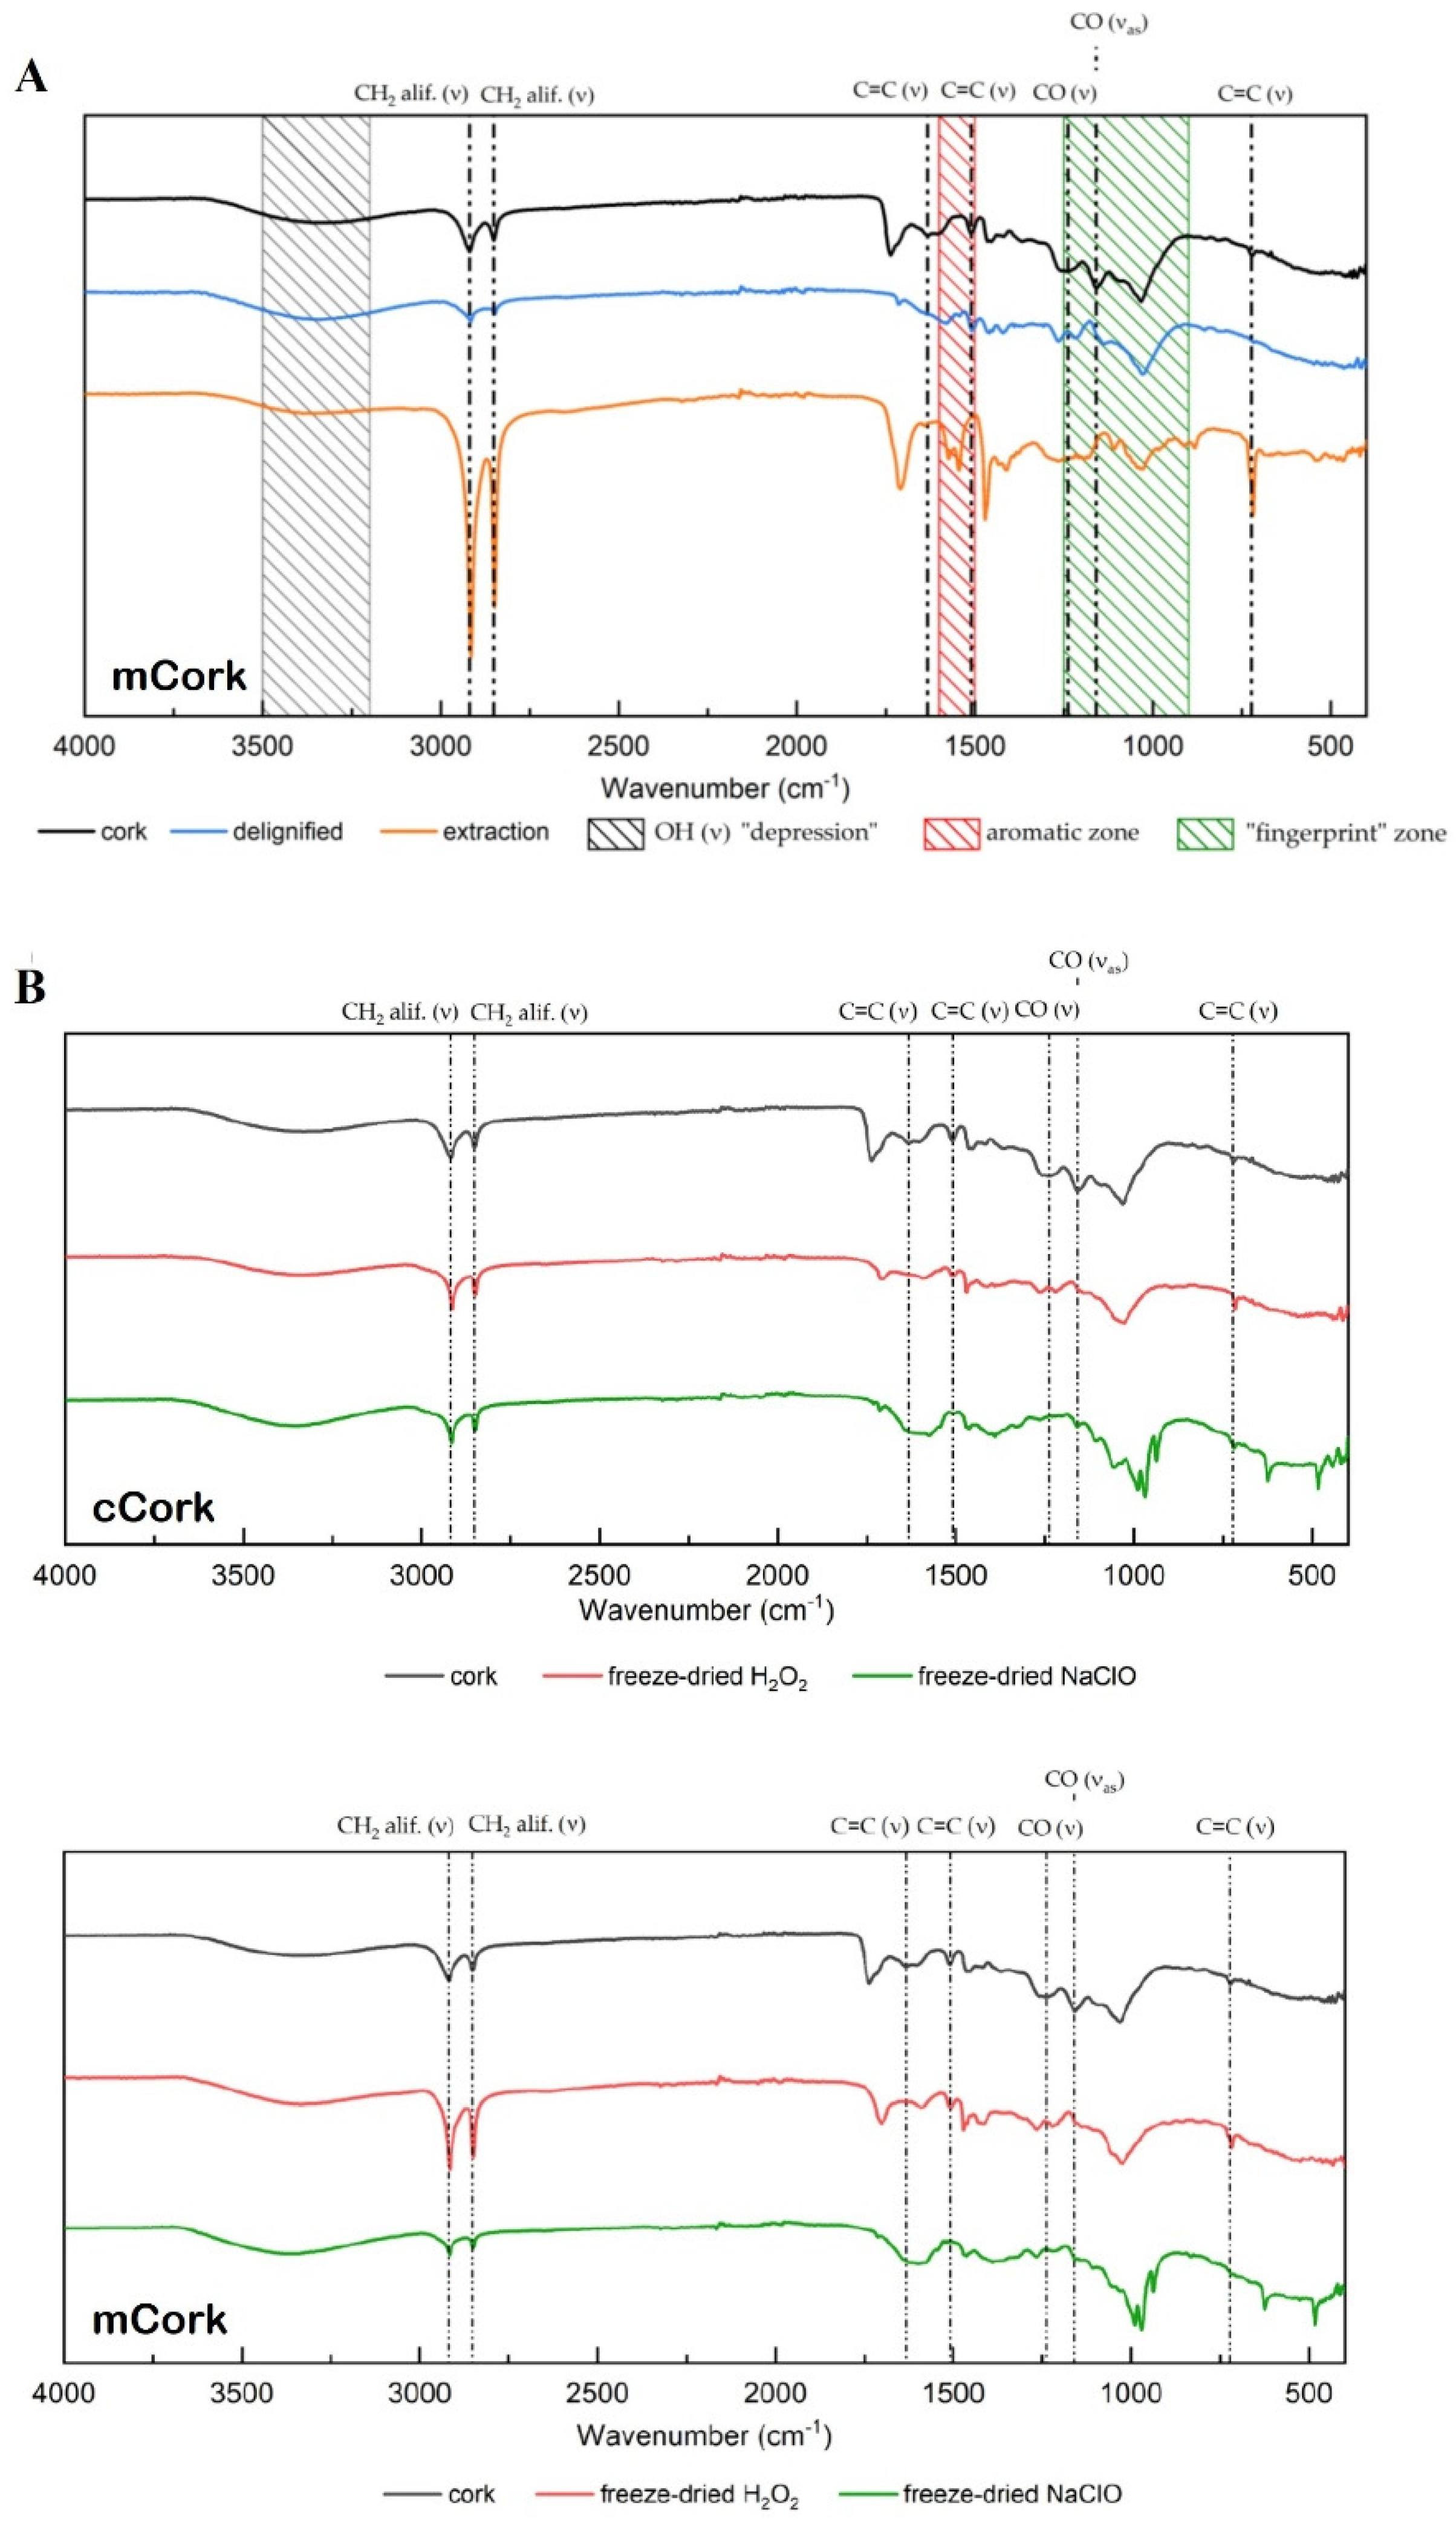
2.5. Characterization Techniques

Macroscopic images of all samples were taken with a Canon EOS 550D (Canon inc., Tokyo, Japan) camera coupled with an EF-S60 mm macro lens (Canon inc., Japan).
The Fourier-transformed infrared spectrums of different samples were obtained with the help of a FTIR spectrometer (Perkin-Elmer—Spectrum Two, Shelton, CT, USA) equipped with an attenuated total reflectance cell. The data were acquired between 4000 and 400 cm−1 using a step of 1 cm−1 and 4 accumulations.
The cork cellular structure of the samples was observed with the help of scanning electron microscopy (Regulus 8220 Scanning Electron Microscope, Hitachi, Tokyo, Japan). The samples were glued to an aluminium substrate with double-sided carbon tape and coated with an 11.9 nm thin iridium layer (Q150T ES Quorum Sputter Coater, Leica, Wetzlar, UK). The images were captured in SE(U) mode with a 3 kV acceleration voltage and at various magnifications.
For transmittance assessment, a similar set-up was used for two complementary measurement techniques. A laser module (Lasos LGK 7627, LASOS Lasertechnik GmbH, Jena, Germany) with a 633 nm wavelength and a 1 mm beam diameter was used as the light source. A polarizer was used in both set-ups, to regulate the light intensity and reduce unwanted background scattering. As a result, photodetector saturation was avoided, resulting in more precise transmittance measurements and improving scattering accuracy. The sample was placed 80 cm away from both the photodetector and the tracing paper. The transmittance values were measured with the help of Handyscope HS4 version 2.88, and the scatter light patterns of each sample were photographed (Canon EOS 550D(Canon inc., Japan)) and, later, analysed with ImageJ software—version 1.5k [51].

3. Results and Discussion

Although the pre-treatment and delignification processes were based on kraft pulping, they were carried out at normal atmospheric pressure. The H2O pre-treatment was employed for the removal of undesirable components. The change in the chemical composition of cork, after this step, may be regarded as insignificant, since the conditions used only allowed for the extraction of a relatively small fraction of the water-soluble components [53,54]. Chromophores and the material’s lignin may undergo structural changes as a result of the alkaline conditions induced by NaOH [55]. Furthermore, Na2SO3 is a reducing agent and thus may donate electrons to the mixture, breaking down the chemical bonds that cause colouration [56]. The interplay of sodium hydroxide’s alkaline conditions with sodium sulphite’s reductive activity creates an environment in which chromophores are chemically changed or broken down. This is demonstrated by the less intense brownish colouration found on the samples after the delignification process, as can be seen in Figure 1. The delignification filtrates were discarded before proceeding to the bleaching step.
The residual lignin was removed by immersing the delignified cCork and mCork in a bleaching solution, since the samples still had a light-brown colour (Figure 1 C), indicating the presence of lignin [57]. Two different bleaching solutions were used: hydrogen peroxide (H2O2) and sodium hypochlorite (NaClO). H2O2 [58] and NaClO [54,55] have an oxidative behaviour when in contact with cork, breaking the pigments responsible for its natural colour. The brown colouration of the delignified cCork and mCork disappeared after 1 week immersed in the bleaching solution. The samples immersed in the NaClO solution appeared whiter than the H2O2 solution, but their mechanical characteristics were drastically reduced, becoming exceedingly fragile, after rinsing with water and storage in ethanol (Figure 2).
A polymer-to-hardener ratio of 2:1 or 5:1 was employed in the forced polymer impregnation of bleached cCork and mCork. The ratio of 5:1 was chosen due to delay the hardener effect on the polymer, enabling more time for resin to enter the micropores of the cork structure before solidification. The bleached H2O2 and NaClO cork samples were impregnated containing residual ethanol in their structure or after ethanol remotion by freeze-drying (Figure 3).
Samples with mCork produced better outcomes than cCork, which was most likely due to the higher surface area of mCork, which allowed for a more efficient delignification process. The bleaching treatment with NaClO allowed a whiter material to be obtained, which indicates a higher lignin removal, but at the expense of mechanical qualities. Hence, when H2O2 is used as a bleaching agent, the 3D structure of cork cellular wall was retained. The freeze-drying procedure used to completely remove any solvent that was still present in the pores of the cork structural wall was counterproductive since it most likely caused the pores to collapse, making resin impregnation unfeasible. The sample with the best outcome was mCork bleached with H2O2 (2:1 and 5:1 ratio), most likely due greater surface area to the starting material and the ratio chosen, which allowed for higher polymer infiltration and therefore more transparency.
Fourier Transform Infrared Spectroscopy with Attenuated Total Reflectance (ATR-FTIR) was used to perform the chemical analysis. It is possible to observe that the ATR-FTIR spectra of mCork presents some of the most significant peaks of cork (Figure 4A). The “depression” around 3350 cm−1 is accredited to O-H groups stretching vibration (ν) of different components, indicating the presence of hydrogen bonds, whereas 2919 cm−1 and 2851 cm−1 peaks can be assigned mainly to νCH suberin aliphatic chains. Both 1632 cm−1 and 722 cm−1, are related primarily to suberin R1CH=CHR2 groups. The aromatic zone lies between 1600 cm−1 and 1500 cm−1, with contributions from lignin, suberin, and minor components such as tannins and other extractives, where the 1500 cm−1 is frequently attributed to νC=C of lignin aromatics. In the “fingerprint” zone (1250–900 cm−1), symmetric and asymmetric νCO of suberin, polysaccharides, and lignin contribute to peaks 1238 cm−1 and 1159 cm−1, respectively [33,55,56,57,58]. Suberin peaks (1632 cm−1 and 722 cm−1) vanish in the delignified material but reappear in the filtrate. Traces of lignin (1510 cm−1) or cellulose (1238 cm−1 and 1159 cm−1) are not found in the filtrate or the delignified material, on the other hand. This suggests that the exterior components of the cork cellular structure, cellulose and suberin, had a high clearance rate, preserving part of the lignin and thus its structure. Furthermore, the filtrate is predominantly composed of suberin that was diluted during the delignification process, as evidenced by the presence of prominent peaks in the aromatic region. The same conclusions can be drawn from starting cCork, albeit with less data on the removal of suberin and lignin, which is prevented from being removed from the bulk of the material due to its lower surface area. Overall, it is safe to assume that the delignification technique utilized was effective because it was proved that the initial suberin, lignin, and cellulose were removed while still allowing a 3D structure to be maintained.
Figure 4B shows the ATR-FTIR spectra of cCork and mCork after the two bleaching agents. The peaks at 2919 cm−1 and 2851 cm−1 prove that there are remnants of suberin and lignin, highlighted by the preservation of the 3D structure of the cork. NaClO treatment was able to remove the remaining lignin responsible for νC=C (1510 cm−1), while H2O2 proved less effective. The reappearance of the asymmetric νCO peak (1159 cm−1) can be explained by the probable usage of the inner part of cCork, where the chemical agents used in the treatment did not reach.

3.1. Morphology Analysis

The pristine cork cellular structure was observed by scanning electron microscopy (SEM) and compared with the structure after chemical treatment to validate the results obtained through ATR-FTIR. In Figure 5 it is possible to observe the cellular structure of the pristine cork (Figure 5A), as well as the cellular structure of mCork freeze-dried after the bleaching treatment with H2O2 (Figure 5B).
There is an evident reduction in wall thickness, which supports the FTIR results and indicates the removal of certain components such as suberin, lignin, and cellulose. Since this was true for cCork, a higher removal rate is likely confirmed when utilizing mCork due to its larger surface area. In terms of the bleaching agent, when NaClO was used the 3D structure of the final material, after freeze-drying, was destroyed, and the SEM observation was not conducted. Taking in consideration that the objective was to obtain a 3D structure, the best bleaching agent is H2O2, as mentioned before. In summary, SEM allowed us to demonstrate that the delignification technique combined with the bleaching treatment (ideally with H2O2) permitted us to remove a portion of the components that give cork its natural colour, while maintaining the 3D cellular structure.

3.2. Transmittance Measurements

An indication that the chemical treatment was more effective for mCork than for cCork is the results obtained through transmittance analysis of the forced polymer impregnation samples, which show that for the same chemical treatment, samples with starting mCork outperformed those with starting with cCork, in both 2:1 and 5:1 ratios (Figure 6).
The transmittance (Tr) of the polymer-impregnated cork samples is influenced by the thickness of the material, as described by the Beer–Lambert law:
T r = e x p ( Σ t )
where t represents the thickness of the sample, and Σ is the effective attenuation coefficient, encompassing both scattering and absorption contributions. In this study, the polymer–cork composite samples had a total thickness of approximately 10 mm, with individual cork particles ranging from 2 mm (average) to a maximum of 5 mm.
In terms of the bleaching agent, H2O2 produced samples with higher transmittance (grey bars in Figure 6) than NaClO (blue bars in Figure 6), and the freeze-drying technique was demonstrated to be ineffective in the improvement of results (red and green bars in Figure 6). This supports the belief that the pores collapsed during this process, rendering resin impregnation not viable. The most significant samples among those analysed are mCork that achieved extraordinary performance with a spectral transmittance of 5.11%. Given the exponential dependence of transmittance on thickness, a direct comparison with the literature values requires normalization for thickness differences. For instance, Chen et al. [52] reported a total transmittance of 39.4% for transparent wood at 0.59 cm (5.9 mm) thickness and a wavelength of 650 nm, whereas our samples exhibited significantly lower transmittance despite undergoing polymer impregnation. This discrepancy can be partly attributed to the increased thickness (10 mm) in our samples, which leads to stronger attenuation due to increased scattering and absorption pathways. Furthermore, the difference in transmittance between 2:1 and 5:1 polymer-to-hardener ratios can also be interpreted in light of thickness-related effects. The 5:1 ratio resulted in higher transmittance due to improved resin penetration and reduced air bubble formation, which minimizes additional scattering sites within the material. The trapped air bubbles in the 2:1 ratio samples act as scattering centres, increasing Σ and consequently lowering the transmittance.
To refine the analysis, future work could involve measuring the attenuation coefficient Σ at different thicknesses, allowing extrapolation to a standard reference thickness. Additionally, spectral-dependent measurements could help distinguish between absorption- and scattering-dominated attenuation mechanisms.

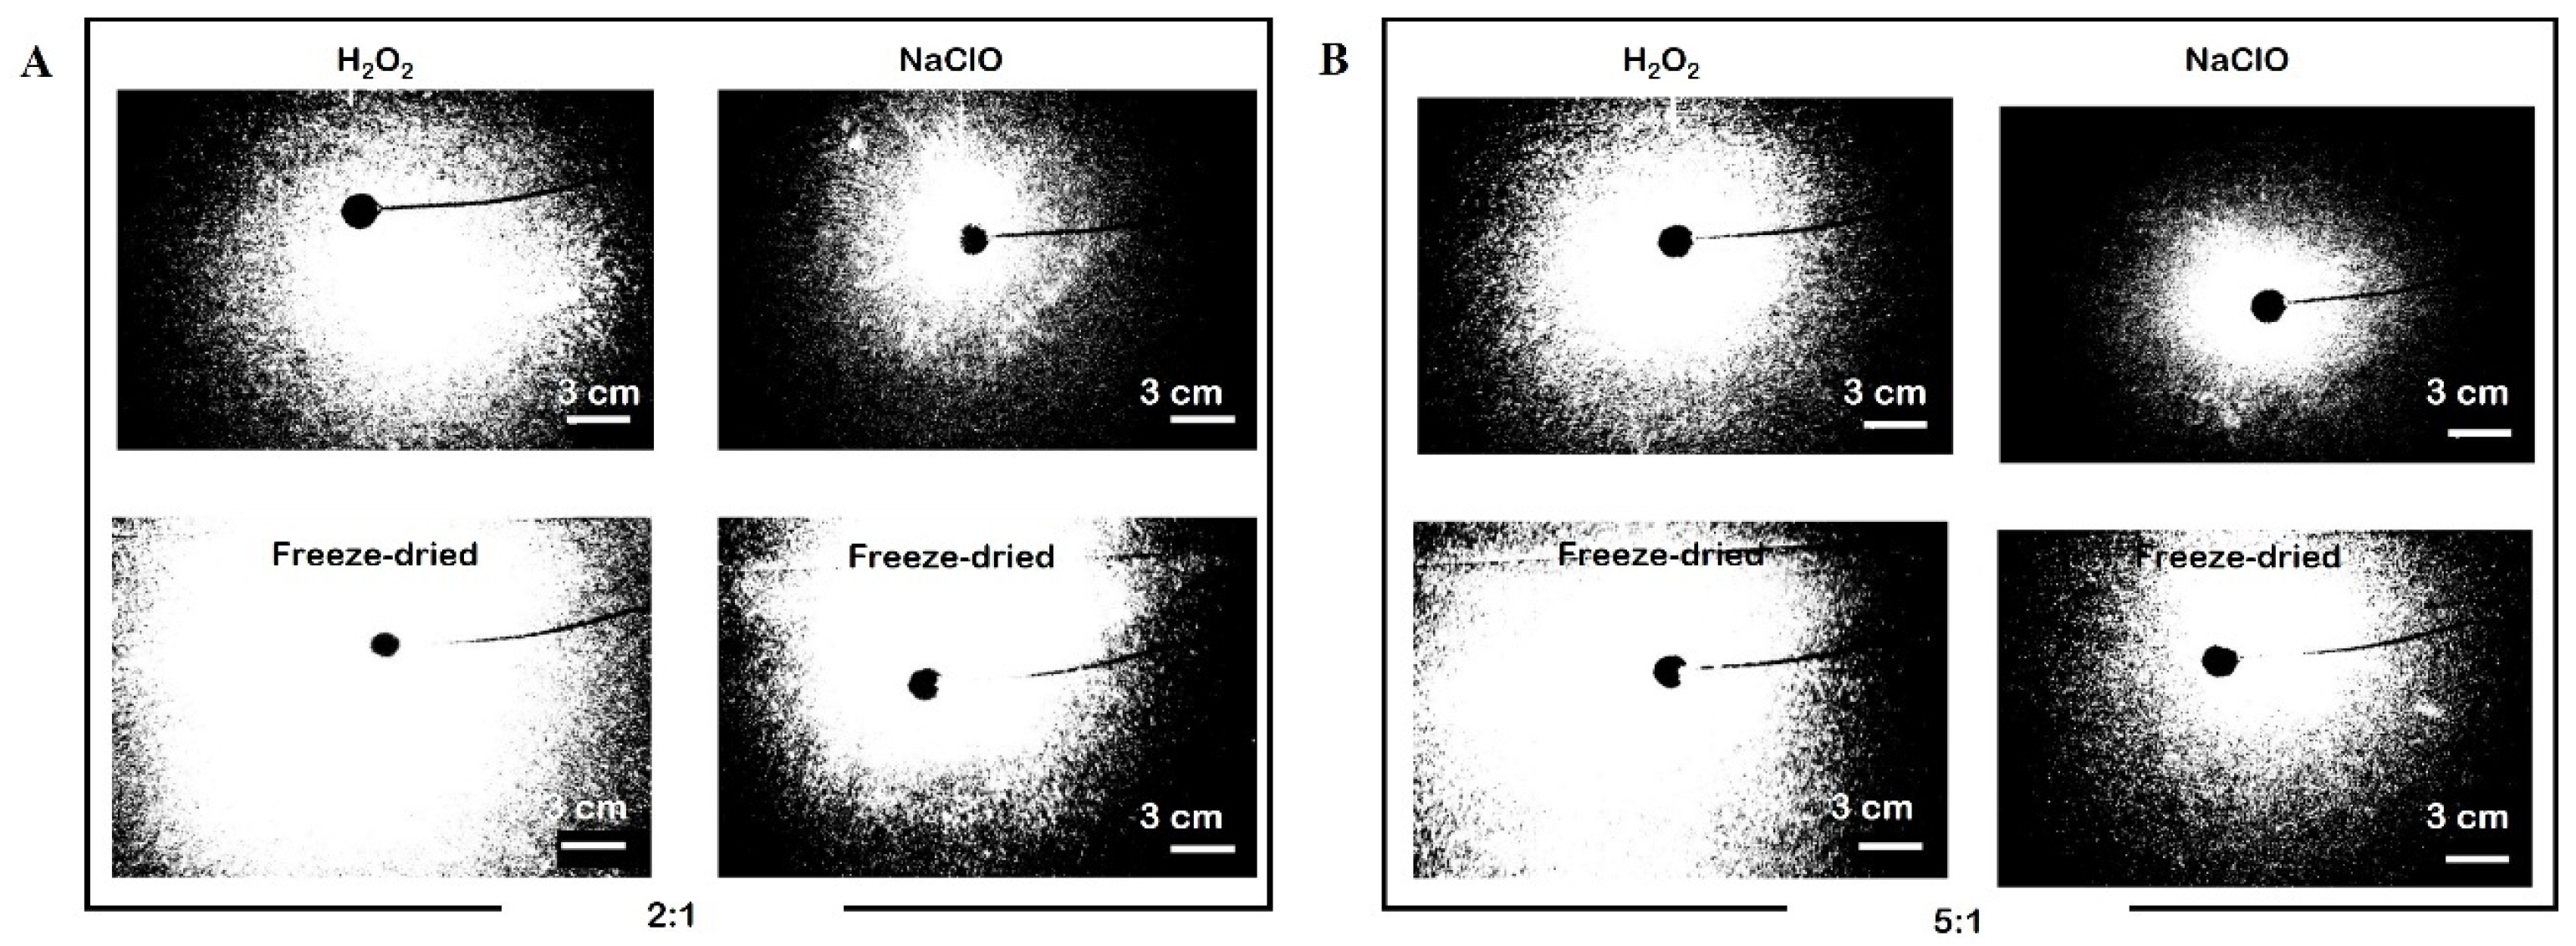
3.3. Small Angle Light Scattering

The Small Angle Light Scattering (SALS) data presented in Figure 7 provide insights into the microstructural characteristics of polymer-impregnated cork samples. The observed scattering patterns arise primarily from variations in the refractive index due to the presence of air bubbles trapped during polymer impregnation, which serve as scattering centres.
The samples obtained after H2O2 bleaching treatment exhibited a distinguishable scattering pattern, whereas those bleached with NaClO were largely opaque, absorbing most of the incident light. This contrast suggests that the microstructure of the material after NaClO treatment significantly reduces transmitted light intensity, possibly due to structural alterations or increased absorption effects rather than scattering. A key aspect of SALS analysis is the correlation between the scattering intensity and the characteristic size of inhomogeneities. The scattering intensity, I(q), follows the relation I q P q S ( q ) , where q is the scattering vector ( q = 4 π λ s i n ( θ ) ), P(q) is the form factor related to the size and shape of the scatterers, and S(q) is the structure factor describing their spatial arrangement. Given that the scattering patterns radius for the 2:1 polymer-to-hardener ratio compared to the 5:1 ratio, this suggest that the 2:1 sample contain larger or more numerous air inclusions. This is consistent with a higher degree of light deflection, as larger scatterers increase the low angle scattering intensity. The 5:1 polymer-to-hardener ratio, in contrast, results in reduced scattering, indicating a more homogeneous polymer distribution with fewer trapped air bubbles.
For a more quantitative assessment, the Guinier approximation could be applied in the low-q region:
I q = I 0 e x p q 2 R g 2 3
where Rg is the radius of gyration of the scatterers. By estimating Rg from the scattering profiles, one could derive a more precise understanding of the bubble size distribution and validate the observed trend. Further refinement of the analysis would involve fitting the scattering data to models such as the Debye–Bueche equation [59] for heterogeneous materials or the Beaucage model [60] for hierarchical structures. Such an approach would provide a more rigorous characterization of the polymer–cork interface and air inclusion morphology, but these analyses are out of the scope of the present work

4. Conclusions and Future Perspectives

This study aimed to develop transparent materials from cork employing various chemical treatments inspired by the methods used to produce transparent wood. A combination of delignification and bleaching the partial removal of cork’s natural pigments while preserving its intrinsic 3D cellular structure. The presence of multiple microscopic air droplets of varying sizes in the final translucid cork samples suggested that the forced polymer impregnation process was not conducted under optimal conditions.
The choice of bleaching agent was found to be critical in the chemical process. Bleaching with sodium hypochlorite yielded whiter samples compared to peroxide-based bleaching; however, this came at the cost of significantly reduced mechanical strength, rendering the material highly fragile. Additionally, optimizing the resin-to-hardener ratio was essential, as a higher resin content facilitated better polymer infiltration, enhancing transparency.
Among the investigated samples, mCork exhibited the most promising optical properties, likely due to its greater surface area and the selected polymer ratio. Samples with a lower polymer ratio contained more air bubbles, whereas mCork achieved superior optical performance, with a spectral transmittance of 5.11%, indicating higher light transmission than other variants.
Although fully transparent cork was not achieved, the resulting material exhibited translucent characteristics. The findings in this study lay the groundwork for further advancements in transparent cork manufacturing. Future research should focus on identifying an optimal bleaching agent that balances transparency and mechanical integrity, refining the polymer infiltration process for improved efficiency, and developing strategies to prevent air bubble formation during infiltration.

Author Contributions

Conceptualization, A.P.C.A. and M.H.G.; methodology, A.P.C.A. and M.H.G.; investigation, P.G., P.L.A., M.H.G., and A.P.C.A.; writing—original draft preparation, P.G.; writing—review and editing, A.P.C.A., P.L.A., and M.H.G.; supervision, A.P.C.A. and M.H.G. All authors have read and agreed to the published version of the manuscript.

Funding

This research was funded by the Institute of Nanostructures, Nano-modelling, and Nanofabrication—i3N (LA/P/0037/2020, UIDP/50025/2020 and UIDB/50025/2020), which is financed by national funds from FCT/MCTES and Fundação para a Ciência e a Tecnologia, I.P. P. L. A. and M. H. G. are grateful for the financial support from FCT, though the research project grant ColorSafe—PTDC/04191/2022. A. P. C. Almeida is grateful for the financial support from FCT, Portugal, through the research project grant DynaCellCollect—2022.01619.PTDC (https://doi.org/10.54499/2022.01619.PTDC) and Scientific Employment Stimulus—Individual Call (2023.06206.CEECIND, https://doi.org/10.54499/2023.06206.CEECIND/CP2836/CT0012) attributed to her.

Data Availability Statement

No new data were created.

Conflicts of Interest

The authors declare no conflicts of interest.

References

  1. Gibson, L.J. Cork: Structure, properties, applications. Arnoldia 2016, 74, 23–27. [Google Scholar] [CrossRef]
  2. Pullar, R.C.; Novais, R.M. Ecoceramics. Mater. Today 2017, 20, 45–46. [Google Scholar] [CrossRef]
  3. AmorimCorkComposites. Cork Oak Forest. Available online: https://amorimcorkcomposites.com/en-us/why-cork/facts-and-curiosities/about-oak-forest/ (accessed on 9 June 2023).
  4. Cortiça, A.P.d. Boletim Estatístico 2020. 2020. Available online: https://apcor.pt/pt/anuario (accessed on 9 June 2023).
  5. Gil, L. New Cork-Based Materials and Applications. Materials 2015, 8, 625–637. [Google Scholar] [CrossRef] [PubMed]
  6. De Oliveira, H.; Yoon, B.; Michaud, V.; Nam, J.-D.; Suhr, J. All natural cork composites with suberin-based polyester and lignocellulosic residue. Ind. Crops Prod. 2017, 109, 843–849. [Google Scholar] [CrossRef]
  7. Marques, A.V.; Rencoret, J.; Gutiérrez, A.; Río, J.C.d.; Pereira, H. Ferulates and lignin structural composition in cork. Holzforschung 2016, 70, 275–289. [Google Scholar] [CrossRef]
  8. Pereira, H. Chemical composition and variability of cork from Quercus suber L. Wood Sci. Technol. 1988, 22, 211–218. [Google Scholar] [CrossRef]
  9. Gil, L.; Moiteiro, C. Cork. In Ullmann’s Encyclopedia of Industrial Chemistry; Wiley: Hoboken, NJ, USA, 2000. [Google Scholar]
  10. Pereira, H.; Emília Rosa, M.; Fortes, M.A. The cellular structure of cork from Quercus suber L. IAWA J. 1987, 8, 213–218. [Google Scholar] [CrossRef]
  11. Silva, S.P.; Sabino, M.A.; Fernandes, E.M.; Correlo, V.M.; Boesel, L.F.; Reis, R.L. Cork: Properties, capabilities and applications. Int. Mater. Rev. 2005, 50, 345–365. [Google Scholar] [CrossRef]
  12. Şen, A.; Miranda, I.; Pereira, H. Temperature-induced structural and chemical changes in cork from Quercus cerris. Ind. Crops Prod. 2012, 37, 508–513. [Google Scholar] [CrossRef]
  13. Oliveira, F.R.; Silva, E.A.A.; do Carmo, S.N.; Steffens, F.; Souto, A.P.G.d.V. Functionalization of natural cork composite with microcapsules after plasma treatment. Adv. Mater. Sci. Eng. 2014, 2014, 685829. [Google Scholar] [CrossRef]
  14. Leal, A.I.; Correia, R.A.; Palmeirim, J.M.; Bugalho, M.N. Is research supporting sustainable management in a changing world? Insights from a mediterranean silvopastoral system. Agrofor. Syst. 2018, 93, 355–368. [Google Scholar] [CrossRef]
  15. Zhang, J.; Koubaa, A.; Tao, Y.; Li, P.; Xing, D. The emerging development of transparent wood: Materials, characteristics, and applications. Curr. For. Rep. 2022, 8, 333–345. [Google Scholar] [CrossRef]
  16. Li, Y.; Vasileva, E.; Sychugov, I.; Popov, S.; Berglund, L. Optically transparent wood: Recent progress, opportunities, and challenges. Adv. Opt. Mater. 2018, 6, 1800059. [Google Scholar] [CrossRef]
  17. Tribot, A.; Amer, G.; Abdou Alio, M.; de Baynast, H.; Delattre, C.; Pons, A.; Mathias, J.-D.; Callois, J.-M.; Vial, C.; Michaud, P.; et al. Wood-lignin: Supply, extraction processes and use as bio-based material. Eur. Polym. J. 2019, 112, 228–240. [Google Scholar] [CrossRef]
  18. Müller, U.; Rätzsch, M.; Schwanninger, M.; Steiner, M.; Zöbl, H. Yellowing and IR-changes of spruce wood as result of UV-irradiation. J. Photochem. Photobiol. B Biol. 2003, 69, 97–105. [Google Scholar] [CrossRef]
  19. Zhu, M.; Song, J.; Li, T.; Gong, A.; Wang, Y.; Dai, J.; Yao, Y.; Luo, W.; Henderson, D.; Hu, L. Highly anisotropic, highly transparent wood composites. Adv. Mater. 2016, 28, 5181–5187. [Google Scholar] [CrossRef] [PubMed]
  20. Li, Y.; Fu, Q.; Yu, S.; Yan, M.; Berglund, L. Optically transparent wood from a nanoporous cellulosic template: Combining functional and structural performance. Biomacromolecules 2016, 17, 1358–1364. [Google Scholar] [CrossRef] [PubMed]
  21. Zhu, M.; Li, T.; Davis, C.S.; Yao, Y.; Dai, J.; Wang, Y.; AlQatari, F.; Gilman, J.W.; Hu, L. Transparent and haze wood composites for highly efficient broadband light management in solar cells. Nano Energy 2016, 26, 332–339. [Google Scholar] [CrossRef]
  22. Kim, J.S.; Lee, Y.Y.; Kim, T.H. A review on alkaline pretreatment technology for bioconversion of lignocellulosic biomass. Bioresour. Technol. 2016, 199, 42–48. [Google Scholar] [CrossRef]
  23. Ribeiro, R.A.; Júnior, S.V.; Jameel, H.; Chang, H.-M.; Narron, R.; Jiang, X.; Colodette, J.L. Chemical study of kraft lignin during alkaline delignification of E. urophylla x E. grandis hybrid in low and high residual effective alkali. ACS Sustain. Chem. Eng. 2019, 7, 10274–10282. [Google Scholar] [CrossRef]
  24. Kumar, A.; Jyske, T.; Petrič, M. Delignified wood from understanding the hierarchically aligned cellulosic structures to creating novel functional materials: A review. Adv. Sustain. Syst. 2021, 5, 2000251. [Google Scholar] [CrossRef]
  25. Fearon, O.; Kuitunen, S.; Ruuttunen, K.; Alopaeus, V.; Vuorinen, T. Detailed modeling of kraft pulping chemistry. Delignification. Ind. Eng. Chem. Res. 2020, 59, 12977–12985. [Google Scholar] [CrossRef]
  26. Bonhivers, J.-C.; Stuart, P.R. 25—Applications of process integration methodologies in the pulp and paper industry. In Handbook of Process Integration (PI); Klemeš, J.J., Ed.; Woodhead Publishing: Sawston, UK, 2013; pp. 765–798. [Google Scholar]
  27. Jardim, J.M.; Hart, P.W.; Lucia, L.A.; Jameel, H.; Chang, H.-m. The effect of the kraft pulping process, wood species, and pH on lignin recovery from black liquor. Fibers 2022, 10, 16. [Google Scholar] [CrossRef]
  28. Schlee, P.; Hosseinaei, O.; Baker, D.; Landmér, A.; Tomani, P.; Mostazo-López, M.J.; Cazorla-Amorós, D.; Herou, S.; Titirici, M.-M. From waste to wealth: From kraft lignin to free-standing supercapacitors. Carbon 2019, 145, 470–480. [Google Scholar] [CrossRef]
  29. Mariani, A.; Malucelli, G. Transparent wood-based materials: Current state-of-the-art and future perspectives. Materials 2022, 15, 9069. [Google Scholar] [CrossRef]
  30. Born, M.; Wolf, E. 1.5. Reflection and refraction of a plane wave. In Principles of Optics, 7th ed.; Cambridge University Press: Cambridge, UK, 1999; pp. 36–37. [Google Scholar]
  31. von Hagens, G.; Tiedemann, K.; Kriz, W. The current potential of plastination. Anat. Embryol. 1987, 175, 411–421. [Google Scholar] [CrossRef]
  32. von Hagens, G. Animal and vegetal tissues permanently preserved by synthetic resin impregnation. U.S. Patent US-4205059-A, 14 July 1981. [Google Scholar]
  33. Chen, H.; Baitenov, A.; Li, Y.; Vasileva, E.; Popov, S.; Sychugov, I.; Yan, M.; Berglund, L. Thickness dependence of optical transmittance of transparent wood: Chemical modification effects. ACS Appl. Mater. Interfaces 2019, 11, 35451–35457. [Google Scholar] [CrossRef]
  34. Tirpak, A.; Young, R. Accurate Transmission measurements of translucent materials. Photonics Spectra 2008, 42, 66–69. [Google Scholar]
  35. Stamm, A.J. Wood and Cellulose Science; Ronald Press Company: New York, NY, USA, 1964. [Google Scholar]
  36. Borrega, M.; Ahvenainen, P.; Serimaa, R.; Gibson, L. Composition and structure of balsa (Ochroma pyramidale) wood. Wood Sci. Technol. 2015, 49, 403–420. [Google Scholar] [CrossRef]
  37. Eichhorn, S.J.; Dufresne, A.; Aranguren, M.; Marcovich, N.E.; Capadona, J.R.; Rowan, S.J.; Weder, C.; Thielemans, W.; Roman, M.; Renneckar, S.; et al. Review: Current international research into cellulose nanofibres and nanocomposites. J. Mater. Sci. 2010, 45, 1–33. [Google Scholar] [CrossRef]
  38. Li, Y.; Yang, X.; Fu, Q.; Rojas, R.; Yan, M.; Berglund, L. Towards centimeter thick transparent wood through interface manipulation. J. Mater. Chem. A 2018, 6, 1094–1101. [Google Scholar] [CrossRef]
  39. Fink, S. Transparent Wood—A New Approach in the functional study of wood structure. Holzforschung 1992, 46, 403–408. [Google Scholar] [CrossRef]
  40. Okahisa, Y.; Yoshida, A.; Miyaguchi, S.; Yano, H. Optically transparent wood–cellulose nanocomposite as a base substrate for flexible organic light-emitting diode displays. Compos. Sci. Technol. 2009, 69, 1958–1961. [Google Scholar] [CrossRef]
  41. Li, Y.; Yu, S.; Veinot, J.G.C.; Linnros, J.; Berglund, L.; Sychugov, I. Luminescent transparent wood. Adv. Opt. Mater. 2017, 5, 1600834. [Google Scholar] [CrossRef]
  42. Vasileva, E.; Li, Y.; Sychugov, I.; Mensi, M.; Berglund, L.; Popov, S. Lasing from organic dye molecules embedded in transparent wood. Adv. Opt. Mater. 2017, 5, 1700057. [Google Scholar] [CrossRef]
  43. Höglund, M.; Johansson, M.; Sychugov, I.; Berglund, L.A. Transparent wood biocomposites by fast UV-curing for reduced light-scattering through wood/thiol–ene interface design. ACS Appl. Mater. Interfaces 2020, 12, 46914–46922. [Google Scholar] [CrossRef] [PubMed]
  44. Li, Y.; Cheng, M.; Jungstedt, E.; Xu, B.; Sun, L.; Berglund, L. Optically transparent wood substrate for perovskite solar cells. ACS Sustain. Chem. Eng. 2019, 7, 6061–6067. [Google Scholar] [CrossRef]
  45. Mi, R.; Li, T.; Dalgo, D.; Chen, C.; Kuang, Y.; He, S.; Zhao, X.; Xie, W.; Gan, W.; Zhu, J.; et al. A clear, strong, and thermally insulated transparent wood for energy efficient windows. Adv. Funct. Mater. 2020, 30, 1907511. [Google Scholar] [CrossRef]
  46. Zhang, L.; Wang, A.; Zhu, T.; Chen, Z.; Wu, Y.; Gao, Y. Transparent wood composites fabricated by impregnation of epoxy resin and W-Doped VO2 nanoparticles for application in energy-saving windows. ACS Appl. Mater. Interfaces 2020, 12, 34777–34783. [Google Scholar] [CrossRef]
  47. Xia, Q.; Chen, C.; Li, T.; He, S.; Gao, J.; Wang, X.; Hu, L. Solar-assisted fabrication of large-scale, patternable transparent wood. Sci. Adv. 2021, 7, eabd7342. [Google Scholar] [CrossRef]
  48. Li, H.; Guo, X.; He, Y.; Zheng, R. House model with 2–5 cm thick translucent wood walls and its indoor light performance. Eur. J. Wood Wood Prod. 2019, 77, 843–851. [Google Scholar] [CrossRef]
  49. Wang, X.; Zhan, T.; Liu, Y.; Shi, J.; Pan, B.; Zhang, Y.; Cai, L.; Shi, S.Q. Large-size transparent wood for energy-saving building applications. ChemSusChem 2018, 11, 4086–4093. [Google Scholar] [CrossRef]
  50. Jia, C.; Chen, C.; Mi, R.; Li, T.; Dai, J.; Yang, Z.; Pei, Y.; He, S.; Bian, H.; Jang, S.-H.; et al. Clear wood toward high-performance building materials. ACS Nano 2019, 13, 9993–10001. [Google Scholar] [CrossRef] [PubMed]
  51. Schneider, C.A.; Rasband, W.S.; Eliceiri, K.W. NIH Image to ImageJ: 25 years of image analysis. Nature Methods 2012, 9, 671–675. [Google Scholar] [CrossRef]
  52. Almeida, A.P.C.; Querciagrossa, L.; Silva, P.E.S.; Gonçalves, F.; Canejo, J.P.; Almeida, P.L.; Godinho, M.H.; Zannoni, C. Reversible water driven chirality inversion in cellulose-based helices isolated from Erodium awns. Soft Matter 2019, 15, 2838–2847. [Google Scholar] [CrossRef] [PubMed]
  53. Rosa, M.E.; Pereira, H.; Fortes, M.A. Effect of hot water treatment on the structure and properties of cork. Wood Fiber Sci. 1990, 22, 149–164. [Google Scholar]
  54. Berlanga-Del Pozo, M.; Gallardo-Guerrero, L.; Gandul-Rojas, B. Influence of alkaline treatment on structural modifications of clorophyll pigments in NaOH-treated table olives preserved without fermentation. Foods 2020, 9, 701. [Google Scholar] [CrossRef]
  55. Herstedt, L.; Herstedt, M. Chemical bleaching of wood: An investigation into the bleaching of mahogany, walnut, rosewood, padauk, and purpleheart. Stud. Conserv. 2017, 62, 162–172. [Google Scholar] [CrossRef]
  56. Potucek, F.; Milichovsky, M. Kraft pulp bleaching with hydrogen peroxide and pancreatic acid. Chem. Pap. 2000, 54, 406–411. [Google Scholar]
  57. Abbott, T.P.; Palmer, D.M.; Gordon, S.H.; Bagby, M.O. Solid state analysis of plant polymers by FTIR. J. Wood Chem. Technol. 1988, 8, 1–28. [Google Scholar] [CrossRef]
  58. Lopes, M.H.; Neto, C.P.; Barros, A.S.; Rutledge, D.; Delgadillo, I.; Gil, A.M. Quantitation of aliphatic suberin in Quercus suber L. cork by FTIR spectroscopy and solid-state 13C-NMR spectroscopy. Biopolymers 2000, 57, 344–351. [Google Scholar] [CrossRef] [PubMed]
  59. Debye, P.; Bueche, A.M. Scattering by an inhomogeneous solid. J. Appl. Phys. 1949, 20, 518–525. [Google Scholar] [CrossRef]
  60. Beaucage, G. 2.14—Combined small-angle scattering for characterization of hierarchically structured polymer systems over nano-to-micron meter: Part II theory. In Polymer Science: A Comprehensive Reference; Matyjaszewski, K., Möller, M., Eds.; Elsevier: Amsterdam, The Netherlands, 2012; pp. 399–409. [Google Scholar]
Figure 1. Cork materials: (A) cubic-shape cork samples (cCork); (B) micronized pieces of cork (mCork); and (C) i—delignified cCork (stored in ethanol), ii—delignified mCork (stored in ethanol), and iii—filtrate from delignification process of mCork.
Macromol 05 00017 g001
Figure 2. Bleaching treatment: (A) i—delignified cCork, ii—bleached cCork after treatment with H2O2, and iii—bleached cCork after treatment with NaClO and (B) i—delignified mCork, ii—bleached mCork after treatment with H2O2, and iii—bleached mCork after treatment with NaClO. All the samples are immersed in ethanol.
Macromol 05 00017 g002
Figure 3. Forced polymer impregnation of cCork and mCork bleached samples, before and after freeze-drying using different polymer–hardener ratios (2:1 and 5:1).
Macromol 05 00017 g003
Figure 4. ATR-FTIR spectrum of mCork: (A) study of the influence of the delignification step—pristine cork (black line), delignified mCork (blue line), and filtrate (orange line) and (B) influence of the bleaching agent i) spectrum of pristine cork (black line), cCork and mCork freeze-dried after H2O2 bleaching treatment (red line), and freeze-dried after NaClO bleaching treatment (green line). Stretching vibration νOH “depression” zone between 3500 cm−1 and 3200 cm−1 (grey area); aromatic zone between 1600 cm−1 and 1500 cm−1 (red area); “fingerprint” zone between 1250 cm−1 and 900 cm−1 (green zone).
Macromol 05 00017 g004
Figure 5. Scanning electron microscopy images showing the morphology of (A) the pristine cork wall and (B) cCork wall after bleaching treatment using H2O2 and freeze-drying.
Macromol 05 00017 g005
Figure 6. Spectral transmittance values (%) for (A) 2:1 polymer ratio and (B) 5:1 polymer ratio for cCork and mCork impregnated samples: after bleaching with H2O2 (grey bars); after bleaching with H2O2 and freeze-drying (red bars); after bleaching with NaClO (blue bars); and after bleaching with NaClO and freeze-drying (green bars).
Macromol 05 00017 g006
Figure 7. Small angle light scattering images of transparent samples: (A) polymer impregnated cork (2:1 ratio) after bleaching with H2O2 or NaClO and after freeze-drying of H2O2 or NaClO bleaching, and (B) polymer impregnated Cork (5:1 ratio) after bleaching with H2O2 or NaClO and after freeze-drying of H2O2 or NaClO bleaching.
Macromol 05 00017 g007
Disclaimer/Publisher’s Note: The statements, opinions and data contained in all publications are solely those of the individual author(s) and contributor(s) and not of MDPI and/or the editor(s). MDPI and/or the editor(s) disclaim responsibility for any injury to people or property resulting from any ideas, methods, instructions or products referred to in the content.

