Article

SSR Linkage Maps and Identification of QTL Controlling Morpho-Phenological Traits in Two Iranian Wheat RIL Populations

by
Hossein Sabouri
1,*,
Sharifeh Mohammad Alegh
1,
Narges Sahranavard
2 and
Somayyeh Sanchouli
1,*
1
Department of Plant Production, College of Agricultural Science and Natural Resources, Gonbad Kavous University, Gonbad Kavous 4971799151, Iran
2
Department of Biology, College of Science, Gonbad Kavous University, Gonbad Kavous 4971799151, Iran
*
Authors to whom correspondence should be addressed.
BioTech 2022, 11(3), 32; https://doi.org/10.3390/biotech11030032
Submission received: 27 May 2022 / Revised: 22 July 2022 / Accepted: 2 August 2022 / Published: 8 August 2022

Abstract

:
Wheat is one of the essential grains grown in large areas. Identifying the genetic structure of agronomic and morphological traits of wheat can help to discover the genetic mechanisms of grain yield. In order to map the morpho-phenological traits, an experiment was conducted in the two cropping years of 2020 and 2021 on the university farm of the Faculty of Agriculture, GonbadKavous University. This study used two F8 populations, including 120 lines resulting from Gonbad × Zagros and Gonbad × Kuhdasht. The number of days to physiological maturity, number of days to flowering, number of germinated grains, number of tillers, number of tillers per plant, grain filling periods, plant height, peduncle length, spike length, awn length, spike weight, peduncle diameter, flag leaf length and weight, number of spikelets per spike, number of grains per spike, grain length, grain width, 1000-grain weight, biomass, grain yield, harvest index, straw-weight, and number of fertile spikelets per spike were measured. A total of 21 and 13 QTLs were identified for 11 and 13 traits in 2020 and 2021, respectively. In 2020, qGL-3D and qHI-1A were identified for grain length and harvest index on chromosomes 3D and 1A, explaining over 20% phenotypic variation, respectively. qNT-5B, qNTS-2D, and qSL-1D were identified on chromosomes 5B, 2D, and 1D with the LOD scores of 4.5, 4.13, and 3.89 in 2021, respectively.

1. Introduction

Wheat (Triticumaesivum L.) is a critical crop cultivated in a wide range of areas and is one of the main sources of carbohydrates, protein, fiber, amino acids, minerals, and vitamins. Wheat provides about 20% of the total protein and calories needed daily by 4.5 billion people worldwide [1,2,3]. Reducing agricultural farms and climate change is a significant challenge in supplying wheat to the world’s growing population [4]. Therefore, there is an urgent need to increase wheat productivity, and growing high-yielding wheat cultivars is one of the main strategies to increase total food production [5]. The main traits that determine the yield of wheat are the number of spikes, the number of grains per spike, and the weight of 1000 grains. In addition, spike length and the number of spikelets per spike, as well as the length, width, and area of flag leaf, greatly affect yield [6,7,8,9].
Significant advances in molecular biology and biostatistics have led to identifying several genes for grain-yield-related traits [10,11,12,13].
Identifying the genetic structure of yield-related traits classified as quantitative traits can help to discover the genetic mechanisms of grain yield [4,14,15,16].
Using different molecular markers and linkage maps in wheat, it is possible to identify markers associated with traits and use them in marker selection programs [14,17,18,19,20].
Hu et al. [4] have identified 161 quantitative trait loci (QTLs) for yield-related traits, including grain yield per plant; the number of spikes per plant; the number of kernel per spike; spike length; the number of spikelet per spike; flag leaf length; flag leaf width; flag leaf area; plant height; anthesis date; and date heading on 21 chromosomes except for 2D, 3D, and 6D. Chopra et al. [21] have evaluated a population of 206 recombinant inbred lines (RILs) leading to wheat cultivars WL711 and C306 under drought stress conditions (F8 and F10). Major QTLs, including qFLAWD.2D.1, qCMSWD.3B.3, and qCMSWD.3B.3, for flag leaf area, flag leaf length, flag leaf width, and cell membrane constant were identified on chromosomes 2DS and 3BS. Liu et al. [22] have examined a population of 276 RILs resulting from SYN-D × Weebill1 under drought and heat stresses. Finally, 71 QTLs were identified for the study traits. Five QTLs for yield and traits related to drought, heat, and drought tolerance were identified on chromosomes 2A, 3D, 6D (two QTLs), and 7B.
Owing to the importance of identifying QTLs controlling yield and yield-related traits, the present study was conducted to detect genes controlling quantitative traits in RIL populations of Iranian wheat resulting from Zagros × Gonbad and Kuhdash × Gonbad in 2020 and 2021.

2. Materials and Methods

This study was carried out in 2020 and 2021 in the research farm of Gonbad Kavous University at Latitude and Longitude 37°15′0″ north and 55°10′2″ east, with an altitude of 46 m above sea level, which has a warm and semi-arid Mediterranean climate based on the climatic classification of Koppen.
The rain and temperature values in 2020 and 2021 are presented in Figure 1, and other meteorological statistics are given in Tables S1 and S2. In this study, 120 lines of two F8 RIL populations resulting from Zagros × Gonbad and Kuhdasht × Gonbad were cultivated according to the alpha lattice design. Planting rows were 2 m in length, and the row spacing was 20 cm. The number of germinated seeds (NGS), the number of days to flowering (NDF), the number of days to physiological maturity (NDM), grain filling period (GFP), the number of tillers (NT), plant height (PH), peduncle length (PDL), peduncle diameter (PD), spike length (SPL), spike weight (WSP), flag leaf length (FLL), flag leaf width (FLW), the number of spikelets per spike (NSSP), the number of fertile spikelets per spike (NFSP) the number of grains per spike (NGSP), grain length (GL), grain width (GW), 1000-grain weight (TGW), awn length (AWL), biomass yield (BYI), grain yield (GYI), straw-weight (STW), and harvest index (HI) were measured.
In order to extract DNA, young leaves of 120 lines from each population along with the parents were used, and then genomic DNA was extracted according to the modified cetyltrimethylammonium bromide (CTAB) method [23]. A polymerase chain reaction was performed for 600 simple sequence repeat (SSR) primers (https://wheat.pw.usda.gov/GG3/, accessed on 30 March 2020) for each population using a 10 μL BioRad thermocycler. PCR solution contained 1X PCR buffer, 0.25 μL MgCl2, 1 μldNTPs, 0.5 μL of each primer with 5 mM concentration, Taq polymerase, and 50 ng template DNA. After 5 min of denaturing at 94 °C, 35 cycles were performed, including 1 min at 94 °C, 45 s at an annealing temperature of 55 °C, 1 min at 72 °C, and final expansion for 7 min at 72 °C. The amplification products were separated by electrophoresis in a 3% agarose geland visualized under UV after staining with ethidium bromide or electrophoresis in a 6% polyacrylamide gel visualized by a simplified silver staining method [24].
A total of 689 SSR primers were used in this research. These SSR primer pairs were surveyed based on their polymorphism between two parents, and the primers exhibiting polymorphism were used to amplify the DNA of each plant of the RIL population.
All polymorphic SSR markers were evaluated with the χ2 test against a 1:1 segregation ratio at a 0.01 probability level using the QGene program [25]. Linkage analysis was conducted with Map Manager QTX17 [26] for the segregating polymorphic markers. The maximum-likelihood map order for the markers was determined with a logarithm of the odds (LOD) score threshold of 3.0, and used as a fixed sequence framework for integrating the linkage data from the population. All map distances (centi Morgan) were reported in Kosambi units [27], and the critical LOD score thresholds of 3.0 and 0.05 were used to determine the linkage groups and calculate map distances. Lander and Botstein [28] have established an interval mapping framework for mapping QTLs. The genome-wide composite interval mapping (gCIM) was applied to identify QTLs and examine their effects, and the point with the highest LOD was identified as the area with the highest probability of QTL. Chromosome walking was performed at 2 cm, and a LOD score of 2.5 was considered as a threshold. The QTL.gCIMapping.GUI v2.0 package was used for gCIMapping methods with R software [29].

3. Results

3.1. Gonbad Zagros RIL Population

3.1.1. Phenotypic Evaluations

The frequency distribution of phenotypic values of the study traits is shown in Figures S1 and S2 for the population resulting from Gonbad × Zagros in 2020 and 2021, respectively. The phenotypic distribution of traits was continuous and normal, a reason for the quantitative inheritance of the study traits.
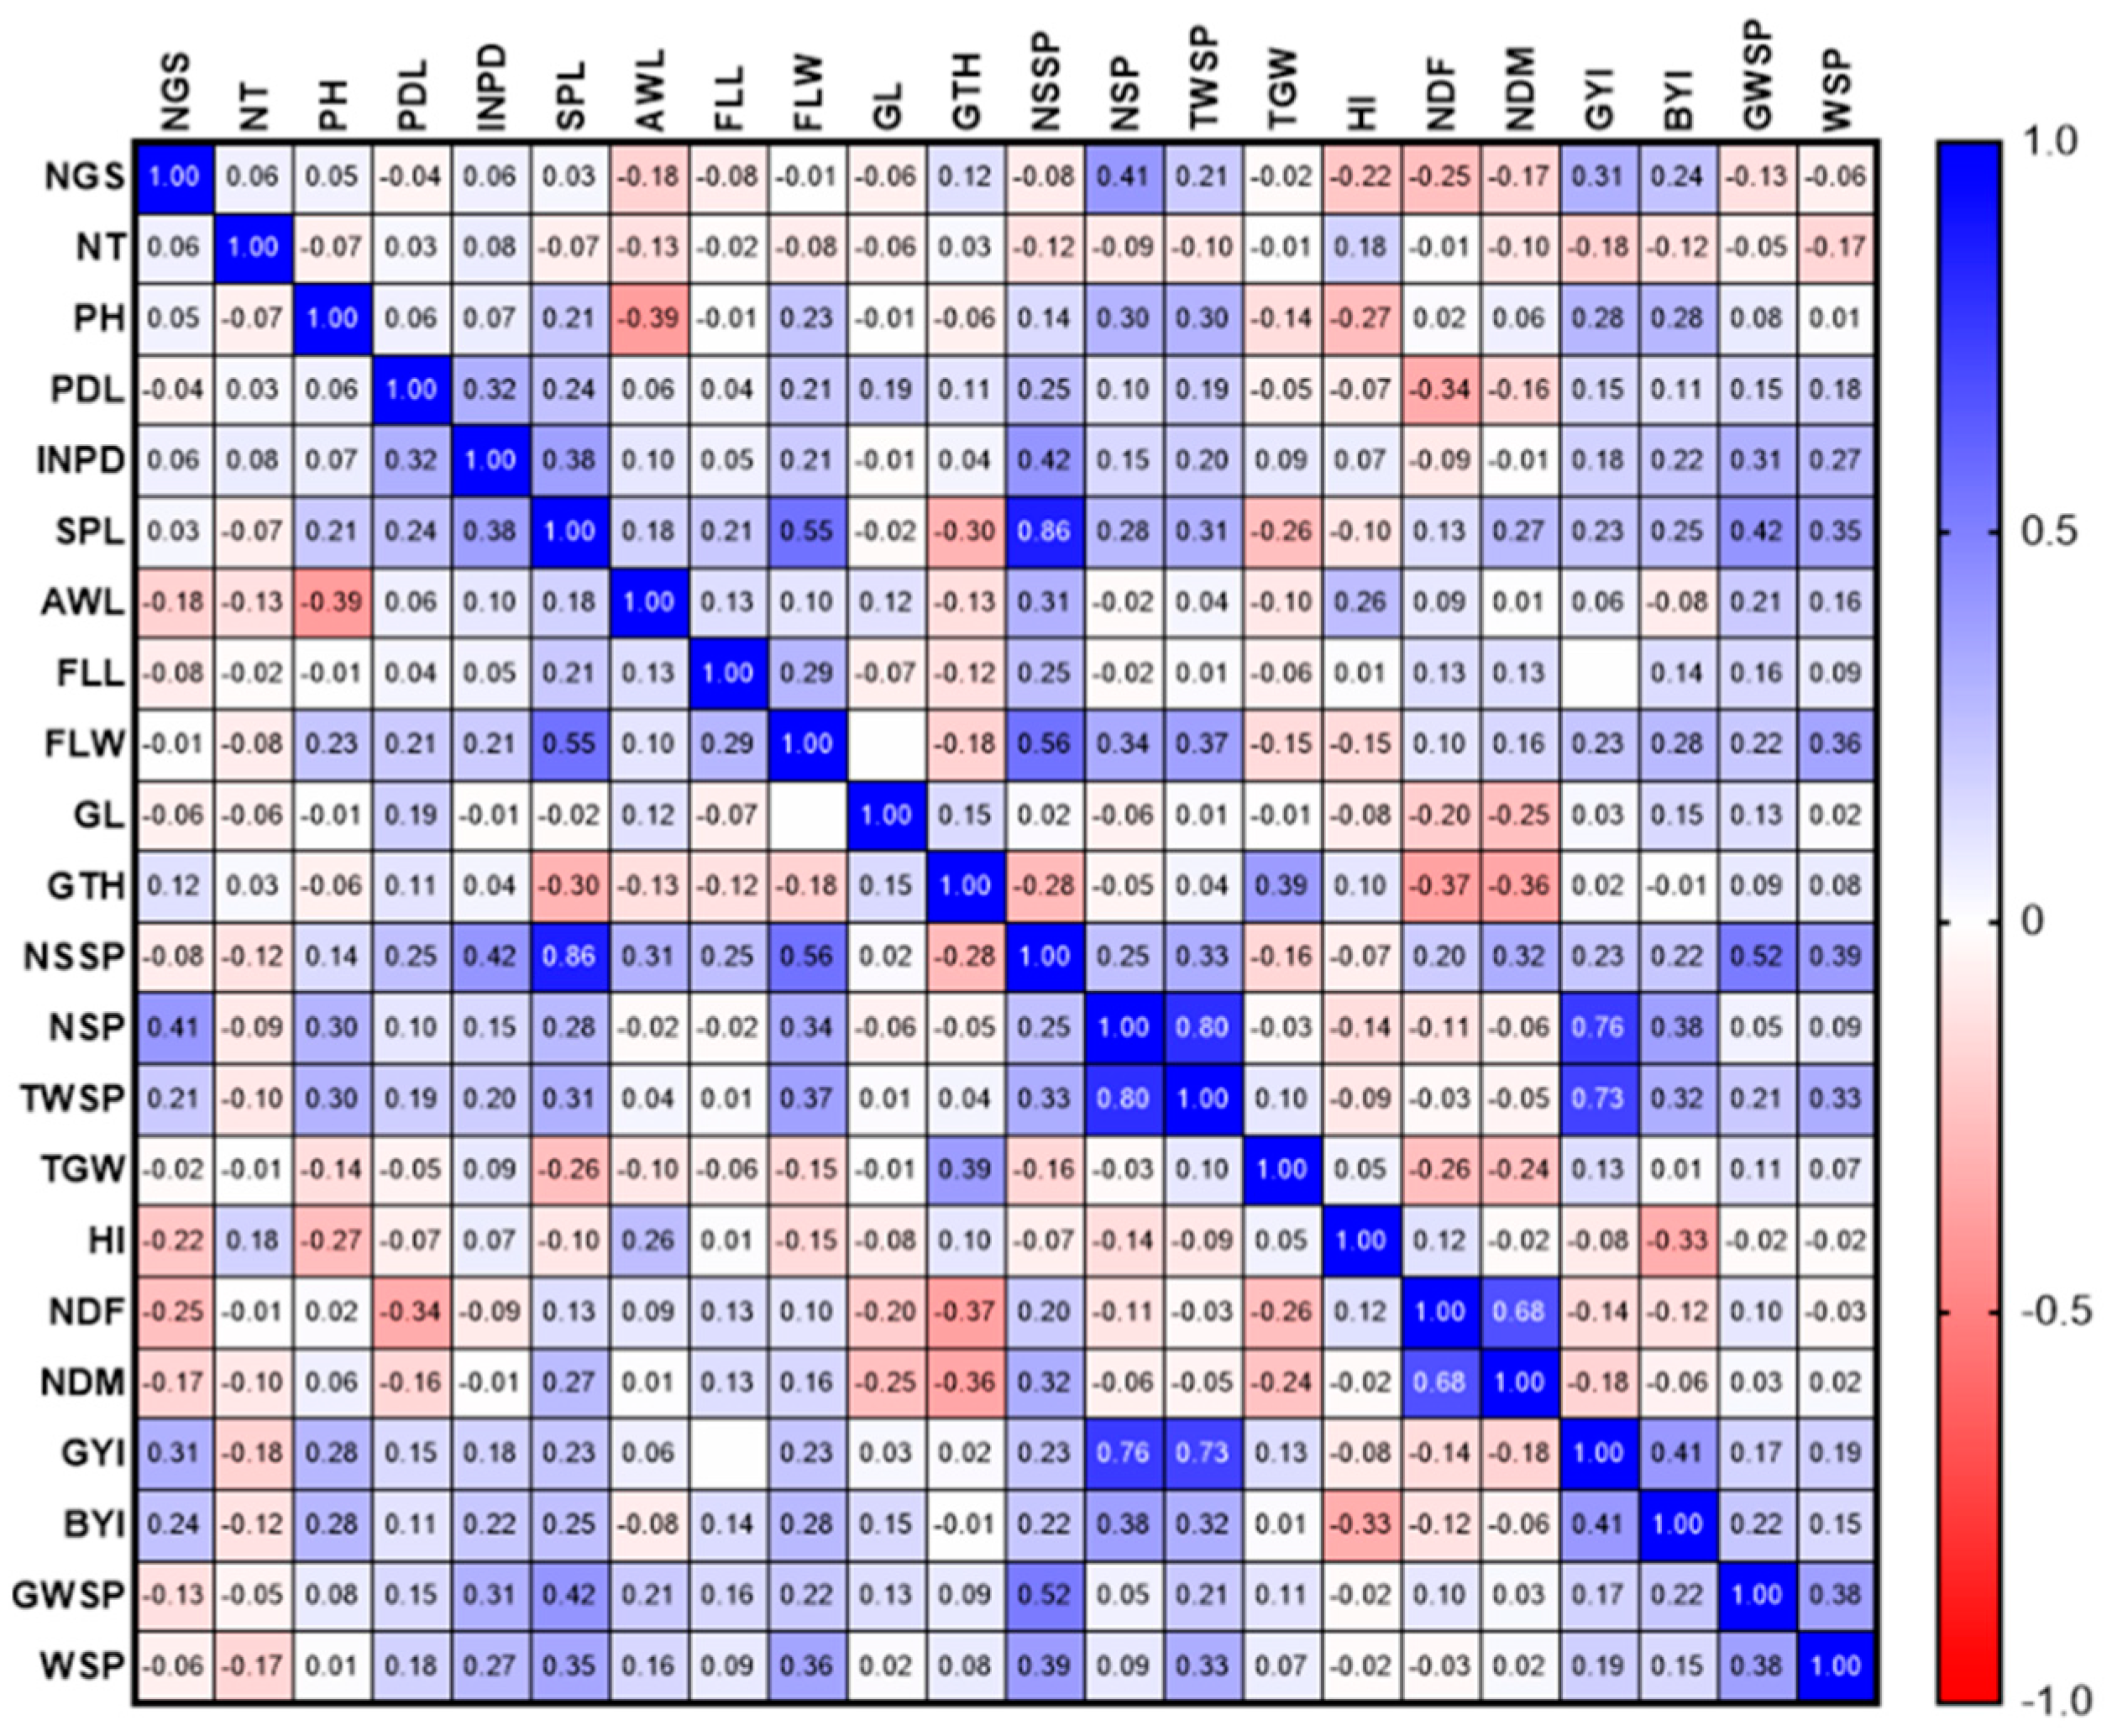
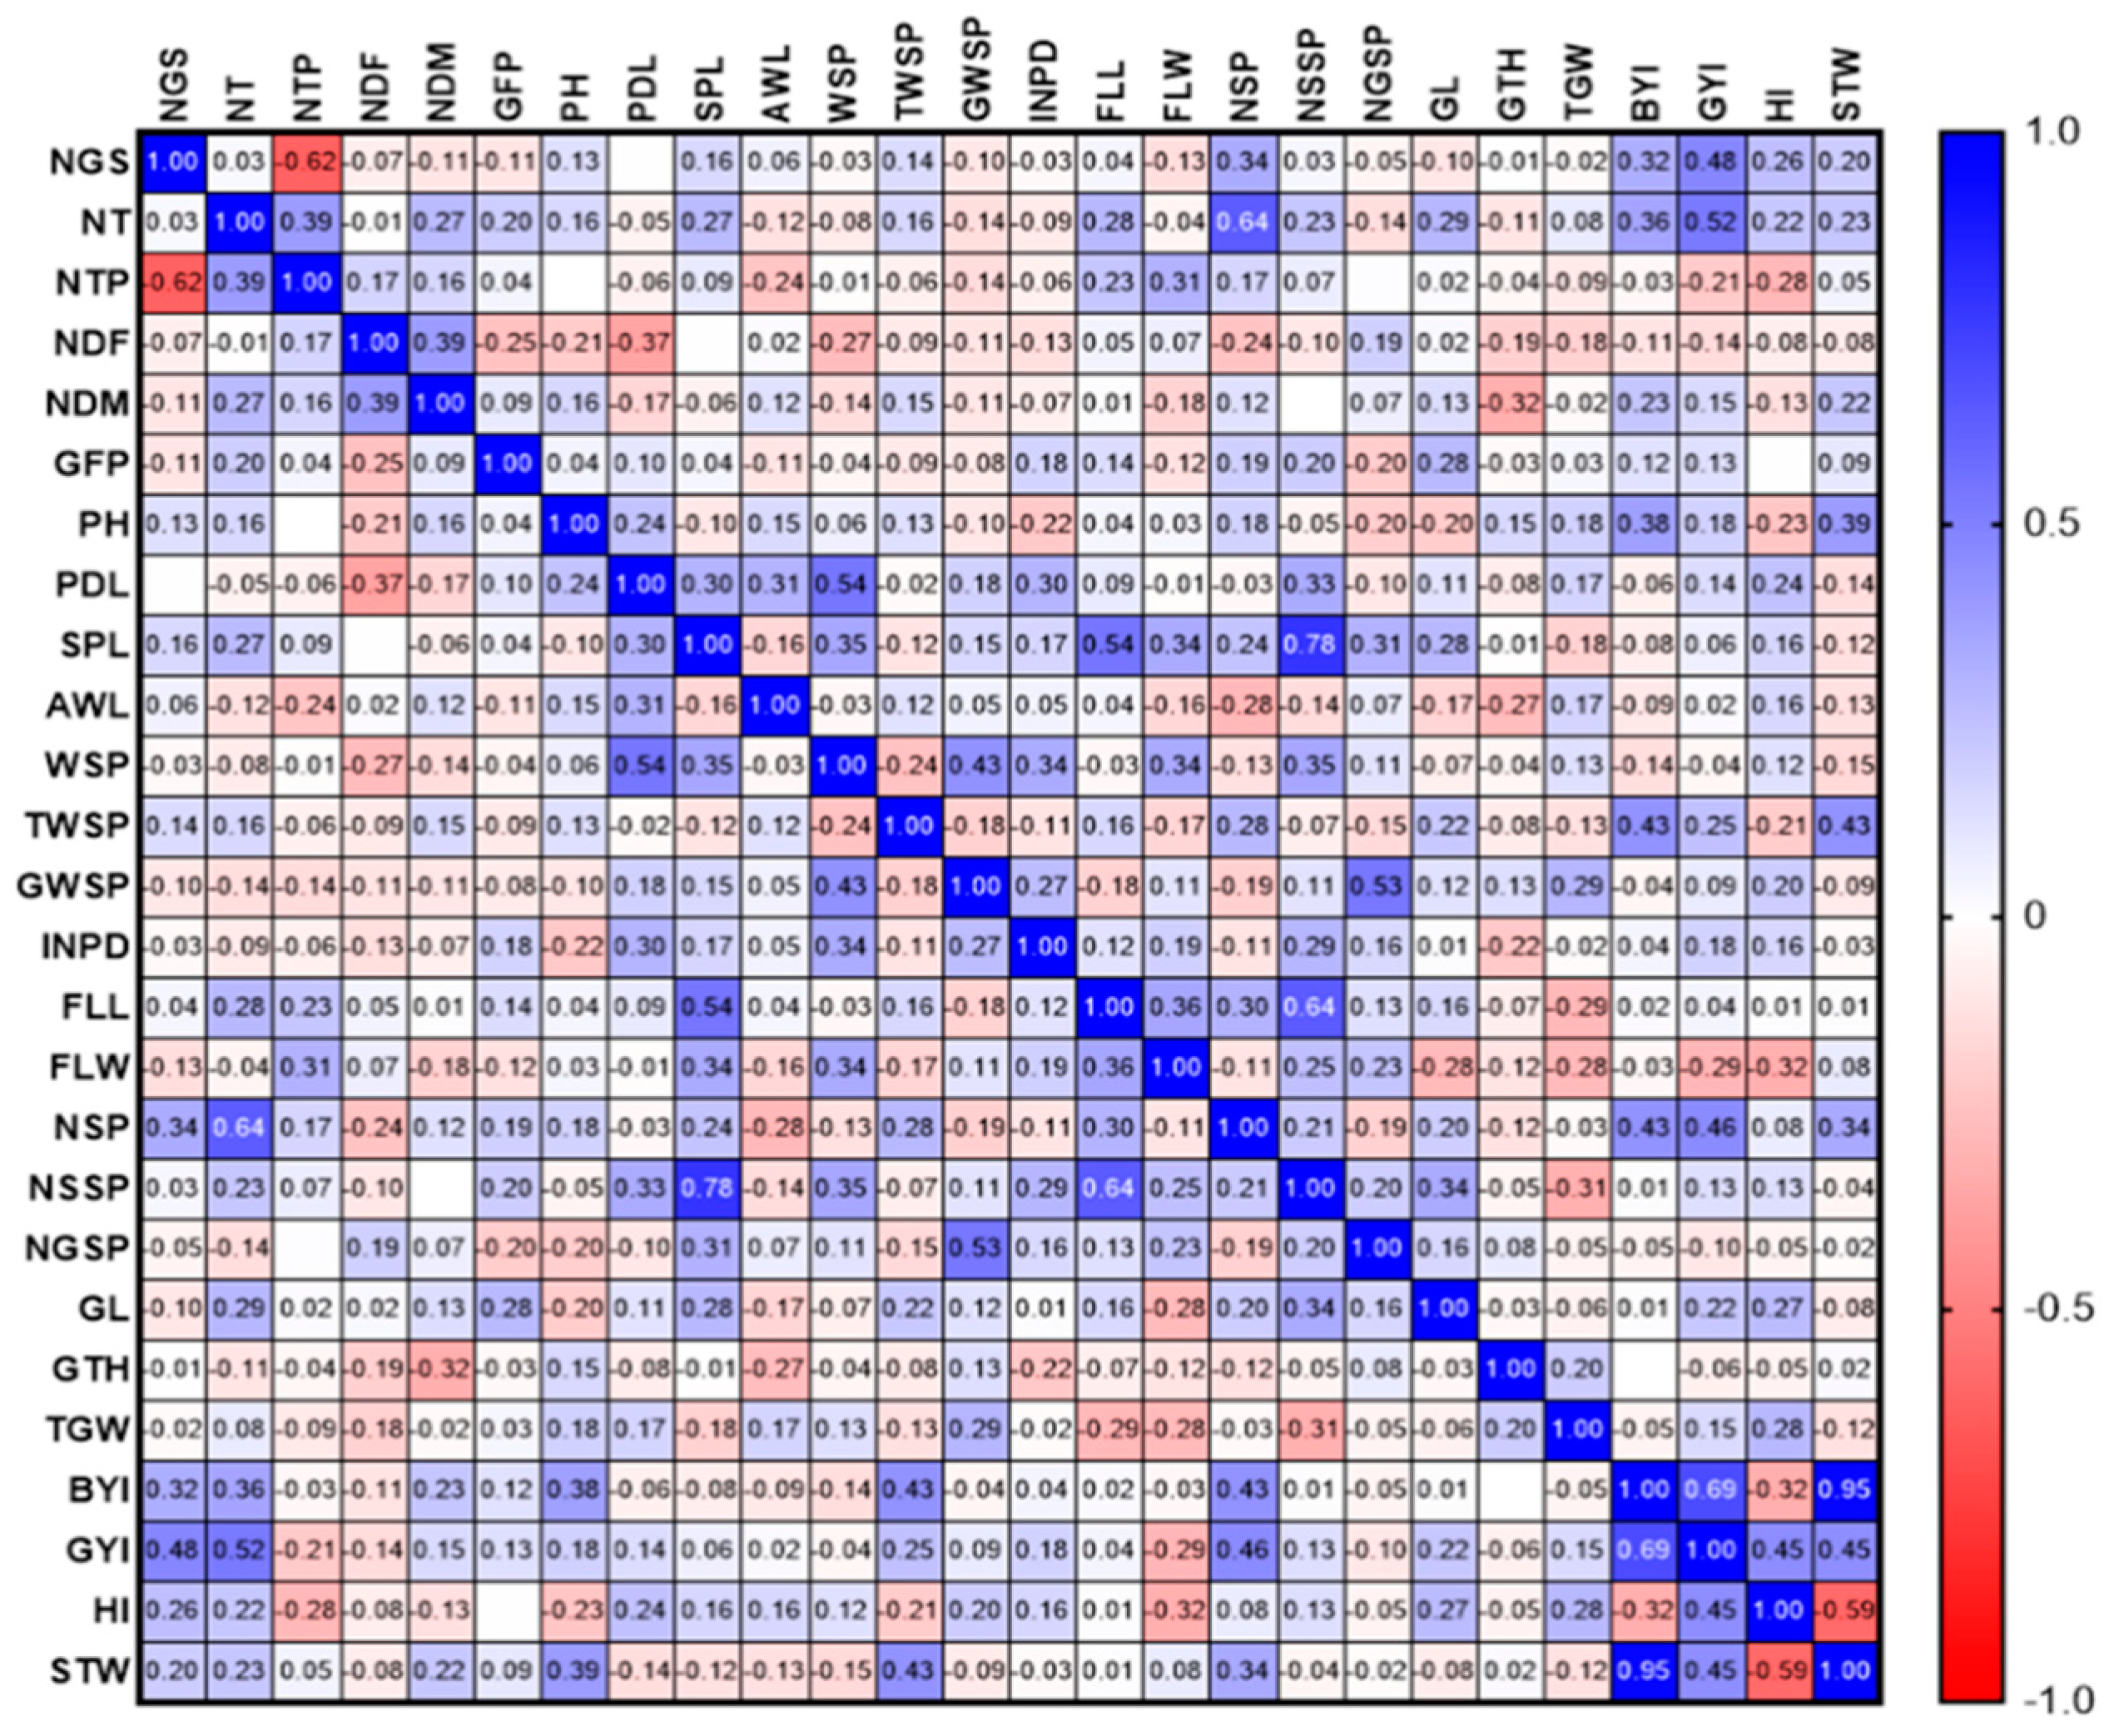
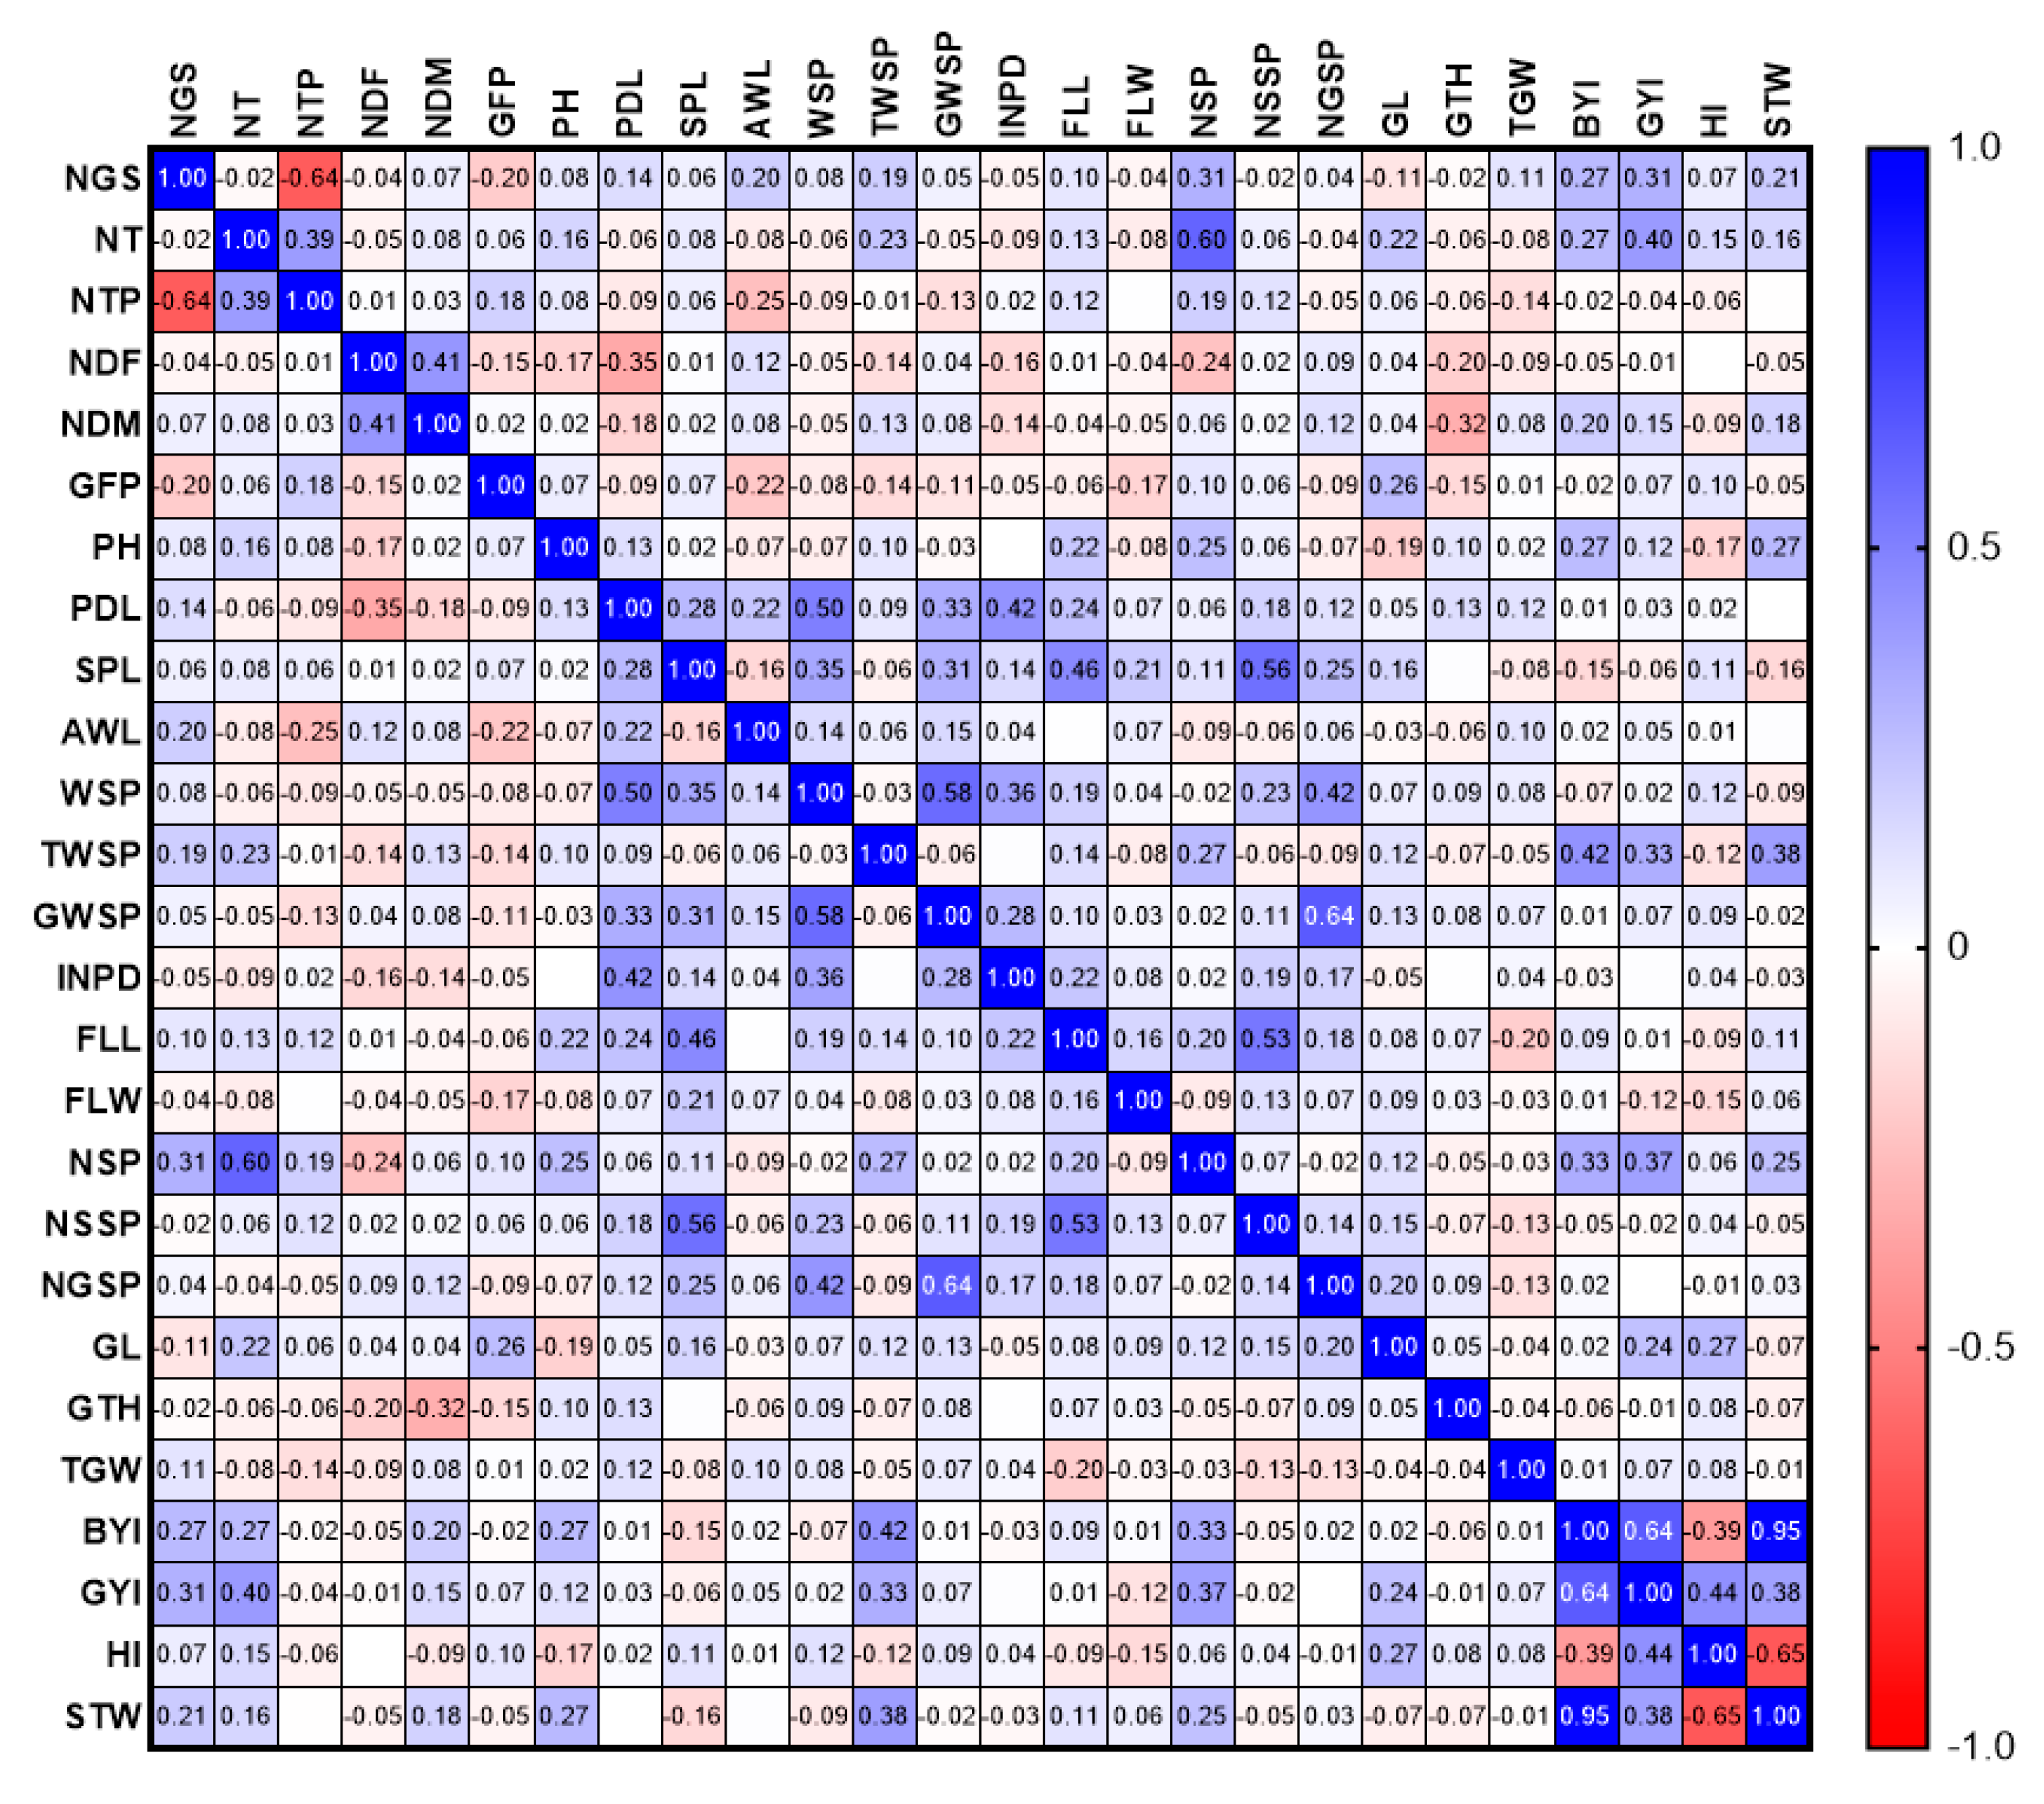
The GYI had a direct and significant relationship with NT, BYI, and the TWSP in 2020 and 2021. Moreover, in 2020, a positive and significant relationship was observed between FLW, NSSP (0.556 **), NGSP (0.864 **), and GWSP (0.518), as well as SPL and FLW (0.53 **) (Figure 2). In 2020, a positive and significant correlation was observed between NSSP, SPL, and FLL. There was also a positive relationship between WSP and PDL (Figure 3).
The GYI in both years was directly and significantly correlated with NT, BYI, and WSP. Stepwise regression was used to select the traits that critically affect grain yield. In 2020, NSP and TGW explained the most changes in GYI (Table 1). However, in 2021, NT, NGS, STW, FLW, and INDP formed the regression model and explained 69.50% of phenotypic variation in the GYI (Table 2).
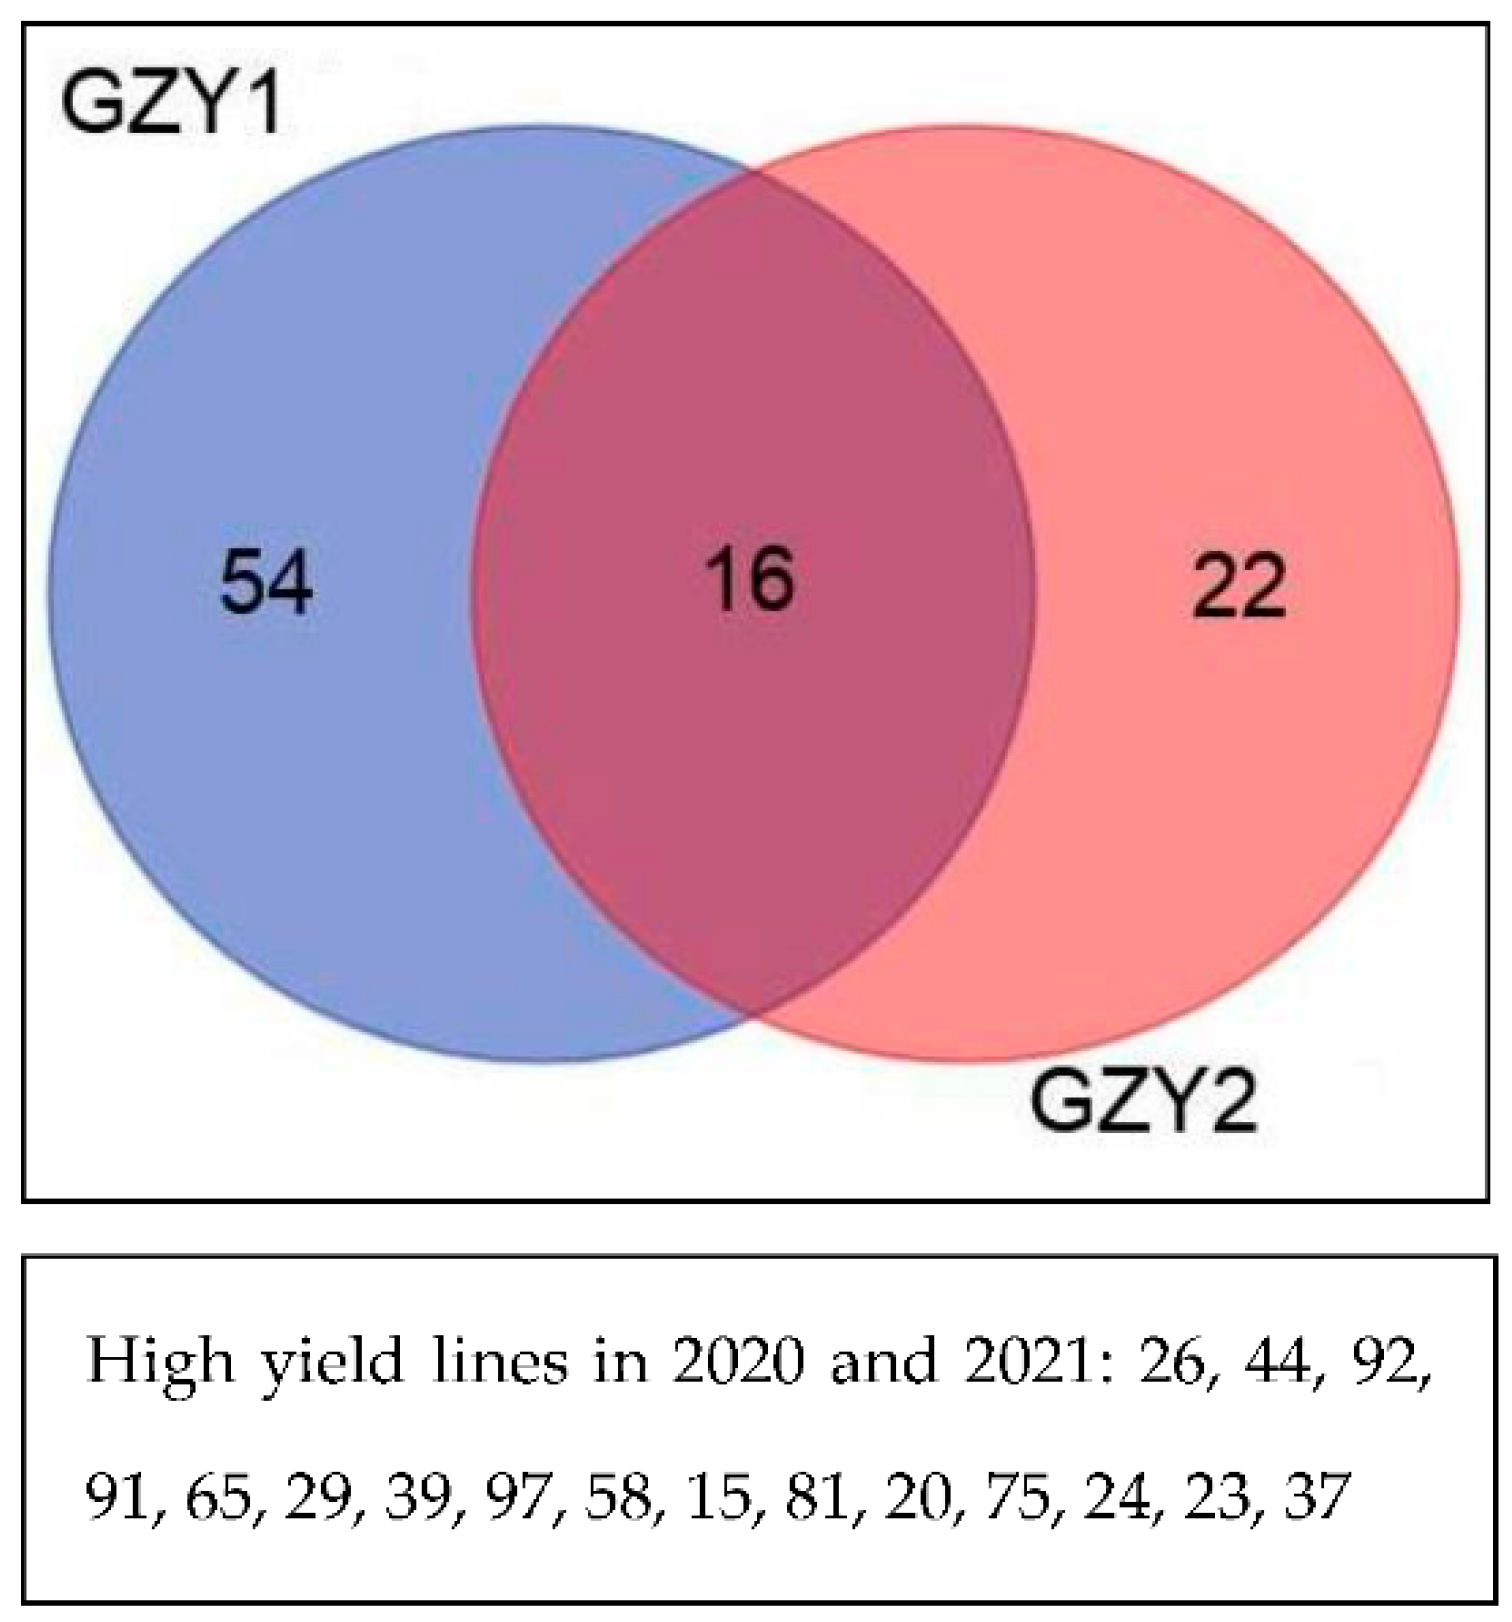
To group the study lines, cluster analysis was performed based on the grain yield. In both years, the lines were divided into two groups. Lines 26, 44, 92, 91, 65, 29, 39, 97, 58, 15, 81, 20, 75, 24, 23, and 37 had high performance in both years, while line 54 and line 22 had higher performance in 2020 and in 2021, respectively (Figure 4).
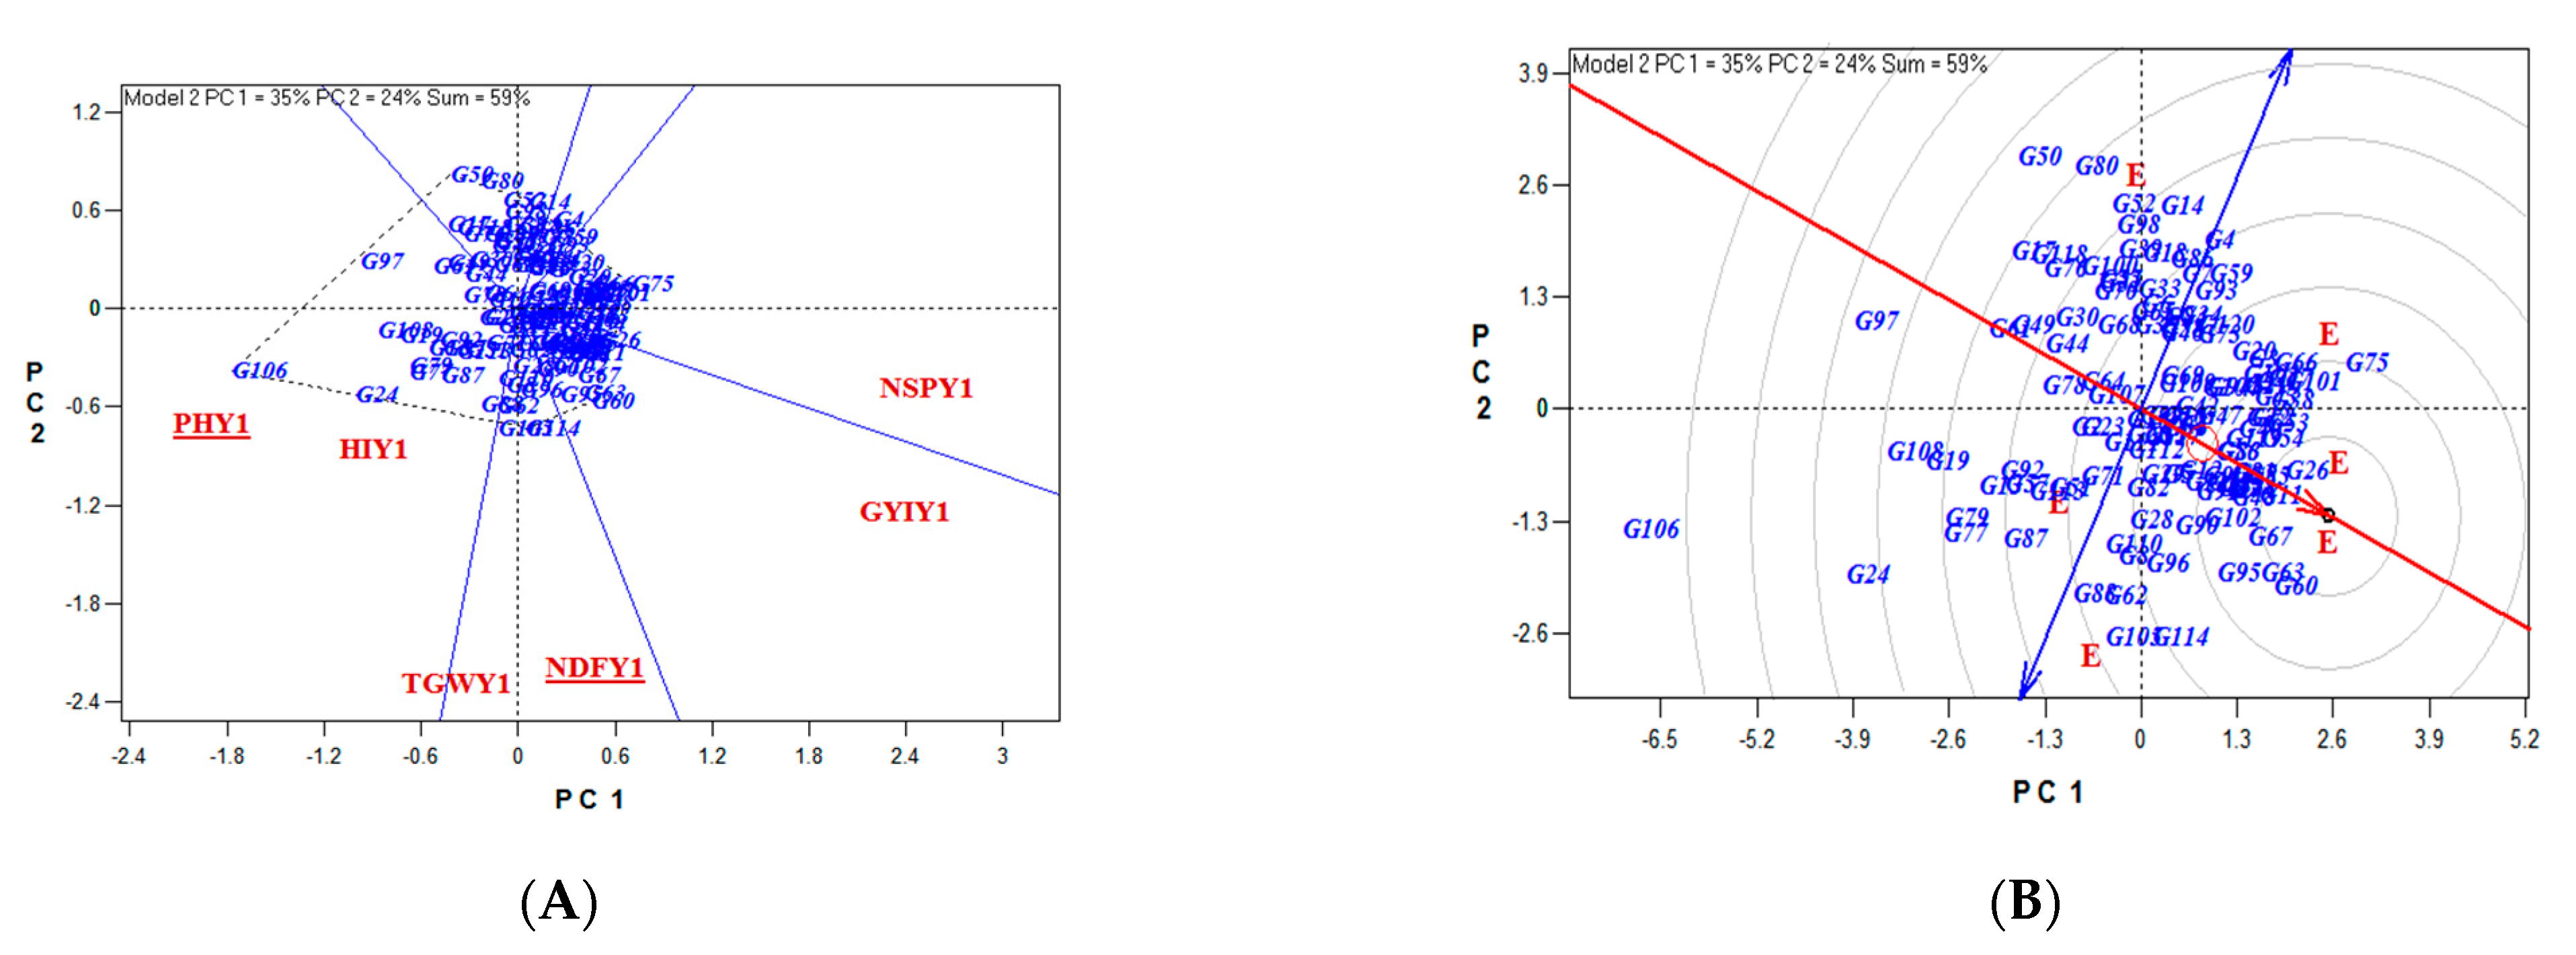
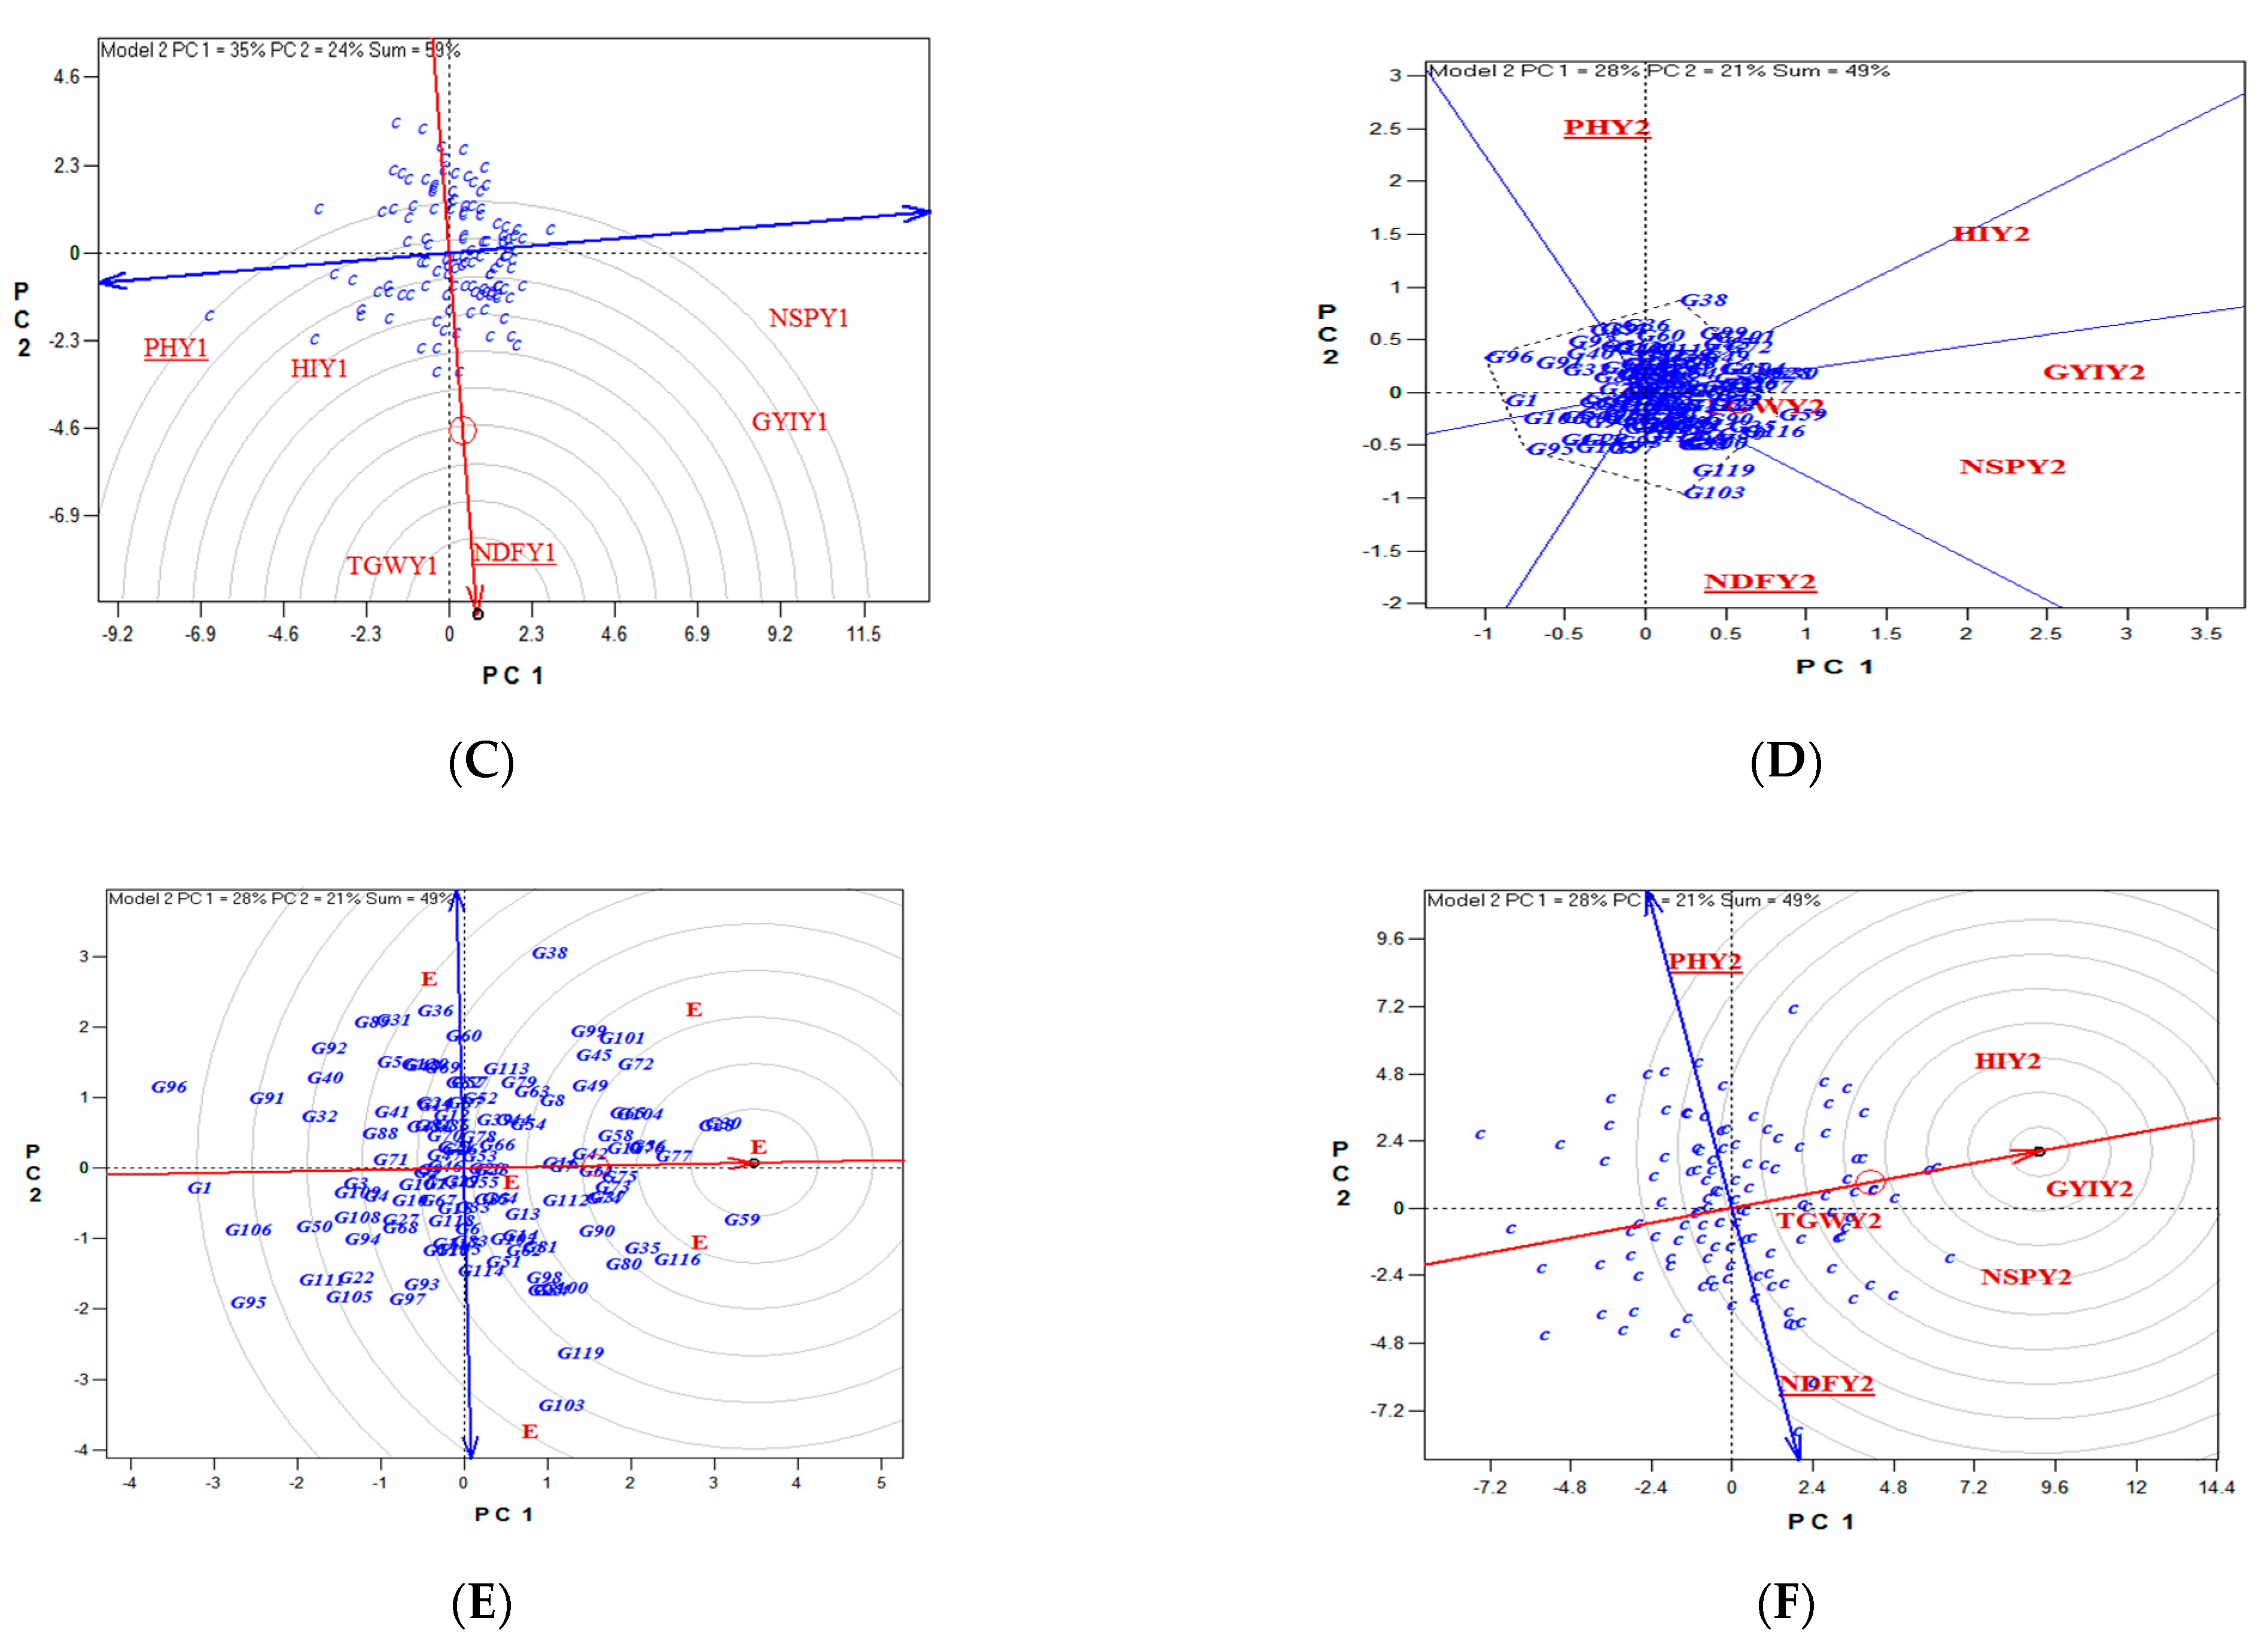
Examining the reaction of lines caused by Gonbad × Zagros crosses by considering significant traits in 2020 using Biplot analysis showed that lines 31, 30, 30, 20, and 26 were the most valuable in terms of PH, NDF, TGW, GYI, and NSP. Considering the traits of PH, NDF, TGW, GYI, and NSP, genotypes 10 and 66 were selected as the best cultivars. NDF and TGW show the most diversity for the examined lines.
Moreover, Biplot analysis in 2021 showed that lines 72, 65, 79, 102, and 65 were better in terms of PH, NDF, TGW, GYI, and NSP. Considering these traits, genotype 102 was selected as the best cultivar. The traits of GYI and HI were the most diverse for the studied lines (Figure 5).

3.1.2. Genotypic Evaluations

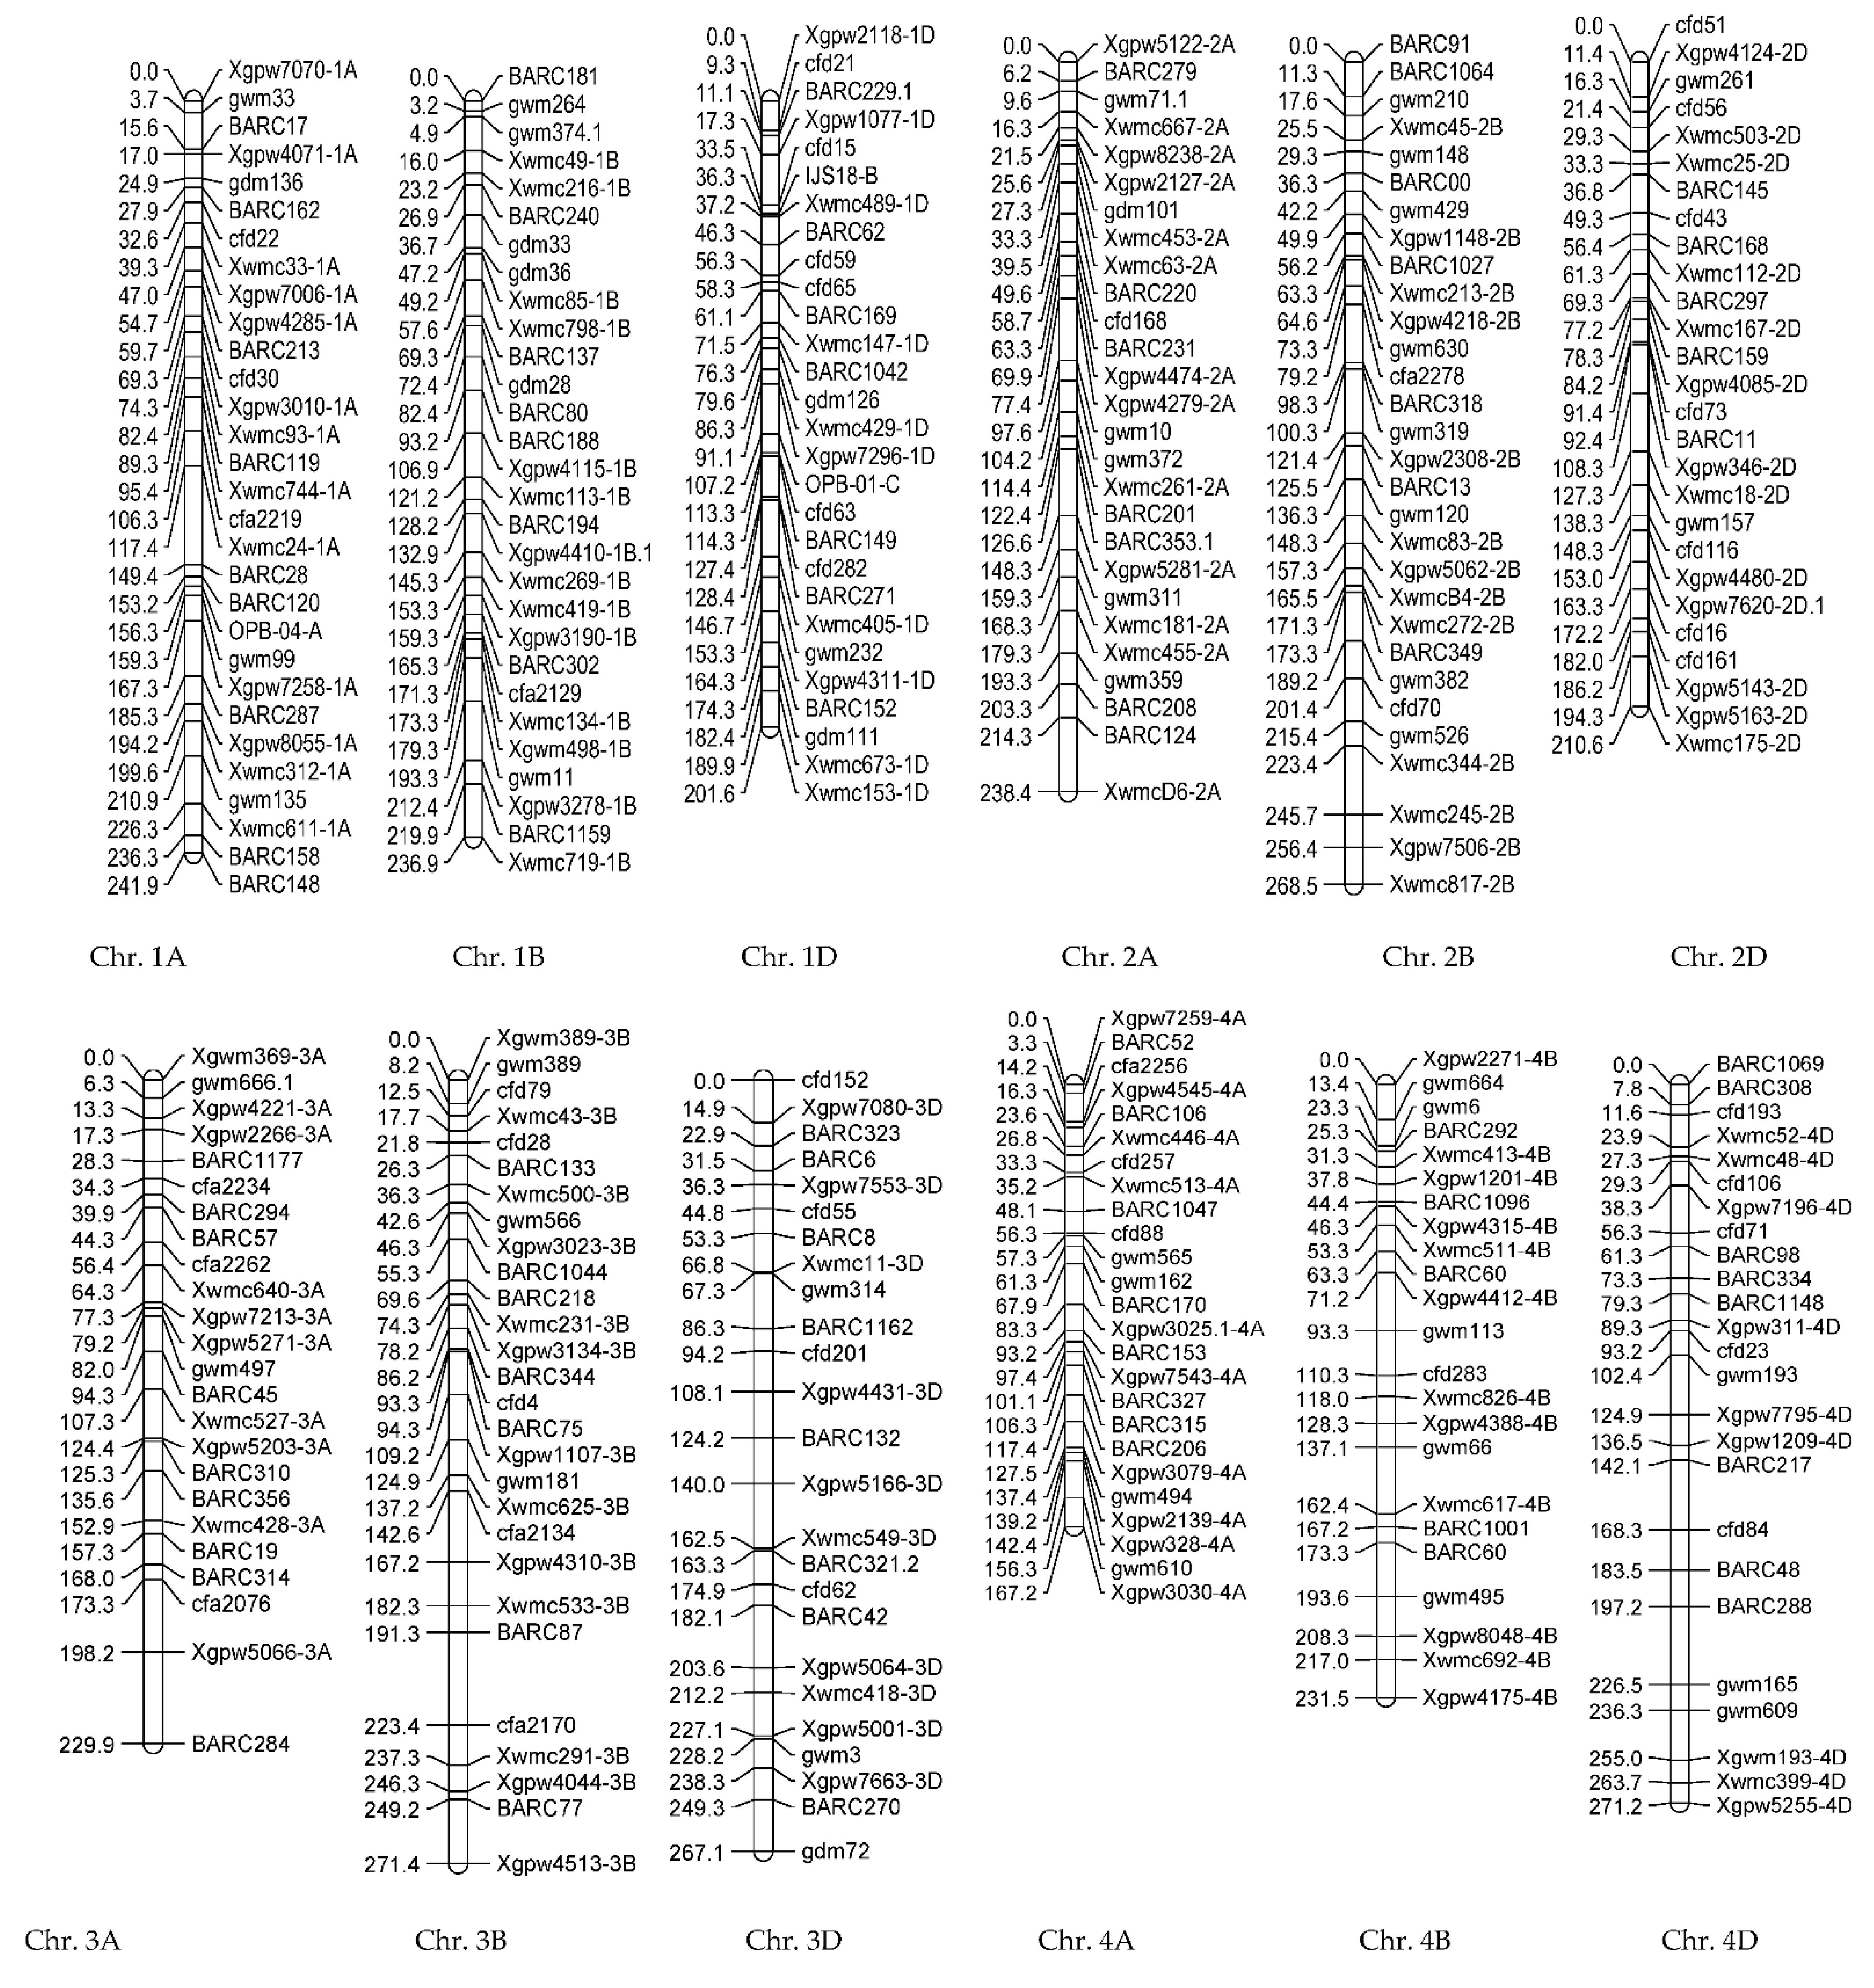
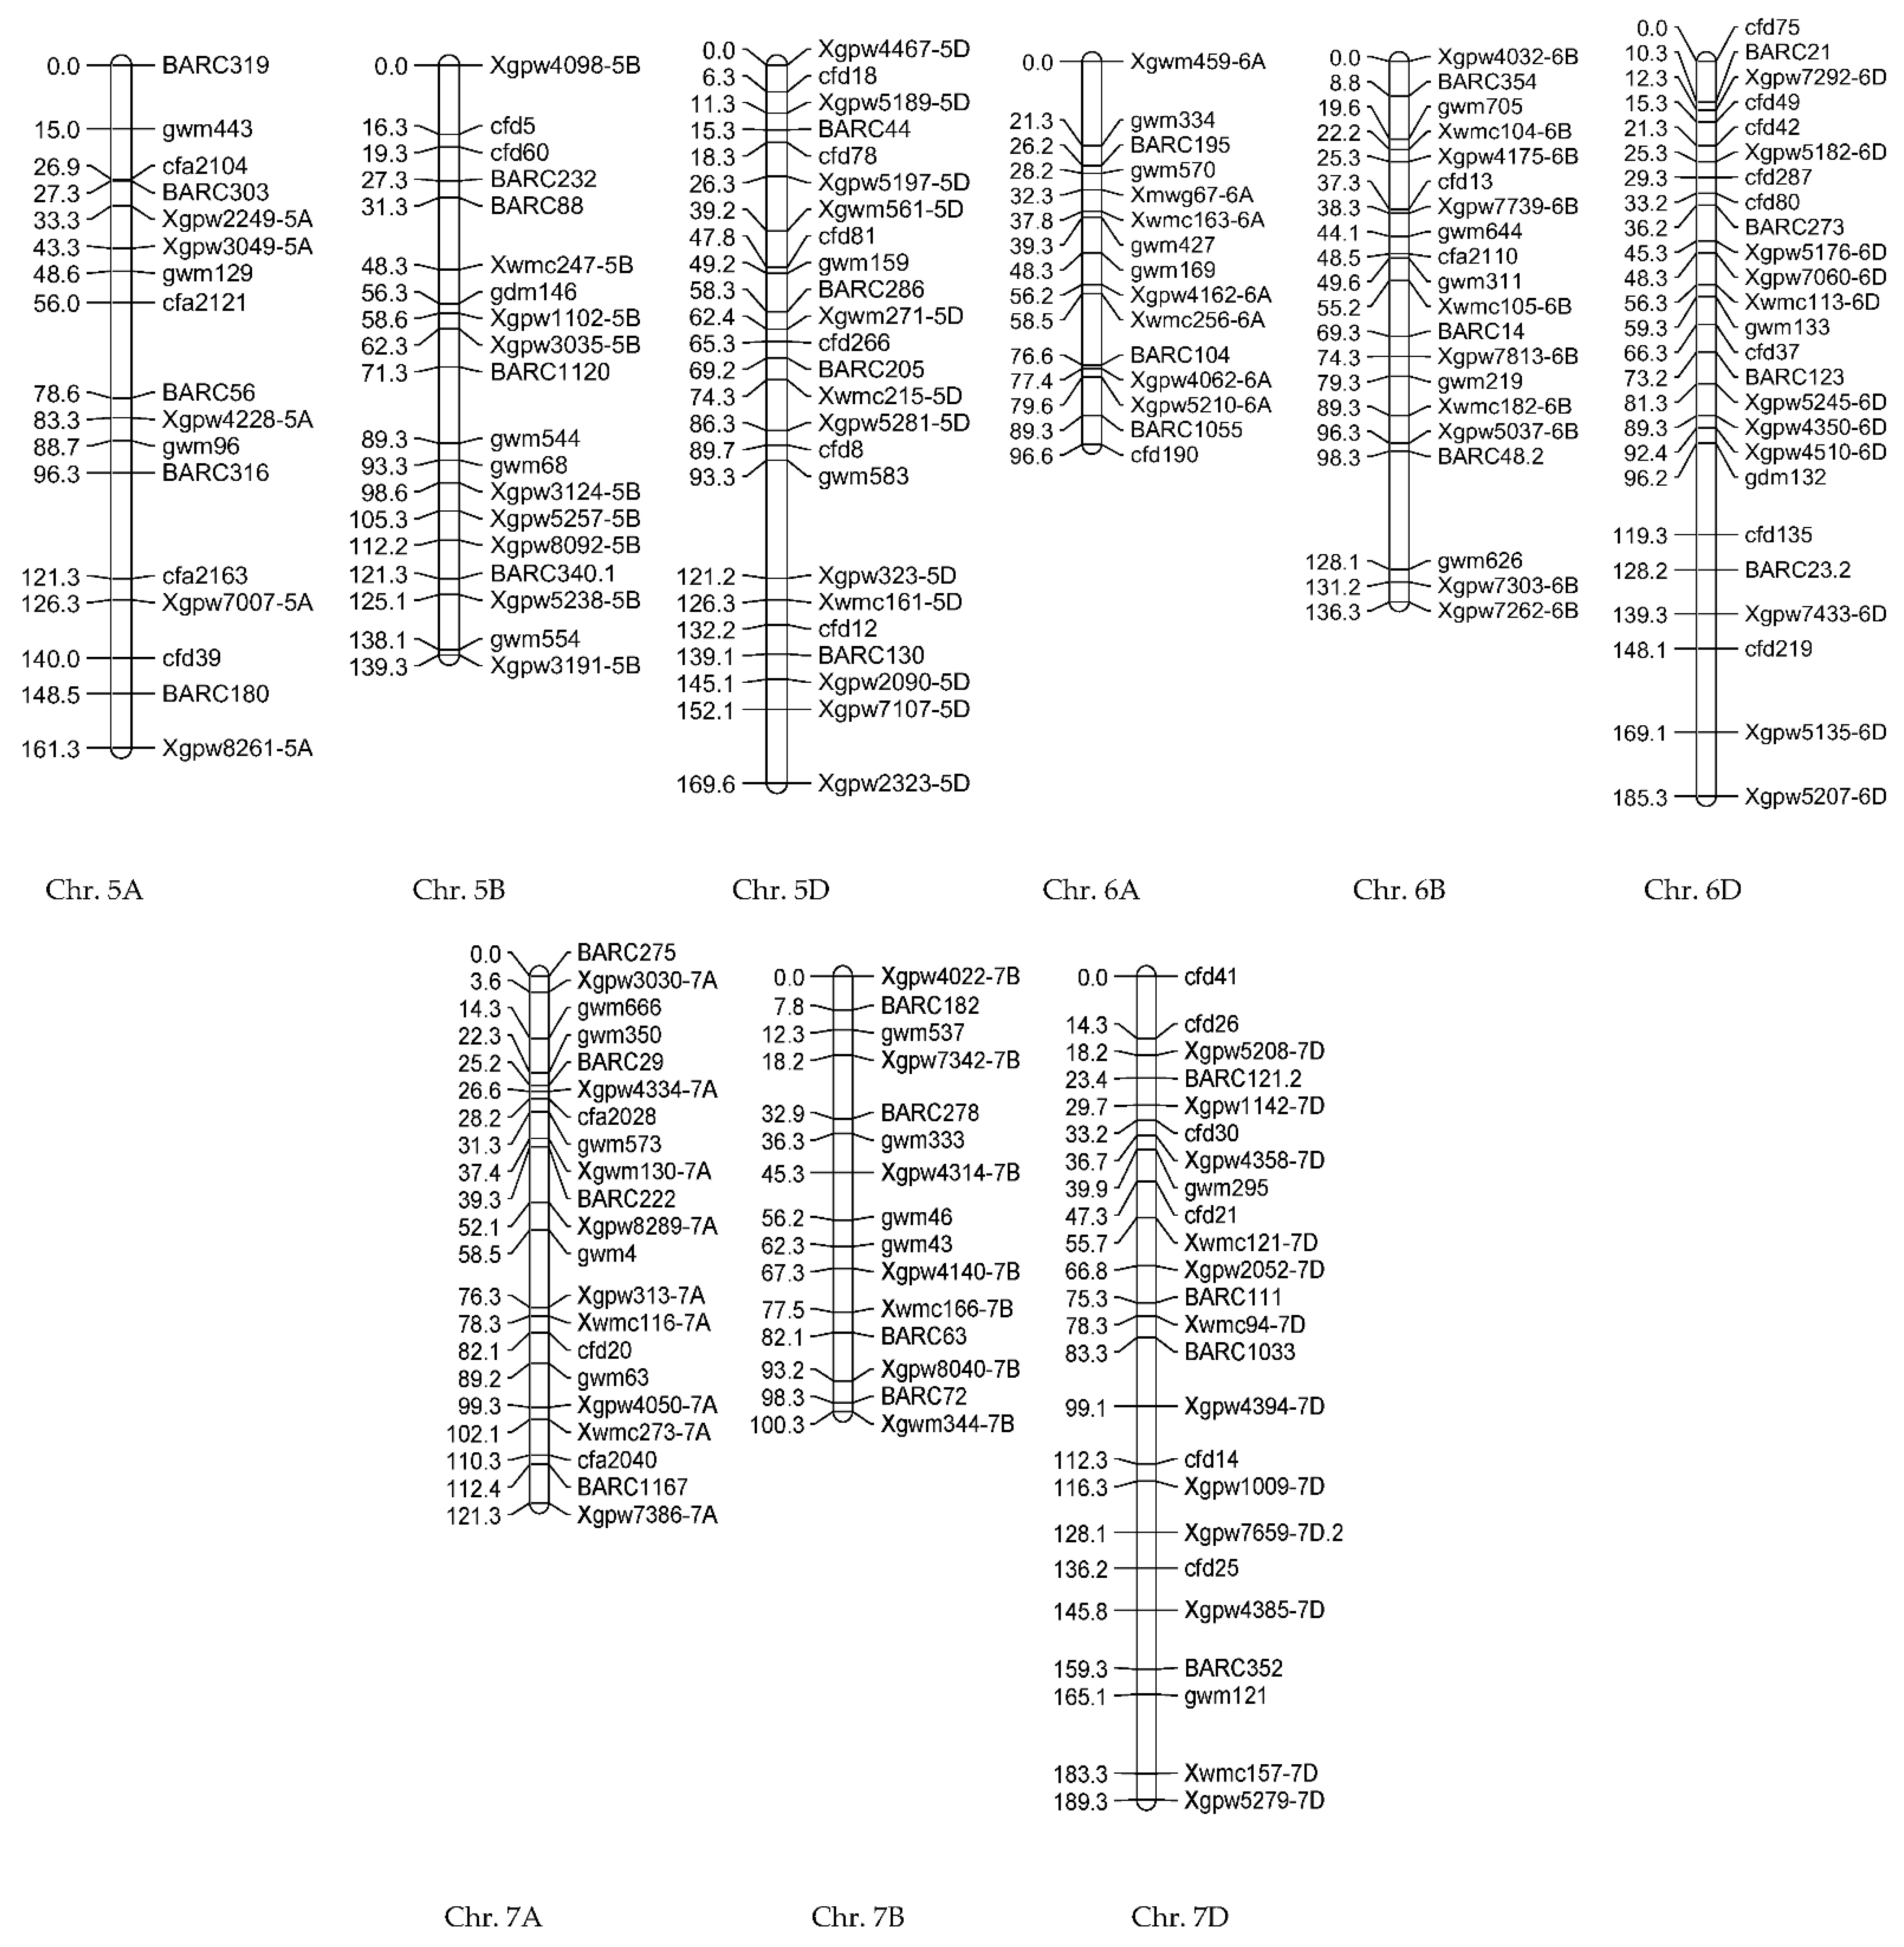
The linkage map in the population derived from Gonbad × Zagros was created using 523 SSR markers on 21 wheat chromosomes. This map covered 4749.6 cm of the wheat genome. The marker distances for genomes A, B, and D were 6.1, 6, and 6.2 cm, respectively. The length of genome A was 1499.3 cm, and those of genomes B and D were 1665.1 and 1585.2 cm in the total map length, respectively (Figure 6). A total of 180, 173, and 170 SSR markers were distributed on genomes A, B, and D, respectively. In the prepared map, the average distance between the flanked markers for the whole genome was 9014. Chromosome 3B had the maximum map length (271.4 cm) and the highest number of markers (28 markers), and chromosome 7D had the minimum map length (147.6 cm) and the lowest number of markers (16 markers).
In the Zagros and Gonbad populations, different QTLs were identified for two years. In 2020, 12 QTLs were identified for 8 traits; in 2021, 22 QTLs were identified for 15 different traits.
In 2020, some QTLs were identified for NGS, NDF, FLL, and GW. Two QTLs were identified on chromosomes 1A and 4B for the number of germinated seeds, explaining 22.15% and 16.01% of phenotypic variation in the trait, respectively. For the number of days to spiking, a QTL was identified on chromosome 6D, explaining 30.50% of phenotypic variation. For FLL, two QTLs were identified on chromosome 1D at 70.51 and 161.52 cm, with LOD scores of 3.86 and 3.17, respectively. In 2020, qSD-2A was identified for GW on chromosome 2A, explaining 52% of phenotypic variation.
For PDL, there were three QTLs on chromosomes 1B, 4A, and 4B in 2020, and two QTLs on chromosome 1B in 2021. These QTLs were mapped at 4.85, 97.36, 193.57, 49.22, and 160.32 cm. One QTL was identified for PDL on chromosome 1B in both years. For GL, one QTL was identified on chromosome 4D with an LOD score of 2.79 in 2020, and five QTLs on chromosomes 1D (two QTLs), 3A (two QTLs), and 7D, with LOD scores of 2.2, 2.99, 3.97, 3.39, and 5.16, respectively, in 2021. For WSP, three QTLs were identified (qSW-1B in 2020, and qSW-2B and qSW-3A in 2021) on chromosomes 1B, 2B, and 3A, respectively. These QTLs explained 15.50-22.50% of phenotypic variation in WSP. A QTL was identified for TGW on chromosomes 1A and 1D in 2020 and 2021, respectively. The LOD values for these QTLs were 3.10 and 2.59, respectively.
In 2021, some QTLs were identified for the tiller number, plant height, spike length, spike weight, harvest index, and peduncle diameter. qNT-2B was identified at 37.23 cm from the top of chromosome 2B with an LOD score of 3.12 and an additive effect of 104.97 for the number of tillers.
For PH, two QTLs were identified on chromosomes 1A and 3A, explaining 16.5% and 10% of phenotypic variation in the trait, respectively. SPL on chromosome 7B at 127.75 cm and with an LOD score of 2.92 was able to explain 26.06% of phenotypic variation. In 2021, qTSW-6A was identified for total spike weight. This QTL also explained more than 31% phenotypic variation in the total WSP. The additive effect and the LOD scores were −0.195 and 2.54, respectively. For each of the PD and HI, only one QTL was identified in 2021. qPD-7B on chromosome 7B with 21.58% of phenotypic variation in a trait and qHI-7D on chromosome 7D with above 30% of phenotypic variation in a trait were recognized as the significant QTL effects (Table 3 and Table 4).

3.2. Gonbad Kohdasht RIL Population

3.2.1. Phenotypic Evaluations

The frequency distribution of phenotypic values of the study traits is shown in Figures S3 and S4 for the population resulting from Gonbad × Kuhdasht in 2020 and 2021, respectively. In this population, the phenotypic distribution of traits was continuous and normal.
The results showed that FLL had a positive and significant relationship with the traits of SPL, FLW, and NSSP in 2020 and with NSSP in 2021. In 2020, GYI had a positive and significant relationship with NSP (0.692 **) and total WSP (0.737 **). There was a positive and significant relationship between AWL, PH, and NDM (Figure 7).
In 2021, a significant and positive relationship was observed between BYI, GYI, and STW. The results showed that there is a positive and significant relationship between WSP and PDL, as well as between NSP and NT (Figure 8).
The results of stepwise regression showed that, when GYI is considered as a dependent variable and other traits as independent traits, GYI is explained by NSP and INDP (Table 5). However, NT and NGS and GL in 2020 best explained GYI (Table 6).
The cluster analysis results divided the study lines into two groups based on study traits. In both years, lines 63, 90, 26, 119, 99, 72, 74, 7, 115, 20, 103, 11, 114, 12, 15, 60, 56, 101, and 45 had high GYI (Figure 9).
The reaction of lines caused by Gonbad × Kohdasht crosses in 2020 showed that lines 106, 103, 103, 60, and 75 were the most important in terms of PH, NDF, TGW, GYI, and NSP. Considering these traits, genotypes 26, 67, 60, and 63 were selected as the best cultivars. The traits of NDF and TGW show the most diversity for the evaluated lines.
Moreover, Biplot analysis showed that lines 38, 103, 59, 59, and 59 were the most valuable in terms of plant height, NDF, TGW, GYI, and NSP in 2021. The genotypes 59 and 38 were selected as the best cultivars. The traits of GYI, NSP, and HI showed the most diversity for the studied lines (Figure 10).

3.2.2. Genotypic Evaluations

The linkage map was provided using 423 SSR markers of the genetic map. The markers were distributed on 21 wheat chromosomes. The length of this map was 2975 cm, and the average marker distances for genomes A, B, and D were 7.12, 6.96, and 5.78 cm, respectively. The share of genome A in the length of the map was 948.2 cm, and the genomes B and D were 946.9 and 890.9.9 cm of the wheat genome, respectively (Figure 11). Out of 423 SSR markers, 133, 136, and 154 SSR markers were identified on genomes A, B, and D, respectively. In the prepared map, the average distance between adjacent markers in the whole genome was 7.033. Chromosome 2B had the maximum linkage length (189.3 cm) and the highest number of markers (25 markers), and chromosome 4B had the minimum linkage length (85.5 cm) and the lowest number of markers (11 markers).
In 2020, QTLs were identified for GYI, BYI, GWSP, WSP, GW, and HI. For GYI, two QTLs were identified on chromosomes 1B and 5B. The LOD scores and their additive effects were 3.23, 3.51, −526.73, and −747.96, respectively. The QTLs controlling biological yield were identified on chromosomes 1B, 4A, and 5D, and explained 18% of phenotypic variation in the biological yield. qGWSP-2B and qGWSP-6D were identified on chromosomes 2B and 6D at 1.57 and 141.22 cm from the top of chromosomes for GWSP with 13 and 10% phenotypic variation, respectively. For spike weight, five QTLs were identified on chromosomes 1A, 5A, 7B, 2B, and 2D, explaining 5–12% of phenotypic variation in WSP.
In 2021, only one QTL was identified on chromosomes 2A, 5B, 2A, 4D, 6B, and 6B for NGS, NT, PDL, and NSP. Among these QTLs, qNT-5B with an additive effect of 0.413 and an LOD score of 4.05 could explain over 21% of phenotypic variation in a trait. For AWL, two QTLs were identified on chromosomes 4D and 6B at 53 and 17 cm, respectively. For the number of grains per spike, three QTLs were identified on chromosomes 1D, 2A, and 4B.
For GL and NSSP, several QTLs were tracked in 2020 and 2021. A QTL was identified on chromosomes 3D and 1D in 2020 and 2021, explaining 23% and 21% of phenotypic variation, respectively. For NSSP, one QTL was identified on chromosome 2A at 86 cm in 2020 and two QTLs on chromosome 6D and 4A at 57 and 97 cm, respectively, in 2021. For NSP, three QTL were identified on chromosomes 1B, 2A, and 5D in 2020, and one QTL on chromosome 2D in 2021, explaining 8, 7, 13, and 23% phenotypic variation, respectively.
For PH, two QTLs were identified on chromosomes 1A and 3A, explaining 33% and 20% of phenotypic variation in a trait, respectively. For spike length on chromosome 7B at 127.75 cm with an LOD score of 2.92, it was able to explain 52.12% of phenotypic variation. In 2021, qSTW-6A was identified for total STW. The QTLs also explained over 62% of phenotypic variation in the total spike weights. The additive effect and the LOD score were −0.195 and 2.54, respectively. In 2021, only one QTL was identified for each PDL trait and harvest index. qPD-7B on chromosome 7B explaining over 43.16% of phenotypic variation in a trait and qHI-7D on chromosome 7D explaining over 60% of phenotypic variation in a trait were recognized as the significant QTL effects.

4. Discussion

GYI is a complex genetic trait strongly influenced by environmental conditions. Therefore, direct selection for performance, regardless of the characteristics of its components, can have misleading results. Therefore, grain-yield-related traits should be used to increase yield [30].
Correlation analysis is an effective tool to determine the relationship between different traits in genetically diverse populations to improve the crop modification process and indicates the severity of dependence between the study traits. Breeders explain the relationship between grain yield, agronomic, and morphological traits [31,32,33].
A positive and significant correlation was reported between grain yield, the number of spikes, plant height, spike weight, spike length, the number of grains per spike, flag leaf length, and 1000-grain weight. In the present study, NSP also significantly correlated with yield [34]. In a study [35], NT, HI, and BIO had a significant positive correlation with GYI, confirming our results.
Stepwise regression is used to select the most influential independent variables in forming dependent variables, such as GYI. This method aims to create a regression equation that includes the traits explaining the most changes in total performance [36,37]. Many researchers have used stepwise regression to eliminate ineffective traits in GYI [38,39,40,41].
Adilova et al. [42] have classified wheat genotypes into four groups using cluster analysis. There was a significant difference between the groups regarding morpho-physiological traits [42]. In the present study, the lines were divided into two high-yield and low-yield groups.
The comparison of two linkage maps showed that, among the 600 markers used, 151 markers were polymorphic for both populations and were used to prepare maps in both populations. The highest similarity belonged to chromosome 2B, which had common polymorphic markers, and the lowest similarity was related to chromosome 7B, which had five markers in common. One of the reasons for these similarities can be pointed to a common parent of the two populations.
Marza et al. [43] have examined a wheat RIL population resulting from Clarkxning and 7840 crosses in several environments. In the present study, QTLs for grain yield and their components were identified on chromosomes A1, B1, B2, B3, A4, B4, A5, B5, B6, A7, and D7 of the bread wheat genome. Sourdille et al. [44], in the study on genetic loci associated with major agronomic traits of wheat, have identified four QTLs controlling plant height. Marza et al. [43] has identified five significant QTL effects of 16.7, 16.9, 12.3, 14.9, and 12.1 for plant height in wheat on chromosomes BS2, BL2, D2, DL2, and A6, respectively.
Sourdille et al. [44] have identified the genetic loci of wheat height. Four QTLs have been reported for plant height. Keller et al. [45] have examined QTLs controlling lodging resistance and identified 11 QTLs for plant height. A QTL with R2 above 20% was identified in this study on chromosome A3. Identifying this QTL on chromosome 3A could increase the reliability of our result.
Borner et al. [46] have reported a QTL on chromosome 6A for peduncle length. An obvious point about the identified QTLs is identifying QTL controlling the peduncle length in both years on chromosome 1B, indicating the stability of QTL and confirming the results. Borner et al. [46] have identified two QTLs for spike length on chromosomes D2 and B6, whereas, in the present study, only one QTL was identified for spike length on chromosome 7B in Gonad × Zagros in 2021.
In the present study, three QTLs were identified for the number of grains per spike in the population resulting from Gonbad × Kuhdasht in 2021, two of which were on chromosomes 2A and 4B, under different environmental conditions. As QTLs did not appear in the same region on the chromosome under different environmental conditions, it can be concluded that the interaction of QTLs in the environment regarding the number of grains per spike is significant. Sishen et al. [47] have also identified several gene loci for the number of spikelets per spike. Huang et al. [48] have identified several QTLs on chromosomes 1 BL, 2AL, 2DL, 3BS, 4DS, 5DL, 6DL, and 7AS for spike. Kumar et al. [49] mapped three QTLs for tiller number, two QTLs for biological yield, and three QTLs for harvest index.

5. Conclusions

QTLs are significant in growth and phenotype development, but are not the only factor. Plant phenotypes are prejudiced by several environmental factors, including temperature and water availability. Stable and unstable QTLs in different environments or populations strongly influenced by environmental conditions have emerged as a common feature of quantitative traits in previous QTL studies [50]. Moreover, genetic factors, such as epigenetics, affect phenotypes. Epigenetics acts as a connection between environment and gene expression. Epigenetics refers to reversible inherited changes that occur without altering the DNA sequence. In the present study, QTL mapping was employed to dissect the genetic bases of morpho-phenological traits under two years using two populations. In our study, many significant QTLs were identified for the traits in each population in 2020 and 2021. These QTLs differed in size and phenotypic variation ratio (Table 7 and Table 8).
We found many QTLs with minor and significant genetic effects in only one year. Table 3, Table 4, Table 7 and Table 8 report the flanking marker intervals of all QTLs identified in different years and those resulting from different rain, temperatures, and other meteorological factors. In two years, only one QTL (qPDL-1B) was identified for PDL during both years on the same chromosome. It should be noted that qPDL-1B identified under deferent meteorological factors were in the same genetic region (Table 3 and Table 4).
Apparently, the environmental effect on QTL arises from differential gene expressions in different environments and may occur in any of the following three situations: (1) a QTL is expressed in one environment, but not in another; (2) a QTL is expressed strongly in one environment, but weakly in another, as indicated by the variation in its effects across environments; and (3) a QTL is expressed very differently with opposite effects in different environments [51,52]. As previously reported, one and three cases were also observed in our study.
However, in this study, we identified significant QTLs that can be used in marker-assisted selection wheat breeding programs thanks to the high percentage of explanations of changes in each trait. It is expected that, after the result validation in different places and populations, the QTLs identified in this study can be used in marker-assisted selection.

Supplementary Materials

The following supporting information can be downloaded at https://www.mdpi.com/article/10.3390/biotech11030032/s1, Figure S1: Frequency distribution of observed values of study traits in F8 wheat lines resulting from Gonbad × Zagros in 2020; Figure S2: Frequency distribution of observed values of study traits in F8 wheat lines resulting from Gonbad × Zagros in 2021; Figure S3: Frequency distribution of observed values of study traits in F8 wheat lines resulting from Gonbad × Kohdasht in 2020; Figure S4: Frequency distribution of observed values of study traits in F8 wheat lines resulting from Gonbad × Kohdasht in 2021; Table S1: Meteorological statistics from Gonbad Kavous Agricultural Research Station in 2020; Table S2: Meteorological statistics from Gonbad Kavous Agricultural Research Station in 2021.

Author Contributions

Conceptualization, H.S. and S.S.; methodology, H.S. and S.S.; software, H.S.; validation, H.S., S.M.A., N.S. and S.S.; formal analysis, S.S.; investigation, H.S. and S.S.; resources, H.S.; data curation, S.M.A., N.S. and S.S.; writing—original draft preparation, H.S. and S.S.; writing—review and editing, H.S. and S.S.; visualization, H.S.; supervision, H.S.; project administration, H.S. and S.S.; funding acquisition, H.S. All authors have read and agreed to the published version of the manuscript.

Funding

This research received no external funding.

Institutional Review Board Statement

Not applicable.

Informed Consent Statement

Not applicable.

Data Availability Statement

The data presented in this study are available upon request from the corresponding authors.

Acknowledgments

We are grateful to the Gonbad Kavous University for their financial support.

Conflicts of Interest

The authors declare no conflict of interest.

References

  1. Hussain, W.; Baenziger, P.S.; Belamkar, V.; Guttieri, M.J.; Venegas, J.P.; Easterly, A.; Sallam, A.; Poland, J. Genotyping-by-sequencing derived high-density linkage map and its application to QTL mapping of flag leaf traits in bread wheat. Sci. Rep. 2017, 7, 16394. [Google Scholar] [CrossRef] [PubMed]
  2. Tomás, D.; Rodrigues, J.C.; Viegas, W.; Silva, M. Assessment of High Temperature Effects on Grain Yield and Composition in Bread Wheat Commercial Varieties. Agronomy 2020, 10, 499. [Google Scholar] [CrossRef] [Green Version]
  3. Gahlaut, V.; Jaiswal, V.; Singh, S.; Balyan, H.S.; Gupta, P.K. Multi Locus genome wide association mapping for yield and its contributing traits in hexaploid wheat under different water regimes. Sci. Rep. 2019, 9, 19486. [Google Scholar] [CrossRef]
  4. Hu, J.M.; Wang, X.Q.; Zhang, G.X.; Jiang, P.; Chen, W.Y.; Hao, Y.C.; Ma, X.; Xu, S.; Jia, J.; Kong, L.; et al. QTL mapping for yield-related traits in wheat based on four RIL populations. Theor. Appl. Genet. 2020, 133, 917–933. [Google Scholar] [CrossRef]
  5. Lin, Y.; Jiang, X.; Hu, H.; Zhou, K.; Wang, Q.; Yu, S.; Yang, X.; Wang, Z.; Wu, F.; Liu, S.; et al. QTL mapping for grain number per spikelet in wheat using a high-density genetic map. Crop J. 2021, 9, 1108–1114. [Google Scholar] [CrossRef]
  6. DeVita, P.; Taranto, T. Durum wheat (Triticumturgidum ssp. durum) breeding to meet the challenge of climate change. In Advances in Plant Breeding Strategies: Cereals; Al-Khayri, J.M., Jain, S.M., Johnson, D.V., Eds.; Springer: Berlin/Heidelberg, Germany, 2019; pp. 471–524. [Google Scholar] [CrossRef]
  7. Wang, P.; Zhou, G.L.; Yu, H.H.; Yu, S.B. Fine mapping a major QTL for flag leaf size and yield-related traits in rice. Theor. Appl. Genet. 2011, 123, 1319–1330. [Google Scholar] [CrossRef] [PubMed]
  8. Wu, Q.H.; Chen, Y.X.; Fu, L.; Zhou, S.; Chen, J.; Zhao, X.; Zhang, D.; Ouyang, S.; Wang, Z.; Li, D.; et al. QTL mapping of flag leaf traits in common wheat using an integrated high-density SSR and SNP genetic linkage map. Euphytica 2016, 208, 337–351. [Google Scholar] [CrossRef]
  9. Liu, K.; Sun, X.X.; Ning, T.Y.; Duan, X.; Wang, Q.; Liu, T.; An, Y.; Guan, X.; Tian, J.; Cgen, J. Genetic dissection of wheat panicle traits using linkage analysis and a genome-wide association study. Theor. Appl. Genet. 2018, 131, 1073–1090. [Google Scholar] [CrossRef] [PubMed]
  10. Deng, Z.Y.; Cui, Y.; Han, Q.D.; Fang, W.; Li, J.; Tian, J. Discovery of consistent QTLs of wheat spike-related traits under nitrogen treatment at different development stages. Front. Plant Sci. 2017, 8, 2120. [Google Scholar] [CrossRef] [Green Version]
  11. Sakuma, S.; Golan, G.; Guo, Z.; Ogawa, T.; Tagiri, A.; Sugimoto, K.; Bernhardt, N.; Brassac, J.; Mascher, M.; Hensel, G.; et al. Unleashing floret fertility in wheat through the mutation of a homeobox gene. Proc. Natl. Acad. Sci. USA 2019, 116, 5182–5187. [Google Scholar] [CrossRef] [Green Version]
  12. Jia, H.Y.; Wan, H.S.; Yang, S.H.; Zgang, Z.; Kong, Z.; Xue, S.; Zhang, L.; Ma, Z. Genetic dissection of yieldrelated traits in a recombinant inbred line population created using a key breeding parent in China’s wheat breeding. Theor. Appl. Genet. 2013, 126, 2123–2139. [Google Scholar] [CrossRef]
  13. Noryan, M.; Hervan, I.M.; Sabouri, H.; Kojouri, F.D.; Mastinu, A. Drought Resistance Loci in Recombinant Lines of Iranian Oryza sativa L. in Germination Stage. BioTech 2021, 10, 26. [Google Scholar] [CrossRef]
  14. Ding, A.M.; Culi, F.; Li, J.; Zhao, C.H.; Wang, L.; Qi, X.L.; Bao, Y.G.; Li, X.F.; Wang, H.G. QTL Mapping for Grain Yield Conditioned on its Component Traits in Two RIL Populations of Bread Wheat. Cereal Res. Commun. 2013, 41, 45–53. [Google Scholar] [CrossRef]
  15. Rabiei, B.; Kordrostami, M.; Sabouri, A.; Sabouri, H. Identification of QTLs for yield related traits in Indica type rice using SSR and AFLP markers. Agric. Cons. Sci. 2015, 80, 91–99. [Google Scholar]
  16. Sabouri, A.; Reza Afshari, R.; Raiesi, T.; Babaei Raouf, H.; Nasiri, E.; Esfahani, M.; Kafi Ghasemi, A.; Kumar, A. Superior adaptation of aerobic rice under drought stress in Iran and validation test of linked SSR markers to major QTLs by MLM analysis across two years. Mol. Biol. Rep. 2018, 45, 1037–1053. [Google Scholar] [CrossRef]
  17. Shirmohammadli, S.; Sabouri, H.; Ahangar, L.; Ebadi, A.; Sajjadi, S. Genetic diversity and association analysis of rice genotypes for grain physical quality using iPBS, IRAP, and ISSR markers. J. Genet. Res. 2018, 4, 122–129. [Google Scholar] [CrossRef]
  18. Khapilina, O.; Turzhanova, A.; Danilova, A.; Tumenbayeva, A.; Shevtsov, V.; Kotukhov, Y.; Kalendar, R. Primer Binding Site (PBS) Profiling of Genetic Diversity of Natural Populations of Endemic Species Allium ledebourianum Schult. BioTech 2021, 10, 23. [Google Scholar] [CrossRef]
  19. Sabouri, A.; Nasiri, E.; Esfahani, M.; Forghani, A. SSR marker-based study of the effects of genomic regions on Fe, Mn, Zn, and protein content in a rice diversity panel. J. Plant Biochem. Biotechnol. 2021, 30, 504–514. [Google Scholar] [CrossRef]
  20. Sabouri, A.; Alinezhad, F.; Mousanejad, S. Association analysis using SSR markers and identification of resistant aerobic and Iranian rice cultivars to blast disease. Eur. J. Plant Pathol. 2020, 158, 561–570. [Google Scholar] [CrossRef]
  21. Chopra, R.K.; Singh, K.; Shukla, S.; Kadam, S.; Singh, N.K. QTLs for cell membrane stability and flag leaf area under drought stress in a wheat RIL population. J. Plant Biochem. Biotechnol. 2019, 29, 276–286. [Google Scholar] [CrossRef]
  22. Liu, C.; Sukumaran, S.; Claverie, E.; Sansaloni, C.; Susanne Dreisigacker, S.; Reynolds, M. Genetic dissection of heat and drought stress QTLs in phenology-controlled synthetic-derived recombinant inbred lines in spring wheat. Mol. Breed. 2019, 39, 34. [Google Scholar] [CrossRef]
  23. Saghai, M.M.; Biyashev, R.M.; Yang, G.P.; Zhang, Q.; Allard, W. Extraordinarily polymorphic microsatellite DNA in barley: Species diversity, chromosomal locations, and population dynamics. Proc. Natl. Acad. Sci. USA 1994, 91, 5466–5470. [Google Scholar] [CrossRef] [Green Version]
  24. Xu, S.B.; Tao, Y.F.; Yang, Z.Q.; Chu, J.Y. A simple and rapid method used for silver staining and gel preservation. Hereditas 2002, 24, 335–336. [Google Scholar] [PubMed]
  25. Nelson, J. QGENE: Software for marker–based analysis and breeding. Mol. Breed. 1997, 3, 239–245. [Google Scholar] [CrossRef]
  26. Manly, K.F.; Olson, J.M. Overview of QTL mapping software and introduction to map manager QTL. Mamm. Genome 1999, 10, 327–334. [Google Scholar] [CrossRef]
  27. Kosambi, D.D. The estimation of map distances from recombination values. Ann. Eugen. 1944, 12, 172–175. [Google Scholar] [CrossRef]
  28. Lander, E.S.; Botstein, D. Mapping Mendelian factor underlying quantitative traits using RFLP linkage maps. Genetics 1989, 121, 185–199. [Google Scholar] [CrossRef]
  29. Zhang, Y.W.; Wen, Y.J.; Dunwell, J.M.; Zhang, Y.M. QTL. gCIMapping. GUI v2.0: An R software for detecting small-effect and linked QTLs for quantitative traits in bi-parental segregation populations. Comput. Struct. Biotechnol. J. 2020, 18, 59–65. [Google Scholar] [CrossRef]
  30. Haydar, F.M.A.; Ahamed, M.S.; Siddique, A.B.; Uddin, G.M.; Biswas, K.L.; Alam, M.F. Estimation of genetic variability, heritability and correlation for some quantitative traits in wheat (Triticumaestivum L.). J. Bio-Sci. 2020, 28, 81–86. [Google Scholar] [CrossRef]
  31. Kandel, M.; Ghimire, S.K.; Ojha, B.R.; Shrestha, J. Genetic diversity for heat tolerant related traits in maize inbred lines. Agricultura 2018, 105, 23–34. [Google Scholar] [CrossRef]
  32. Kharel, L.; Ghimire, S.K.; Shrestha, J.; Kunwar, C.B.; Sharma, S. Evaluation of rice genotypes for its response to added fertility levels and induced drought tolerance during reproductive phase. J. AgriSearch 2018, 5, 3–18. [Google Scholar] [CrossRef] [Green Version]
  33. Dhami, N.B.; Kandel, M.; Gurung, S.B.; Shrestha, J. Agronomic performance and correlation analysis of finger millet genotypes (Elusinecoracana L.). Malays J. Sustain. Agric. 2018, 2, 16–18. [Google Scholar] [CrossRef]
  34. Ojha, R.; Sarkar, A.; Aryal, A.; Rahul, K.C.; Tiwari, S.; Poudel, M.; Pant, K.R.; Shrestha, J. Correlation and path coefficient analysis of wheat (Triticumaestivum L.) genotypes. Farming Manag. 2018, 3, 136–141. [Google Scholar] [CrossRef]
  35. Roy, A.; Kumar, A.; Singh, A.; Mandi, A.; Barman, M. Analysis of genetic diversity and correlation studies on grain yield and its component characters in bread wheat (Triticumaestivum L. emThell) genotypes. Pharma Innov. J. 2021, 10, 341–345. [Google Scholar]
  36. Fouad, H. Correlation, Path and Regression Analysis in Some Bread Wheat (Triticumaestivum L.) Genotypes under Normal Irrigation and Drought Conditions. Egypt. J. Agron. 2018, 40, 133–144. [Google Scholar]
  37. Kumar, S.; Attri, S.D.; Singh, K.K. Comparison of Lasso and stepwise regression technique for wheat yield prediction. J. Agrometeorol. 2019, 21, 188–192. [Google Scholar] [CrossRef]
  38. Mohamed, N.A. Some statistical procedures for evaluation of the relative contribution for yieldcomponents in wheat. Zagazig J. Agric. Res. 1999, 26, 281–290. [Google Scholar]
  39. Soleymanifard, A.; Naseri, R.; Meysam, M. The study genetic variation and factor analysis for agronomic traits of Durum wheat genotypes using cluster analysis and path analysis under drought stress condition in western of Iran. Res. J. Appl. Basic Sci. 2012, 3, 479–485. [Google Scholar]
  40. Nasri, R.; Kashani, A.; Paknejad, F.; Vazan, S.; Barary, M. Correlation, path analysis and stepwise regression in yield and yield components in wheat (Triticumaestivum L.) under the temperate climate of Ilam province, Iran. Indian Fundam Appl. Life Sci. 2014, 4, 188–198. [Google Scholar]
  41. Mirela, M.S.; Veselinka, Z.; Sofija, P.; Danica, M.; Borislav, B.; Desimir, K. Variability, correlation, path analysis and stepwise regression for yield components of different wheat genotypes. Genetika 2018, 50, 817–827. [Google Scholar] [CrossRef] [Green Version]
  42. Adilova, S.S.; Qulmamatova, D.E.; Baboev, S.K.; Bozorov, T.A.; Morgunov, A.I. Multivariate Cluster and Principle Component Analyses of Selected Yield Traits in Uzbek Bread Wheat Cultivars. Am. J. Plant. Sci. 2020, 11, 101205. [Google Scholar] [CrossRef]
  43. Marza, F.; Bai, G.H.; Carver, B.F.; Zhou, W.C. Quantitative trait loci for yield and related traits in the wheat population Ning7840 Clark. Theor. Appl. Genet. 2005, 112, 688–698. [Google Scholar] [CrossRef] [PubMed]
  44. Sourdille, P.; Cadalen, T.; Guyomarc’h, H.; Snape, J.W.; Perretant, M.R.; Charmet, G.; Boeuf, C.; Bernard, S.; Bernard, M. An update of the Courtot × Chinse spring intervarietal molecular marker linkage map for QTL detection of agronomic traits in wheat. Theor. Appl. Genet. 2003, 106, 530–538. [Google Scholar] [CrossRef]
  45. Keller, M.; Karutz, C.; Shmid, J.; Stamp, P.; Wnnzeler, M.; Keller, B.; Messmer, M. Quantitrative trait loci for lodging resistance in a segregating wheat × spelt population. Theor. Appl. Genet. 1999, 98, 1171–1182. [Google Scholar] [CrossRef]
  46. Borner, A.; Schumann, E.; Furste, A.; Coster, H.; Leithold, B.; Roder, M.S.; Weber, W.E. Mapping of quantitative trait loci determining agronomic important characters in hexaploidwheat (Triticumaestivum L.). Theor. Appl. Genet. 2002, 105, 921–936. [Google Scholar] [CrossRef]
  47. Sishen, L.; Jizeng, J.; Xyanyun, W. An interval genetic map and QTL analysis for height in wheat using a doubled-haploid population. Theor. Appl. Genet. 2007, 96, 933–940. [Google Scholar]
  48. Huang, X.Q.; Coster, H.; Ganal, M.W.; Röder, M.S. Advanced backcross QTL analysis for the identification of quantitative trait loci alleles from wild relatives of wheat (Triticumaestivum L.). Theor. Appl. Genet. 2003, 106, 1379–1389. [Google Scholar] [CrossRef]
  49. Kumar, N.; Kulwal, P.L.; Balyan, H.S.; Guta, P.K. QTL mapping for yield and yield contributing traits in two mapping populations of bread wheat. Mol. Breed. 2007, 19, 163–177. [Google Scholar] [CrossRef]
  50. Holland, J.B. Genetic architecture of complex traits in plants. Curr. Opin. Plant Biol. 2007, 10, 156–161. [Google Scholar] [CrossRef]
  51. Li, Z.K.; Yu, S.B.; Lafitte, H.R.; Huang, N.; Courtois, B.; Hittalmani, S.; Vijayakumar, C.H.M.; Liu, G.F.; Wang, G.C.; Shashidhar, H.E.; et al. QTL × environment interactions in rice. I. Heading date and plant height. Theor. Appl. Genet. 2003, 108, 141–153. [Google Scholar] [CrossRef]
  52. Zhang, Y.; Li, Y.; Wang, Y.; Liu, Z.; Liu, C.; PEeng, N.B.; Tan, W.; Wang, A.D.; Shi, Y.; Sun, B.; et al. Stability of QTL Across Environments and QTL-by-Environment Interactions for Plant and Ear Height in Maize. Agric. Sci. China 2010, 9, 1400–1412. [Google Scholar] [CrossRef]
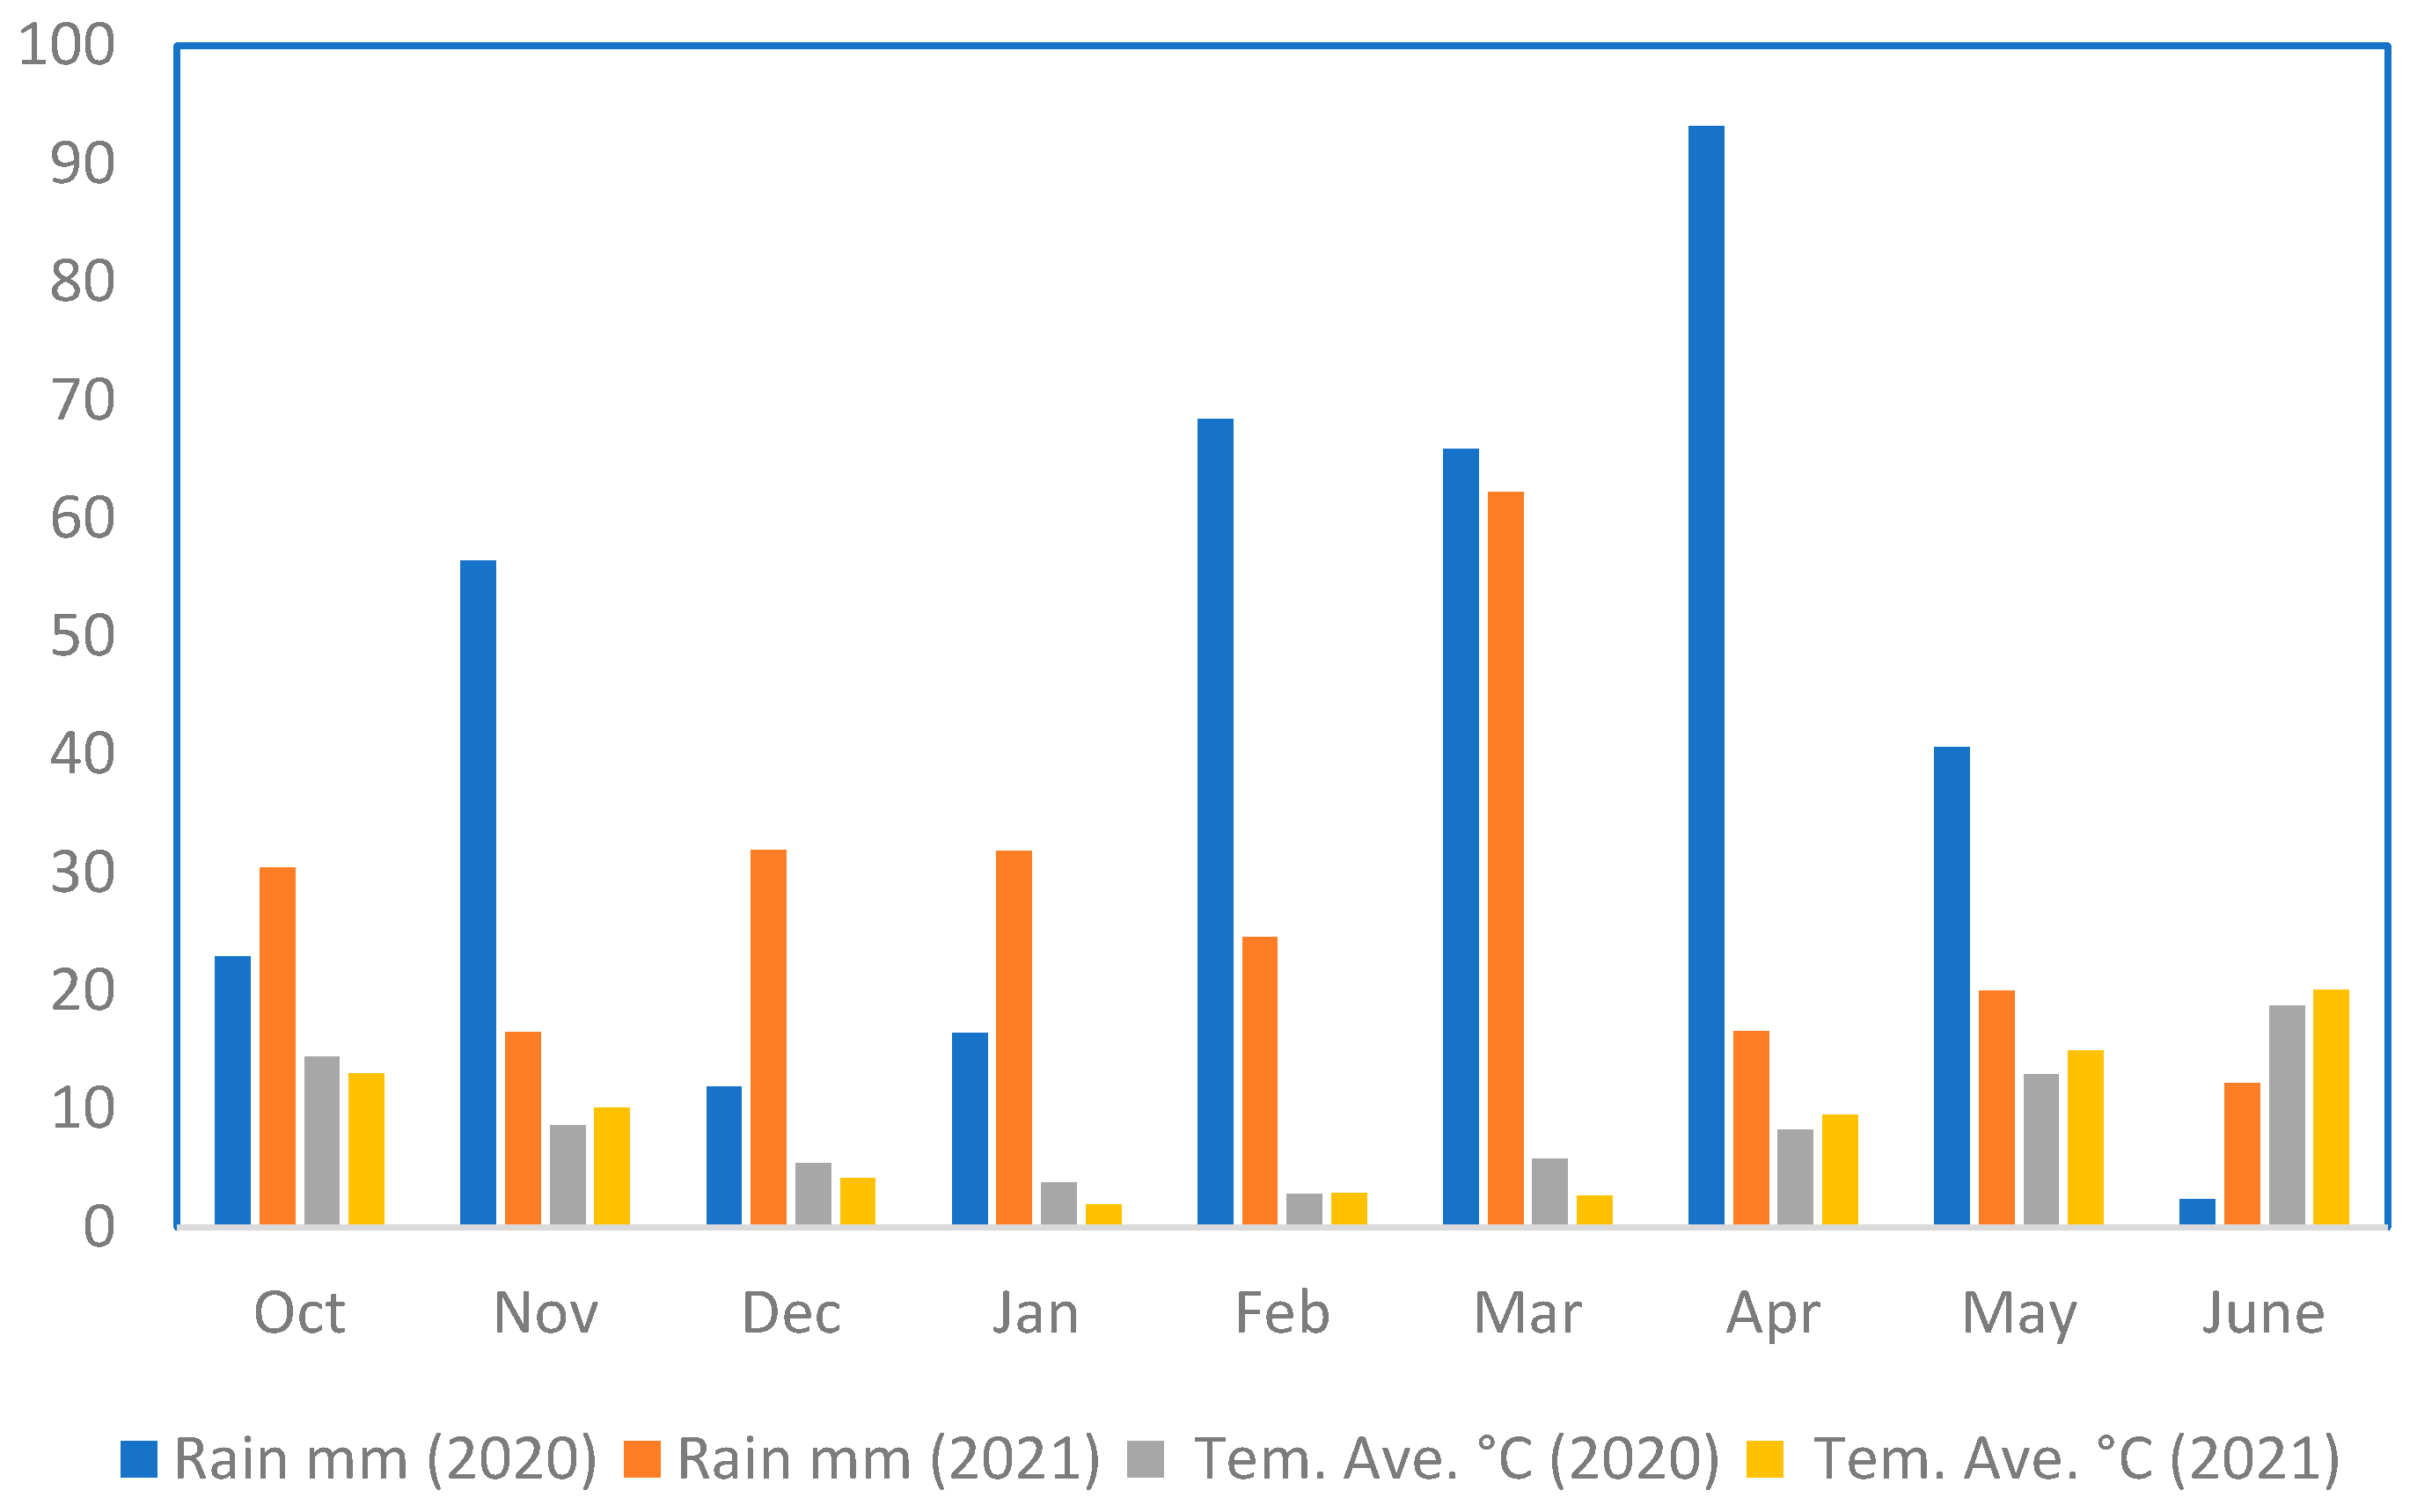
Figure 1. Rainfall and temperature in the experimental region.
Biotech 11 00032 g001
Figure 2. Correlation of study traits in F8 wheat lines resulting from Gonbad × Zagros in 2020.
Biotech 11 00032 g002
Figure 3. Correlation of study traits in F8 wheat lines resulting from Gonbad × Zagros in 2021.
Biotech 11 00032 g003
Figure 4. Classification of F8 wheat lines resulting from Gonbad × Zagros in 2020 and 2021.
Biotech 11 00032 g004
Figure 5. The reaction of lines caused Gonbad × Zagros crosses by considering significant traits in 2020 and 2022 using Biplot. Identifying genotypes with higher values for traits (A,D), determining the best genotype considering significant traits (B,E), and identifying the most important traits affecting genetic diversity (C,F).
Biotech 11 00032 g005
Figure 6. SSR linkage map developed using F8 wheat lines resulting from Gonbad × Zagros.
Biotech 11 00032 g006aBiotech 11 00032 g006b
Figure 7. Correlation of study traits in F8 wheat lines resulting from Gonbad × Kohdasht in 2020.
Biotech 11 00032 g007
Figure 8. Correlation of study traits in F8 wheat lines resulting from Gonbad × Kohdasht in 2021.
Biotech 11 00032 g008
Figure 9. Classification of F8 wheat lines resulting from Gonbad × Kohdasht in 2020 and 2021.
Biotech 11 00032 g009
Figure 10. The reaction of lines caused by Gonbad × Kohdasht crosses by considering significant traits in 2020 and 2022 using Biplot. Identifying genotypes with higher values for traits (A,D), determining the best genotype considering significant traits (B,E), and identifying the most important traits affecting genetic diversity (C,F).
Biotech 11 00032 g010aBiotech 11 00032 g010b
Figure 11. SSR linkage map developed using F8 wheat lines resulting from Gonbad × Kohdasht.
Biotech 11 00032 g011aBiotech 11 00032 g011b
Table 1. Results of stepwise regression of grain yield per hectare as a dependent variable and other traits as the independent variables in the F8 population resulting from Gonbad × Zagros in 2020.
Traits InterceptCoefficientsStd. ErrorFR2
b1b2
NSP1854.46143.909 ** 1044.419160.974 **0.577
TGW−1397.5444.152 **83.025 **1018.53588.166 **0.594
** significant at the 0.01 probability levels.
Table 2. Results of stepwise regression of grain yield per hectare as a dependent variable and other traits as the independent variables in the F8 population resulting from Gonbad × Zagros in 2021.
Traits InterceptCoefficientsStd. ErrorFR2
b1b2b3b4b5
NT3682.3146.156 ** 1005.02818.641 **0.276
NGS1678.0966.016 **9.014 ** 850.76423.197 **0.491
STW946.9915.345 **8.019 **0.108 * 806.54919.343 **0.552
FLW2121.7285.144 **7.257 **0.121 **−46,073.598 * 759.58418.104 **0.612
PD−1864.795.400 **7.249 **0.124 **−56,296.787 **1591.834 **680.97820.466 **0.695
* and ** significant at the 0.05 and 0.01 probability levels, respectively.
Table 3. QTLs identified using the F8 population derived from Gonbad × Zagrosin 2020.
Trait ChrPosition (cM)Additive EffectLODLeft_MarkerRight_MarkerR2 (%)
NGSqNGS-1A1A102.29−17.4403.42Xwmc744-1Acfa221922.15
qNGS-4B4B109.2514.82823.15gwm113cfd28316.01
PDLqPDL-1B1B4.851.7643.11gwm374.1gwm374.113.775
qPDL-4A4A97.361.56442.73Xgpw7543-4AXgpw7543-4A10.835
qPDL-4B4B193.57−1.6632.76gwm495gwm49512.245
FLLqFLL-1Da1D70.511.21983.86BARC169Xwmc147-1D17.625
qFLL-1Db1D161.52−1.25233.17gwm232Xgpw4311-1D18.575
GLqGL-4D4D196.250.69672.79BARC48BARC28827.985
GWqGW-2A2A49.620.14083.31BARC220BARC22026.035
NDFqNDF-6D6D02.522.97Xgpw7292-6DXgpw7292-6D30.635
TGWqTGW-1D1A177.282.67113.10Xgpw7258-1ABARC28728.495
WSPqWSP-2B1B74.3580.30482.59gdm28BARC8022.91
Table 4. QTLs identified using the F8 population derived from Gonbad × Zagros in 2021.
Trait ChrPosition
(cM)
Additive
Effect
LODLeft_MarkerRight_MarkerR2 (%)
NTqNT-2B2B37.23104.0973.12BARC00gwm42927.645
PHqPH-1A1A82.36−6.0642.99Xwmc93-1AXwmc93-1A16.635
qPH-3A3A53.56−4.7632.93BARC57cfa226210.265
PDLqPDL-1Ba1B49.222.2922.59Xwmc85-1BXwmc85-1B16.94
qPDL-1Bb1B160.32−2.1802.68Xgpw3190-1BBARC30215.325
SPLqSPL-7B7B127.750.7772.92Xwmc335-7Bgwm30226.06
WSPqWSP-2B2B73.250.2243.45gwm630gwm63019.585
qWSP-3A3A15.65−0.2023.94Xgpw4221-3AXgpw2266-3A15.925
TWSPqTWSP-6A6A12.36200.0934.04BARC171BARC17131.365
GWSPqGWSP-7A7A121.47−0.1952.54cfa2257cfa225721.36
GWqGW-7B7B209.450.2162.12gwm611Xwmc792-7B21.58
GLqGL-1Da1D67.69−2.6302.99BARC169Xwmc147-1D6.875
qGL-3Aa3A76.32−3.1343.39Xwmc640-3AXgpw7213-3A9.765
qGL-1Db1D37.23−1.8282.77Xwmc489-1DXwmc489-1D3.32
qGL-3Ab3A44.282.3933.97BARC57BARC575.69
qGL-7D7D78.323.3455.16Xgpw4385-7Dgdm14511.12
TGWqTGW-1D1D70.512.0412.59BARC169Xwmc147-1D22.54
HIqHI-7D7D35.226.223.18cfd41Xgpw2160-7D30.235
NFSPqNFSP-5D5D44.24−0.282.07BARC143Xgpw7238-5D18.765
NDFqNDF-4A4A18.09−2.6033.37Xgpw4545-4ABARC10626.095
NDMqNDM-6B6B174.36−1.4522.65gwm626gwm62625.99
GFPqGFP-5D5D138.29−1.9662.89Xwmc264-5Dcfd723.185
Table 5. Results of stepwise regression of grain yield per hectare as a dependent variable and other traits as the independent variables in the F8 population resulting from Gonbad × Kohdasht cross in 2020.
Traits InterceptCoefficientsStd. ErrorFR2 (%)
b1b2
NSP2671.30837.511 ** 1142.479108.576 **0.679
PD−557.58137.939 **1201.858 **1093.95365.065 **0.726
** significant at 0.01 probability levels.
Table 6. Results of stepwise regression of grain yield per hectare as a dependent variable and other traits as the independent variables in the F8 population resulting from Gonbad × Kohdasht cross in 2021.
Traits Entered in ModeInterceptCoefficientsStd. ErrorFR2 (%)
b1b2b3
NT4584.4164.059 ** 1022.69121.971 **0.157
NGS3179.4224.136 **5.922 ** 963.95320.274 **0.257
GL2183.1183.682 **6.310 **78.775 *943.13716.193 **0.295
* and ** significant at the 0.05 and 0.01 probability levels, respectively.
Table 7. QTLs identified using the F8 population derived from Gonbad × Kohdasht in 2020.
TraitQTLChrPosition (cM)Additive EffectLODLeft_MarkerRight_MarkerR2 (%)
NGSqNGS-6B6B33.26−8.03862.76Xgpw4175-6Bcfd1318.91
FLLqFLL-1Db3A40.260.60822.89BARC284Xwmc264-3A18.05
GLqGL-3D3D110.250.28172.70Xgwm645-3DXgpw7114-3D23.92
GWqGW-2A2A144.17−0.05982.56gwm71.1BARC2089.90
NSSPqNSSP-2A2A86.250.37512.88BARC201BARC20111.07
NSPqNSP-1B1B45.238.82263.07Xgpw4134Xgpw41348.72
qNSP-2A2A119.54−8.41772.68Xwmc261-2AXwmc261-2A7.94
qNSP-5D5D1.80−10.88522.77Xgpw4467-5Dcfd1813.28
HIqHI-1A1A108.75−3.82543.15gwm135Xwmc24-1A21.35
GYIqGYI-1B1B0−526.7363.23BARC181BARC1819.71
qGYI-5B5B102.39−747.9693.51Xgpw3124-5BXgpw5257-5B19.5
BYIqBYI-1B1B32.261579.433.03Xgpw3122-1BXgpw3122-1B8.23
qBYI-4A4A74.59−1627.63.04Xwmc173-4A.1Xwmc173-4A.18.74
qBYI-5D5D130.18−2353.144.05Xwmc161-5Dcfd1218.28
GWSPqGWSP-2B2B1.570.09665.71BARC1027gwm61413.35
qGWSP-6D6D141.22−0.08535.09Xgpw7433-6Dcfd21910.41
WSPqWSP-2B1A108.75−0.37223.07gwm135Xwmc24-1A12.81
qWSP-2B5A37.260.3312.71Xgpw2249-5AXgpw3049-5A10.13
qWSP-2B7B39.860.35262.51gwm333Xgpw4314-7B11.49
qWSP-2B2B83.26−0.25523.06Xgpw7641-2BXgpw7641-2B6.02
qWSP-2B2D103.260.24362.59XwmcD6-2DXwmcD6-2D5.48
Table 8. QTLs identified using the F8 population derived from Gonbad × Kohdasht in 2021.
Trait ChrPosition (cM)Additive EffectLODLeft_MarkerRight_MarkerR2 (%)
NSGqNSG-2A2A62.2322.20593.23BARC279BARC27913.67
NTqNT-5B5B64.300.4134.05Xgpw3035-5BBARC112021.16
PLqPL-2A2A28.821.03262.47BARC220Xgpw5177-2A15.83
AWLqOL-4D4D53.650.34342.44Xgpw4132-4DXgpw7795-4D12.79
qOL-6B6B17.61−0.39672.91BARC354gwm70517.06
STWqSTW-6B6B42.16−94.1382.37Xgpw7739-6Bgwm64418.35
NTSqNTS-2D2D43.0577.95664.13Xgpw332-2Dcfd23323.87
NSPqNSP-6D6D57.250.62142.71Xwmc113-6Dgwm13319.53
qNSP-4A4A97.960.40652.44BARC206Xgpw7051-4A8.36
NGSPqNGSP-1D1D49.93.1453.52Xgpw7082-1DXgpw7109-1D15.25
qNGSP-2A2A173.50−2.59842.69Xgwm382-2AXgwm356-2A10.41
qNGSP-4B4B8.432.99693.12gwm538BARC6013.85
GLqGL-1D1D49.91.37733.89Xgpw7082-1DXgpw7109-1D21.63
Publisher’s Note: MDPI stays neutral with regard to jurisdictional claims in published maps and institutional affiliations.