
Optimization of Sugar Extraction Process from Date Waste Using Full Factorial Design Toward Its Use for New Biotechnological Applications

 ,
, 
 , ,
, ,  , and
, and 
Abstract
1. Introduction
2. Materials and Methods
2.1. Samples and Reagents
2.2. Ultrasound-Assisted Extraction
2.3. Full Factorial Experimental Design
2.4. Analysis of Date Extracts
2.4.1. Total Sugar Content
2.4.2. Total Protein Content
2.4.3. Total Fat Content
2.4.4. Total Phenolic Content
2.4.5. Individual Sugar Profiles HPLC-IR
2.4.6. Determination of Mineral Element Contents
2.5. Infrared Spectroscopy FTIR
2.6. Morphological Characterization Using Scanning Electron Microscopy (SEM)
2.7. Statistical Analysis
3. Results and Discussion
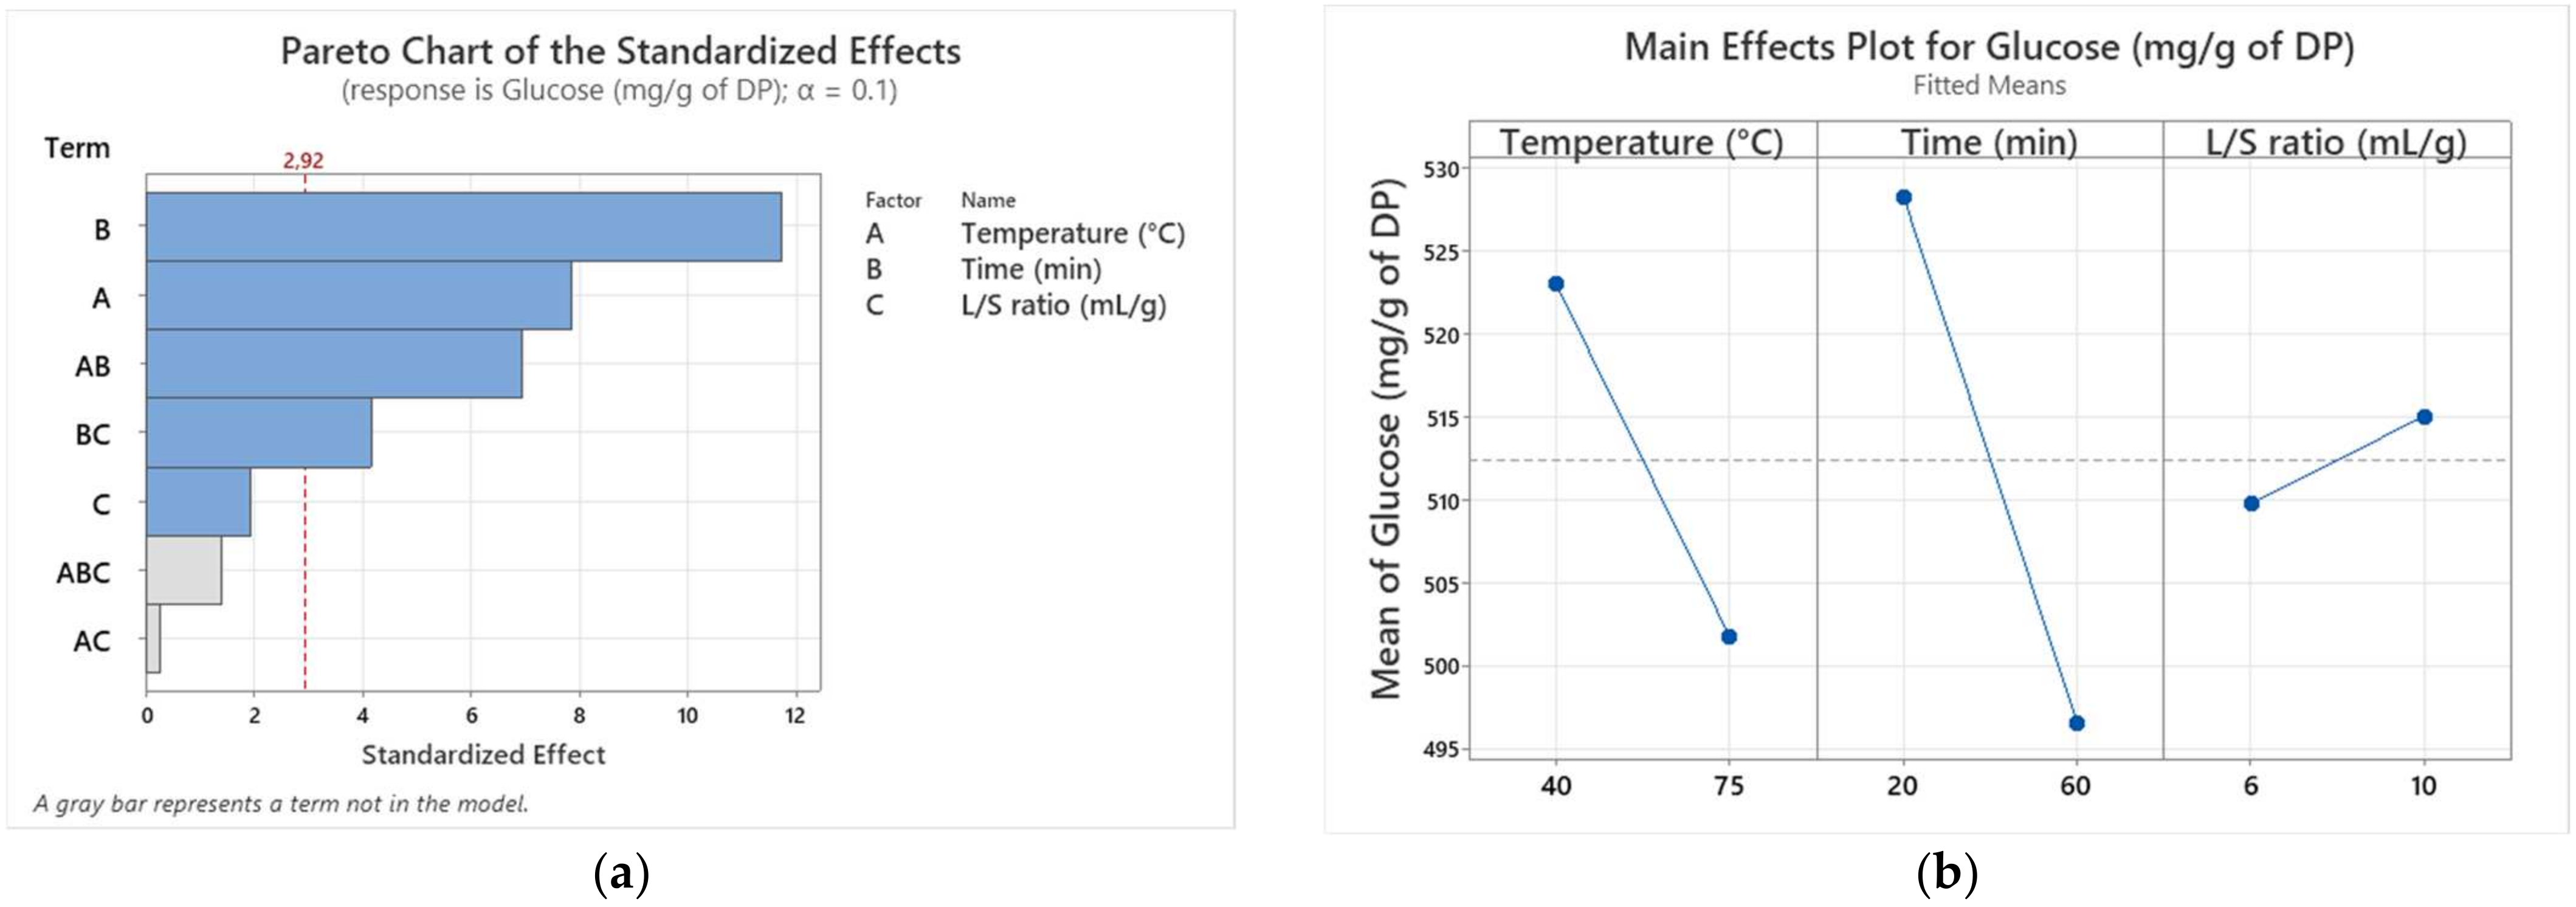
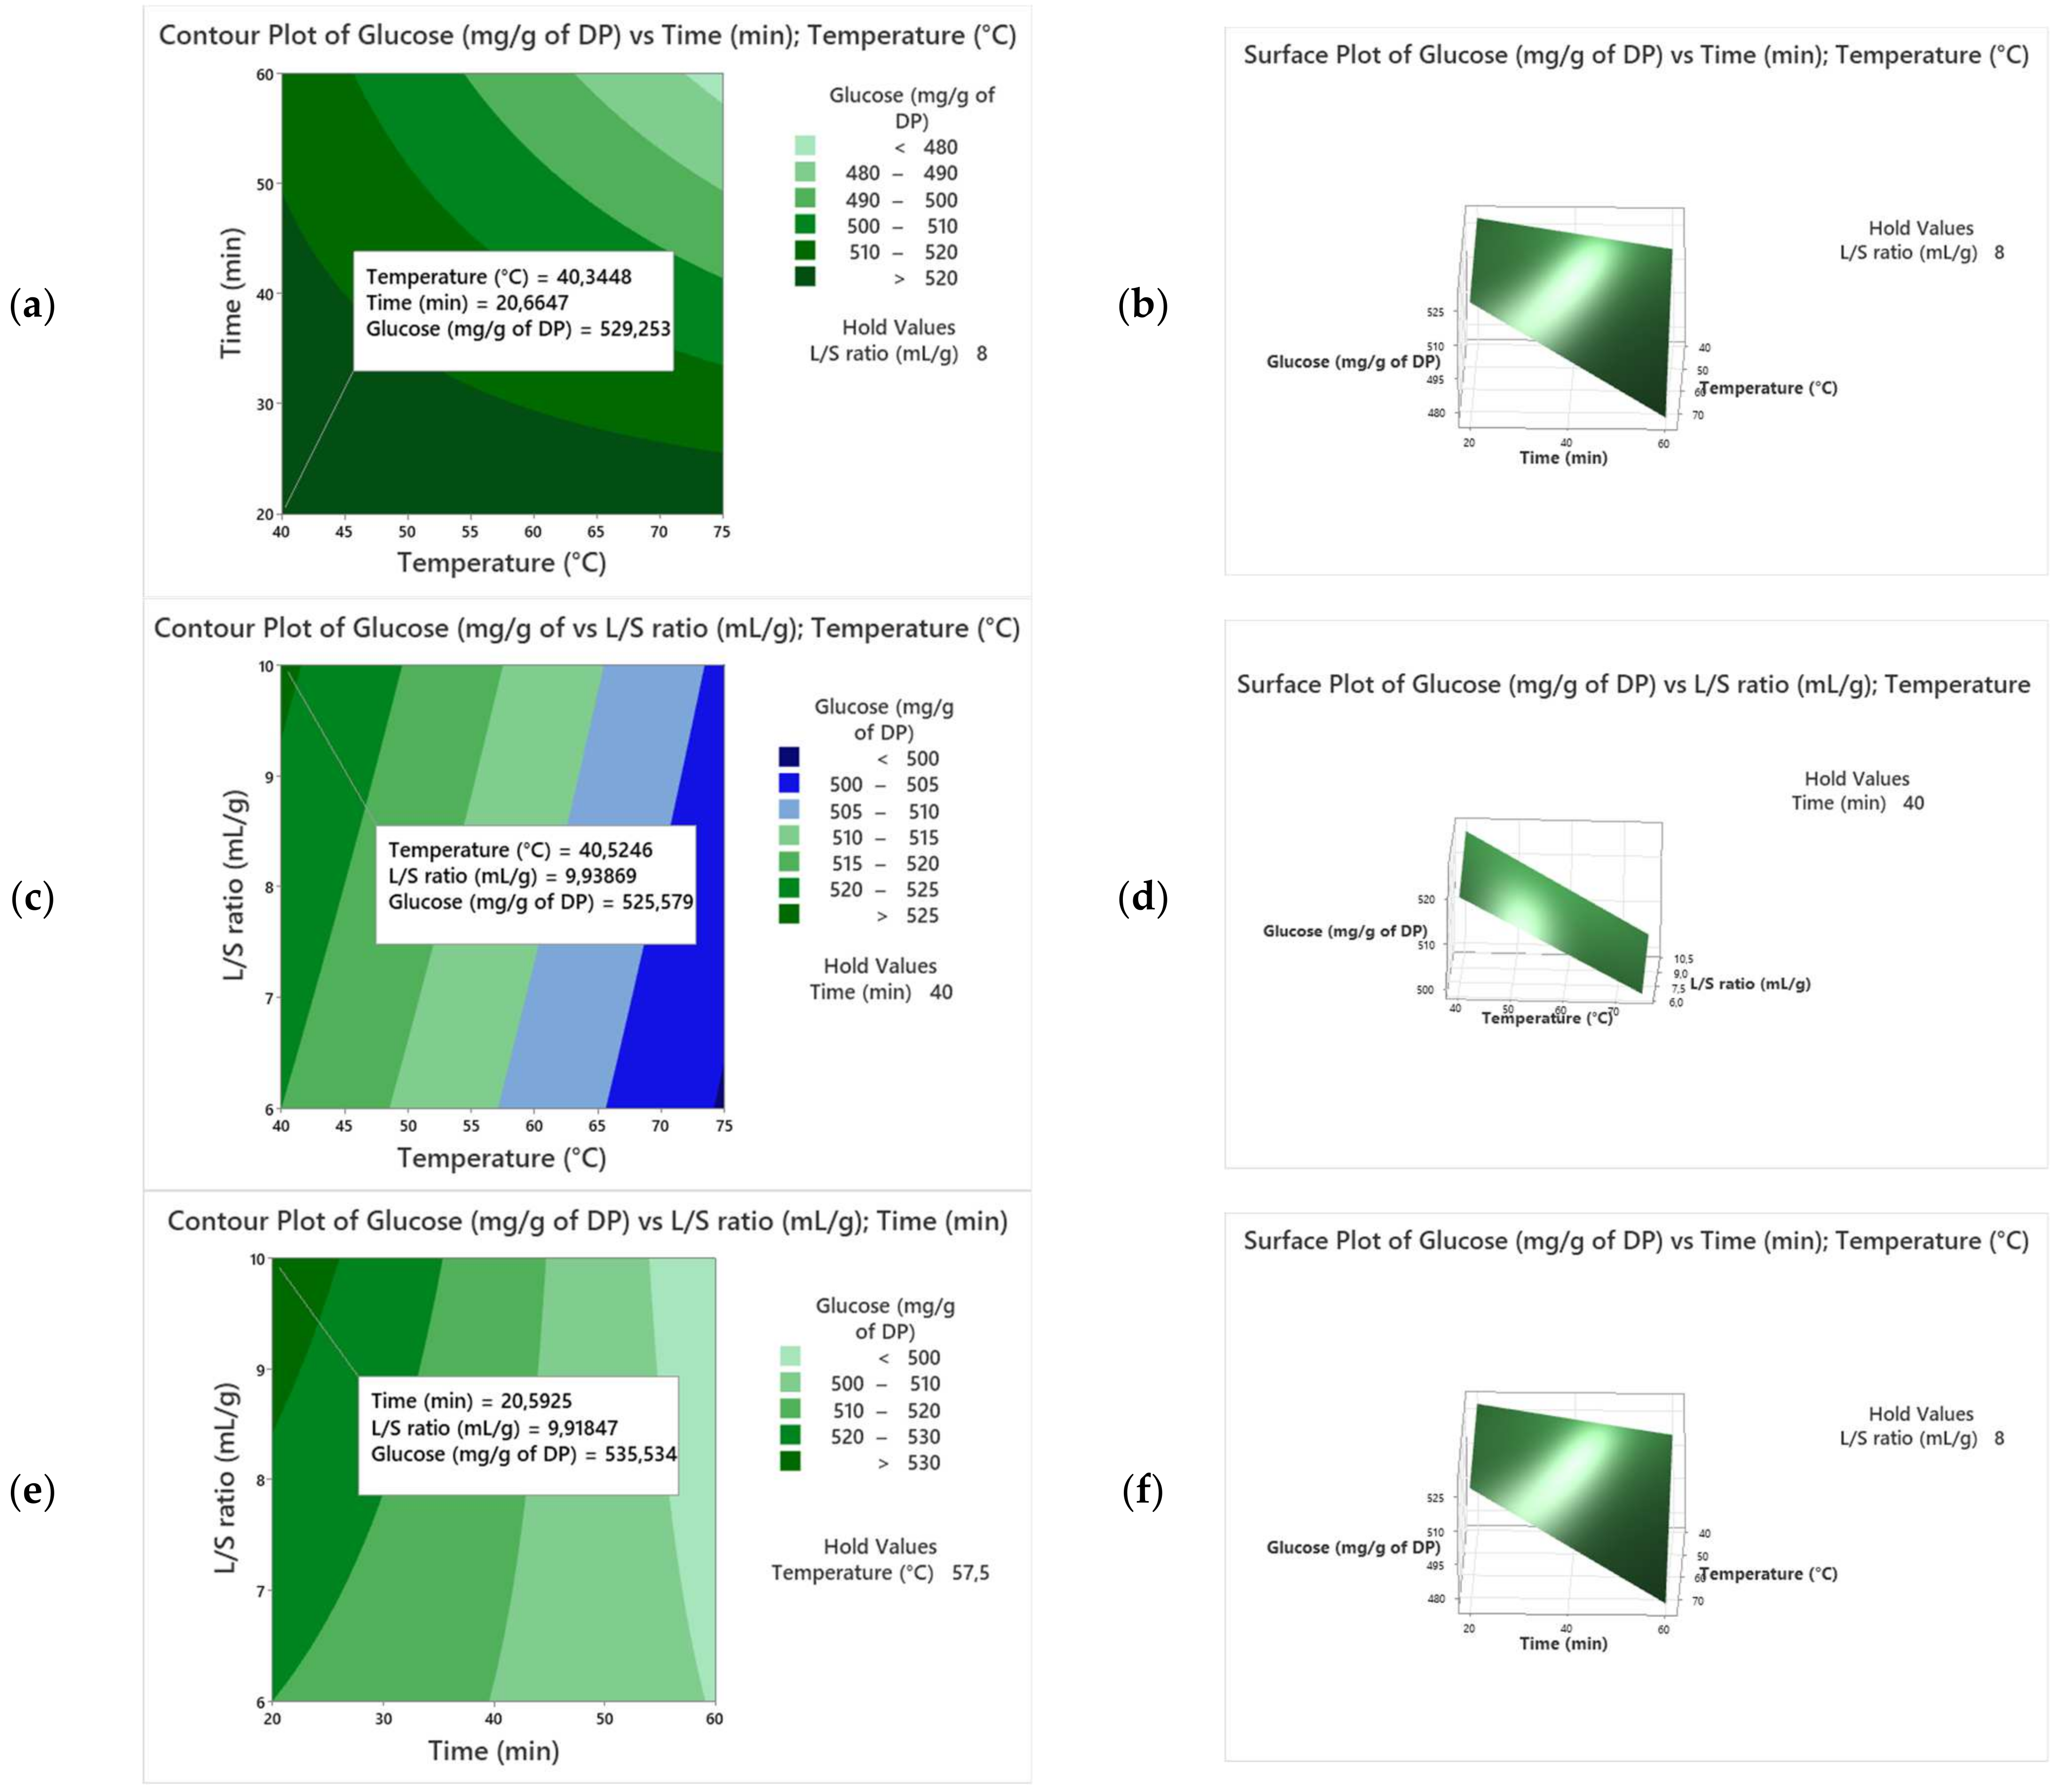
3.1. Variety Alig
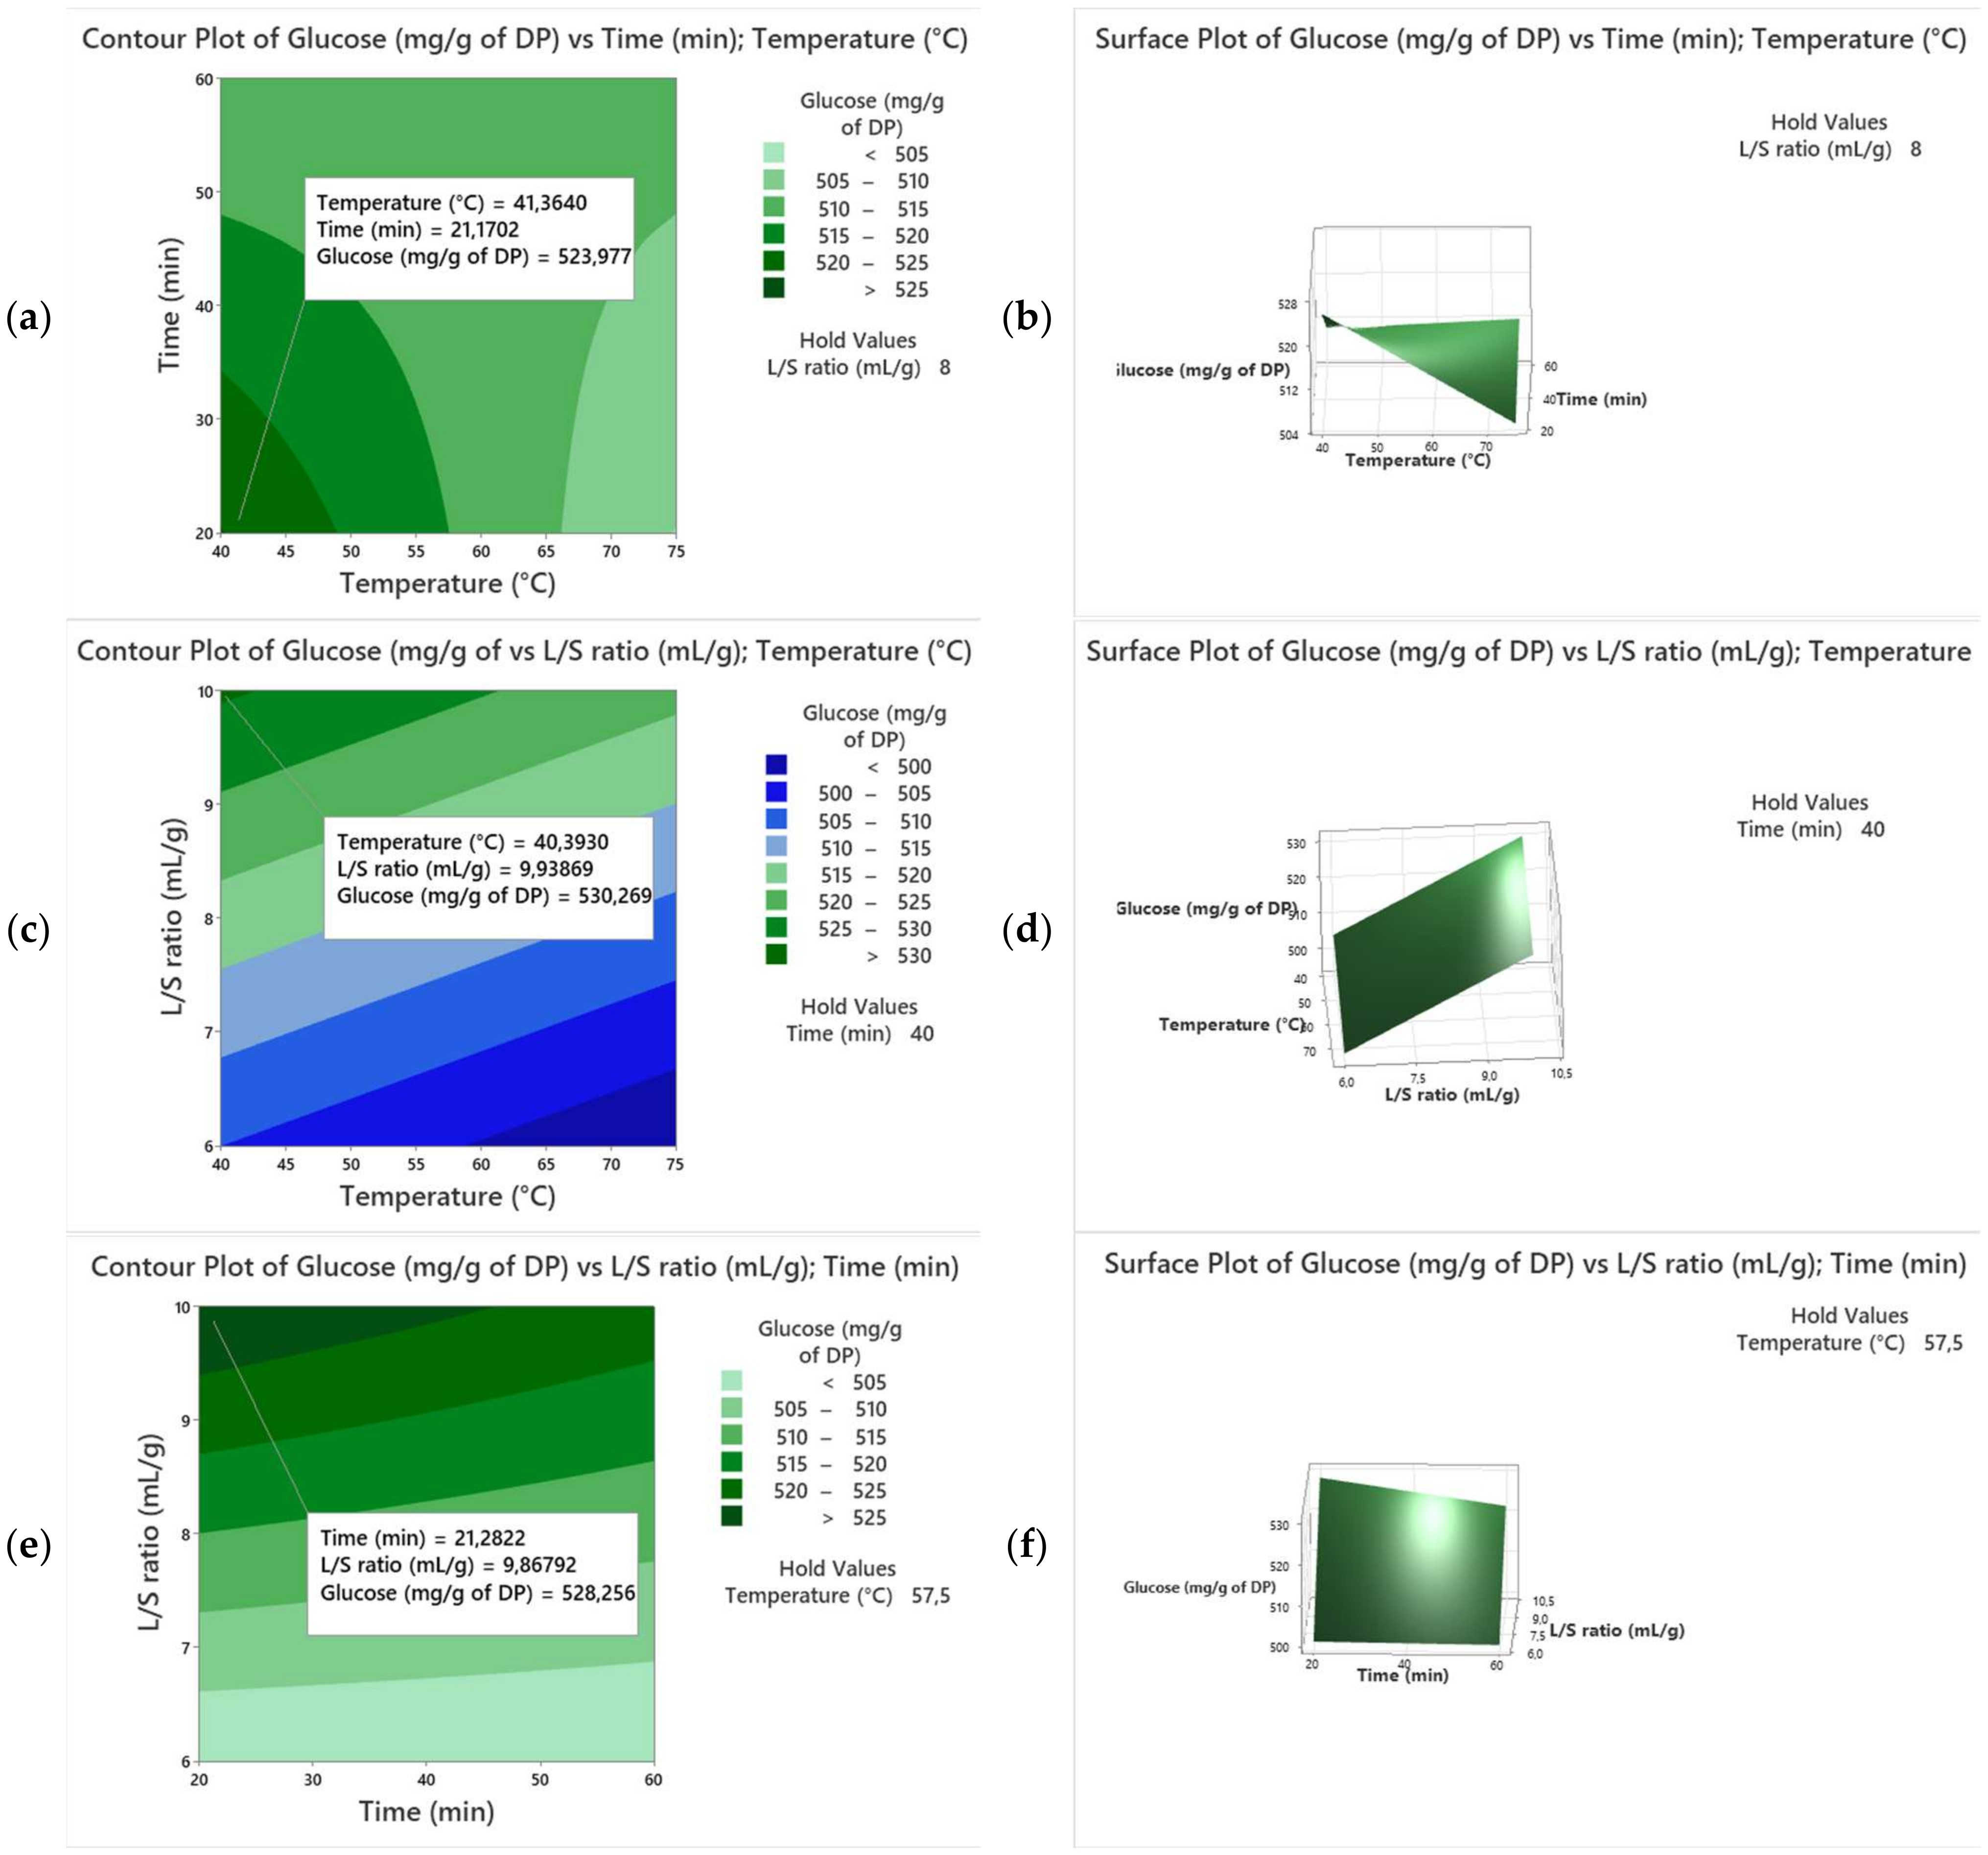
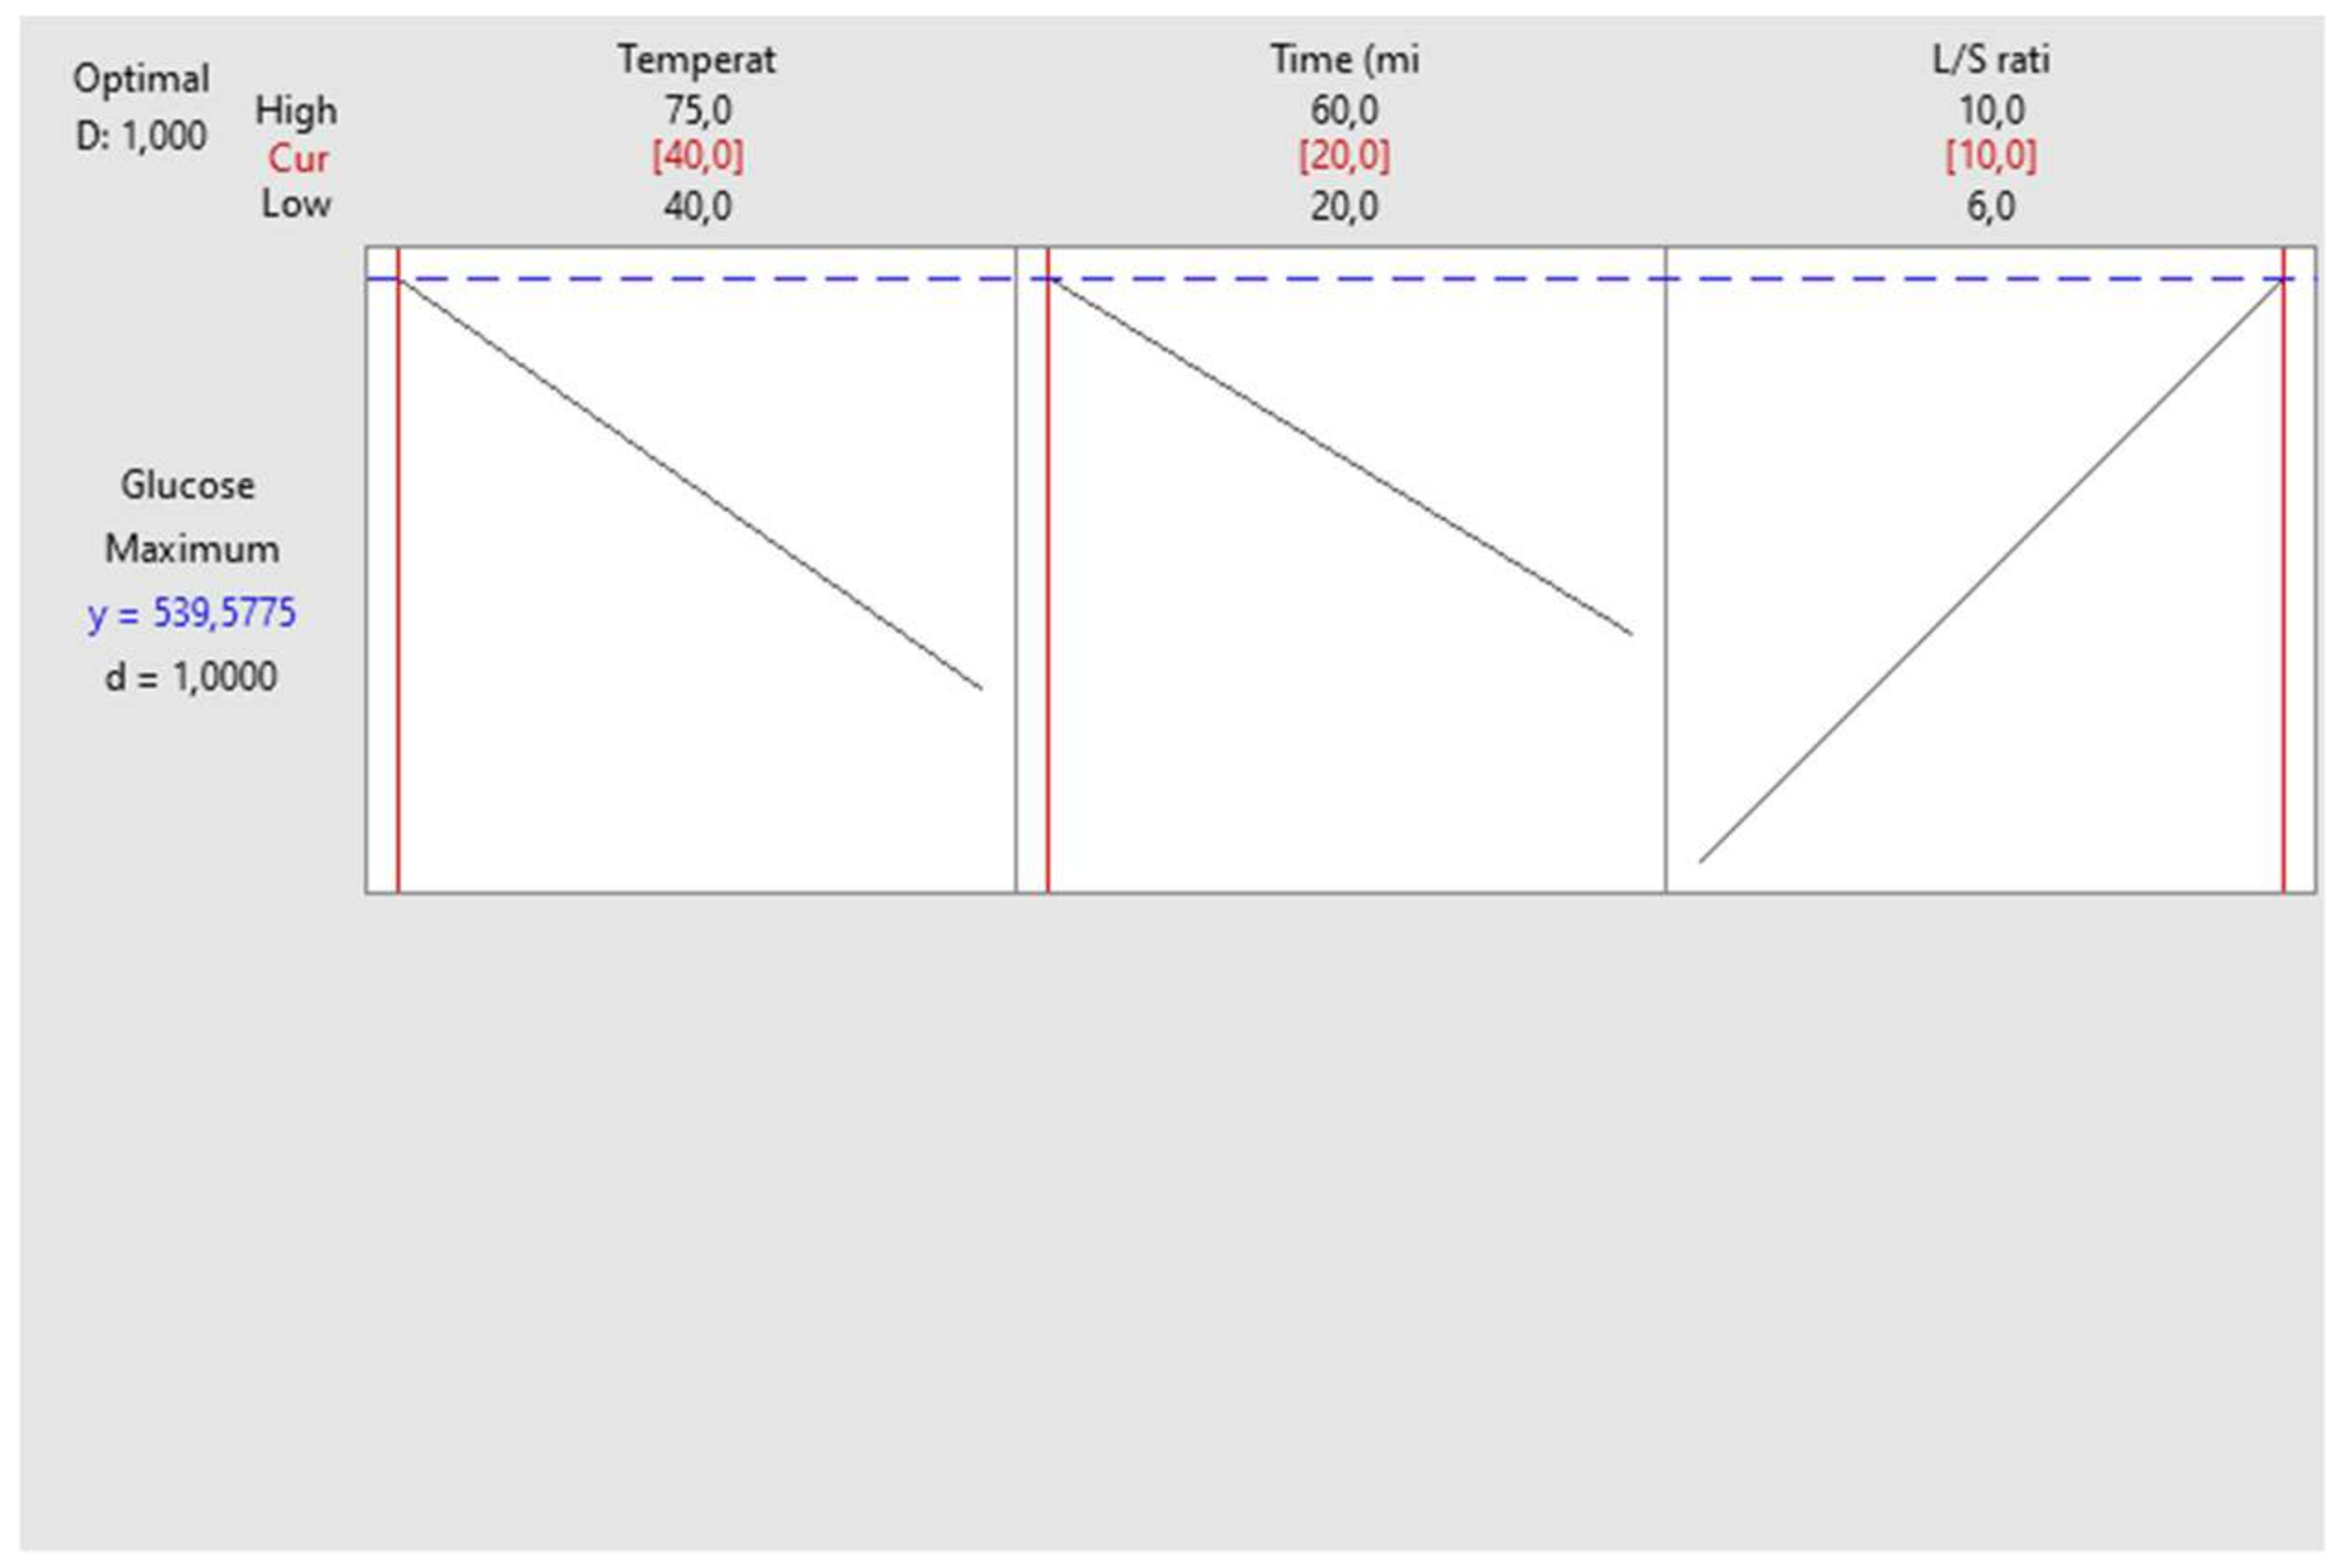
3.2. Variety Kentichi
3.3. Characterization of Optimized Date Extracts
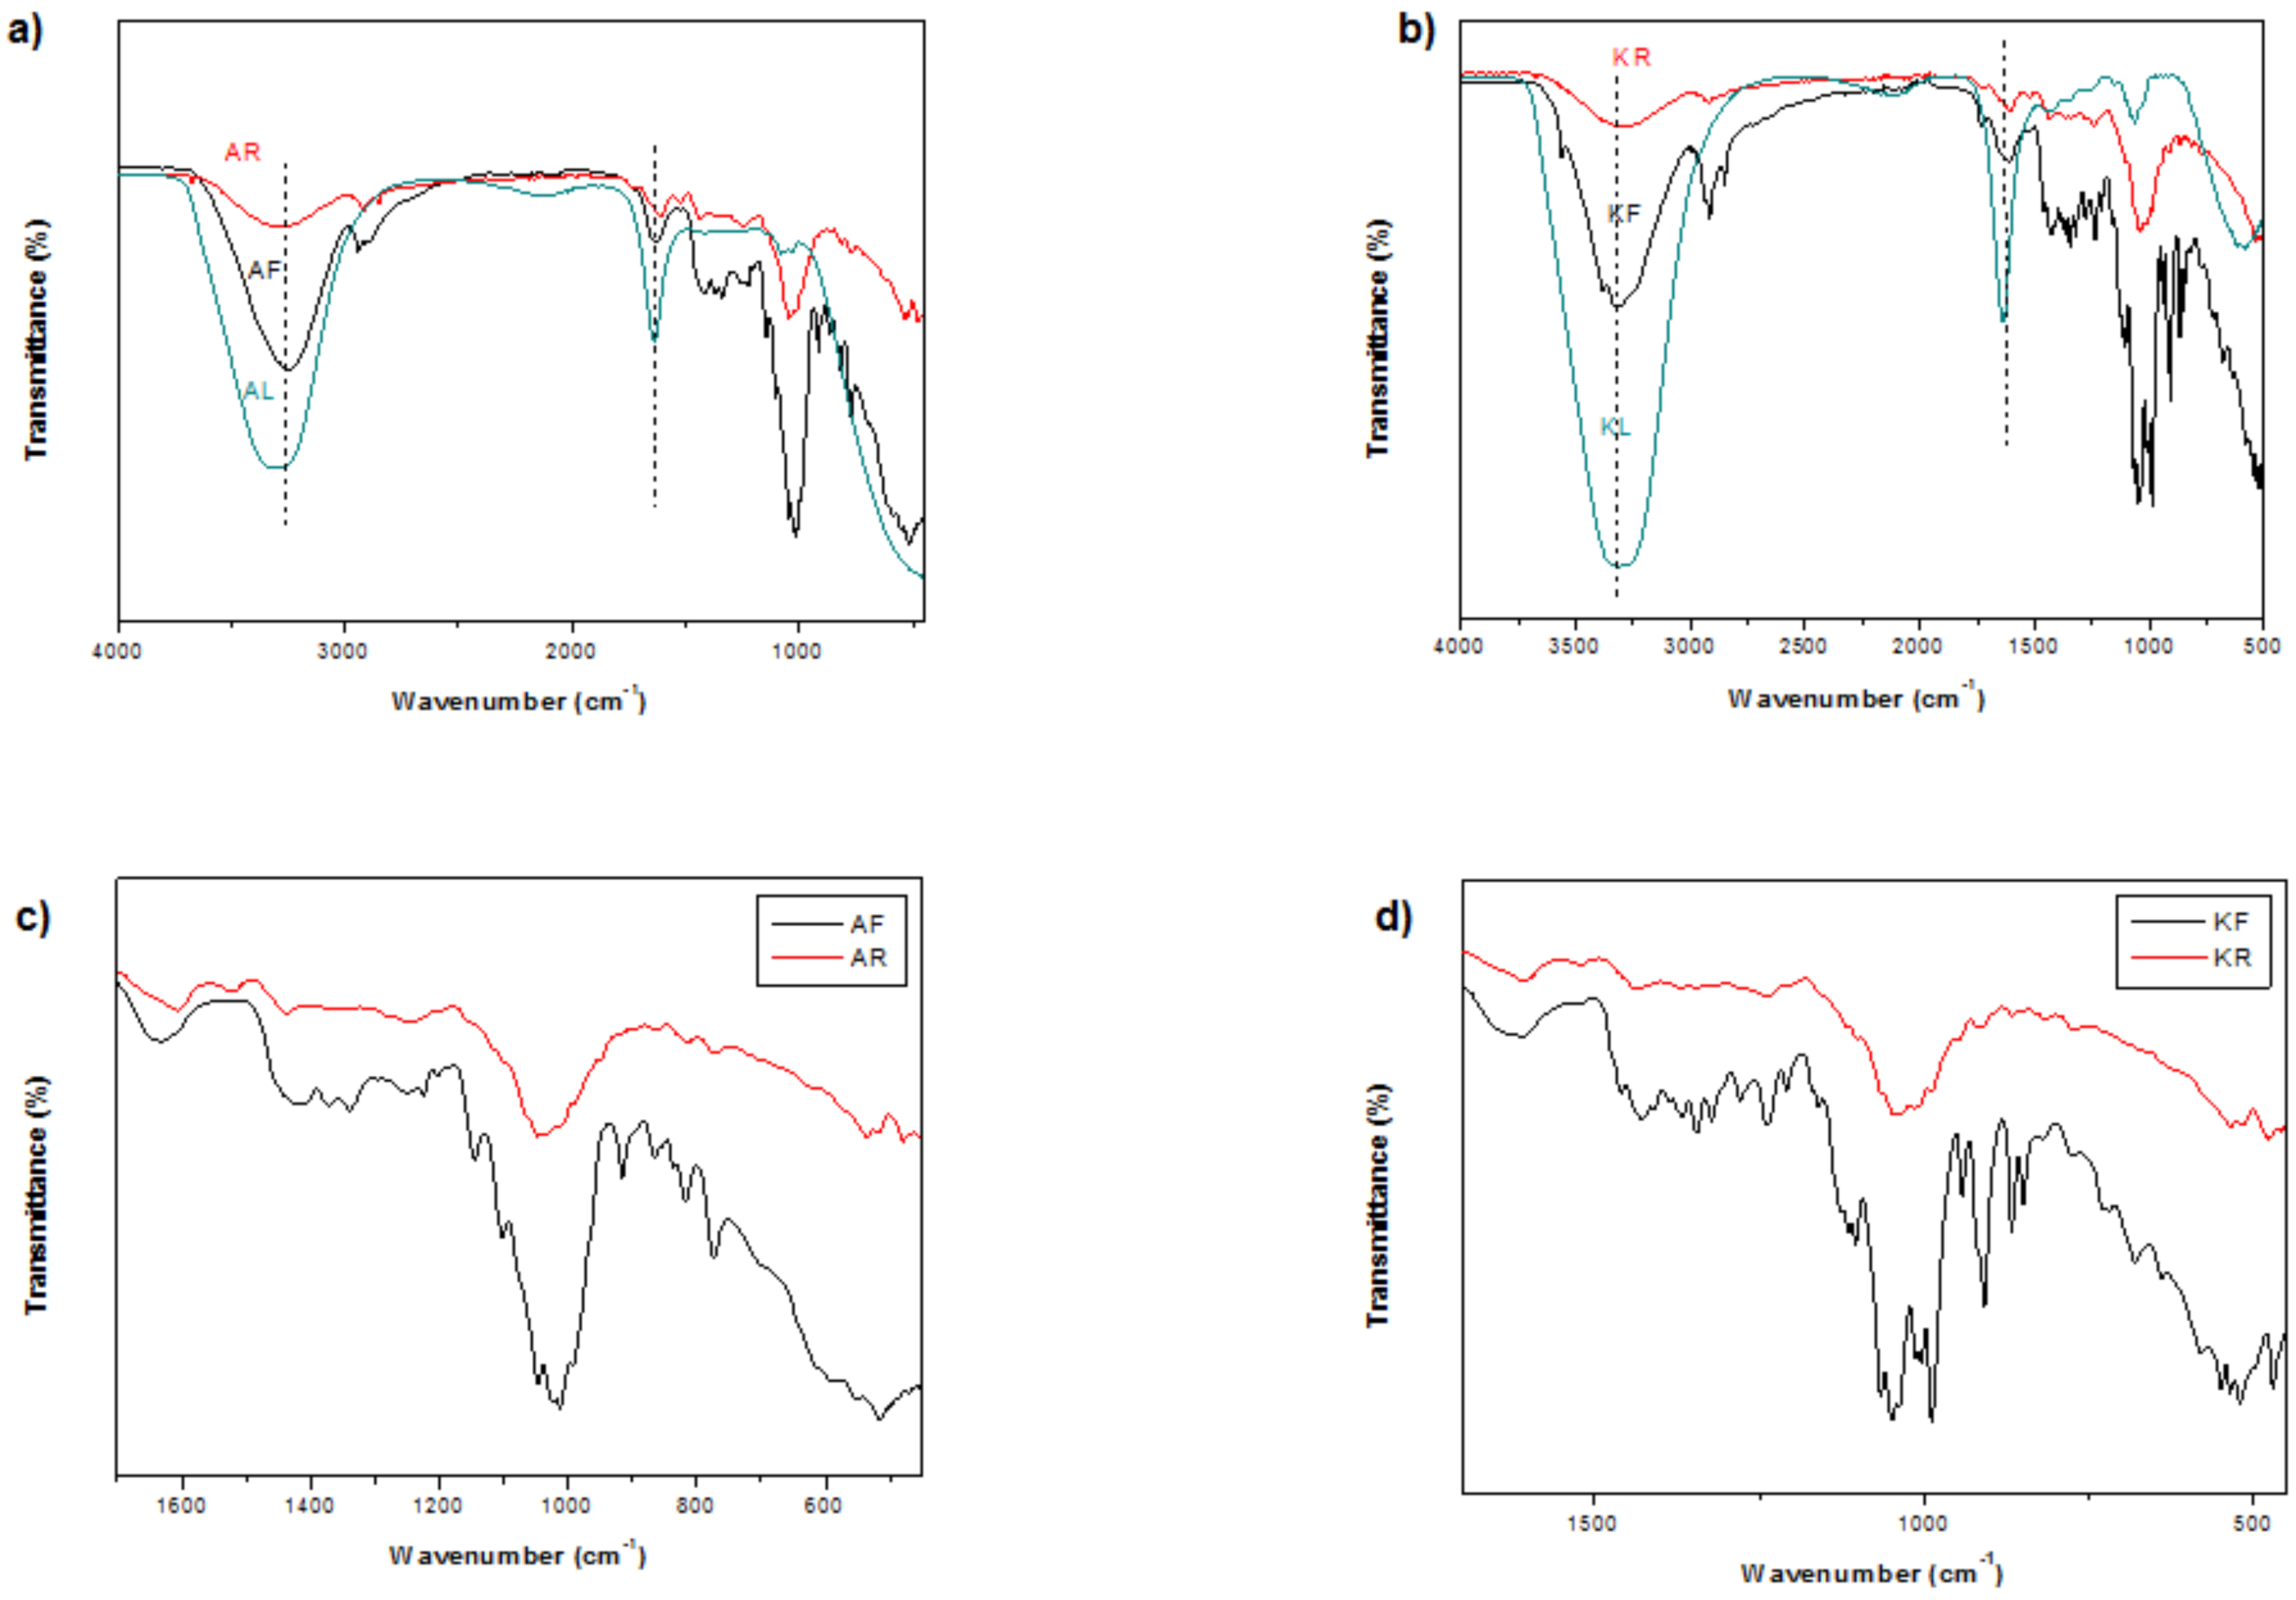
3.4. FT-IR Analysis
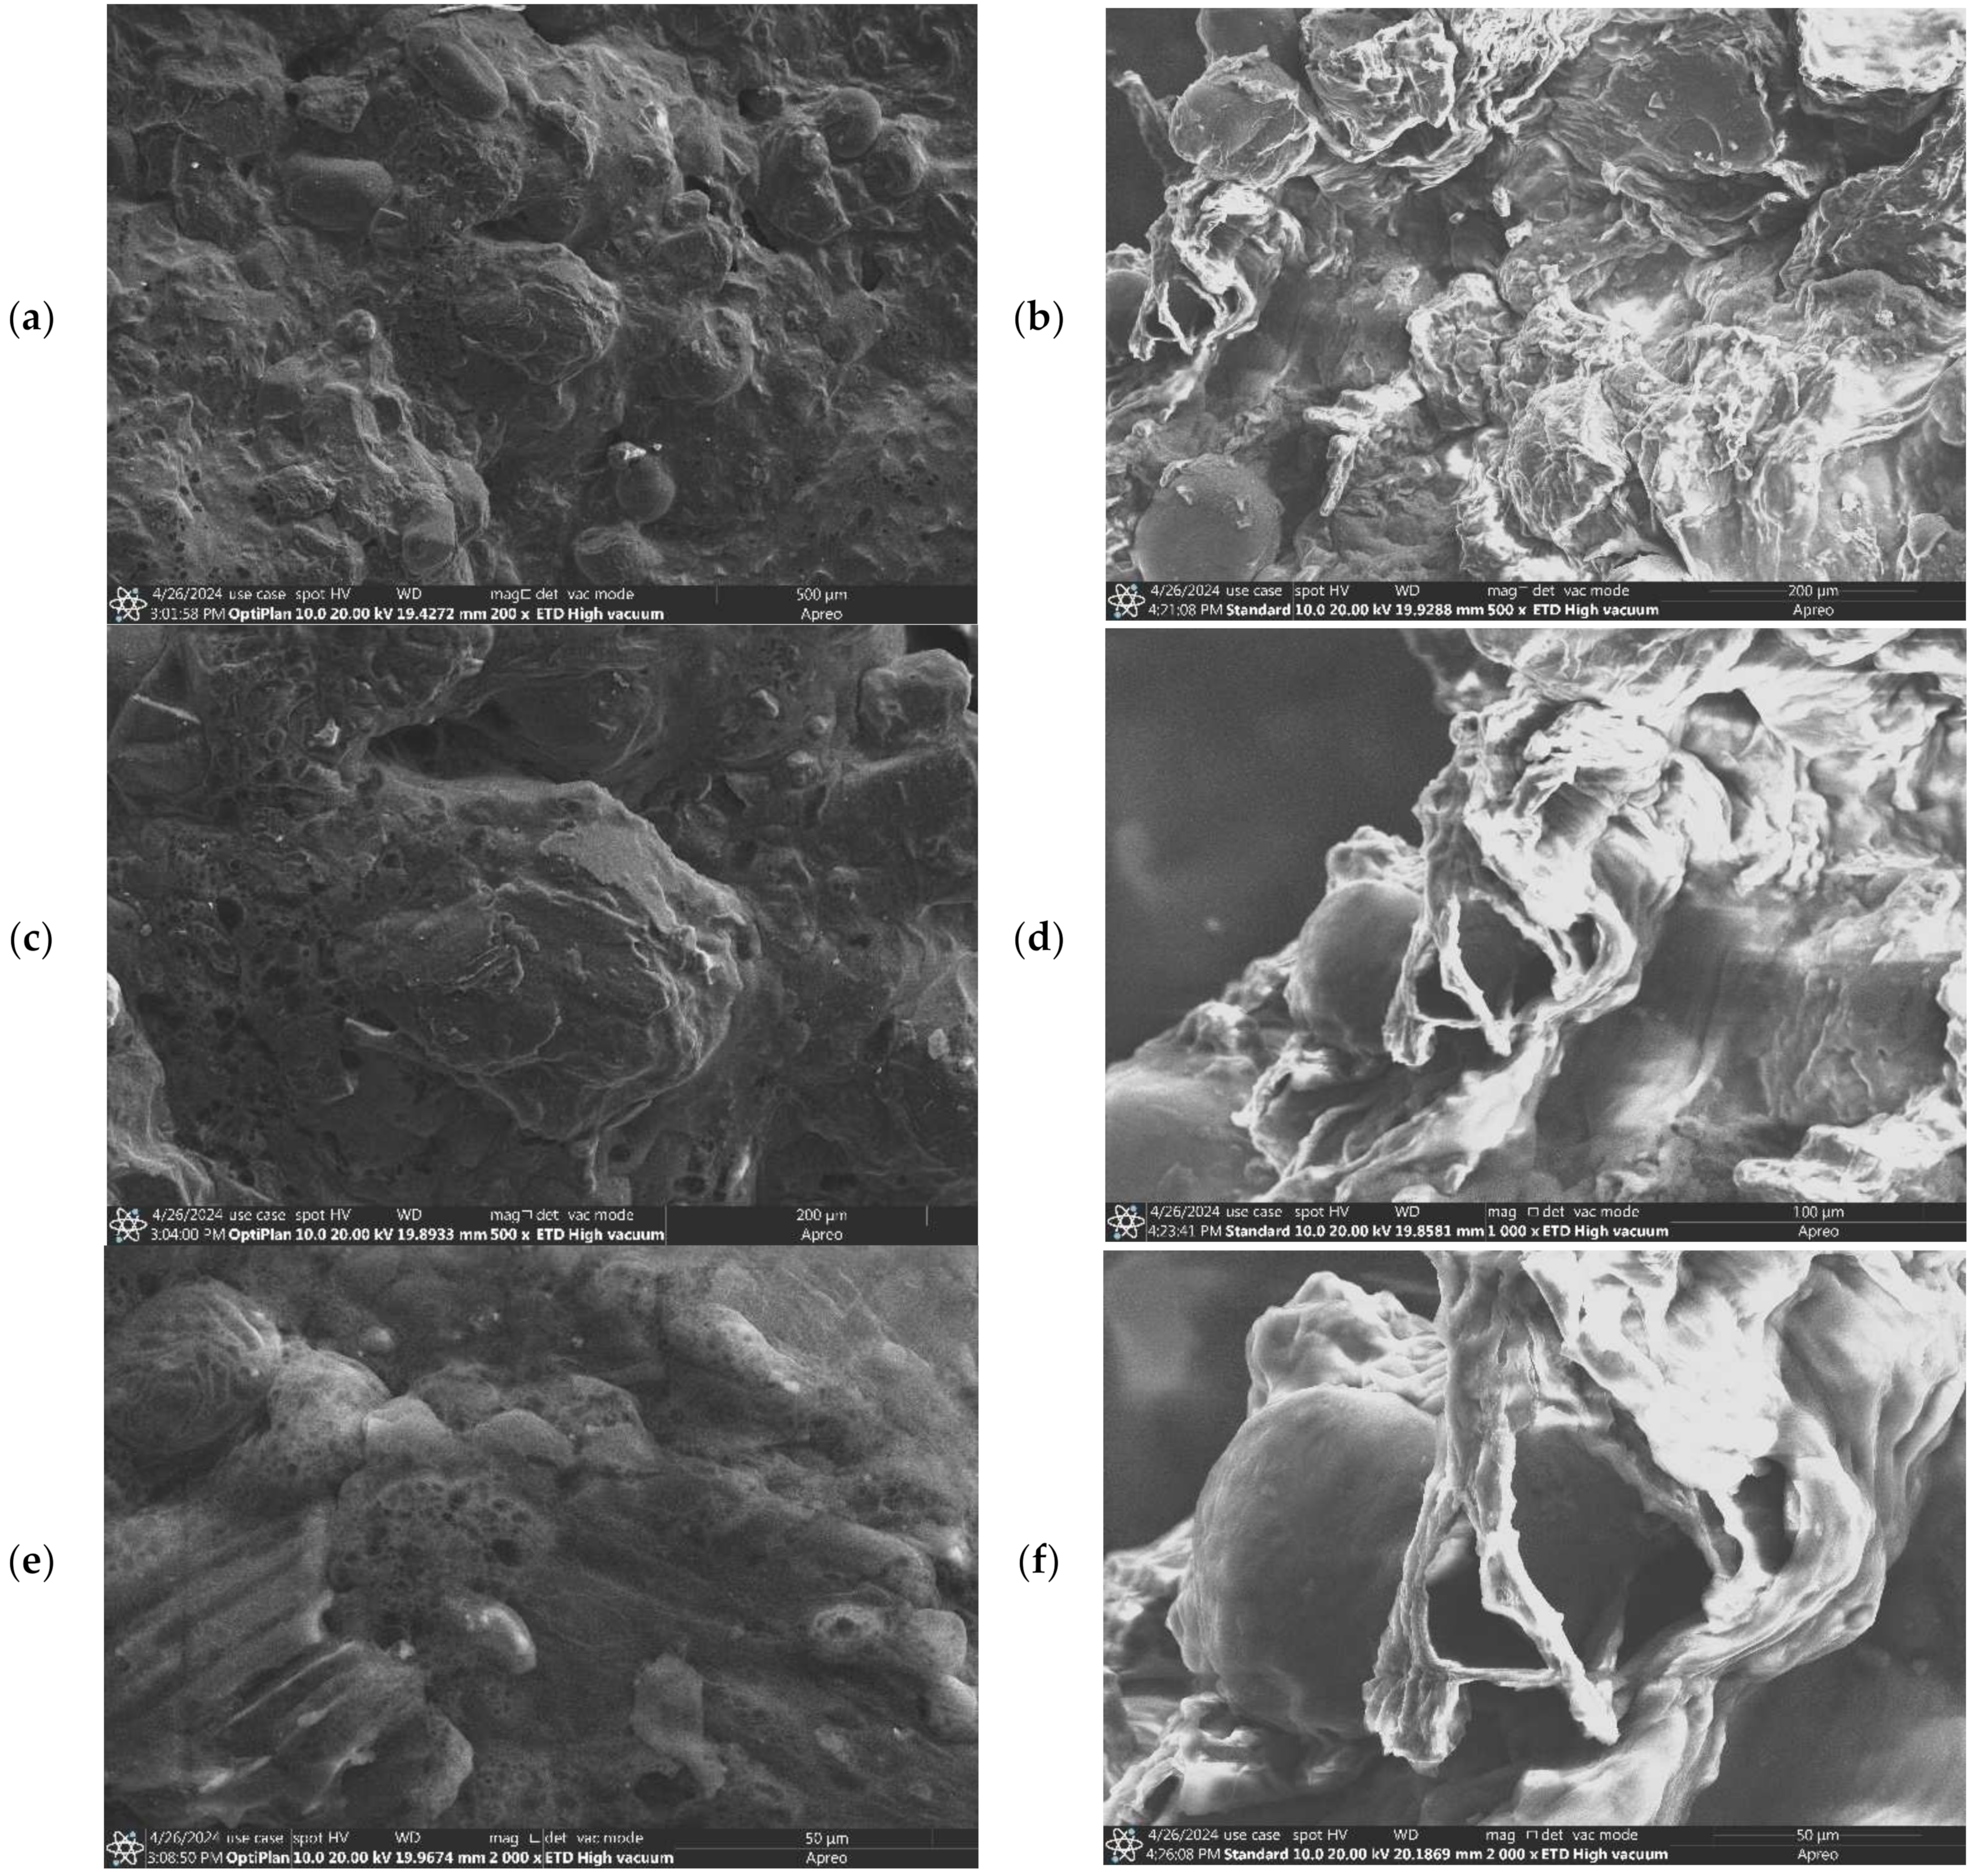
3.5. Scanning Electron Microscopy (SEM)
4. Conclusions
Supplementary Materials
Author Contributions
Funding
Institutional Review Board Statement
Informed Consent Statement
Data Availability Statement
Conflicts of Interest
References
- Al-Shahib, W.; Marshall, R.J. The Fruit of the Date Palm: Its Possible Use as the Best Food for the Future? Int. J. Food Sci. Nutr. 2003, 54, 247–259. [Google Scholar] [CrossRef] [PubMed]
- Boughzala, Y.; Ben Mahmoud, N. Valorisation de La Filière Dattes En Tunisie Par l’association Savoirs et Techniques “Modernes” et “Traditionnels”: Difficultés, Succès et Perspectives. Sci. Technol. Développement 2022, 2, 1–20. [Google Scholar] [CrossRef]
- General Directorate of Agricultural Studies and Development Agricultural Statistics Yearbook 2020, Tunisia. Available online: http://www.onagri.nat.tn/uploads/statistiques/Annuaire-Statistique-2020VF.pdf (accessed on 10 July 2024).
- Smaali, I.; Jazzar, S.; Soussi, A.; Muzard, M.; Aubry, N.; Nejib Marzouki, M. Enzymatic Synthesis of Fructooligosaccharides from Date By-Products Using an Immobilized Crude Enzyme Preparation of β-Dfructofuranosidase from Aspergillus Awamori NBRC 4033. Biotechnol. Bioprocess Eng. 2012, 17, 385–392. [Google Scholar] [CrossRef]
- Al-Farsi, M.A.; Lee, C.Y. Nutritional and Functional Properties of Dates: A Review. Crit. Rev. Food Sci. Nutr. 2008, 48, 877–887. [Google Scholar] [CrossRef]
- Ashraf, Z.; Hamidi-Esfahani, Z. Date and Date Processing: A Review. Food Rev. Int. 2011, 27, 101–133. [Google Scholar] [CrossRef]
- Chaira, N.; Smaali, M.I.; Martinez-Tomé, M.; Mrabet, A.; Murcia, M.A.; Ferchichi, A. Simple Phenolic Composition, Flavonoid Contents and Antioxidant Capacities in Water-Methanol Extracts of Tunisian Common Date Cultivars (Phoenixdactylifera L.). Int. J. Food Sci. Nutr. 2009, 60, 316–329. [Google Scholar] [CrossRef]
- El-Sharnouby, G.A.; Al-Eid, S.M.; Al, M.M. Utilization of Enzymes in the Production of Liquid Sugar from Dates. Afr. J. Biochem. Res. 2009, 3, 41–47. [Google Scholar]
- Messadi, N.; Mechmeche, M.; Setti, K.; Tizemmour, Z.; Hamdi, M.; Kachouri, F. Optimization of Extraction Parameters and Characterization of Tunisian Date Extract: A Scientific Approach Toward Their Utilization. Sugar Tech 2023, 25, 460–472. [Google Scholar] [CrossRef]
- Koutinas, A.A.; Vlysidis, A.; Pleissner, D.; Kopsahelis, N.; Lopez Garcia, I.; Kookos, I.K.; Papanikolaou, S.; Kwan, T.H.; Lin, C.S.K. Valorization of Industrial Waste and By-Product Streams via Fermentation for the Production of Chemicals and Biopolymers. Chem. Soc. Rev. 2014, 43, 2587–2627. [Google Scholar] [CrossRef]
- Nazari, S.H. Sonicated Date Syrup Media Preparation for Microbial Culture. Afr. J. Biotechnol. 2011, 10, 424–432. [Google Scholar]
- Chandrasekaran, M.; Bahkali, A.H. Valorization of Date Palm (Phoenix dactylifera) Fruit Processing by-Products and Wastes Using Bioprocess Technology—Review. Saudi J. Biol. Sci. 2013, 20, 105–120. [Google Scholar] [CrossRef] [PubMed]
- Ahmad, A.; Naqvi, S.A.; Jaskani, M.J.; Waseem, M.; Ali, E.; Khan, I.A.; Faisal Manzoor, M.; Siddeeg, A.; Aadil, R.M. Efficient Utilization of Date Palm Waste for the Bioethanol Production through Saccharomyces Cerevisiae Strain. Food Sci. Nutr. 2021, 9, 2066–2074. [Google Scholar] [CrossRef] [PubMed]
- Ojha, K.S.; Aznar, R.; O’Donnell, C.; Tiwari, B.K. Ultrasound Technology for the Extraction of Biologically Active Molecules from Plant, Animal and Marine Sources. TrAC Trends Anal. Chem. 2020, 122, 115663. [Google Scholar] [CrossRef]
- Watrelot, A.A.; Bouska, L. Optimization of the Ultrasound-Assisted Extraction of Polyphenols from Aronia and Grapes. Food Chem. 2022, 386, 132703. [Google Scholar] [CrossRef]
- AlYammahi, J.; Hai, A.; Krishnamoorthy, R.; Arumugham, T.; Hasan, S.W.; Banat, F. Ultrasound-Assisted Extraction of Highly Nutritious Date Sugar from Date Palm (Phoenix dactylifera) Fruit Powder: Parametric Optimization and Kinetic Modeling. Ultrason. Sonochem. 2022, 88, 106107. [Google Scholar] [CrossRef]
- Dubois, M.; Gilles, K.A.; Hamilton, J.K.; Rebers, P.A.; Smith, F. Colorimetric Method for Determination of Sugars and Related Substances. Anal. Chem. 1956, 28, 350–356. [Google Scholar] [CrossRef]
- Official Methods of Analysis, 22nd Edition. 2023. Available online: https://www.aoac.org/official-methods-of-analysis/ (accessed on 25 September 2024).
- Washburn, K.W. A Modification of the Folch Method of Lipid Extraction for Poultry. Poult. Sci. 1989, 68, 1425–1427. [Google Scholar] [CrossRef]
- Cicco, N.; Lanorte, M.T.; Paraggio, M.; Viggiano, M.; Lattanzio, V. A Reproducible, Rapid and Inexpensive Folin-Ciocalteu Micro-Method in Determining Phenolics of Plant Methanol Extracts. Microchem. J. 2009, 91, 107–110. [Google Scholar] [CrossRef]
- Muntean, E.; Bărăscu, N. Soluble Carbohydrates in Several Transylvanian Potato Cultivars. Plants 2023, 12, 70. [Google Scholar] [CrossRef]
- Lo Vecchio, G.; Cicero, N.; Nava, V.; Macrì, A.; Gervasi, C.; Capparucci, F.; Sciortino, M.; Avellone, G.; Benameur, Q.; Santini, A.; et al. Chemical Characterization, Antibacterial Activity, and Embryo Acute Toxicity of Rhus Coriaria L. Genotype from Sicily (Italy). Foods 2022, 11, 538. [Google Scholar] [CrossRef]
- Mzoughi, Z.; Souid, G.; Timoumi, R.; Le Cerf, D.; Majdoub, H. Partial Characterization of the Edible Spinacia Oleracea Polysaccharides: Cytoprotective and Antioxidant Potentials against Cd Induced Toxicity in HCT116 and HEK293 Cells. Int. J. Biol. Macromol. 2019, 136, 332–340. [Google Scholar] [CrossRef] [PubMed]
- Jankovic, A.; Chaudhary, G.; Goia, F. Designing the Design of Experiments (DOE)—An Investigation on the Influence of Different Factorial Designs on the Characterization of Complex Systems. Energy Build. 2021, 250, 111298. [Google Scholar] [CrossRef]
- National Institute of Standards and Technology US Department of Commerce. Available online: https://www.itl.nist.gov/Div898/Handbook/Eda/Section3/Eda33a1.Htm (accessed on 23 January 2024).
- Chen, C.; Zhang, B.; Huang, Q.; Fu, X.; Liu, R.H. Microwave-Assisted Extraction of Polysaccharides from Moringa Oleifera Lam. Leaves: Characterization and Hypoglycemic Activity. Ind. Crops Prod. 2017, 100, 1–11. [Google Scholar] [CrossRef]
- Maran, J.P.; Sivakumar, V.; Thirugnanasambandham, K.; Sridhar, R. Optimization of Microwave Assisted Extraction of Pectin from Orange Peel. Carbohydr. Polym. 2013, 97, 703–709. [Google Scholar] [CrossRef]
- Entezari, M.H.; Nazari, S.H.; Haddad Khodaparast, M.H. The Direct Effect of Ultrasound on the Extraction of Date Syrup and Its Micro-Organisms. Ultrason. Sonochem. 2004, 11, 379–384. [Google Scholar] [CrossRef]
- Lin, T.; Liu, Y.; Lai, C.; Yang, T.; Xie, J.; Zhang, Y. The Effect of Ultrasound Assisted Extraction on Structural Composition, Antioxidant Activity and Immunoregulation of Polysaccharides from Ziziphus Jujuba Mill Var. Spinosa Seeds. Ind. Crops Prod. 2018, 125, 150–159. [Google Scholar] [CrossRef]
- Saafi, E.B.; El Arem, A.; Chahdoura, H.; Flamini, G.; Lachheb, B.; Ferchichi, A.; Hammami, M.; Achour, L. Nutritional Properties, Aromatic Compounds and in Vitro Antioxidant Activity of Ten Date Palm Fruit (Phoenix dactylifera L.) Varieties Grown in Tunisia. Braz. J. Pharm. Sci. 2022, 58, e18871. [Google Scholar] [CrossRef]
- Lajnef, I.; Khemiri, S.; Ben Yahmed, N.; Chouaibi, M.; Smaali, I. Straightforward Extraction of Date Palm Syrup from Phoenix dactylifera L. Byproducts: Application as Sucrose Substitute in Sponge Cake Formulation. J. Food Meas. Charact. 2021, 15, 3942–3952. [Google Scholar] [CrossRef]
- Tang, Z.; Shi, L.; Aleid, S.M. Date Fruit: Chemical Composition, Nutritional and Medicinal Values, Products. J. Sci. Food Agric. 2013, 93, 2351–2361. [Google Scholar] [CrossRef]
- Ghnimi, S.; Umer, S.; Karim, A.; Kamal-Eldin, A. Date Fruit (Phoenix dactylifera L.): An Underutilized Food Seeking Industrial Valorization. NFS J. 2017, 6, 1–10. [Google Scholar] [CrossRef]
- Rangaraj, V.M.; Rambabu, K.; Banat, F.; Mittal, V. Effect of Date Fruit Waste Extract as an Antioxidant Additive on the Properties of Active Gelatin Films. Food Chem. 2021, 355, 129631. [Google Scholar] [CrossRef] [PubMed]
- AlYammahi, J.; Rambabu, K.; Thanigaivelan, A.; Hasan, S.W.; Taher, H.; Show, P.L.; Banat, F. Production and Characterization of Camel Milk Powder Enriched with Date Extract. LWT 2023, 179, 114636. [Google Scholar] [CrossRef]
- Salah-Tazdaït, R.; Tazdaït, D.; Berrahma, R.; Abdi, N.; Grib, H.; Mameri, N. Isolation and Characterization of Bacterial Strains Capable of Growing on Malathion and Fenitrothion and the Use of Date Syrup as an Additional Substrate. Int. J. Environ. Stud. 2018, 75, 466–483. [Google Scholar] [CrossRef]
- Elsanhoty, R.M.; Al-Turki, I.A.; Ramadan, M.F. Screening of Medium Components by Plackett–Burman Design for Carotenoid Production Using Date (Phoenix dactylifera) Wastes. Ind. Crops Prod. 2012, 36, 313–320. [Google Scholar] [CrossRef]
- Acourene, S.; Ammouche, A. Optimization of Ethanol, Citric Acid, and α-Amylase Production from Date Wastes by Strains of Saccharomyces Cerevisiae, Aspergillus Niger, and Candida Guilliermondii. J. Ind. Microbiol. Biotechnol. 2012, 39, 759–766. [Google Scholar] [CrossRef]
- Lotfiman, S.; Awang Biak, D.R.; Ti, T.B.; Kamarudin, S.; Nikbin, S. Influence of Date Syrup as a Carbon Source on Bacterial Cellulose Production by Acetobacter Xylinum 0416. Adv. Polym. Technol. 2018, 37, 1085–1091. [Google Scholar] [CrossRef]
- Xie, P.J.; Huang, L.X.; Zhang, C.H.; You, F.; Zhang, Y.L. Reduced Pressure Extraction of Oleuropein from Olive Leaves (Olea Europaea L.) with Ultrasound Assistance. Food Bioprod. Process. 2015, 93, 29–38. [Google Scholar] [CrossRef]
- Ferarsa, S.; Zhang, W.; Moulai-Mostefa, N.; Ding, L.; Jaffrin, M.Y.; Grimi, N. Recovery of Anthocyanins and Other Phenolic Compounds from Purple Eggplant Peels and Pulps Using Ultrasonic-Assisted Extraction. Food Bioprod. Process. 2018, 109, 19–28. [Google Scholar] [CrossRef]
- Santos, P.; Aguiar, A.C.; Barbero, G.F.; Rezende, C.A.; Martínez, J. Supercritical Carbon Dioxide Extraction of Capsaicinoids from Malagueta Pepper (Capsicum Frutescens L.) Assisted by Ultrasound. Ultrason. Sonochem. 2015, 22, 78–88. [Google Scholar] [CrossRef]
- Dias, A.L.B.; Arroio Sergio, C.S.; Santos, P.; Barbero, G.F.; Rezende, C.A.; Martínez, J. Effect of Ultrasound on the Supercritical CO2 Extraction of Bioactive Compounds from Dedo de Moça Pepper (Capsicum Baccatum L. Var. Pendulum). Ultrason. Sonochem. 2016, 31, 284–294. [Google Scholar] [CrossRef]
- Dong, W.; Chen, Q.; Wei, C.; Hu, R.; Long, Y.; Zong, Y.; Chu, Z. Comparison of the Effect of Extraction Methods on the Quality of Green Coffee Oil from Arabica Coffee Beans: Lipid Yield, Fatty Acid Composition, Bioactive Components, and Antioxidant Activity. Ultrason. Sonochem. 2021, 74, 105578. [Google Scholar] [CrossRef]


| Runs | X1 | X2 | X3 | Y (Alig) | Y (Kentichi) |
|---|---|---|---|---|---|
| 1 | 75 (+1) | 20 (−1) | 10 (+1) | 533 | 519.69 |
| 2 | 40(−1) | 60 (+1) | 10 (+1) | 512 | 521.22 |
| 3 | 75 (+1) | 60 (+1) | 6 (−1) | 478 | 500.1 |
| 4 | 75 (+1) | 20 (−1) | 6 (−1) | 521 | 490 |
| 5 | 40 (−1) | 20 (−1) | 6 (−1) | 519 | 511.2 |
| 6 | 40 (−1) | 20 (−1) | 10 (+1) | 540 | 539.14 |
| 7 | 40 (−1) | 60 (+1) | 6 (−1) | 521 | 500 |
| 8 | 75 (+1) | 60 (+1) | 10 (+1) | 475 | 524.28 |
| Source | DF | Adj SS | Adj MS | F-Value | p-Value |
|---|---|---|---|---|---|
| Model | 5 | 3930.63 | 786.13 | 53.75 | 0.018 |
| Linear | 3 | 2974.37 | 991.46 | 67.79 | 0.015 |
| X1 | 1 | 903.13 | 903.13 | 61.75 | 0.016 |
| X2 | 1 | 2016.12 | 2016.12 | 137.85 | 0.007 |
| X3 | 1 | 55.13 | 55.13 | 3.77 | 0.192 |
| 2-Way Interactions | 2 | 956.25 | 478.12 | 32.69 | 0.030 |
| X1 × X2 | 1 | 703.12 | 703.12 | 48.08 | 0.020 |
| X2 × X3 | 1 | 253.12 | 253.12 | 17.31 | 0.053 |
| Error | 2 | 29.25 | 14.63 | ||
| Total | 7 | 3959.88 |
| Source | DF | Adj SS | Adj MS | F-Value | p-Value |
|---|---|---|---|---|---|
| Model | 5 | 1787.22 | 357.44 | 241.84 | 0.004 |
| Linear | 3 | 1528.61 | 509.54 | 344.75 | 0.003 |
| X1 | 1 | 175.69 | 175.69 | 118.87 | 0.008 |
| X2 | 1 | 26.03 | 26.03 | 17.61 | 0.052 |
| X3 | 1 | 1326.90 | 1326.90 | 897.76 | 0.001 |
| 2-Way Interactions | 2 | 258.61 | 129.31 | 87.49 | 0.011 |
| X1 × X2 | 1 | 239.91 | 239.91 | 162.32 | 0.006 |
| X2 × X3 | 1 | 18.70 | 18.70 | 12.65 | 0.071 |
| Error | 2 | 2.96 | 1.48 | ||
| Total | 7 | 1790.18 |
| Parameter | Alig Variety | Kentichi Variety | p-Value |
|---|---|---|---|
| Sugar (%) | 60.2 ± 20.35 | 50.7 ± 4.617 | 0.001 |
| Protein (%) | 0.13 ± 0.004 | 0.1 ± 0.003 | 0.001 |
| Fats (%) | 0.01 ± 0.0023 | 0.01 ± 0.0104 | 0.139 |
| Mineral (%) | 0.46 ± 0.02 | 0.44 ± 0.01 | 0.39 |
| TPC (mg eq GAE/100 g) | 333 ± 4.16 | 254 ± 6.08 | <0.001 |
| Parameter (%) | Kentichi Variety | Alig Variety | p-Value |
|---|---|---|---|
| Glucose | 17.9 ± 2 | 30.3 ± 1.2 | 0.01 |
| Fructose | 24 ± 1.3 | 35.4 ± 0.8 | 0.001 |
| Sucrose | 22.8 ± 0.9 | 0.2 ± 0.18 | <0.001 |
| Maltose | 3.8 | 0 | |
| Lactose | 1 | 0 | |
| Maltotriose | 2.1 | 0 | |
| Total | 71.6 | 65.9 | <0.0001 |
| Mineral Element (mg/100 g of DP) | Alig Variety | Kentichi Variety | p-Value |
|---|---|---|---|
| Fe | 1.56 ± 0.1 | 1.67 ± 0.125 | 0.29 |
| Na | 9.61 ± 0.29 | 9.86 ± 0.11 | 0.235 |
| Ca | 38.32 ± 1 | 38.01 ± 1.01 | 0.725 |
| Mg | 40.82 ± 1.21 | 43.01 ± 0.41 | 0.041 |
| K | 363.79 ± 3.39 | 349.82 ± 7.61 | 0.044 |
| Zn | 1.09 ± 0.07 | 0.95 ± 0.11 | 0.136 |
Disclaimer/Publisher’s Note: The statements, opinions and data contained in all publications are solely those of the individual author(s) and contributor(s) and not of MDPI and/or the editor(s). MDPI and/or the editor(s) disclaim responsibility for any injury to people or property resulting from any ideas, methods, instructions or products referred to in the content. |
© 2024 by the authors. Licensee MDPI, Basel, Switzerland. This article is an open access article distributed under the terms and conditions of the Creative Commons Attribution (CC BY) license (https://creativecommons.org/licenses/by/4.0/).
Share and Cite
Sayah, I.; Njehi, M.; Cicero, N.; Nava, V.; M’hadheb, M.B.; Majdoub, H.; Achour, S.; Gervasi, T. Optimization of Sugar Extraction Process from Date Waste Using Full Factorial Design Toward Its Use for New Biotechnological Applications. BioTech 2024, 13, 39. https://doi.org/10.3390/biotech13040039
Sayah I, Njehi M, Cicero N, Nava V, M’hadheb MB, Majdoub H, Achour S, Gervasi T. Optimization of Sugar Extraction Process from Date Waste Using Full Factorial Design Toward Its Use for New Biotechnological Applications. BioTech. 2024; 13(4):39. https://doi.org/10.3390/biotech13040039
Chicago/Turabian StyleSayah, Islam, Mondher Njehi, Nicola Cicero, Vincenzo Nava, Manel Ben M’hadheb, Hatem Majdoub, Sami Achour, and Teresa Gervasi. 2024. "Optimization of Sugar Extraction Process from Date Waste Using Full Factorial Design Toward Its Use for New Biotechnological Applications" BioTech 13, no. 4: 39. https://doi.org/10.3390/biotech13040039
APA StyleSayah, I., Njehi, M., Cicero, N., Nava, V., M’hadheb, M. B., Majdoub, H., Achour, S., & Gervasi, T. (2024). Optimization of Sugar Extraction Process from Date Waste Using Full Factorial Design Toward Its Use for New Biotechnological Applications. BioTech, 13(4), 39. https://doi.org/10.3390/biotech13040039