
Hematological and Biochemical Reference Ranges for the Population with Sickle Cell Disease at Steady State in Tanzania

 ,
,  , ,
, ,
Abstract
:1. Introduction
2. Results
2.1. Demographic Characteristics
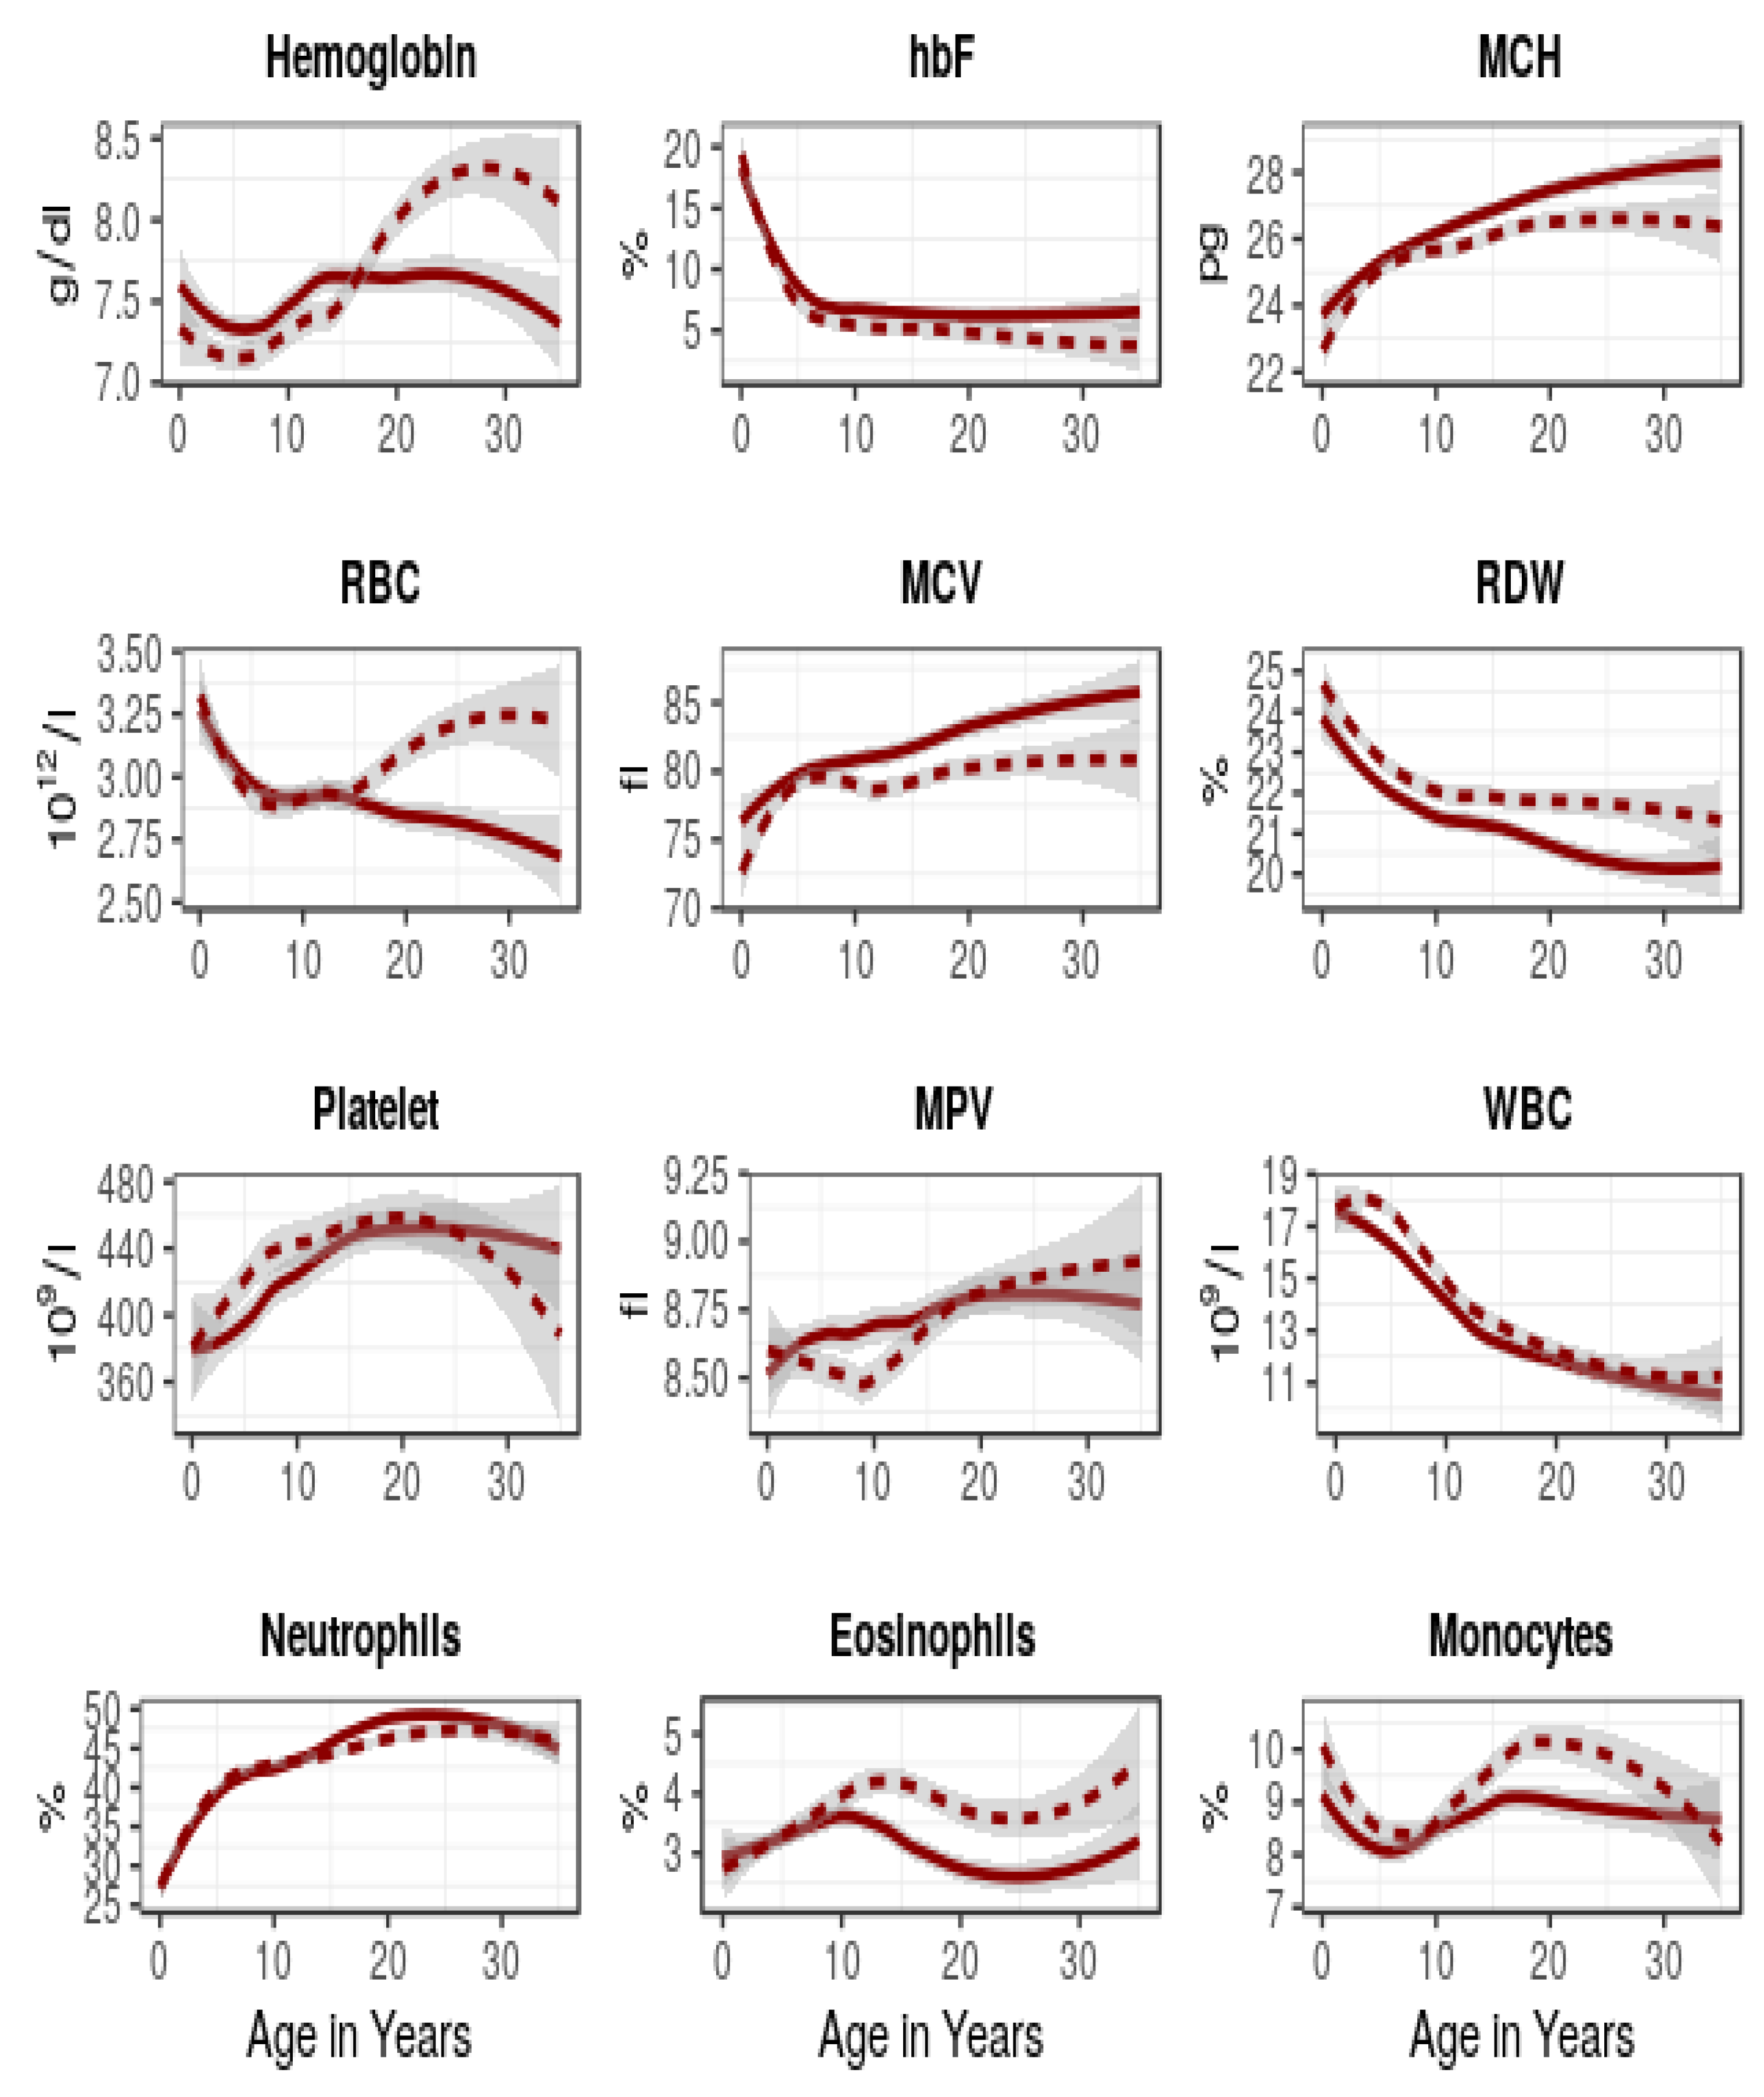
2.2. Comparison of Haematological Parameters
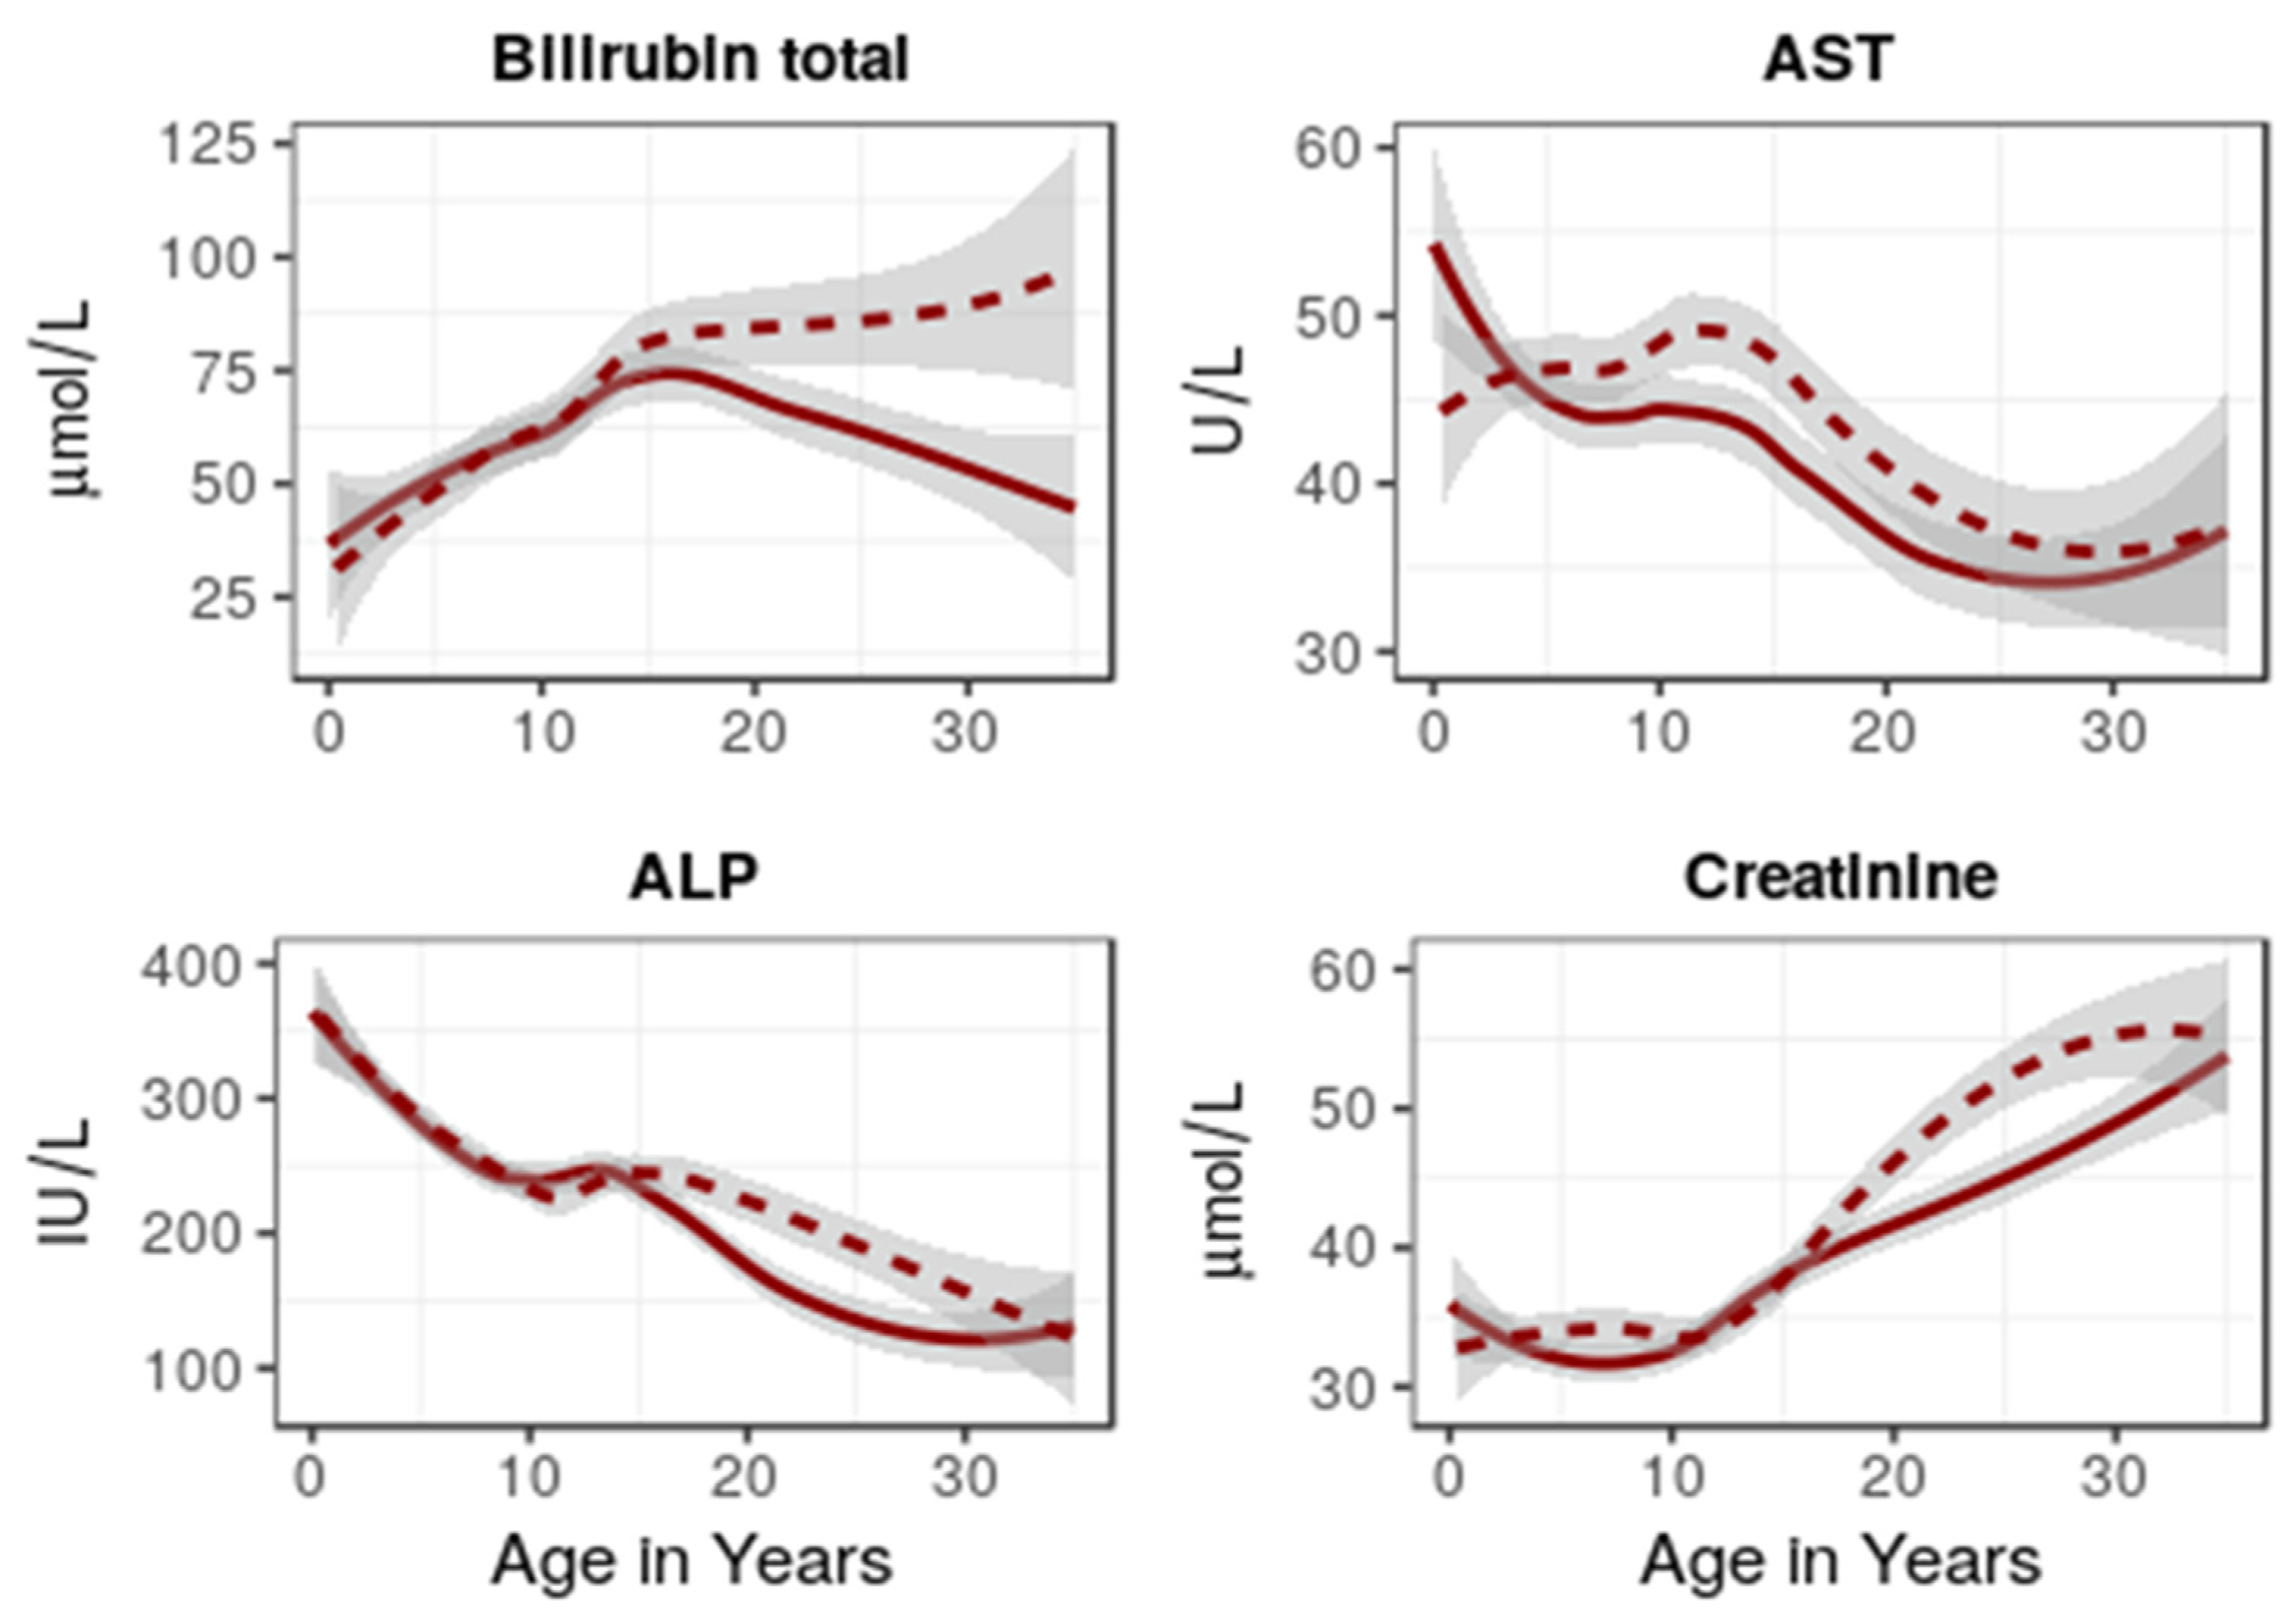
2.3. Comparison of Biochemical Parameters
2.4. Laboratory Parameters in SCD Compared against the General Population
3. Discussion
4. Materials and Methods
4.1. Study Design and Setting
4.2. Patients
4.3. Hematological and Biochemical Parameters
4.4. Statistical Analysis
5. Conclusions
Limitations
Author Contributions
Funding
Institutional Review Board Statement
Informed Consent Statement
Data Availability Statement
Acknowledgments
Conflicts of Interest
Appendix A

| Analytes (Unit) | Age Group in Years (sex) | SCD Patients Median (2.5–97.5%) | General Population Median (2.5–97.5%) | p-Values * |
|---|---|---|---|---|
| Hemoglobin (g/dL) | <1 | 7.3 (4.6–9.5) | 10.7 (8.1–13.2) † | <0.0001 |
| 1–4 | 7.3 (4.5–9.7) | 11.3 (8.1–13.9) † | <0.0001 | |
| 5–11 | 7.3 (4.9–9.4) | 12.6 (10.3–14.7) † | <0.0001 | |
| 12–17(F) | 7.6 (5.3–9.7) | 13.0 (10.0–14.9) † | <0.0001 | |
| 12–17(M) | 7.4 (5.0–9.8) | 13.7 (10.8–17.0) † | <0.0001 | |
| ≥18 (F) | 7.6 (5.1–10.0) | 13.5 (11.1–15.7) ‡ | <0.0001 | |
| ≥18 (M) | 8.3 (4.7–11.0) | 15.4 (13.7–17.7) ‡ | <0.0001 | |
| ≥18 (M&F) | 7.9 (4.8–10.6) | 14.7 (11.7–17.2) ‡ | <0.0001 | |
| MCH (pg) | - | - | - | - |
| ≥18(F) | 28.0 (19.9–34.2) | 30.0 (23.1–33.2) ‡ | <0.0001 | |
| ≥18(M) | 26.6 (19.9–33.1) | 29.3 (24.2–33.1) ‡ | <0.0001 | |
| ≥18(M&F) | 27.5 (19.9–34.0) | 29.7 (23.6–33.1) ‡ | <0.0001 | |
| MCHC (g/dL) | - | - | - | - |
| ≥18(F) | 32.8 (29.9–36.1) | 33.3 (30.6–35.1) ‡ | <0.0001 | |
| ≥18(M) | 32.6 (30.0–36.5) | 32.7 (30.4–34.8) ‡ | 0.9239 | |
| ≥18(M&F) | 32.8 (30.0–36.3) | 33.0 (30.6–34.9) ‡ | 0.9856 | |
| MCV (fL) | <1 | 74.0 (53.4–91.7) | 71.0 (53.3–96.6) † | <0.0001 |
| 1–4 | 79.0 (59.7–95.3) | 75.0 (54.7–91.6) † | <0.0001 | |
| 5–11 | 80.0 (60.5–98.0) | 82.5 (66.0–90.0) † | <0.0001 | |
| 12–17(F) | 82.0 (64.3–99.1) | 84.9 (62.2–94.5) † | <0.0001 | |
| 12–17(M) | 79.0 (63.4–93.5) | 82.0 (63.2–91.0) † | <0.0001 | |
| ≥18 (F) | 84.4 (64.0–102.8) | 89.5 (77.7–97.9) ‡ | <0.0001 | |
| ≥18 (M) | 81.7 (62.8–99.2) | 89.3 (76.4–98.8) ‡ | <0.0001 | |
| ≥18 (M&F) | 83.3 (63.0–101.4) | 89.4 (77.6–98.1) ‡ | <0.0001 | |
| Platelet Count (×109/L) | <1 | 399 (135–724) | 384 (25–708) † | 0.2923 |
| 1–4 | 376 (104–758) | 359 (79–650) † | 0.0087 | |
| 5–11 | 432 (126–762) | 320 (94–530) † | <0.0001 | |
| 12–17(F) | 450 (132–771) | 282 (107–482) † | <0.0001 | |
| 12–17(M) | 445 (179–808) | 271 (119–458) † | <0.0001 | |
| ≥18(F) | 448 (143–738) | 271 (151–425) ‡ | <0.0001 | |
| ≥18(M) | 435 (179–777) | 224 (147–356) ‡ | <0.0001 | |
| ≥18(M&F) | 439 (148–765) | 244 (150–359) ‡ | <0.0001 | |
| WBC count (×109/L) | <1 | 13.8 (7.8–33.7) | 9.2 (5.0–17.3) † | <0.0001 |
| 1–4 | 17.2 (8.2–30.1) | 7.7 (3.7–13.2) † | <0.0001 | |
| 5–11 | 14.7 (7.7–25.3) | 5.6 (3.7–9.1) † | <0.0001 | |
| 12–17 | 12.6 (6.8–21.1) | 5.3 (3.2–10.3) † | <0.0001 | |
| ≥18 | - | - | - | |
| Lymphocytes (%) | - | - | - | - |
| ≥18 (F) | 37.3 (19.7–53.1) | 40.4 (20.9–56.7) ‡ | <0.0001 | |
| ≥18 (M) | 36.8 (16.9–54.2) | 40.8 (20.8–57.3) ‡ | <0.0001 | |
| ≥18(M&F) | 37.1 (18.2–54.6) | 40.4 (20.8–56.7) ‡ | <0.0001 | |
| Neutrophils (%) | - | - | - | - |
| ≥18 (F) | 48.6 (30.4–67.3) | 48.4 (32.5–71.3) ‡ | 0.7035 | |
| ≥18 (M) | 46.8 (26.8–69.7) | 47.3 (31.7–69.3) ‡ | 0.4763 | |
| ≥18(M&F) | 47.6 (28.5–69.6) | 48.1 (32.0–69.1) ‡ | 0.6826 | |
| Bilirubin Direct (µmol/L) | - | - | - | - |
| ≥18 (F) | 8.1 (0.0–23.4) | 1.81 (0.70–5.83) ‡ | <0.0001 | |
| ≥18 (M) | 7.5 (0.0–32.9) | 2.53 (0.93–8.43) ‡ | <0.0001 | |
| ≥18(M&F) | 7.8 (0.0–29.3) | 2.21 (0.72–8.22) ‡ | <0.0001 | |
| Bilirubin Total (µmol/L) | <1 | 32.2 (10.4–90.5) | 4 (2–19) ⁋ | <0.0001 |
| 1–4 | 36.9 (7.8–132.3) | 4 (2–9) ⁋ | <0.0001 | |
| 5–11 | 46.4 (1.9–184.0) | 4 (2–11) ⁋ | <0.0001 | |
| 12–17(F) | 55.8 (16.7–237.9) | 6 (3–22) ⁋ | <0.0001 | |
| 12–17(M) | 57.8 (10.5–295.2) | 6 (2–15) ⁋ | <0.0001 | |
| ≥18 (F) | 45.5 (10.2–170.9) | 13.9 (6.0–42.0) ‡ | <0.0001 | |
| ≥18 (M) | 52.6 (12.9–251.8) | 10.0 (4.5–31.3) ‡ | <0.0001 | |
| ≥18(M&F) | 48.6 (10.9–216.0) | 11.5 (5.2–41.0) ‡ | <0.0001 | |
| AST (U/L) | <1 | 46.0 (11.8–101.2) | 38 (26–65) ⁋ | 0.0057 |
| 1–4 | 43.0 (24.4–89.3) | 36 (27–55) ⁋ | <0.0001 | |
| 5–11 | 43.5 (24.0–86.8) | 31 (21–51) ⁋ | <0.0001 | |
| 12–17(F) | 38.0 (20.0–86.2) | 23 (17–36) ⁋ | <0.0001 | |
| 12–17(M) | 44.0 (22.5–90.0) | 27 (19–42) ⁋ | <0.0001 | |
| ≥18 (F) | 32.0 (16.7–66.0) | 20.1 (13.5–35.2) ‡ | <0.0001 | |
| ≥18 (M) | 31.0 (18.0–78.9) | 28.2 (15.2–53.4) ‡ | <0.0001 | |
| ≥18(M&F) | 31.0 (18.0–61.8) | 22.8 (14.3–48.1) ‡ | <0.0001 | |
| ALP (IU/L) | <1 | 322 (53–586) | 307 (164–589) ⁋ | 0.1998 |
| 1–4 | 288 (120–600) | 253 (153–410) ⁋ | <0.0001 | |
| 5–11 | 237 (110–468) | 278 (174–460) ⁋ | <0.0001 | |
| 12–17(F) | 216 (71–556) | 191 (68–498) ⁋ | <0.0001 | |
| 12–17(M) | 229 (122–488) | 302 (124–537) ⁋ | <0.0001 | |
| ≥18 (F) | 115 (46–310) | 85.0 (45.4–170.4) ‡ | <0.0001 | |
| ≥18 (M) | 153 (59–408) | 75.4 (45.3–155.0) ‡ | <0.0001 | |
| ≥18(M&F) | 123 (47–396) | 80.0 (45.6–158.4) ‡ | <0.0001 | |
| Creatinine (µmol/L) | <1 | 32.5 (13.2–57.1) | 18 (12–28) ⁋ | <0.0001 |
| 1–4 | 32.0 (20.0–56.0) | 24 (15–50) ⁋ | <0.0001 | |
| 5–11 | 32.0 (18.0–56.0) | 36 (24–49) ⁋ | <0.0001 | |
| 12–17(F) | 35.0 (19.1–68.0) | 45 (32–64) ⁋ | <0.0001 | |
| 12–17(M) | 34.0 (18.0–69.1) | 48 (36–80) ⁋ | <0.0001 | |
| ≥18 (F) | 42.5 (25.0–86.0) | 56 (40–81) ‡ | <0.0001 | |
| ≥8 (M) | 51.0 (26.3–83.4) | 69 (48–96) ‡ | <0.0001 | |
| ≥18 (M&F) | 44.7 (25.0–85.3) | 62 (42–90) ‡ | <0.0001 |
References
- Modell, B.; Darlison, M. Global epidemiology of haemoglobin disorders and derived service indicators. Bull. World Health Organ. 2008, 86, 480–487. [Google Scholar] [CrossRef]
- Piel, F.B.; Hay, S.I.; Gupta, S.; Weatherall, D.J.; Williams, T.N. Global Burden of Sickle Cell Anaemia in Children under Five, 2010–2050: Modelling Based on Demographics, Excess Mortality, and Interventions. PLoS Med. 2013, 10, e1001484. [Google Scholar] [CrossRef] [Green Version]
- Makani, J.; Komba, A.N.; Cox, S.; Oruo, J.; Mwamtemi, K.; Kitundu, J.; Magesa, P.; Rwezaula, S.; Meda, E.; Mgaya, J.; et al. Malaria in patients with sickle cell anemia: Burden, risk factors, and outcome at the outpatient clinic and during hospitalization. Blood 2010, 115, 215–220. [Google Scholar] [CrossRef] [PubMed]
- Makani, J.; Cox, S.; Soka, D.; Komba, A.N.; Oruo, J.; Mwamtemi, H.; Magesa, P.; Rwezaula, S.; Meda, E.; Mgaya, J.; et al. Mortality in sickle cell anemia in Africa: A prospective cohort study in Tanzania. PLoS ONE 2011, 6, e14699. [Google Scholar] [CrossRef] [Green Version]
- Tluway, F.; Makani, J. Sickle cell disease in Africa: An overview of the integrated approach to health, research, education and advocacy in Tanzania, 2004–2016. Br. J. Haematol. 2017, 177, 919–929. [Google Scholar] [CrossRef] [PubMed] [Green Version]
- Bhatia, M.; Walters, M.C. Hematopoietic cell transplantation for thalassemia and sickle cell disease: Past, present and future. Bone Marrow Transplant. 2008, 41, 109–117. [Google Scholar] [CrossRef] [PubMed] [Green Version]
- Vermylen, C.; Cornu, G.; Ferster, A.; Brichard, B.; Ninane, J.; Ferrant, A.; Zenebergh, A.; Maes, P.; Dhooge, C.; Benoit, Y.; et al. Haematopoietic stem cell transplantation for sickle cell anaemia: The first 50 patients transplanted in Belgium. Bone Marrow Transplant. 1998, 22, 1–6. [Google Scholar] [CrossRef] [Green Version]
- Akinbami, A.; Dosunmu, A.; Adediran, A.; Oshinaike, O.; Adebola, P.; Arogundade, O. Haematological values in homozygous sickle cell disease in steady state and haemoglobin phenotypes AA controls in Lagos, Nigeria. BMC Res. Notes 2012, 5, 396. [Google Scholar] [CrossRef] [Green Version]
- Iheanacho, O. Haematological Parameters of Adult and Paediatric Subjects with Sickle Cell Disease in Steady State, in Benin City, Nigeria. Int. Blood Res. Rev. 2015, 3, 171–177. [Google Scholar] [CrossRef]
- Ballas, S.K.; Smith, E.D. Red blood cell changes during the evolution of the sickle cell painful crisis. Blood 1992, 79, 2154–2163. [Google Scholar] [CrossRef] [Green Version]
- Okpala, I.; Tawil, A. Management of pain in sickle-cell disease. J. R. Soc. Med. 2002, 95, 456–458. [Google Scholar] [CrossRef] [Green Version]
- Powars, D.R.; Schroeder, W.A.; Weiss, J.N.; Chan, L.S.; Azen, S.P. Lack of influence of fetal hemoglobin levels or erythrocyte indices on the severity of sickle cell anemia. J. Clin. Investig. 1980, 65, 732–740. [Google Scholar] [CrossRef] [Green Version]
- Omoti, C.E. Haematological values in sickle cell anaemia in steady state and during vaso-occlusive crisis in Benin City, Nigeria. Ann. Afr. Med. 2005, 4, 62–67. [Google Scholar]
- Akodu, S.O.; Njokanma, O.F.; AdeoluKehinde, O. Erythrocyte indices in Pre-School Nigerian children with sickle cell anaemia in steady state. Int. J. Hematol.-Oncol. Stem Cell Res. 2015, 9, 5–9. [Google Scholar]
- Emmanuelchide, O.; Charle, O.; Uchenna, O. Hematological parameters in association with outcomes in sickle cell anemia patients. Indian J. Med. Sci. 2011, 65, 393. [Google Scholar] [CrossRef] [PubMed]
- Buchanan, A.M.; Muro, F.J.; Gratz, J.; Crump, J.A.; Musyoka, A.M.; Sichangi, M.W.; Morrissey, A.B.; M’Rimberia, J.K.; Njau, B.N.; Msuya, L.J.; et al. Establishment of haematological and immunological reference values for healthy Tanzanian children in Kilimanjaro Region. Trop. Med. Int. Health 2010, 15, 1011–1021. [Google Scholar] [CrossRef] [Green Version]
- Lugada, E.S.; Mermin, J.; Kaharuza, F.; Ulvestad, E.; Were, W.; Langeland, N.; Asjo, B.; Malamba, S.; Downing, R. Population-based hematologic and immunologic reference values for a healthy Ugandan population. Clin. Diagn. Lab. Immunol. 2004, 11, 29–34. [Google Scholar] [CrossRef] [Green Version]
- Quintó, L.; Aponte, J.J.; Sacarlal, J.; Espasa, M.; Aide, P.; Mandomando, I.; Guinovart, C.; Macete, E.; Navia, M.M.; Thompson, R.; et al. Haematological and biochemical indices in young African children: In search of reference intervals. Trop. Med. Int. Health 2006, 11, 1741–1748. [Google Scholar] [CrossRef] [PubMed]
- Katayev, A.; Balciza, C.; Seccombe, D.W. Establishing reference intervals for clinical laboratory test results: Is there a better way? Am. J. Clin. Pathol. 2010, 133, 180–186. [Google Scholar] [CrossRef] [PubMed] [Green Version]
- Buchanan, A.M.; Fiorillo, S.P.; Omondi, M.W.; Cunningham, C.K.; Crump, J.A. Establishment of biochemistry reference values for healthy Tanzanian infants, children and adolescents in Kilimanjaro Region. Trop. Med. Int. Health 2015, 20, 1569–1577. [Google Scholar] [CrossRef] [Green Version]
- Saathoff, E.; Schneider, P.; Kleinfeldt, V.; Geis, S.; Haule, D.; Maboko, L.; Samky, E.; de Souza, M.; Robb, M.; Hoelscher, M. Laboratory reference values for healthy adults from southern Tanzania. Trop. Med. Int. Health 2008, 13, 612–625. [Google Scholar] [CrossRef]
- Abbas, M. Haematological parameters in Sudanese children with sickle cell disease. Am. J. Res. Com. 2014, 2, 20–32. [Google Scholar]
- Brown, A.K.; Sleeper, L.A.; Miller, S.T.; Pegelow, C.H. Reference Values and. Arch. Pediatr. Adolesc. Med. 2012, 148, 796–804. [Google Scholar] [CrossRef] [PubMed]
- Reed, J.D.; Redding-Lallinger, R.; Orringer, E.P. Nutrition and sickle cell disease. Am. J. Hematol. 1987, 24, 441–455. [Google Scholar] [CrossRef]
- Henrici, R.C.; Sautter, C.L.; Bond, C.; Opoka, R.O.; Namazzi, R.; Datta, D.; Ware, R.E.; Conroy, A.L.; John, C.C. Decreased parasite burden and altered host response in children with sickle cell anemia and severe anemia with malaria. Blood Adv. 2021, 5, 4710–4720. [Google Scholar] [CrossRef]
- Desai, M.R.; Terlouw, D.J.; Kwena, A.M.; Phillips-Howard, P.A.; Kariuki, S.K.; Wannemuehler, K.A.; Odhacha, A.; Hawley, W.A.; Shi, Y.P.; Nahlen, B.L.; et al. Factors associated with hemoglobin concentrations in pre-school children in western Kenya: Cross-sectional studies. Am. J. Trop. Med. Hyg. 2005, 72, 47–59. [Google Scholar] [CrossRef] [Green Version]
- Perigard, C.J.; Parrula, M.C.M.; Larkin, M.H.; Gleason, C.R. Impact of menstruation on select hematology and clinical chemistry variables in cynomolgus macaques. Vet. Clin. Pathol. 2016, 45, 232–243. [Google Scholar] [CrossRef] [Green Version]
- Irwin, J.; Kirchner, J. Anemia in children. Nippon Rinsho Jpn. J. Clin. Med. 2008, 66, 544–547. [Google Scholar]
- Allen, B.; Schwartz, D. The Splenic Platelet Reservoir. Cell 1972, 40, 678–683. [Google Scholar]
- Riley, L.K.; Rupert, J. Evaluation of Patients with Leukocytosis. Am. Fam. Physician 2015, 92, 1004–1011. [Google Scholar] [PubMed]
- Buchanan, G.R.; Glader, B.E. Leukocyte Counts in Children with Sickle Cell Disease: Comparative Values in the Steady State, Vaso-occlusive Crisis, and Bacterial Infection. Am. J. Dis. Child. 1978, 132, 396–398. [Google Scholar] [CrossRef]
- Kotila, T.; Adedapo, K.; Adedapo, A.; Oluwasola, O.; Fakunle, E.; Brown, B. Liver dysfunction in steady state sickle cell disease. Ann. Hepatol. 2019, 4, 261–263. [Google Scholar] [CrossRef]
- Al-Ali, A.K.; Ahmed, M.A.M.; Qaw, F.S.; Al-Fadel Saleh, M.; Al-Bashir, A. Uric Acid, Creatinine and Urea in Normal, Glucose-6-Phosphate Dehydrogenase-Deficient and Hb S S Saudi Subjects. Acta Haematol. 1995, 94, 114–116. [Google Scholar] [CrossRef]
- Al-naama, L.M.; Al-Sadoon, T.A. Levels of Uric Acid, Urea and Creatinine in Iraqi Children with Sickle Cell Disease. J. -Pak. Med. Assoc. 2000, 50, 98–101. [Google Scholar] [PubMed]
- Odonkor, P.O.; Addae, S.K.; Yamamoto, S.; Apatu, R.S. Effect of dietary nitrogen on urinary excretion of non-protein nitrogen in adolescent sickle cell patients. Hum. Nutr. Clin. Nutr. 1984, 38, 23–29. [Google Scholar]
- Makani, J.; Tluway, F.; Makubi, A.; Soka, D.; Nkya, S.; Sangeda, R.; Mgaya, J.; Rwezaula, S.; Kirkham, F.J.; Kindole, C.; et al. A ten year review of the sickle cell program in Muhimbili National Hospital, Tanzania. BMC Hematol. 2018, 18, 33. [Google Scholar] [CrossRef] [PubMed] [Green Version]
- Mtatiro, S.N.; Singh, T.; Rooks, H.; Mgaya, J.; Mariki, H.; Soka, D.; Mmbando, B.; Msaki, E.; Kolder, I.; Thein, S.L.; et al. Genome wide association study of fetal hemoglobin in sickle cell Anemia in Tanzania. PLoS ONE 2014, 9, e111464. [Google Scholar] [CrossRef] [Green Version]
- Ballas, S.K. More definitions in sickle cell disease: Steady state v base line data. Am. J. Hematol. 2012, 87, 338. [Google Scholar] [CrossRef]
- Bertholf, R.L. Statistical Methods for Establishing and Validating Reference Intervals. Lab. Med. 2006, 37, 306–310. [Google Scholar] [CrossRef]
- Reed, A.H.; Henry, R.J.; Mason, W.B. Influence of statistical method used on the resulting estimate of normal range. Clin. Chem. 1971, 17, 275–284. [Google Scholar] [CrossRef]
- Harris, E.K.; Wong, E.T.; Shaw, S.T. Statistical criteria for separate reference intervals: Race and gender groups in creatine kinase. Clin. Chem. 1991, 37, 1580–1582. [Google Scholar] [CrossRef] [PubMed]


| Parameters | Overall | Females | Males | p-Values * |
|---|---|---|---|---|
| Infants (<1 year) | ||||
| Frequency (%) | 135 (3.05) | 59 (1.33) | 76 (1.72) | |
| Mean age ± SD | 0.71 ± 0.23 | 0.69 ± 0.26 | 0.72 ± 0.21 | 0.426 |
| Children (1–4 years) | ||||
| Frequency (%) | 998 (22.6) | 478 (10.80) | 520 (11.75) | |
| Mean age ± SD | 3.3 ± 1.02 | 3.39 ± 1.03 | 3.25 ± 1.00 | 0.023 |
| Children (5–11 years) | ||||
| Frequency (%) | 1566 (35.41) | 766 (17.32) | 800 (18.09) | |
| Mean age ± SD | 8.36 ± 1.90 | 8.44 ± 1.90 | 8.29 ± 1.89 | 0.144 |
| Adolescents (12–17 years) | ||||
| Frequency (%) | 956 (21.61) | 476 (10.76) | 480 (10.85) | |
| Mean age ± SD | 14.66 ± 1.57 | 14.74 ± 1.59 | 14.59 ± 1.55 | 0.125 |
| Adults (≥18 years) | ||||
| Frequency | 767 (17.34) | 456 (10.31) | 311 (7.03) | |
| Mean age ± SD | 23.36 ± 5.22 | 23.61 ± 5.28 | 23.0 ± 5.11 | 0.112 |
| Total | ||||
| Frequency (%) | 4422 (100.0) | 2235 (50.54) | 2187 (49.46) | |
| Mean age ± SD | 10.95 ± 7.42 | 11.59 ± 7.75 | 10.30 ± 7.01 | <0.05 |
| Age Group (Years) | Females | Males | Combined | p-Values * | |||
|---|---|---|---|---|---|---|---|
| n | Mean (Mean ± 1.96SD) | n | Mean (Mean ± 1.96SD) | n | Mean (Mean ± 1.96SD) | ||
| Hemoglobin (g/dL) | |||||||
| <1 | 59 | 7.3 (4.8–9.8) | 76 | 7.2 (4.5–9.8) | 135 | 7.2 (4.6–9.8) | 0.4574 |
| 1–4 | 477 | 7.4 (5.0–9.7) | 518 | 7.2 (4.7–9.6) | 995 | 7.3 (4.9–9.7) | 0.0128 |
| 5–11 | 766 | 7.4 (5.1–9.6) | 799 | 7.2 (5.1–9.3) | 1565 | 7.3 (5.1–9.5) | 0.0018 |
| 12–17 | 476 | 7.6 (5.4–9.7) | 480 | 7.4 (5.1–9.7) | 956 | 7.5 (5.3–9.7) | 0.0171 |
| ≥18 | 456 | 7.6 (5.1–10.0) | 310 | 8.2 (5.0–11.3) | 766 | 7.8 (5.0–10.6) | <0.0001 |
| HbF (%) | |||||||
| <1 | 29 | 16.5 (4.0–67.7) | 42 | 16.0 (3.1–81.2) | 71 | 16.2 (3.5–75.2) | 0.7882 |
| 1–4 | 278 | 9.8 (2.7–35.4) | 272 | 9.3 (2.9–29.5) | 550 | 9.6 (2.8–32.4) | 0.1696 |
| 5–11 | 379 | 6.6 (1.9–23.1) | 377 | 5.5 (1.5–19.9) | 756 | 6.0 (1.6–21.8) | 0.0006 |
| 12–17 | 150 | 5.8 (1.3–24.4) | 135 | 4.9 (1.3–18.0) | 285 | 5.3 (1.3–21.4) | 0.0341 |
| ≥18 | 162 | 5.9 (1.5–22.5) | 103 | 3.9 (0.9–16.6) | 265 | 5.0 (1.2–21.1) | 0.0005 |
| MCH (pg) | |||||||
| <1 | 58 | 23.4 (17.4–29.4) | 75 | 22.4 (14.9–30.0) | 133 | 22.9 (15.9–29.8) | 0.1109 |
| 1–4 | 476 | 25.0 (18.7–31.3) | 514 | 24.5 (18.2–30.9) | 990 | 24.8 (18.4–31.1) | 0.0357 |
| 5–11 | 762 | 25.8 (19.0–32.6) | 798 | 25.4 (18.8–32.1) | 1560 | 25.6 (18.9–32.4) | 0.0392 |
| 12–17 | 476 | 26.8 (20.2–33.4) | 478 | 25.9 (19.2–32.7) | 954 | 26.4 (19.6–33.1) | <0.0001 |
| ≥18 | 453 | 27.6 (20.3–34.9) | 311 | 26.5 (19.6–33.5) | 764 | 27.2 (20.0–34.4) | <0.0001 |
| MCHC (g/dL) | |||||||
| <1 | 58 | 31.0 (28.6–33.5) | 76 | 30.9 (27.4–34.4) | 134 | 31.0 (27.9–34.0) | 0.5994 |
| 1–4 | 477 | 31.4 (28.1–34.7) | 518 | 31.4 (28.0–34.9) | 995 | 31.4 (28.0–34.8) | 0.9934 |
| 5–11 | 765 | 32.1 (28.9–35.4) | 799 | 32.1 (28.6–35.6) | 1564 | 32.1 (28.7–35.5) | 0.8559 |
| 12–17 | 476 | 32.8 (29.5–36.1) | 478 | 32.9 (29.6–36.1) | 954 | 32.8 (29.6–36.1) | 0.5454 |
| ≥18 | 456 | 32.9 (29.8–35.9) | 311 | 32.9 (29.7–36.1) | 767 | 32.9 (29.8–36.0) | 0.9422 |
| RBC Count (×1012/L) | |||||||
| <1 | 59 | 3.2 (1.7–4.6) | 76 | 3.3 (1.4–5.2) | 135 | 3.2 (1.5–4.9) | 0.4144 |
| 1–4 | 478 | 3.0 (1.6–4.4) | 518 | 3.0 (1.5–4.4) | 996 | 3.0 (1.6–4.4) | 0.3762 |
| 5–11 | 766 | 2.9 (1.6–4.2) | 800 | 2.8 (1.5–4.2) | 1566 | 2.9 (1.6–4.2) | 0.2956 |
| 12–17 | 476 | 2.8 (1.7–4.0) | 478 | 2.9 (1.5–4.3) | 954 | 2.9 (1.6–4.2) | 0.2519 |
| ≥18 | 456 | 2.8 (1.5–4.1) | 310 | 3.1 (1.4–4.9) | 766 | 2.9 (1.4–4.5) | <0.0001 |
| MCV (fL) | |||||||
| <1 | 58 | 75.4 (57.8–92.9) | 76 | 72.7 (50.9–94.4) | 134 | 73.8 (53.7–94.0) | 0.2167 |
| 1–4 | 477 | 79.4 (61.2–97.7) | 517 | 78.1 (59.9–96.2) | 994 | 78.7 (60.5–97.0) | 0.0106 |
| 5–11 | 765 | 80.3 (60.7–99.9) | 799 | 79.2 (60.7–97.7) | 1564 | 79.7 (60.7–98.8) | 0.0140 |
| 12–17 | 476 | 81.8 (64.0–99.5 | 478 | 78.9 (60.2–97.5) | 954 | 80.3 (61.9–98.8) | <0.0001 |
| ≥18 | 455 | 83.9 (64.1–103.7) | 311 | 80.7 (61.5–99.9) | 766 | 82.6 (62.8–102.4) | <0.0001 |
| RDW (%) | |||||||
| <1 | 59 | 23.7 (16.9–30.5) | 75 | 24.3 (17.4–31.3) | 134 | 24.1 (17.2–30.9) | 0.1860 |
| 1–4 | 476 | 22.6 (16.2–28.9) | 518 | 23.3 (16.9–29.7) | 994 | 22.9 (16.5–29.4) | <0.0001 |
| 5–11 | 764 | 21.6 (15.4–27.8) | 800 | 22.3 (16.3–28.4) | 1564 | 22.0 (15.8–28.1) | <0.0001 |
| 12–17 | 476 | 21.2 (15.0–27.5) | 478 | 21.9 (16.1–27.6) | 956 | 21.6 (15.5–27.6) | <0.0001 |
| ≥18 | 456 | 20.3 (14.5–26.1) | 310 | 21.6 (15.6–27.6) | 766 | 20.8 (14.8–26.8) | <0.0001 |
| Reticulocyte (%) | |||||||
| <1 | 20 | 12.1 (3.0–27.2) | 17 | 13.0 (3.2–29.4) | 37 | 12.5 (3.2–28.0) | 0.7032 |
| 1–4 | 201 | 13.4 (3.6–29.3) | 221 | 12.5 (2.0–31.9) | 422 | 12.9 (2.7–30.7) | 0.4093 |
| 5–11 | 336 | 12.4 (3.8–26.0) | 365 | 12.1 (3.6–25.6) | 701 | 12.3 (3.7–25.8) | 0.9524 |
| 12–17 | 235 | 12.0 (3.8–24.7) | 198 | 11.1 (3.4–23.3) | 433 | 11.6 (3.6–24.1) | 0.0894 |
| ≥18 | 202 | 11.9 (3.9–24.2) | 122 | 11.0 (3.9–21.8) | 324 | 11.6 (3.9–23.4) | 0.0411 |
| Reticulocyte Count (×1012/L) | |||||||
| <1 | 20 | 0.38 (0.07–0.70) | 17 | 0.42 (0.12–0.72) | 37 | 0.40 (0.09–0.71) | 0.4462 |
| 1–4 | 201 | 0.42 (0.04–0.79) | 221 | 0.39 (0.01–0.78) | 422 | 0.40 (0.02–0.79) | 0.1977 |
| 5–11 | 336 | 0.37 (0.04–0.70) | 365 | 0.37 (0.06–0.68) | 701 | 0.37 (0.05–0.69) | 0.7346 |
| 12–17 | 235 | 0.36 (0.07–0.66) | 198 | 0.33 (0.66–0.61) | 433 | 0.35 (0.06–0.64) | 0.0371 |
| ≥18 | 202 | 0.34 (0.07–0.61) | 122 | 0.38 (0.09–0.66) | 324 | 0.36 (0.08–0.63) | 0.0276 |
| Platelet Count (×109/L) | |||||||
| <1 | 59 | 397.9 (73.3–722.4) | 76 | 410.8 (56.8–764.7) | 135 | 405.1 (64.8–745.5) | 0.7935 |
| 1–4 | 476 | 375.1 (55.8–694.4) | 517 | 399.2 (67.0–731.4) | 993 | 387.7 (60.9–714.4) | 0.0183 |
| 5–11 | 766 | 422.3 (110.9–733.6) | 798 | 440.2 (103.8–776.6) | 1564 | 431.4 (106.7–756.2) | 0.1210 |
| 12–17 | 476 | 447.0 (130.6–763.4) | 477 | 453.3 (142.5–764.1) | 953 | 450.2 (136.7–763.7) | 0.9320 |
| ≥18 | 456 | 442.9 (149.5–736.3) | 309 | 447.0 (149.2–744.9) | 765 | 444.6 (149.6–739.6) | 0.7580 |
| MPV (fL) | |||||||
| <1 | 53 | 8.5 (6.8–9.9) | 68 | 8.3 (6.4–10.5) | 121 | 8.4 (6.5–10.2) | 0.9604 |
| 1–4 | 458 | 8.7 (6.9–10.3) | 498 | 8.6 (6.8–10.1) | 956 | 8.6 (6.9–10.2) | 0.2977 |
| 5–11 | 741 | 8.6 (7.0–10.2) | 781 | 8.4 (6.8–10.1) | 1522 | 8.6 (6.9–10.2) | 0.0002 |
| 12–17 | 467 | 8.5 (6.9–10.4) | 470 | 8.5 (7.0–10.3) | 937 | 8.5 (7.0–10.4) | 0.7275 |
| ≥18 | 443 | 8.5 (7.1–10.5) | 304 | 8.6 (7.1–10.6) | 747 | 8.6 (7.1–10.5) | 0.3750 |
| WBC (×109/L) | |||||||
| <1 | 57 | 16.4 (3.8–29.1) | 72 | 16.6 (1.3–31.3) | 129 | 16.4 (2.4–30.3) | 0.4381 |
| 1–4 | 473 | 17.1 (6.5–27.6) | 518 | 18.2 (7.3–29.2) | 991 | 17.7 (6.9–28.5) | 0.0006 |
| 5–11 | 798 | 14.7 (5.6–23.8) | 766 | 15.7 (7.1–24.4) | 1564 | 15.2 (6.3–24.1) | <0.0001 |
| 12–17 | 476 | 12.5 (5.8–19.2) | 477 | 13.3 (6.0–20.7) | 953 | 12.9 (5.9–20.0) | 0.0003 |
| ≥18 | 455 | 11.6 (4.7–18.4) | 311 | 11.9 (4.3–19.6) | 766 | 11.7 (4.5–18.9) | 0.4009 |
| Neutrophils (%) | |||||||
| <1 | 56 | 27.2 (7.0–47.3) | 69 | 29.3 (8.2–50.4) | 125 | 28.3 (7.6–49.1) | 0.1985 |
| 1–4 | 447 | 36.5 (18.1–55.0) | 482 | 36.7 (18.1–55.2) | 929 | 36.6 (18.1–55.1) | 0.9277 |
| 5–11 | 724 | 41.6 (25.2–58.0) | 783 | 42.2 (25.4–58.9) | 1507 | 41.9 (25.3–58.5) | 0.2629 |
| 12–17 | 465 | 45.5 (29.1–62.0) | 460 | 44.0 (27.6–60.5) | 925 | 44.8 (28.3–61.3) | 0.0091 |
| ≥18 | 449 | 48.5 (28.9–68.0) | 305 | 46.9 (25.5–68.1) | 754 | 47.8 (27.6–68.1) | 0.0132 |
| Neutrophils Count (×109/L) | |||||||
| <1 | 56 | 4.3 (0.02–8.6) | 69 | 4.7 (−0.9–10.4) | 125 | 4.5 (−0.5–9.6) | 0.3250 |
| 1–4 | 447 | 6.1 (1.6–10.6) | 482 | 6.5 (2.1–10.8) | 929 | 6.3 (1.8–10.7) | 0.0087 |
| 5–11 | 724 | 6.0 (1.8–10.2) | 783 | 6.6 (2.2–10.9 | 1507 | 6.3 (2.0–10.6) | <0.0001 |
| 12–17 | 465 | 5.7 (1.9–9.5) | 460 | 5.8 (1.7–9.9) | 925 | 5.8 (1.8–9.7) | 0.1927 |
| ≥18 | 449 | 5.6 (1.1–10.2) | 305 | 5.5 (1.0–10.1) | 754 | 5.6 (1.1–10.2) | 0.6492 |
| Lymphocytes (%) | |||||||
| <1 | 59 | 56.6 (29.7–83.5) | 75 | 53.3 (29.3–77.4) | 134 | 54.8 (29.3–80.2) | 0.0740 |
| 1–4 | 472 | 49.4 (29.4–69.5) | 516 | 48.6 (28.2–69.1) | 988 | 49.0 (28.8–69.3) | 0.2216 |
| 5–11 | 763 | 43.9 (26.7–61.1) | 796 | 43.0 (26.2–59.8) | 1559 | 43.5 (26.4–60.5) | 0.0612 |
| 12–17 | 474 | 40.1 (24.1–56.1) | 476 | 39.6 (23.6–55.7) | 950 | 39.9 (23.9–55.9) | 0.3484 |
| ≥18 | 454 | 37.0 (20.5–53.5) | 310 | 36.5 (17.5–55.5) | 764 | 36.8 (19.2–54.3) | 0.4455 |
| Lymphocytes Count (×109/L) | |||||||
| <1 | 59 | 9.3 (0.04–18.7) | 75 | 8.7 (0.0–18.2) | 134 | 9.0 (0.0–18.4) | 0.4594 |
| 1–4 | 472 | 8.5 (1.7–15.2) | 516 | 8.9 (1.9–15.8) | 988 | 8.7 (1.8–15.5) | 0.0758 |
| 5–11 | 763 | 6.4 (1.3–11.6) | 796 | 6.8 (1.8–11.7) | 1559 | 6.6 (1.5–11.7) | 0.0128 |
| 12–17 | 474 | 5.0 (1.6–8.3) | 476 | 5.2(2.1–8.3) | 950 | 5.1 (1.8–8.3) | 0.0468 |
| ≥18 | 454 | 4.2 (1.5–6.9) | 310 | 4.2(1.1–7.3) | 764 | 4.2 (1.3–7.1) | 0.6696 |
| Monocytes (%) | |||||||
| <1 | 57 | 8.8 (3.3–23.4) | 74 | 9.7 (3.7–25.7) | 131 | 9.3 (3.5–24.7) | 0.1492 |
| 1–4 | 466 | 8.3 (3.7–18.6) | 507 | 8.8 (3.7–20.5) | 973 | 8.6 (3.7–19.6) | 0.0252 |
| 5–11 | 756 | 8.7 (4.2–18.1) | 793 | 8.9 (4.1–19.0) | 1549 | 8.8 (4.1–18.5) | 0.3807 |
| 12–17 | 473 | 9.4 (4.6–19.2) | 472 | 9.9 (4.8–20.4) | 945 | 9.7 (4.7–19.8) | 0.0121 |
| ≥18 | 449 | 9.5 (4.7–19.0) | 306 | 10.5 (5.0–22.2) | 755 | 9.9 (4.8–20.4) | <0.0001 |
| Monocytes Count (×109/L) | |||||||
| <1 | 57 | 1.4 (0.0–7.5) | 74 | 1.6 (0.4–15.4) | 131 | 2.2 (0.1–12.0) | 0.2325 |
| 1–4 | 466 | 1.4 (0.0–8.3) | 507 | 1.6 (0.0–10.4) | 973 | 2.1 (0.0–9.4) | 0.0002 |
| 5–11 | 756 | 1.2 (0.0–5.9) | 793 | 1.3 (0.2–7.4) | 1549 | 1.6 (0.0–6.7) | 0.0001 |
| 12–17 | 473 | 1.1 (0.0–5.0) | 472 | 1.2 (0.03–4.2) | 945 | 1.4 (0.01–5.3) | 0.0002 |
| ≥18 | 449 | 1.0 (0.0–3.8) | 306 | 1.2 (0.0–4.3) | 755 | 1.2 (0.0–4.6) | <0.0001 |
| Eosinophils (%) | |||||||
| <1 | 59 | 3.7 (1.2–11.5) | 72 | 3.4 (1.1–10.3) | 131 | 3.5 (1.1–10.8) | 0.4710 |
| 1–4 | 462 | 3.5 (1.2–9.8) | 501 | 3.5 (1.2–9.7) | 963 | 3.5 (1.2–9.8) | 0.8414 |
| 5–11 | 743 | 3.8 (1.3–11.4) | 790 | 4.0 (1.4–11.5) | 1533 | 3.9 (1.3–11.5) | 0.1706 |
| 12–17 | 470 | 3.6 (1.3–9.9) | 463 | 4.5 (1.5–12.8) | 933 | 4.0 (1.4–11.5) | <0.0001 |
| ≥18 | 454 | 3.2 (1.1–8.9) | 307 | 3.8 (1.2–12.2) | 761 | 3.5 (1.1–10.3) | <0.0001 |
| Eosinophils Count (×109/L) | |||||||
| <1 | 59 | 0.53 (0.0–1.44) | 72 | 0.45 (0.0–1.20) | 131 | 0.48 (0.0–1.31) | 0.3034 |
| 1–4 | 462 | 0.51 (0.0–1.34) | 501 | 0.54 (0.0–1.39) | 963 | 0.53 (0.0–1.37) | 0.2644 |
| 5–11 | 743 | 0.51 (0.0–1.53) | 790 | 0.58 (0.0–1.65) | 1533 | 0.55 (0.0–1.59) | 0.0078 |
| 12–17 | 470 | 0.40 (0.0–1.17) | 463 | 0.57 (0.0–1.69) | 933 | 0.48 (0.0–1.46) | <0.0001 |
| ≥18 | 454 | 0.32 (0.0–0.93) | 307 | 0.44 (0.0–1.40) | 761 | 0.37 (0.0–1.15) | <0.0001 |
| Basophils (%) | |||||||
| <1 | 58 | 2.5 (1.3–5.0) | 72 | 2.3 (0.9–5.5) | 130 | 2.4 (1.1–5.3) | 0.1711 |
| 1–4 | 471 | 2.1 (1.2–3.8) | 510 | 2.1 (1.2–3.8) | 981 | 2.1 (1.2–3.8) | 0.6519 |
| 5–11 | 754 | 2.0 (1.1–3.4) | 795 | 2.0 (1.2–3.4) | 1549 | 2.0 (1.1–3.4) | 0.9251 |
| 12–17 | 473 | 1.9 (1.1–3.4) | 474 | 1.9 (1.1–3.5) | 947 | 1.9 (1.1–3.5) | 0.9398 |
| ≥18 | 456 | 1.9 (1.2–3.0) | 310 | 1.9 (1.1–3.4) | 766 | 1.9 (1.1–3.1) | 0.2761 |
| Age Group (Years) | Females | Males | Combined | p-Values * | |||
|---|---|---|---|---|---|---|---|
| n | Mean (Mean ± 1.96SD) | n | Mean (Mean ± 1.96SD) | n | Mean (Mean ± 1.96SD) | ||
| Bilirubin direct (µmol/L) | |||||||
| <1 | 13 | 9.9 (0.8–119.4) | 17 | 8.6 (1.2–59.6) | 30 | 9.2 (1.0–80.2) | 0.6752 |
| 1–4 | 154 | 7.4 (1.0–54.8) | 169 | 6.7 (0.7–64.1) | 323 | 7.0 (0.8–59.6) | 0.5992 |
| 5–11 | 308 | 7.8 (1.0–56.6) | 353 | 7.6 (1.1–53.3) | 661 | 7.7 (1.1–54.8) | 0.5685 |
| 12–17 | 198 | 6.0 (0.5–62.0) | 184 | 6.0 (0.6–55.5) | 382 | 6.0 (0.6–58.7) | 0.8477 |
| ≥18 | 166 | 6.7 (0.9–48.4) | 106 | 6.1 (0.6–61.2) | 272 | 6.5 (0.7–53.3) | 0.7343 |
| Bilirubin Total (µmol/L) | |||||||
| <1 | 17 | 35.4 (10.7–117.3) | 18 | 30.2 (8.2–110.8) | 35 | 32.6 (9.4–113.1) | 0.7165 |
| 1–4 | 153 | 39.5 (11.4–136.8) | 158 | 36.4 (11.4–116.4) | 311 | 37.9 (11.4–126.2) | 0.2966 |
| 5–11 | 280 | 50.1 (14.6–170.9) | 318 | 50.5 (15.4–165.9) | 598 | 50.3 (15.0–168.1) | 0.8201 |
| 12–17 | 162 | 59.4 (15.6–225.7) | 160 | 58.0 (11.5–291.3) | 322 | 58.7 (13.4–257.4) | 0.8052 |
| ≥18 | 152 | 48.9 (15.1–158.5) | 85 | 59.9 (13.7–161.7) | 237 | 52.6 (14.3–193.4) | 0.0243 |
| AST (U/L) | |||||||
| <1 | 18 | 51.6 (13.3–114.9) | 16 | 39.4 (18.3–88.5) | 34 | 45.7 (14.0–95.4) | 0.0180 |
| 1–4 | 156 | 44.8 (20.1–79.4) | 162 | 46.2 (21.2–80.7) | 318 | 45.5 (20.7–80.0) | 0.2745 |
| 5–11 | 283 | 43.1 (20.9–73.4) | 321 | 46.4 (22.8–78.3) | 604 | 44.9 (21.8–76.2) | 0.0029 |
| 12–17 | 165 | 40.7 (16.2–76.4) | 161 | 45.9 (19.8–82.8) | 326 | 43.2 (17.7–80.0) | 0.0009 |
| ≥18 | 155 | 33.1 (12.2–64.0) | 87 | 34.7 (12.7–67.5) | 242 | 33.6 (12.4–65.3) | 0.5586 |
| ALP (IU/L) | |||||||
| <1 | 18 | 305.4 (89.4–650.0) | 16 | 335.5 (90.8–734.5) | 34 | 319.4 (91.6–685.0) | 0.3427 |
| 1–4 | 158 | 290.2 (119.0–563.7) | 163 | 300.1 (106.5–577.8) | 321 | 297.6 (112.7–570.6) | 0.8089 |
| 5–11 | 285 | 235.7 (86.1–458.9) | 322 | 240.2 (107.0–426.6) | 607 | 238.1 (96.6–442.3) | 0.4232 |
| 12–17 | 167 | 222.6 (61.9–482.6) | 162 | 240.3 (89.3–464.4) | 329 | 231.2 (74.2–475.1) | 0.1035 |
| ≥18 | 154 | 125.1 (30.0–285.3) | 89 | 158.3 (35.8–367.9) | 243 | 136.8 (30.5–319.5) | 0.0005 |
| LDH (U/L) | |||||||
| <1 | 18 | 794.1 (123.4–2047.8) | 16 | 829.4 (234.0–1789.4) | 34 | 810.6 (174.1–1913.9) | 0.9313 |
| 1–4 | 151 | 903.0 (314.8–1794.2) | 159 | 946.9 (352.7–1828.6) | 310 | 925.4 (333.9–1812.0) | 0.2646 |
| 5–11 | 279 | 840.1 (316.5–1614.4) | 316 | 819.2 (236.5–1752.7) | 595 | 829.0 (271.3–1690.2) | 0.5434 |
| 12–17 | 166 | 784.7 (208.7–1728.8) | 159 | 860.2 (282.7–1750.8) | 325 | 821.2 (241.8–1744.1) | 0.0207 |
| ≥18 | 153 | 637.9 (156.4–1444.6) | 87 | 714.9 (131.8–1763.4) | 240 | 665.3 (145.0–1563.8) | 0.2412 |
| Creatinine (µmol/L) | |||||||
| <1 | 18 | 31.7 (6.7–75.3) | 18 | 32.8 (17.4–52.9) | 36 | 32.2 (10.8–65.0) | 0.9620 |
| 1–4 | 158 | 32.6 (18.9–50.0) | 162 | 33.3 (18.1–53.0) | 320 | 32.9 (18.5–51.5) | 0.4853 |
| 5–11 | 284 | 31.7 (16.8–51.4) | 320 | 33.4 (17.1–55.2) | 604 | 32.6 (16.9–53.5) | 0.0547 |
| 12–17 | 167 | 35.1 (18.4–62.3) | 168 | 37.8 (16.1–63.1) | 335 | 36.4 (17.2–62.7) | 0.2763 |
| ≥18 | 151 | 48.8 (20.4–75.9) | 87 | 51.3 (23.8–89.0) | 238 | 46.4 (21.1–81.6) | 0.0002 |
Publisher’s Note: MDPI stays neutral with regard to jurisdictional claims in published maps and institutional affiliations. |
© 2022 by the authors. Licensee MDPI, Basel, Switzerland. This article is an open access article distributed under the terms and conditions of the Creative Commons Attribution (CC BY) license (https://creativecommons.org/licenses/by/4.0/).
Share and Cite
Fome, A.D.; Sangeda, R.Z.; Balandya, E.; Mgaya, J.; Soka, D.; Tluway, F.; Masamu, U.; Nkya, S.; Makani, J.; Mmbando, B.P. Hematological and Biochemical Reference Ranges for the Population with Sickle Cell Disease at Steady State in Tanzania. Hemato 2022, 3, 82-97. https://doi.org/10.3390/hemato3010007
Fome AD, Sangeda RZ, Balandya E, Mgaya J, Soka D, Tluway F, Masamu U, Nkya S, Makani J, Mmbando BP. Hematological and Biochemical Reference Ranges for the Population with Sickle Cell Disease at Steady State in Tanzania. Hemato. 2022; 3(1):82-97. https://doi.org/10.3390/hemato3010007
Chicago/Turabian StyleFome, Anna Daniel, Raphael Z. Sangeda, Emmanuel Balandya, Josephine Mgaya, Deogratius Soka, Furahini Tluway, Upendo Masamu, Siana Nkya, Julie Makani, and Bruno P. Mmbando. 2022. "Hematological and Biochemical Reference Ranges for the Population with Sickle Cell Disease at Steady State in Tanzania" Hemato 3, no. 1: 82-97. https://doi.org/10.3390/hemato3010007
APA StyleFome, A. D., Sangeda, R. Z., Balandya, E., Mgaya, J., Soka, D., Tluway, F., Masamu, U., Nkya, S., Makani, J., & Mmbando, B. P. (2022). Hematological and Biochemical Reference Ranges for the Population with Sickle Cell Disease at Steady State in Tanzania. Hemato, 3(1), 82-97. https://doi.org/10.3390/hemato3010007